
Abstract
Customer perceived value (CPV) is a cornerstone of marketing literature. However, myriad studies have generated contradictory empirical findings. In addition, though some existing literature reviews help clarify the conceptual foundations of CPV, the literature lacks a meta-analysis of empirical evidence about the CPV model and its effects. To consolidate existing research, the current meta-analysis assesses the findings of 687 articles, involving 780 independent samples and 357,247 customers. The most integrative CPV model, which includes benefits, sacrifices, and overall value, performs best. Empirical generalizations also reveal the relative weights of various benefits and sacrifices integrated into this CPV model and causal chains between CPV and different outcomes (satisfaction, word-of-mouth, and repurchase intentions). Finally, this analysis uncovers moderating effects of multiple relational contexts: nonprofit/for-profit, public/private, contractual/non-contractual, online/offline, business-to-business/business-to-consumer, and goods/services. For scholars, this article synthesizes existing findings on CPV; for managers, the results provide suggestions for ways to increase CPV.
Keywords
Customer perceived value (CPV) occupies a prominent place in academic research and managerial practice. Defined as a trade-off between the benefits of the offering and the sacrifices perceived by the customer (Dodds, Monroe, and Grewal 1991; Zeithaml 1988), CPV is an essential metric for successful businesses, because it functions to enhance customer satisfaction and loyalty and thus drive long-term profitability (Kumar and Reinartz 2016). As a reflection of this central managerial role, CPV also has become a cornerstone of marketing and service research. Scholars have provided critical insights into its definition (Zeithaml et al. 2020), measurement (Leroi-Werelds et al. 2014), and influence on customer decision-making (Gallarza et al. 2017).
Reviews Dedicated to Customer Perceived Value.
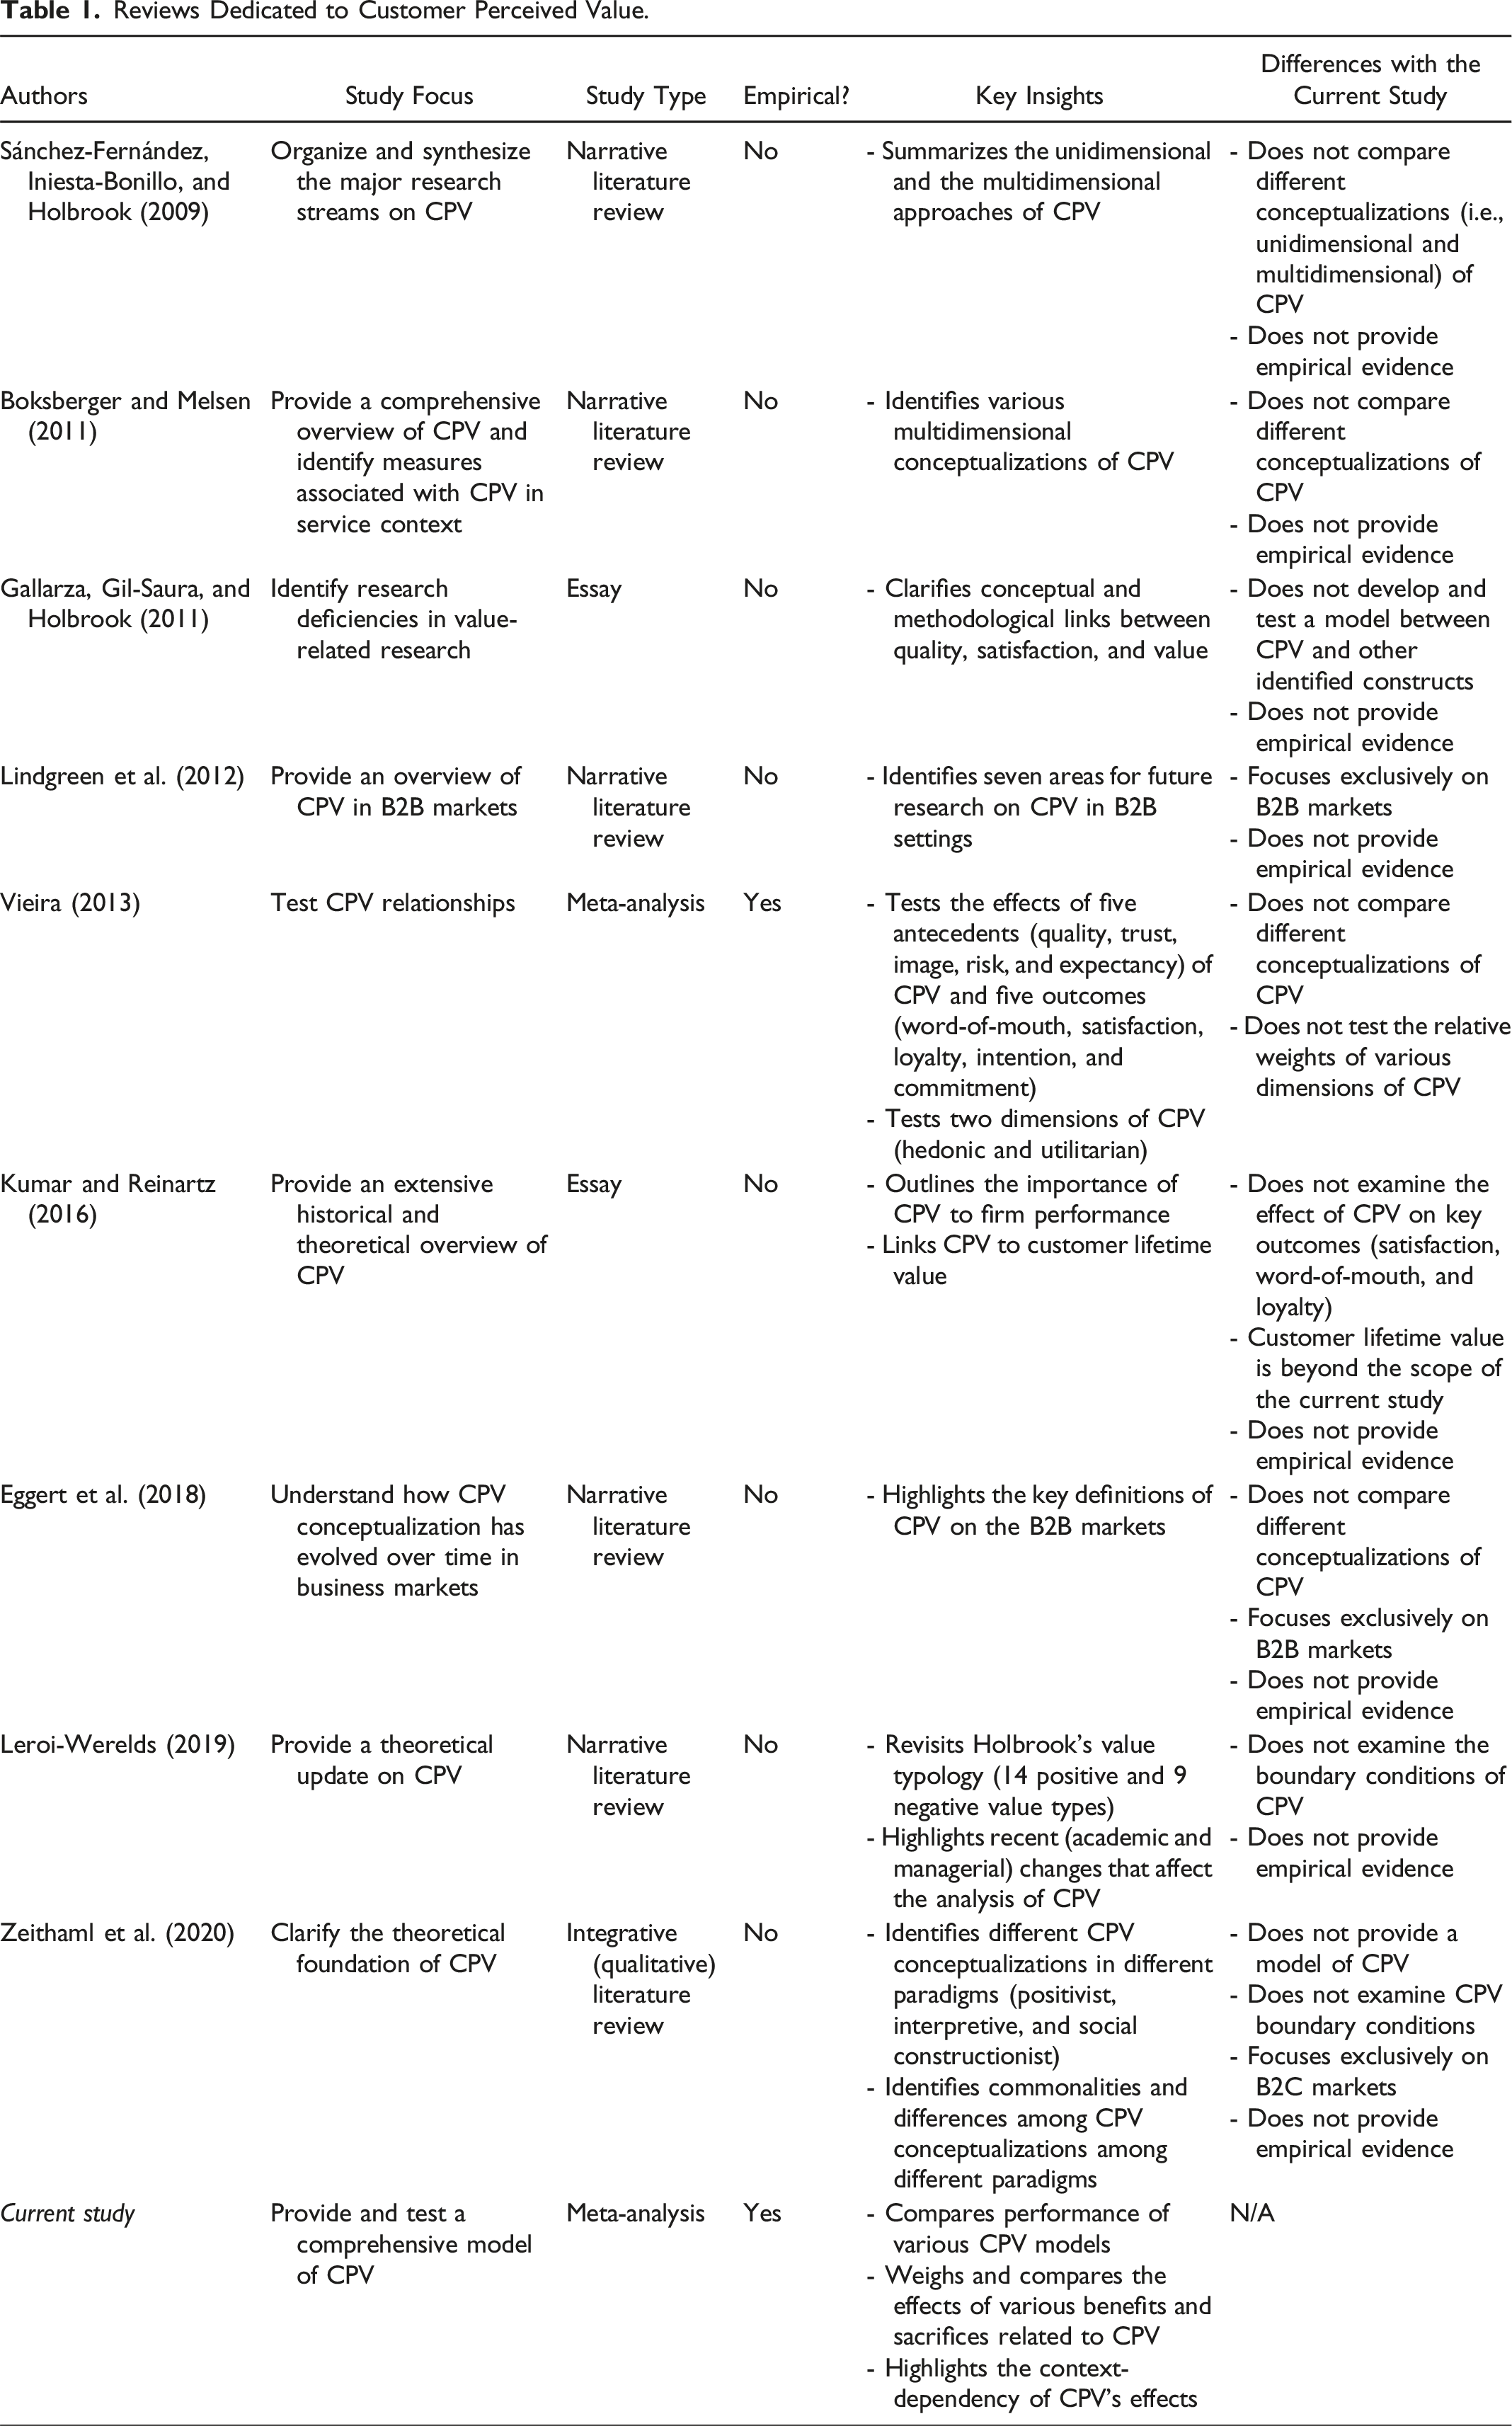
First, prior reviews are mostly conceptual (cf. Vieira 2013), so they cannot provide clear empirical evidence about CPV conceptualizations and their effects. Although Vieira (2013) offers a meta-analysis of CPV, in support of efforts to accumulate knowledge about the topic, that study does not compare different conceptualizations or clarify which CPV conceptualization is the most accurate or predictive. With the current meta-analysis, we therefore seek to establish a quantitative summary of all the collected empirical evidence on CPV across multiple studies and thereby test the theoretical basis of the construct and its underlying predictions (Grewal, Puccinelli, and Monroe 2018).
Second, we find four prominent conceptualizations of CPV in prior literature: (1) a unidimensional perspective focused on overall value, (2) a multidimensional approach centered on benefits, (3) a multidimensional version spanning both benefits and sacrifices, and (4) a combination of uni- and multidimensional elements. Because the operationalizations thus differ across studies, they generate different results that can trigger validity concerns. For example, some studies rely on a two-dimensional model of CPV that emphasizes utilitarian and hedonic value (Babin, Darden, and Griffin 1994), but others propose four- or six-dimensional models (Mathwick, Malhotra, and Rigdon 2001; Sweeney and Soutar 2001). Furthermore, some studies exclusively consider CPV-related benefits (Gallarza et al. 2017), but others include sacrifices (Petrick 2002). Therefore, today’s scholars still face challenges defining CPV and determining which dimensions to include in their models, and managers struggle to find clear guidelines for improving CPV. With our meta-analysis, we attempt to provide such guidance by comparing different models using structural equation modeling (SEM). The results of such comparisons can produce more valid conclusions than individual studies can (Grewal, Puccinelli, and Monroe 2018).
Third, contradictory empirical findings prevent a clear determination of which benefits and sacrifices to include in CPV discussions, much less what their relative weights should be. For example, Williams and Soutar (2009) report a positive effect of emotional value and a nonsignificant effect of social value on behavioral intentions, whereas Kim et al. (2019) highlight a positive effect of hedonic value but a negative effect of social value on loyalty intentions. Such inconsistency further highlights the need for meta-analyses: Because meta-analyses synthesize empirical evidence in a research domain in a way that overcomes the imperfections of individual studies (e.g., measurement errors and sampling bias) and deals with the potential influences of contextual differences, they can reveal the relative importance of benefits and sacrifices in CPV models (Hunter and Schmidt 2004).
Fourth, CPV is often depicted as highly contextual (Holbrook 1999), such that both the value and its outcomes (e.g., satisfaction, word-of-mouth [WOM], and repurchase intention) likely are influenced by contextual variables (e.g., relational contexts, such as business-to-business [B2B] vs. business-to-consumer [B2C]). However, we lack empirical evidence of such context-dependent effects, such that managers do not have guidance regarding which contextual factors to consider when deciding which benefits to provide and which sacrifices to request of customers. By identifying variance in empirical findings across studies and using moderator analysis to explain it, our meta-analysis promises to determine the generalizability of extant findings and clarify their inconsistencies (Grewal, Puccinelli, and Monroe 2018).
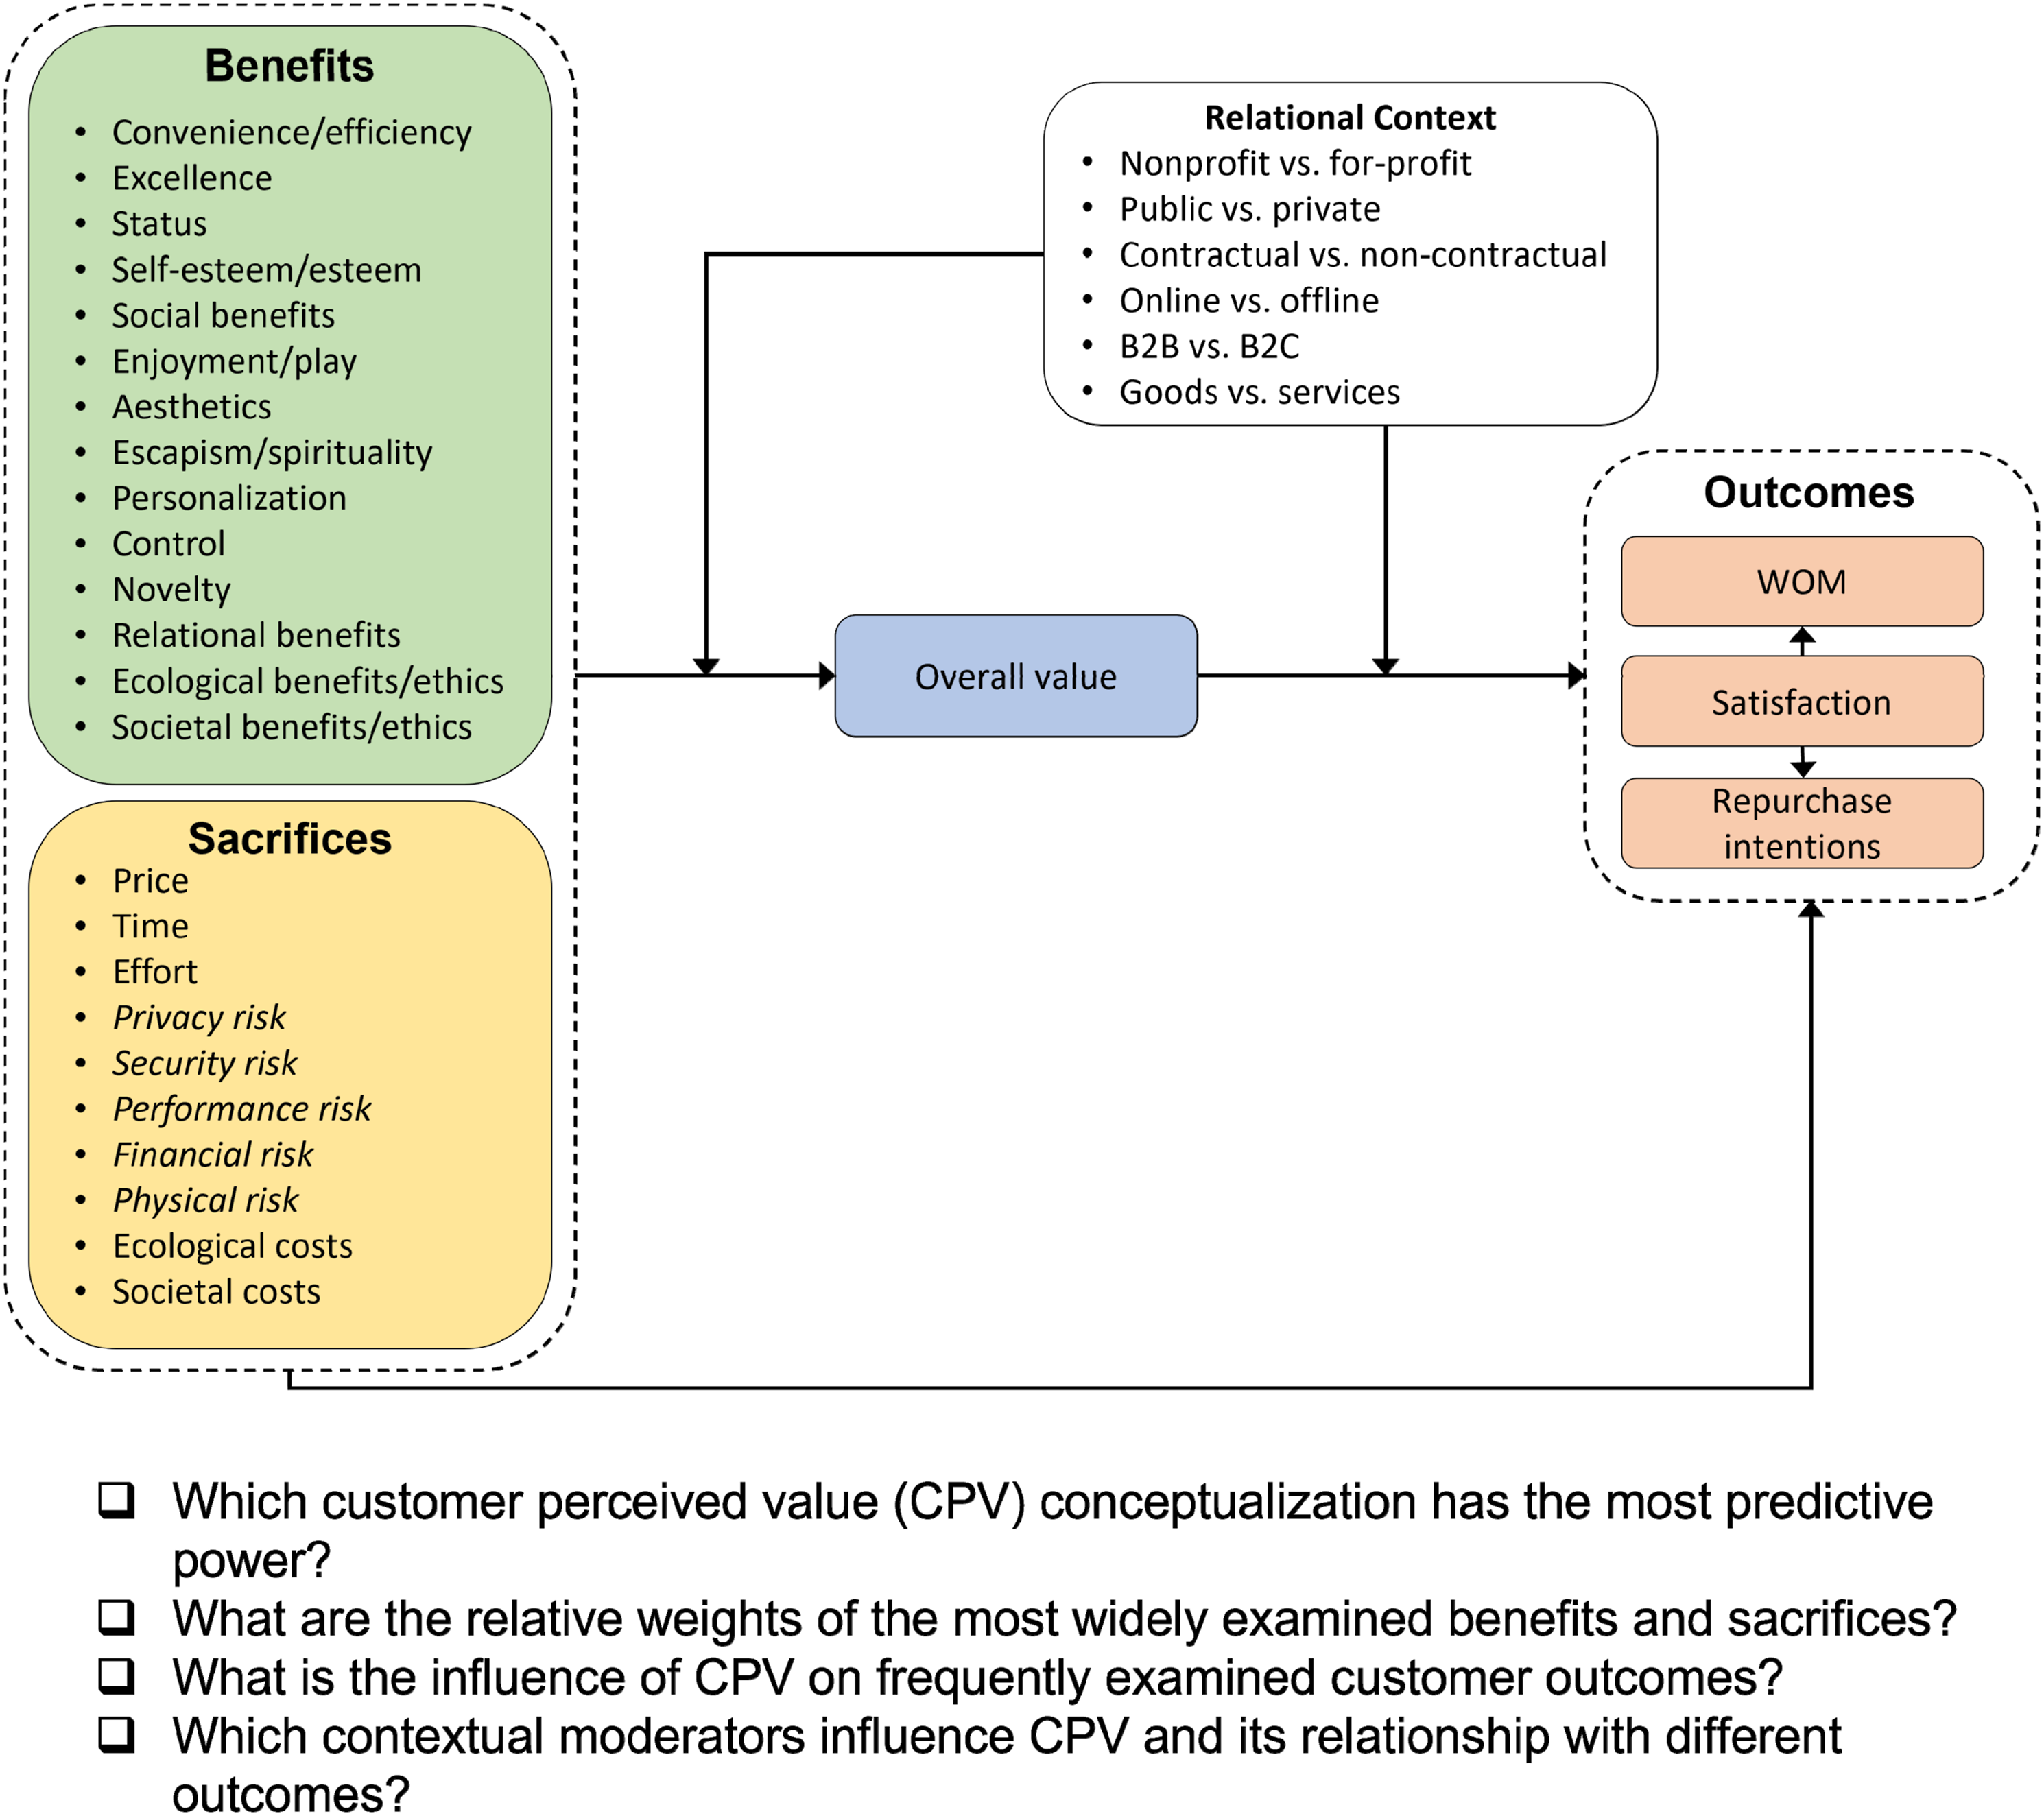
Therefore, to move the CPV field forward, we conduct a meta-analysis that synthesizes the empirical results of 687 articles, which report on 780 samples involving 357,247 customers. With an integrative conceptual framework, we (1) identify which CPV conceptualization has the most predictive power, (2) estimate the relative weights of the most widely examined benefits and sacrifices, (3) assess the influence of CPV on frequently examined customer outcomes (satisfaction, WOM, and repurchase intentions), and (4) highlight key contextual moderators that influence CPV and its relationship with different outcomes. We thus extend prior conceptual literature reviews (Kumar and Reinartz 2016; Eggert et al. 2018; Leroi-Werelds 2019), answer calls to reconceptualize heterogeneous empirical findings (Zeithaml et al. 2020), and support the development of a more unified view on CPV mechanisms.
Literature Review
What Is CPV?
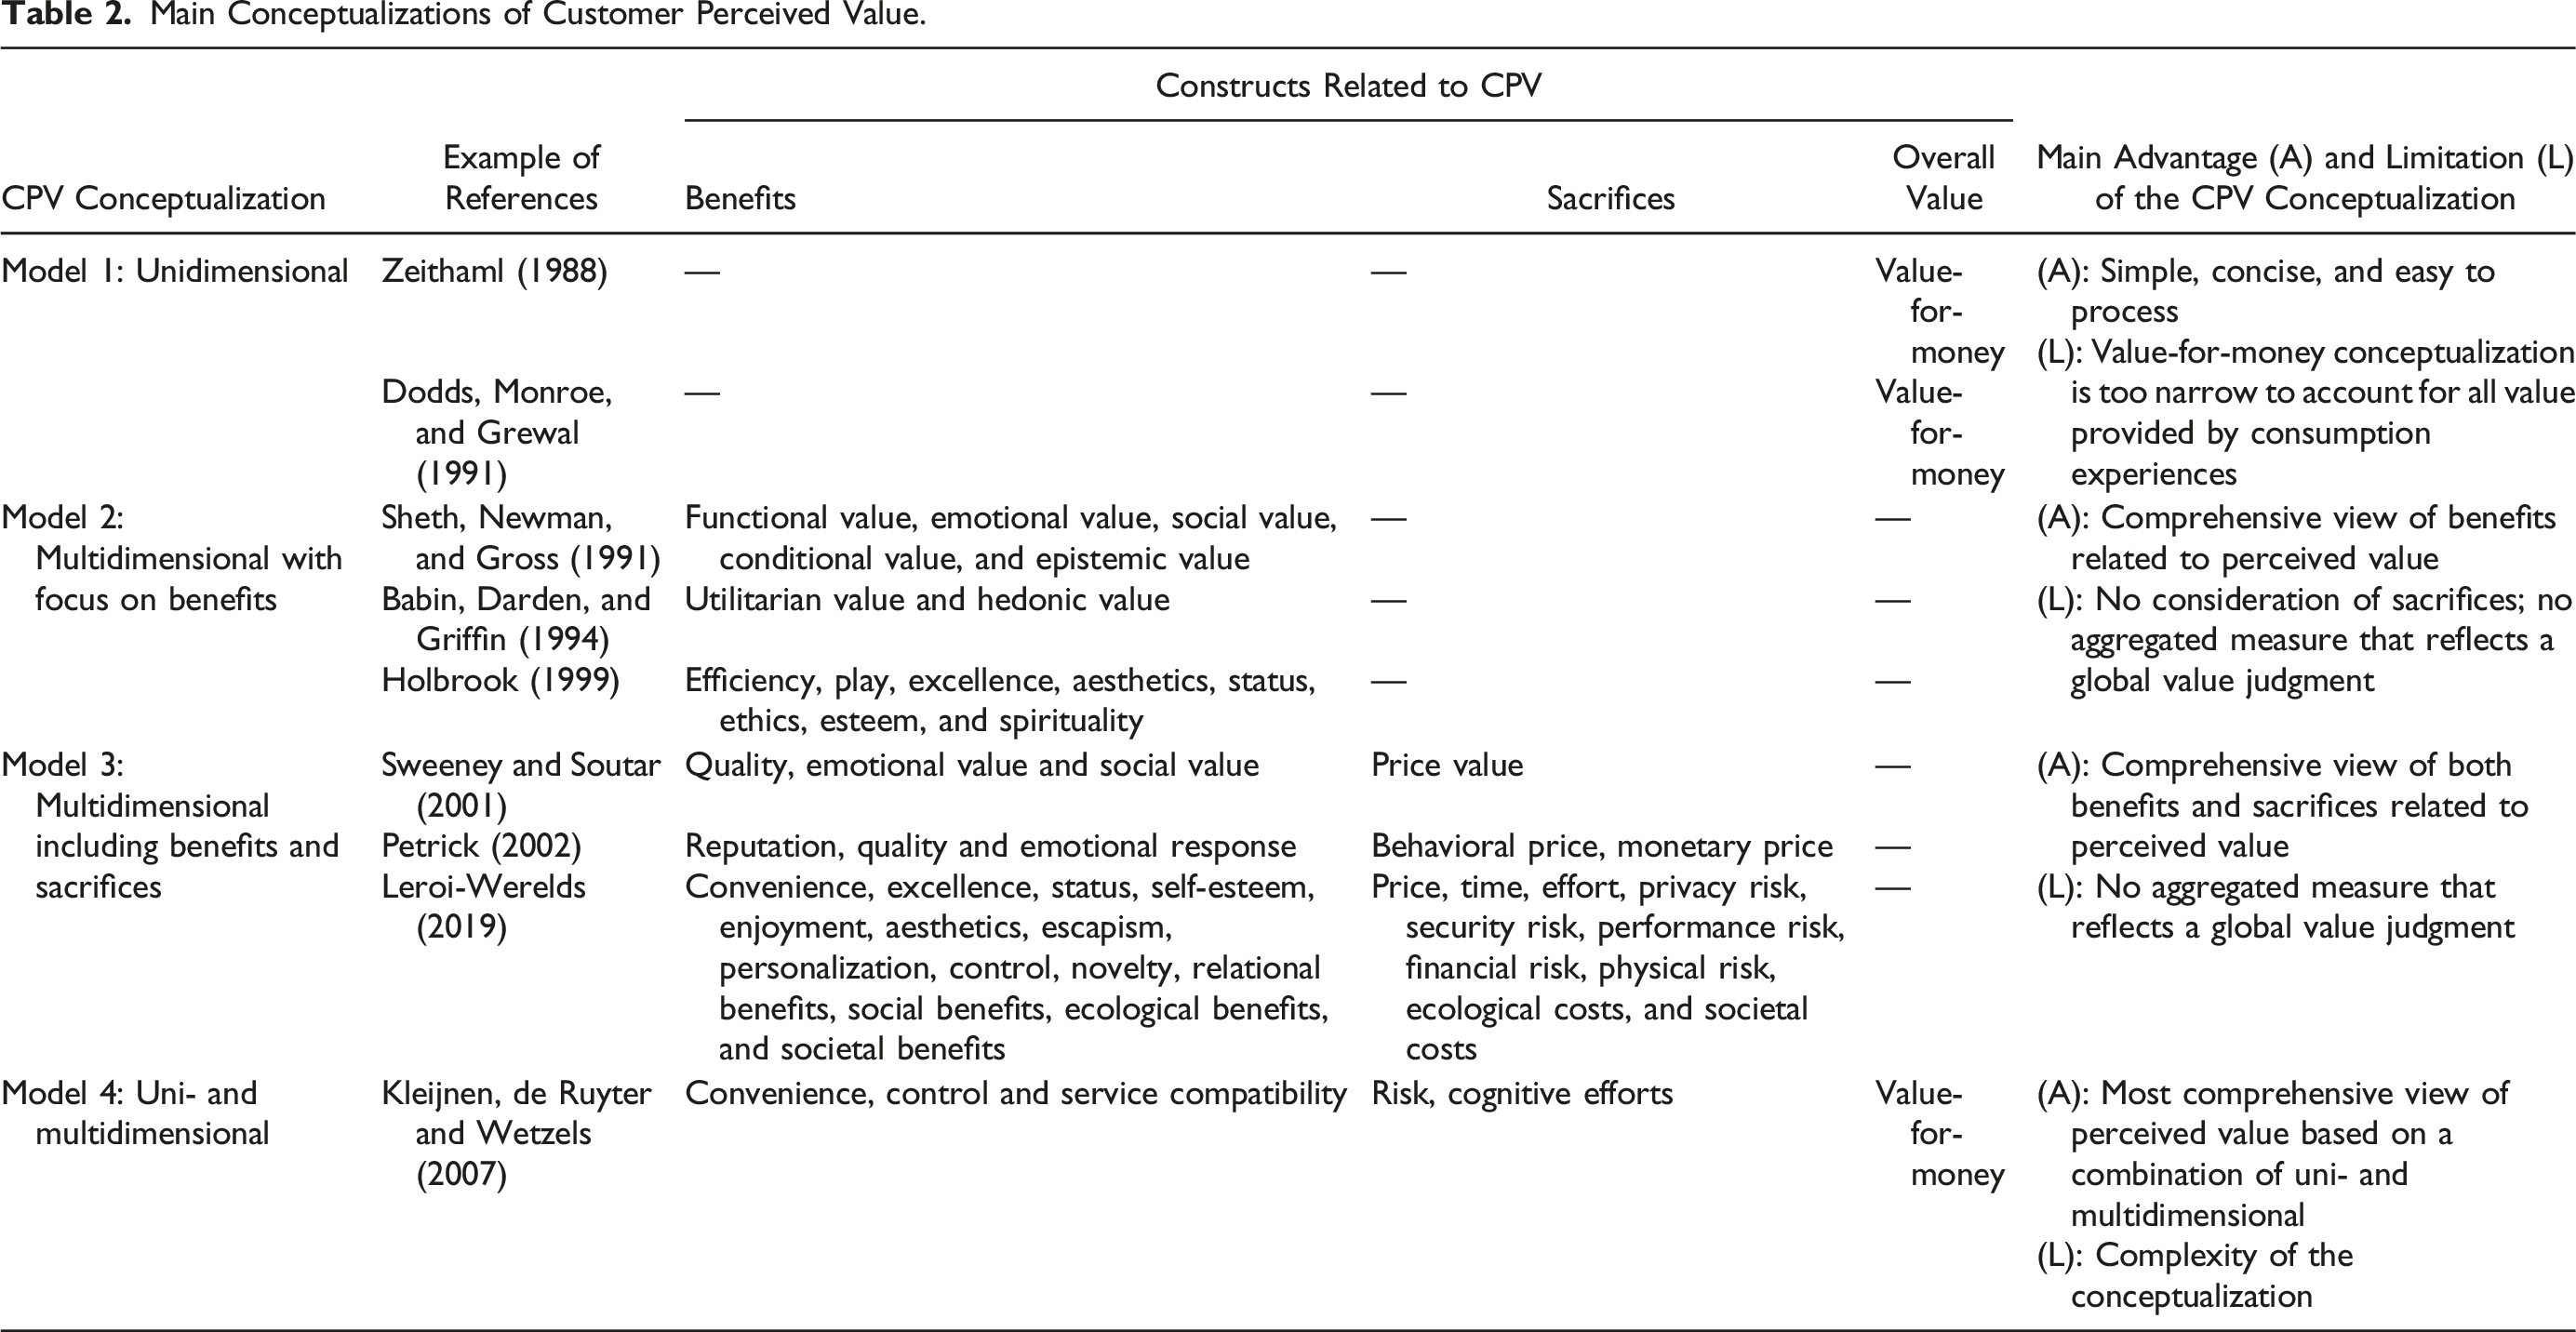
Main Conceptualizations of Customer Perceived Value.
Characteristics of CPV.
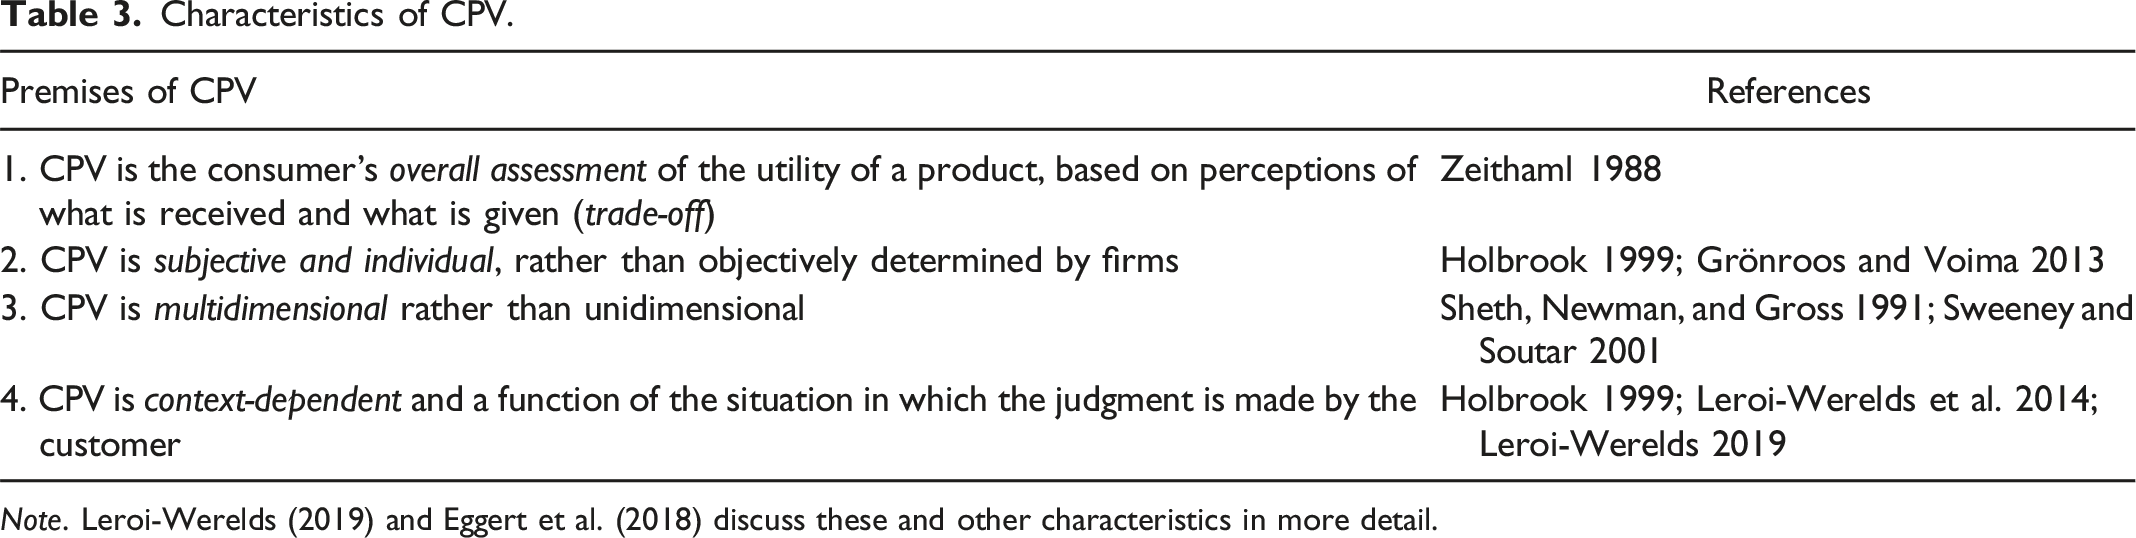
Note. Leroi-Werelds (2019) and Eggert et al. (2018) discuss these and other characteristics in more detail.
How Is CPV Conceptualized in the Literature?
For this discussion, we number the various conceptualizations of CPV that have been developed in marketing literature. Model 1 (Table 2) regards CPV as a unidimensional concept, specifically, as a general evaluation derived from a quality/price ratio, often labeled as “value-for-money” (Dodds, Monroe, and Grewal 1991; Gale 1994; Grewal, Monroe, and Krishnan 1998). This conceptualization has the advantage of simplicity, but it might not account for the theoretical complexity of CPV (Lin, Sher, and Shih 2005).
In response, multidimensional conceptualizations have become more prevalent in marketing literature. An initial multidimensional approach (Model 2) focused on identifying different dimensions or types of perceived value, akin to the benefits in Zeithaml’s (1988) definition. Studies that adopt this perspective move beyond the predominant utilitarian vision of CPV to identify affective and experiential dimensions (Babbin, Darden, and Griffin 1994; Sheth, Newman, and Gross 1991; Sweeney and Soutar 2001). A prominent and comprehensive approach, developed by Holbrook (1999), specifies three dimensions (intrinsic vs. extrinsic, active vs. passive, and self-oriented vs. others-oriented) and identifies eight value types: efficiency, excellence, status, esteem, ethics, play, aesthetics, and spirituality.
Some scholars suggest extending this multidimensional perspective to perceived sacrifices (Model 3), in line with Zeithaml’s (1988) original value definition. Many studies incorporate sacrifices into CPV conceptualization but limit their definition to monetary prices (Kumar and Reinartz 2016). Yet customers frequently bear nonmonetary sacrifices too, such as time, cognitive effort, and various types of risk (Kleijnen, De Ruyter, and Wetzels 2007; Leroi-Werelds 2019). Although efforts to account for such sacrifices better capture the complexity of customers’ value judgments, their consideration of a wide variety of benefits and sacrifices prevents these models from establishing an aggregated measure that reflects a global value judgment (Lin, Sher, and Shih 2005).
Accordingly, another option is to combine uni- and multidimensional conceptualizations (Model 4). Customers perceive both benefits and sacrifices, and they also make trade-off calculations that inform their overall value perceptions (Lin, Sher, and Shih 2005). As informed by several studies (Gallarza et al. 2017; Kleijnen, De Ruyter, and Wetzels 2007; Lin, Sher, and Shih 2005; Ulaga and Eggert 2006), this model incorporates two levels: different benefits and sacrifices that affect overall value and the effects of CPV assessed at an overall value level.
Some empirical studies compare selected CPV models (see Web Appendix A), primarily by addressing psychometric issues (e.g., reflective or formative model and first- or higher-order model). However, they do not offer evidence about which models achieve better predictive power, with the notable exception of Leroi-Werelds et al. (2014). To fill this gap, we turn to a meta-analysis, as an effective method to assess the predictive power of the different models identified.
Conceptual Framework
Building on CPV theory, we propose the model displayed in Figure 1. It builds on Model 4 and includes different benefits and sacrifices that can affect overall value, which in turn determines the different outcomes. First, CPV theory builds on Zeithaml’s (1988) review and is rooted in the positivist tradition (Zeithaml et al. 2020). It predicts that customers evaluate the benefits and sacrifices associated with a product or service to determine its overall value (Zeithaml et al. 2020). The net evaluation, that is, whether the benefits received outweigh the sacrifices made, defines the value that customers perceive (Kumar and Reinartz 2016). Higher overall value leads to increased customer satisfaction, WOM, and repurchase intentions (Vieira 2013). Satisfaction also might drive WOM and repurchase intentions (Keiningham et al. 2018). Although our model includes such effects, we do not propose formal hypotheses about these main effects, which already have received support in previous empirical studies. Conceptual model of customer perceived value.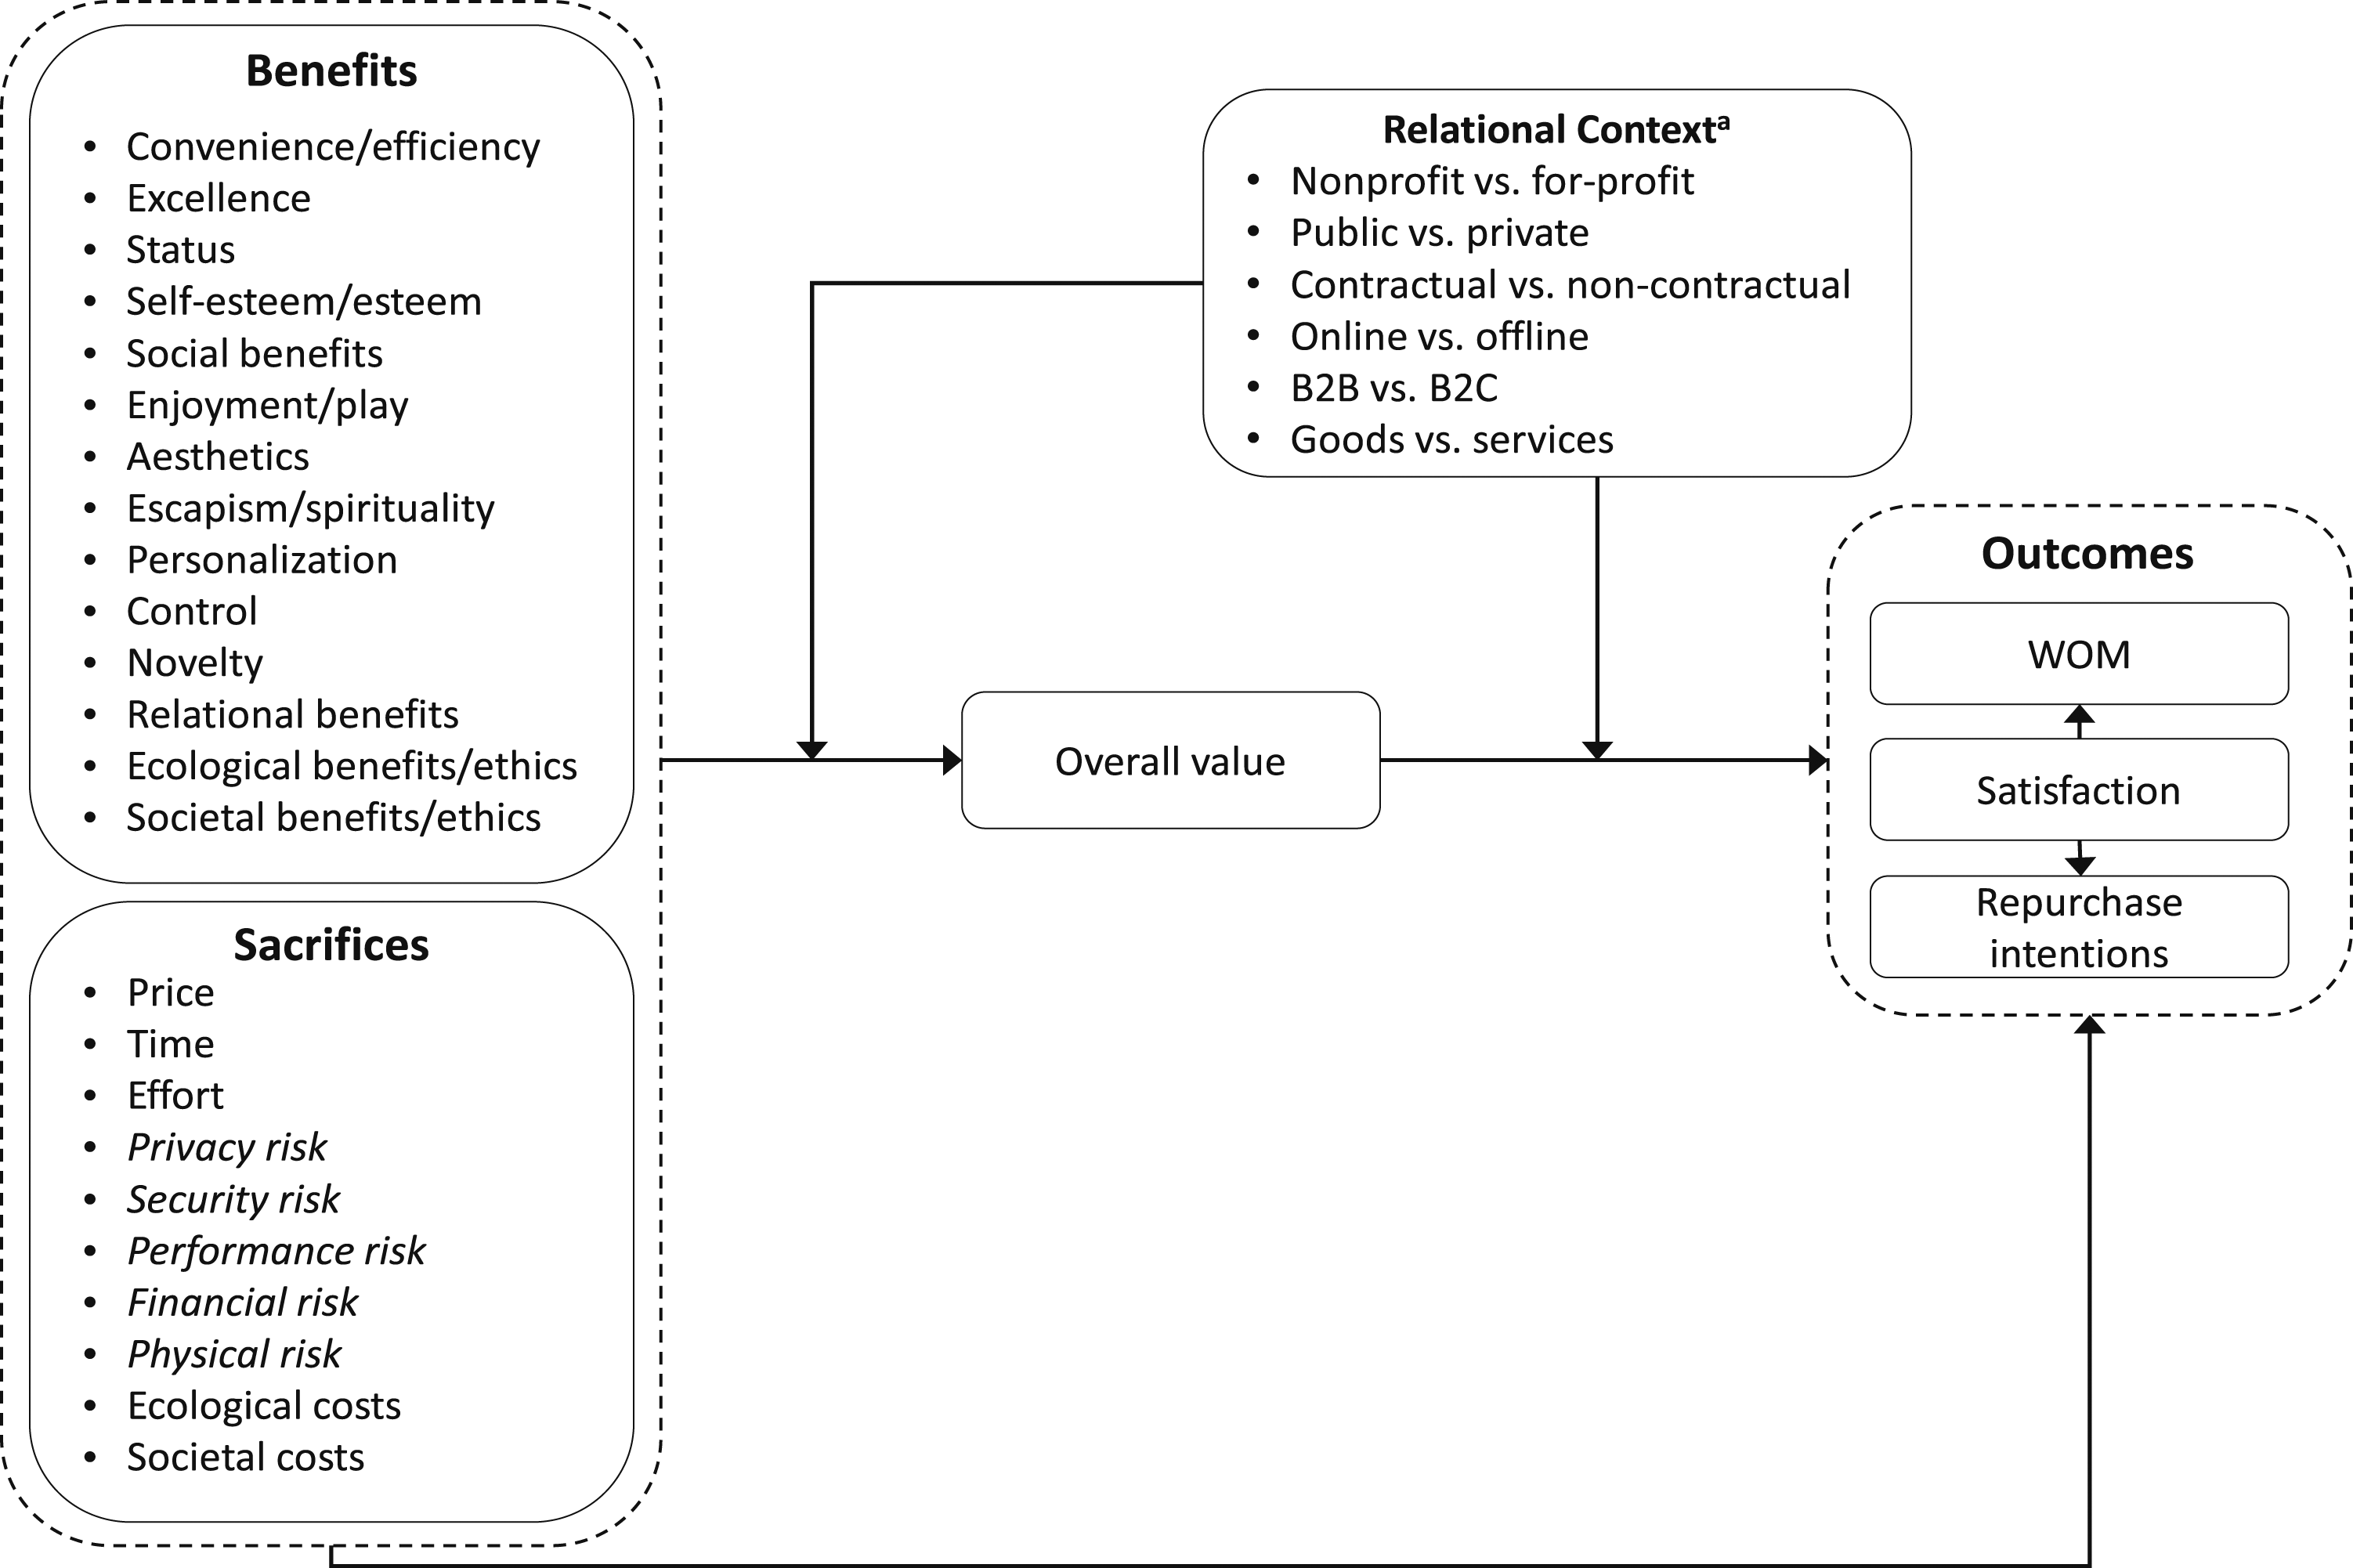
Second, CPV theory emphasizes the contextual nature of the CPV construct (Holbrook 1999; Leroi-Werelds 2019). Customer expectations of benefits and sacrifices are subjective and vary in their relevance. Brady and Robertson (1999, p. 472) similarly conclude that “the weight attributed to either the benefit or the sacrifice side of the model appears to vary across individuals and service settings.” Individual customer differences are difficult to test as moderators in a meta-analysis, but with the comprehensive database we gather for our meta-analysis, we can assess the effects of CPV across various relational contexts. We define a relational context specifically, as distinctive from other different contextual factors that previous studies have investigated as influencing CPV. For example, the CPV and customer experiences likely differ for nonprofit organizations (vs. for-profit organizations), in public (vs. private) contexts, in contractual (vs. non-contractual) contexts, in online (vs. offline contexts), in B2B (vs. B2C contexts), and for goods (vs. services). Furthermore, we control for the influence of other, largely methodological differences that may influence the relationships in our model (Blut, Wang, and Schoefer 2016).
Conceptualization and Effects of CPV
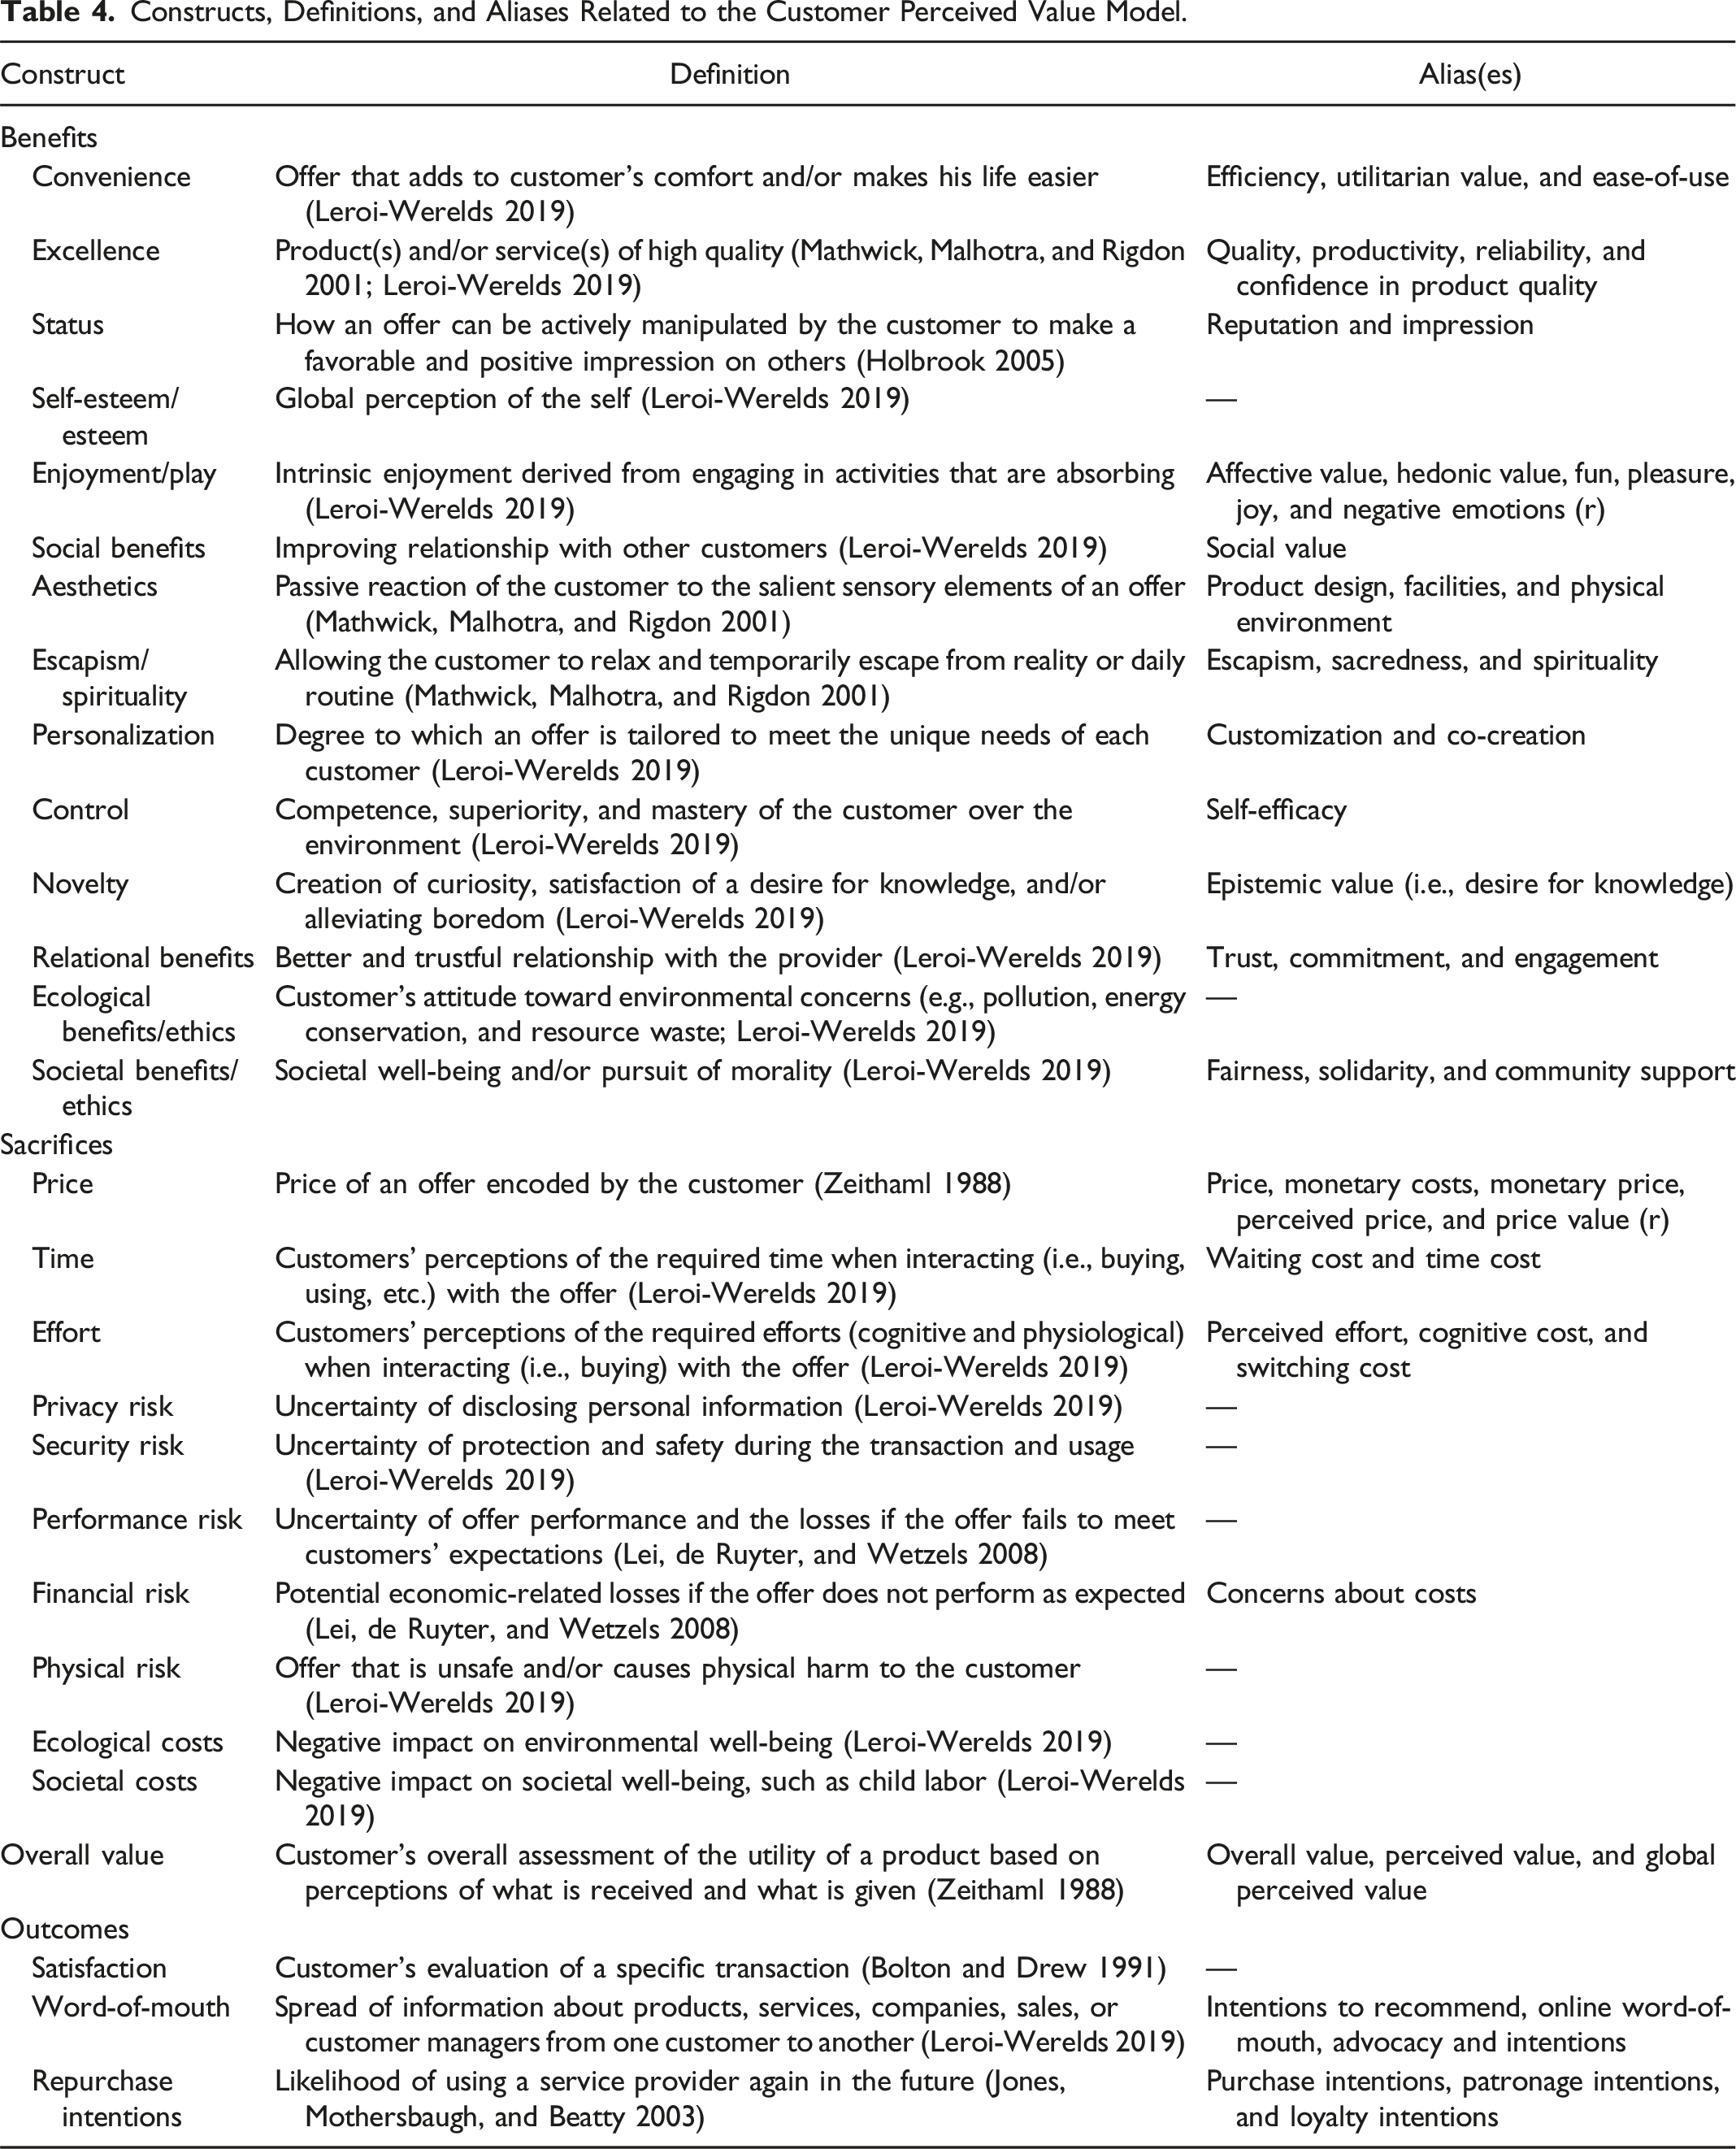
Constructs, Definitions, and Aliases Related to the Customer Perceived Value Model.
In line with CPV theory, we complement this model by integrating overall value. Consistent with influential studies on CPV (Zeithaml 1988; see also Model 4 in Table 2), overall value represents a more abstract construct, distinct from but complementary to benefits and sacrifices. Lin, Sher, and Shih (2005) explain that models without overall value are incomplete, because they cannot truly map the customer “give–get” trade-off experience that defines CPV. According to the principle of maximizing utility, perceived benefits positively influence overall value, whereas perceived sacrifices negatively influence it (Kumar and Reinartz 2016).
Our model also includes three outcomes, reflecting theory that suggests that CPV directly and positively influences outcomes. To ensure sufficient effect sizes, we select the most widely examined outcomes in value literature: satisfaction, WOM, and repurchase intentions (Lin, Sher, and Shih 2005). This selection also reflects the central role of these outcomes in service research. In addition to their direct relationships with overall value, we predict relationships among these outcomes, in that satisfaction positively and directly influences WOM and repurchase intentions (Hutchinson, Lai, and Wang 2009).
Moderating Effects of Relational Context
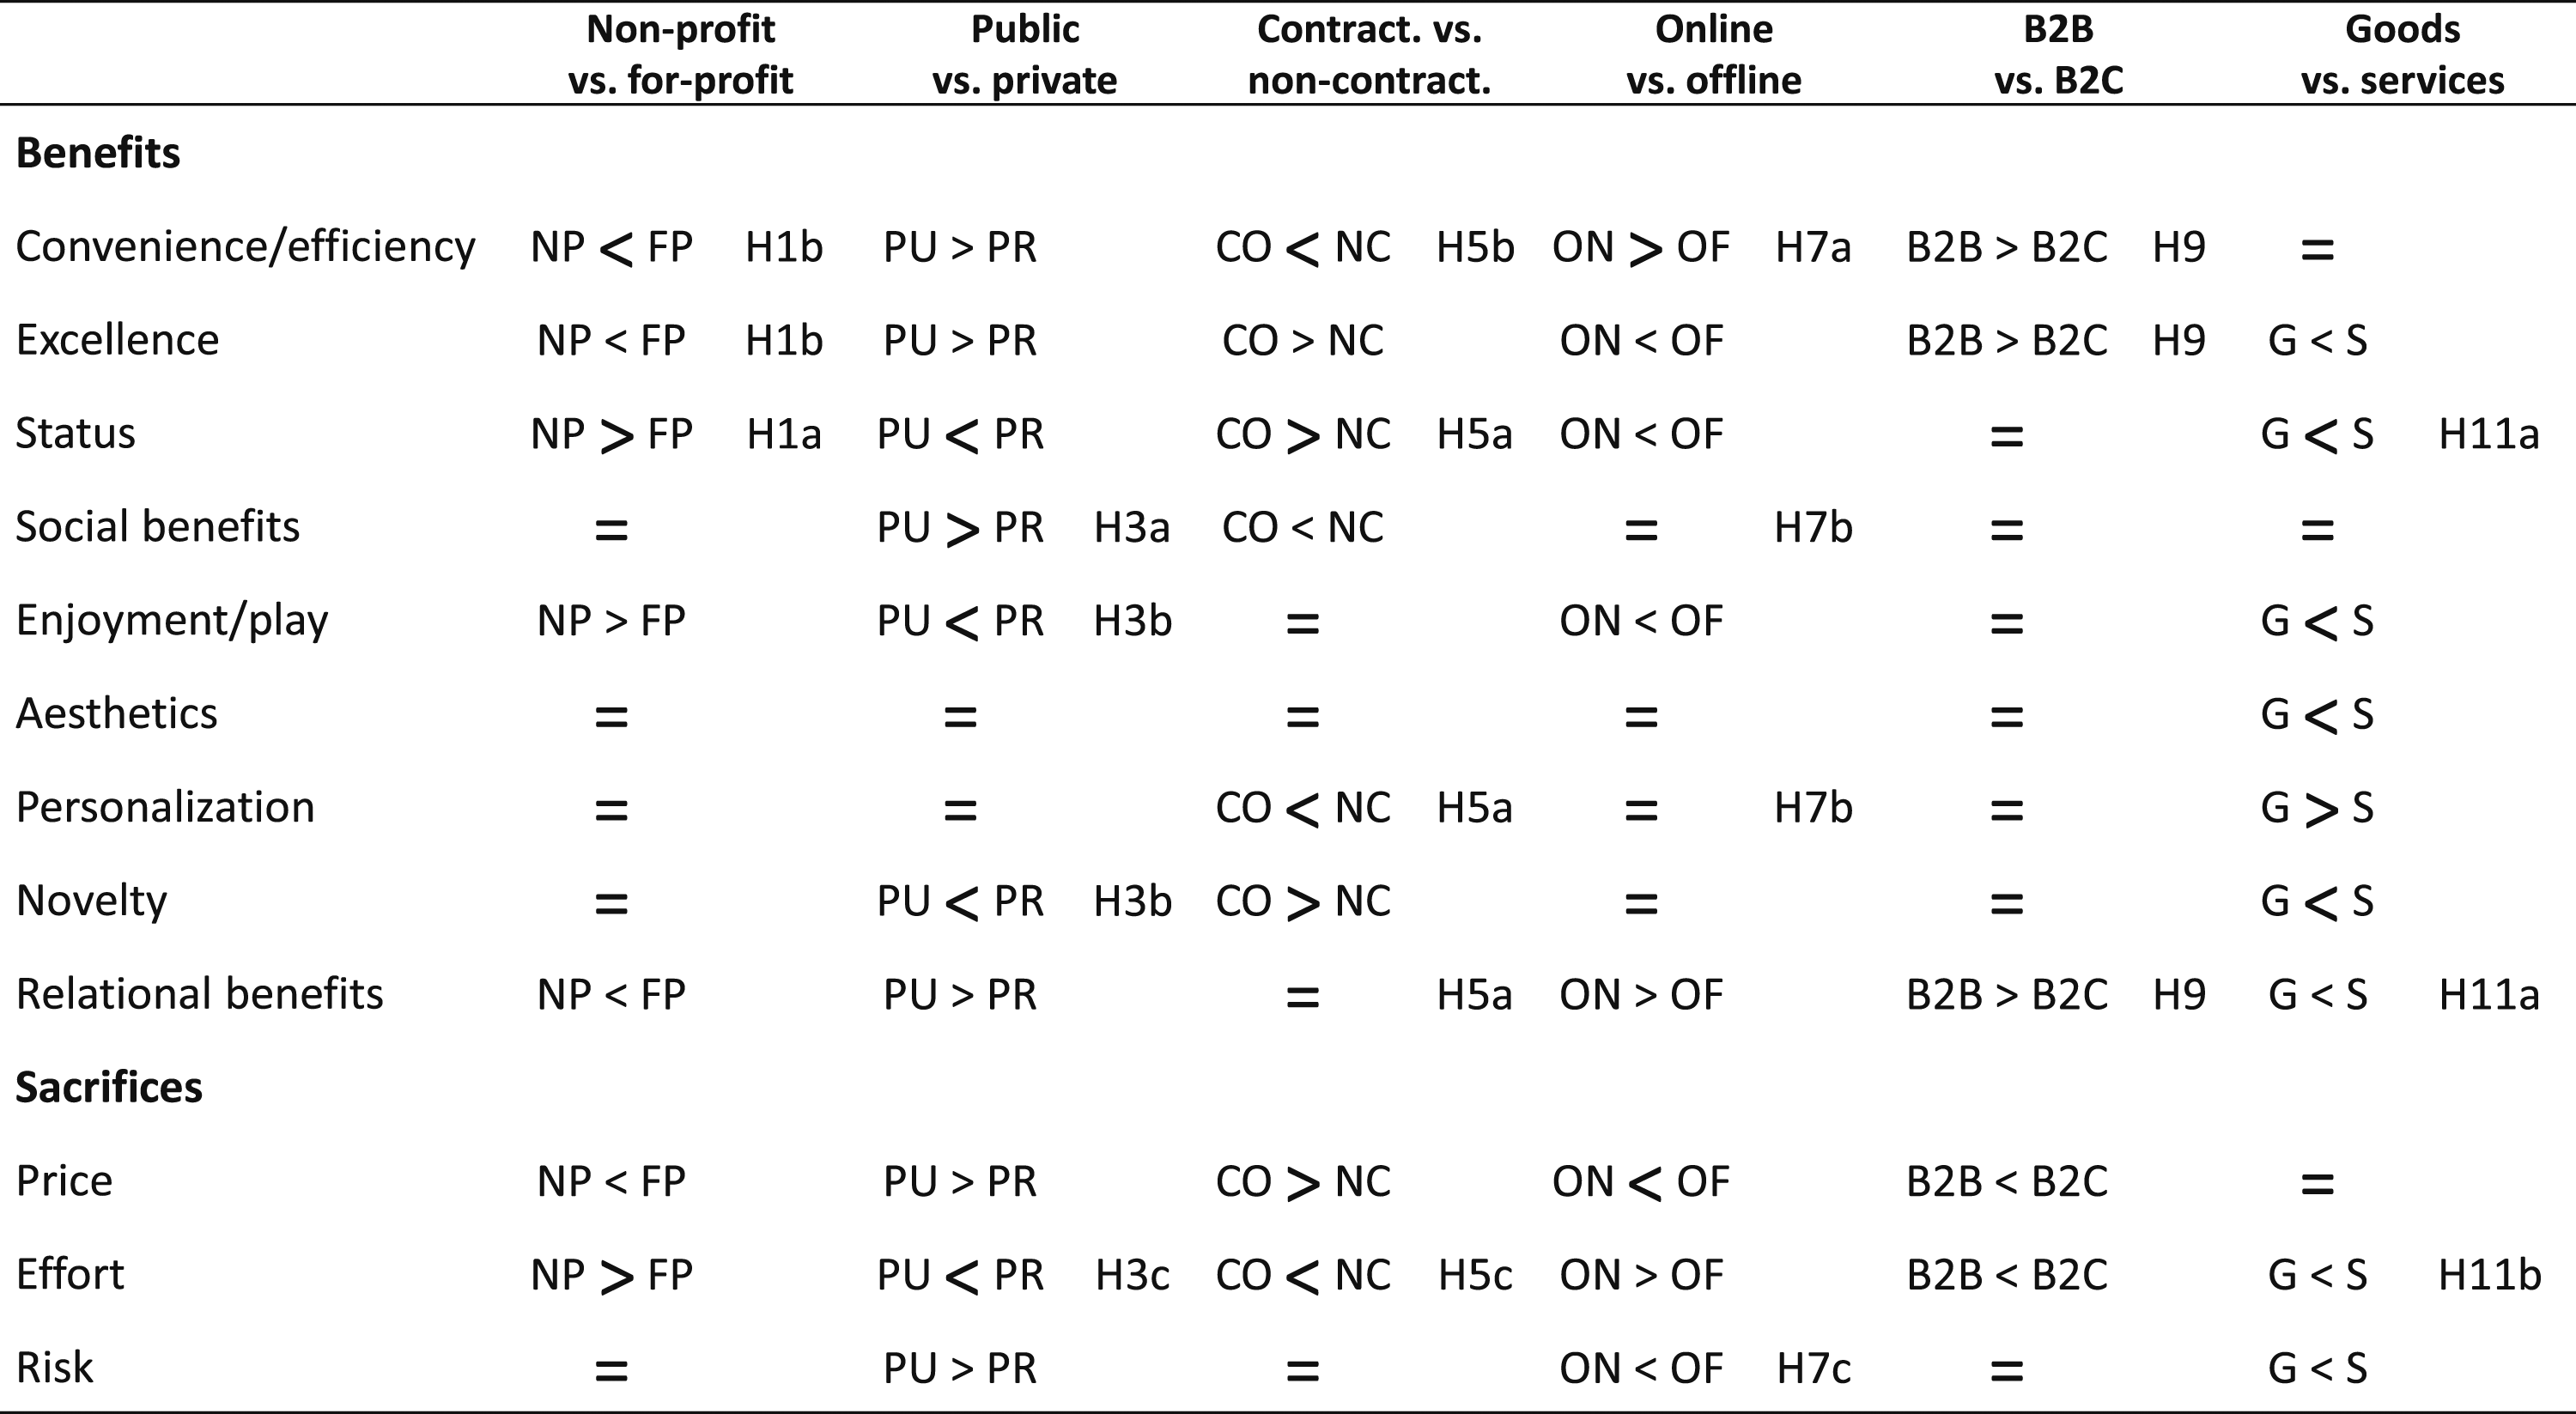
Overview of Hypotheses.
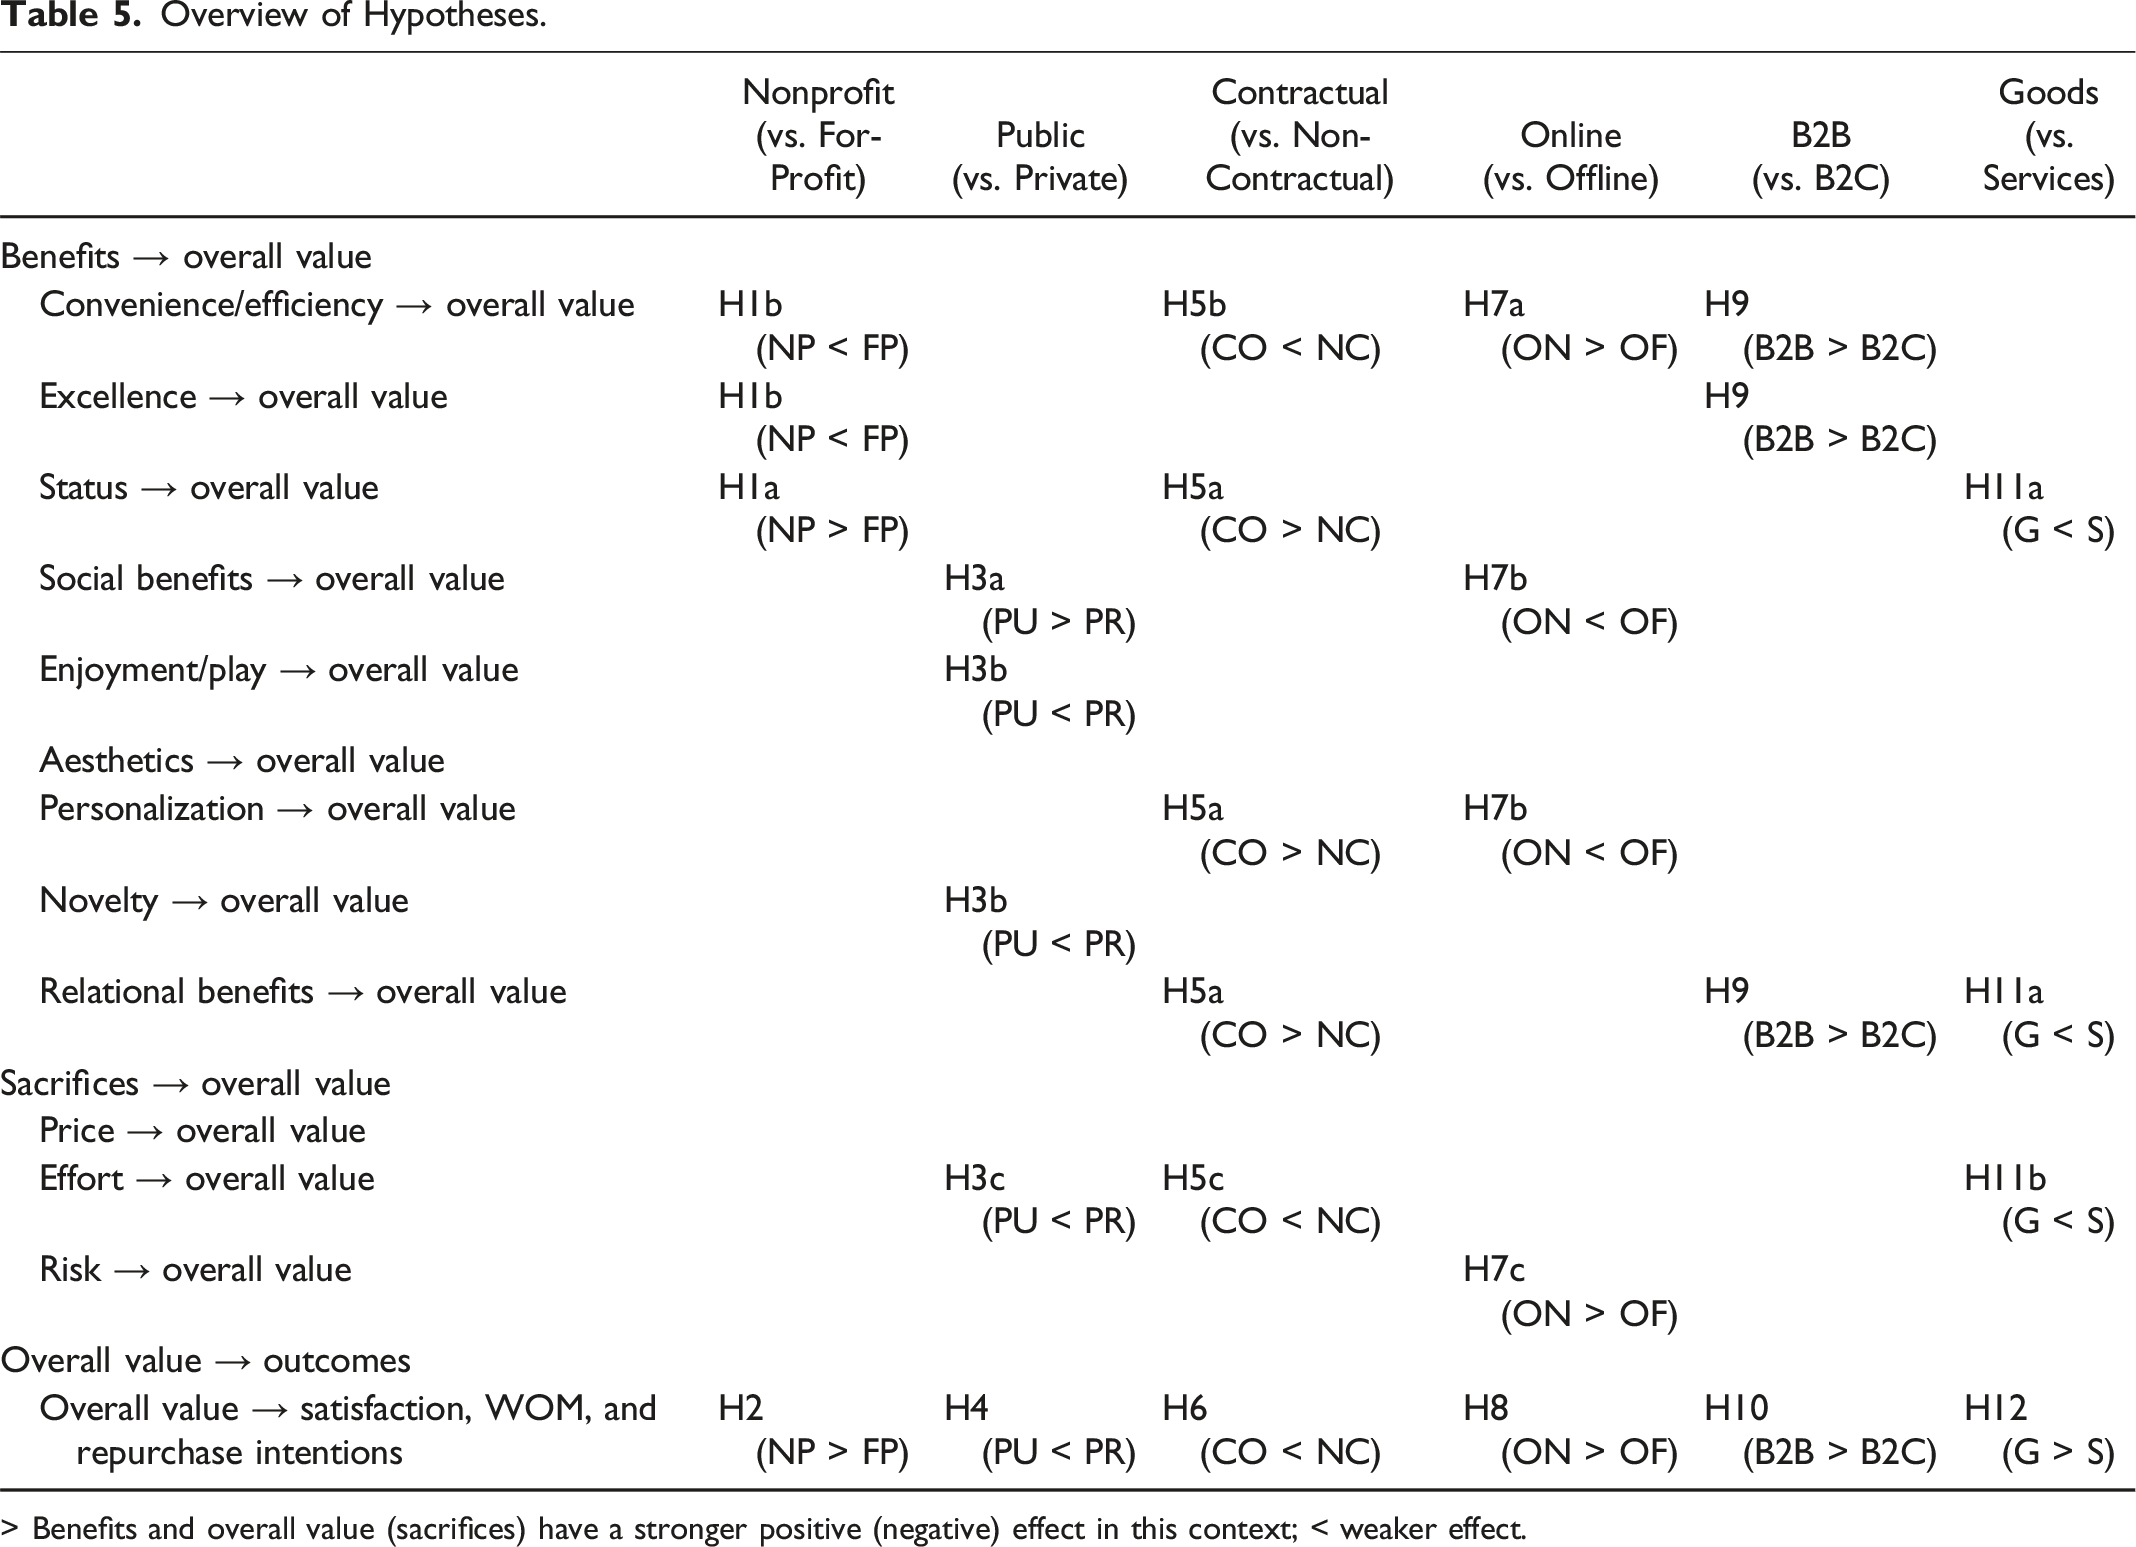
> Benefits and overall value (sacrifices) have a stronger positive (negative) effect in this context; < weaker effect.
Nonprofit vs. For-profit Contexts
Nonprofit organizations operate for collective, public benefits, often by providing charitable offerings; for-profit organizations aim to generate profit with conventional offerings (Hull and Lio 2006; Marwell and McInerney 2005). Consistent with CPV theory, the importance or weight of certain benefits likely varies between these contexts. In particular, nonprofit organizations prioritize interactions with users, based on shared values and prioritization of societal, ethical, or psychological well-being benefits (Marwell and McInerney 2005). Customers often take pride in supporting nonprofit organizations and do so to enhance their social standing (Arnett, German, and Hunt 2003). However, they also anticipate that for-profit organizations provide better service, due to their greater expertise (Hull and Lio 2006). Thus, social rewards that reflect status-related benefits may be more influential in driving overall value in nonprofit organizations, whereas competence-related benefits, such as convenience/efficiency and excellence, may be more relevant in for-profit organizations.
With respect to customer outcomes, CPV theory suggests that the influence of overall value on different outcomes varies across contexts too. Customers likely appreciate the overall value they receive in nonprofit due to the charitable nature of their business mission (Marwell and McInerney 2005). Because they are evaluated more favorably, we expect overall value to have a stronger positive impact on customer outcomes (i.e., satisfaction, WOM, and repurchase intentions) in nonprofit contexts.
Public vs. Private Contexts
Public and private contexts can be considered opposing poles of a continuum, based on the degree to which buying or consuming is witnessed by other customers (Kulviwat, Bruner, and Al-Shuridah 2009). In comparison with private contexts, public contexts—such as sporting events, restaurants, and movie theaters—are characterized by the presence of other customers who can influence interactions with the product or service and thereafter affect customer judgments (Grove and Fiske 1997). Consistent with CPV theory, we posit that the importance of benefits and sacrifices varies between public and private contexts. In a public context, customer choices are influenced by the desire to convey a certain impression or adhere to social norms (Blut, Wang, and Schoefer 2016). Accordingly, in public contexts, social benefits provided by the firm become more relevant for customers, whereas they hold less significance in private contexts, where customers primarily expect enjoyment and novelty from the activity. Thus, they personalize their spaces, select products and services that cater to their specific tastes, and align with their unique preferences. The effort required to consume the offering might be perceived less negatively in a public, compared with a private context, because the presence of other people can generate social motivation, social reinforcement, or positive distraction (Blut, Wang, and Schoefer 2016). Thus, the negative effect of this sacrifice on overall value likely is stronger in private than in public contexts.
Regarding customer outcomes, CPV theory suggests that public versus private contexts can influence customers’ consideration of overall value in their decision-making and judgment. In a public context, customers may feel observed by others and thus find it challenging to appreciate their consumption experience, because they lose some ability to focus on and appreciate the overall value, which also implies weaker effects on outcomes (Grove and Fiske 1997; Stieler, Weismann, and Germelmann 2014). In a private context, such influence does not exist, and customers can focus on and fully appreciate the value they receive. Therefore, the absence of social presence in private contexts should strengthen the positive effects of overall value on various customer outcomes.
Contractual vs. Non-contractual Contexts
Another moderator is the contractual nature of a commercial relationship (Lemon, White, and Winer 2002). This contextual characteristic refers to whether the relationship between customers and the company is governed by a contract (Pick and Eisend 2014). In non-contractual settings, customers can easily switch between businesses, so they likely seek to identify the most convenient offer, a search process that entails significant effort for customers. Consequently, these benefits and sacrifices have more relevance in non-contractual settings. In contrast, the contractual context limits opportunistic customer behavior: Customers cannot change their purchase behavior without informing the company (Lemon, White, and Winer 2002). To offset this lack of flexibility, customers expect some benefits, including relationship and social advantages, such as personalization, relational benefits, and status. In line with CPV theory, these factors should exert a stronger positive effect on overall value in contractual settings.
With respect to customer outcomes, we note that contractual contexts are characterized by switching costs, so the impact of overall value on customer outcomes may be weaker. The contracts create barriers to switching and encourage relationship continuation (Pick and Eisend 2014). However, in non-contractual contexts, overall value is a more crucial evaluation factor, with a stronger potential to affect satisfaction, WOM, and repurchase intentions (Lam et al. 2004). Therefore, in line with CPV theory, we predict:
Online vs. Offline Contexts
The effects of benefits and sacrifices on overall value may differ depending on whether the offering is purchased online or offline (Harris et al. 2006). The Internet can enhance convenience and facilitate customer purchases, but offline settings provide opportunities for face-to-face interactions with other customers or company staff, through which customers can derive social benefits and access personalized information (Laroche et al. 2005). Furthermore, purchasing offline can reduce risk, because customers can more easily assess the offering in person.
Regarding customer outcomes, we anticipate that the effect of overall value on customer outcomes also differs between online and offline contexts. Specifically, customers in online contexts generally sense greater control, due to the availability of goal-oriented attributes like greater product selection, accessibility, convenience, and price comparisons that help them achieve desired results (Harris et al. 2006). Accordingly, online customers also feel more responsible for the success or failure of the transaction, and so they place greater importance on the overall value they receive when assessing their satisfaction and considering their WOM and repurchase intentions.
B2B vs. B2C Contexts
Relative to B2C customers, B2B customers likely possess more expertise and should be guided by more rational criteria (Ulaga and Eggert 2006). According to CPV theory, certain benefits thus may be of greater relevance in B2B contexts, in that the offering itself and the supplier’s capacity to innovate are important to customers, as is customer support, as a means to increase the ease of product/service usage (Pick and Eisend 2014). Thus, excellence and convenience benefits should hold more significance for these business customers. They also likely focus on quality and seek to develop long-term relationships with suppliers (Ulaga and Eggert 2006). Accordingly, relational benefits should drive overall value too.
These rational and relational perspectives suggest that the overall value provided in B2B contexts may carry more weight in determining customer outcomes than it does in B2C contexts (Pick and Eisend 2014; Ulaga and Eggert 2006). Because B2B customers assess their relationship with the supplier carefully, they place greater emphasis on the overall value they receive when determining their satisfaction and intentions to engage in WOM or make repurchases (Ulaga and Eggert 2006).
Goods vs. Services Contexts
Finally, the goods context refers to a model of exchange based on physical products, whereas services entail a model of exchange based on intangible processes (Vargo and Lusch 2004). Product customers receive goods; services customers function as co-producers of value (Vargo and Lusch 2004). Service production and delivery also occur simultaneously, and as Parasuraman, Zeithaml, and Berry (1985) argue, due to this inseparability, customer participation can affect value creation. Customers also can interact with front-line staff and other clients to derive greater relational benefits and status from services rather than from goods. Because of their active role though, services demand greater effort from customers than goods do (Vargo and Lusch 2004). Therefore, we propose:
Turning to customer outcomes, CPV theory suggests that the differences between goods and services influence the importance of overall value for driving customer outcomes. Zeithaml and Bitner (2003, p. 359) argue that “because service customers must participate in service delivery, they frequently blame themselves (at least partially) when things go wrong.” Therefore, both customers’ participation and the variability of service performance can affect the significance of overall value and its impact on outcomes. In turn, the relationship between overall value and customer outcomes should be stronger in goods than in services contexts.
Control Variables
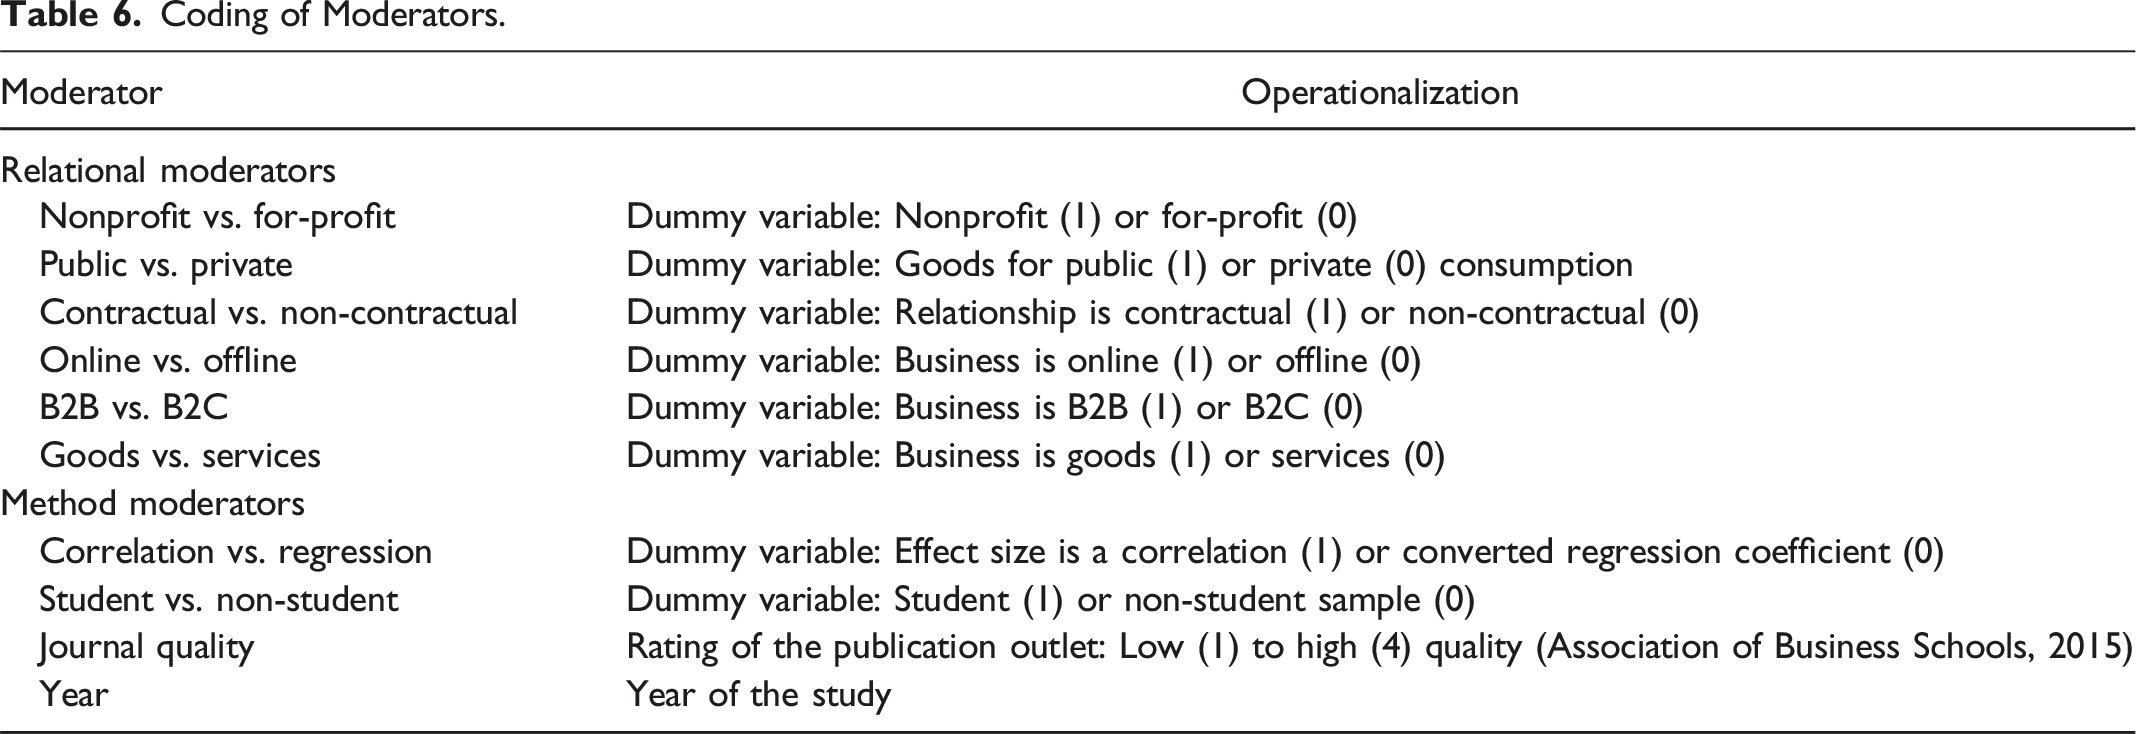
We control for several methodological differences in our meta-analysis, according to journal quality, year of the study, sample composition (student vs. non-student), and the nature of the size effect (correlation vs. converted regression coefficient; Hunter and Schmidt 2004).
Method
Literature Search and Criteria for Inclusion
To compile the database for this meta-analysis, we first applied pertinent keywords, such as “customer perceived value,” “perceived value,” “overall value,” “consumer value,” “customer value,” “functional value,” “emotional value,” “social value,” “price value,” “monetary value,” “experiential value,” “consumption value,” and “shopping value,” to search different electronic databases, including ABI/INFORM, ProQuest, and EBSCO (Business Source Premier). We also searched Google Scholar for unpublished studies, such as working papers and conference papers. Next, we examined the reference lists of the collected studies to identify any missing contributions and citations to key studies. We also reached out to authors to request their correlation matrices and unpublished studies.
When selecting studies for our meta-analysis, we applied two inclusion criteria. First, we sought studies that measured CPV as defined in Table 4 and at least one other construct of the meta-analytic framework. Second, the studies needed to be quantitative and report information that could be transformed into effect sizes to describe the relationship between CPV and other constructs. We excluded qualitative studies and those that did not report on the relevant relationships or effect sizes. Through this search, we identified 687 articles that examined CPV, using 780 independent samples; they reported results involving 357,247 customers. The list of studies is provided in Web Appendix B.
Coding of Studies
Four coders extracted the required information, including the coded effect sizes, sample sizes, reliability, and moderating effects, as well as study characteristics (e.g., context). Following Lipsey and Wilson (2001), we coded effect sizes for the entire data set when feasible. For studies that presented separate subsample or experimental results, we treated each subsample as an independent study. Three coders then classified the effect sizes using the construct definitions in Table 4. Each coder assessed approximately two-thirds of the effect sizes, ensuring that each effect size was independently evaluated at least twice. The agreement rate among the coders was excellent, with a Cohen’s kappa value of 0.91 (>0.81). Any inconsistencies among the three coders were resolved through discussion with a fourth coder. The final sample consists of 5969 correlations.
Coding of Moderators.
Effect Size Integration
The effect size we examine is the correlation coefficient (r), which is a scale-free measure that allows for the integration of various effect sizes and is commonly reported. We also converted other statistical information, such as t-tests, into correlation coefficients. To convert regression weights into correlations, we used Peterson and Brown’s (2005) formula. If any independent sample included multiple correlations for the same relationship, we calculated the average correlation to avoid giving disproportionate weight to that sample.
To integrate the effect sizes across the collected samples, we followed the approach of Hunter and Schmidt (2004) for a random-effects meta-analysis. This approach accounts for measurement reliability and sampling errors. We corrected the correlations for measurement error by dividing each correlation by the square root of the product of the reliabilities of the two constructs involved (Hunter and Schmidt 2004). In addition, we weighted the corrected correlations by the sample size to correct for sampling error. Finally, we calculated the standard errors and 95% confidence intervals for the sample size-weighted and reliability-adjusted correlations (rwc).
We relied on several statistics to assess the practical significance and distribution of the observed correlations. The R2 values for each correlation indicate the proportion of variance explained. The Q-test of homogeneity, a chi-square test, provides an assessment of whether the effect sizes are homogeneous or heterogeneous. A significant Q-test suggests the need for moderator analyses. We calculated credibility intervals to determine the variance in effect sizes; wider intervals indicate greater variability. To evaluate the robustness of the results and the potential for publication bias, we calculated the fail-safe N (FSN), or how many studies with null results would be needed to render a significant correlation nonsignificant (p > .05). Its tolerance can be assessed using the formula 5 × k + 10, where k represents the number of correlations. Furthermore, we examined funnel plots of effect sizes plotted against sample sizes for potential publication bias, particularly if they exhibited asymmetry. The trim-and-fill method helped us detect and adjust for publication bias (Grewal, Puccinelli, and Monroe 2018).
Path Model Estimation
We used SEM to examine the various construct conceptualizations in prior literature (Figure 2). Specifically, we compared a unidimensional conceptualization (Model 1) with a multidimensional approach focused on benefits (Model 2), a multidimensional approach incorporating both benefits and sacrifices (Model 3), and the proposed integrative model with benefits, sacrifices, and overall value (Model 4). For this analysis, we prepared a correlation matrix that encompassed the 12 constructs of the meta-analytic framework (Web Appendix C). We included only those constructs that allowed for the compilation of a complete correlation matrix. Accordingly, we merged the different facets of risk to incorporate them into the analysis. Furthermore, we calculated the harmonic mean of all sample sizes (N = 4,611) and used it, along with the correlation matrix, as input for our analyses in LISREL 9.2. The error variances of the constructs were set to 0, because we already had adjusted the correlations for measurement reliability during the integration of effect sizes. Comparison of different conceptualizations of customer perceived value.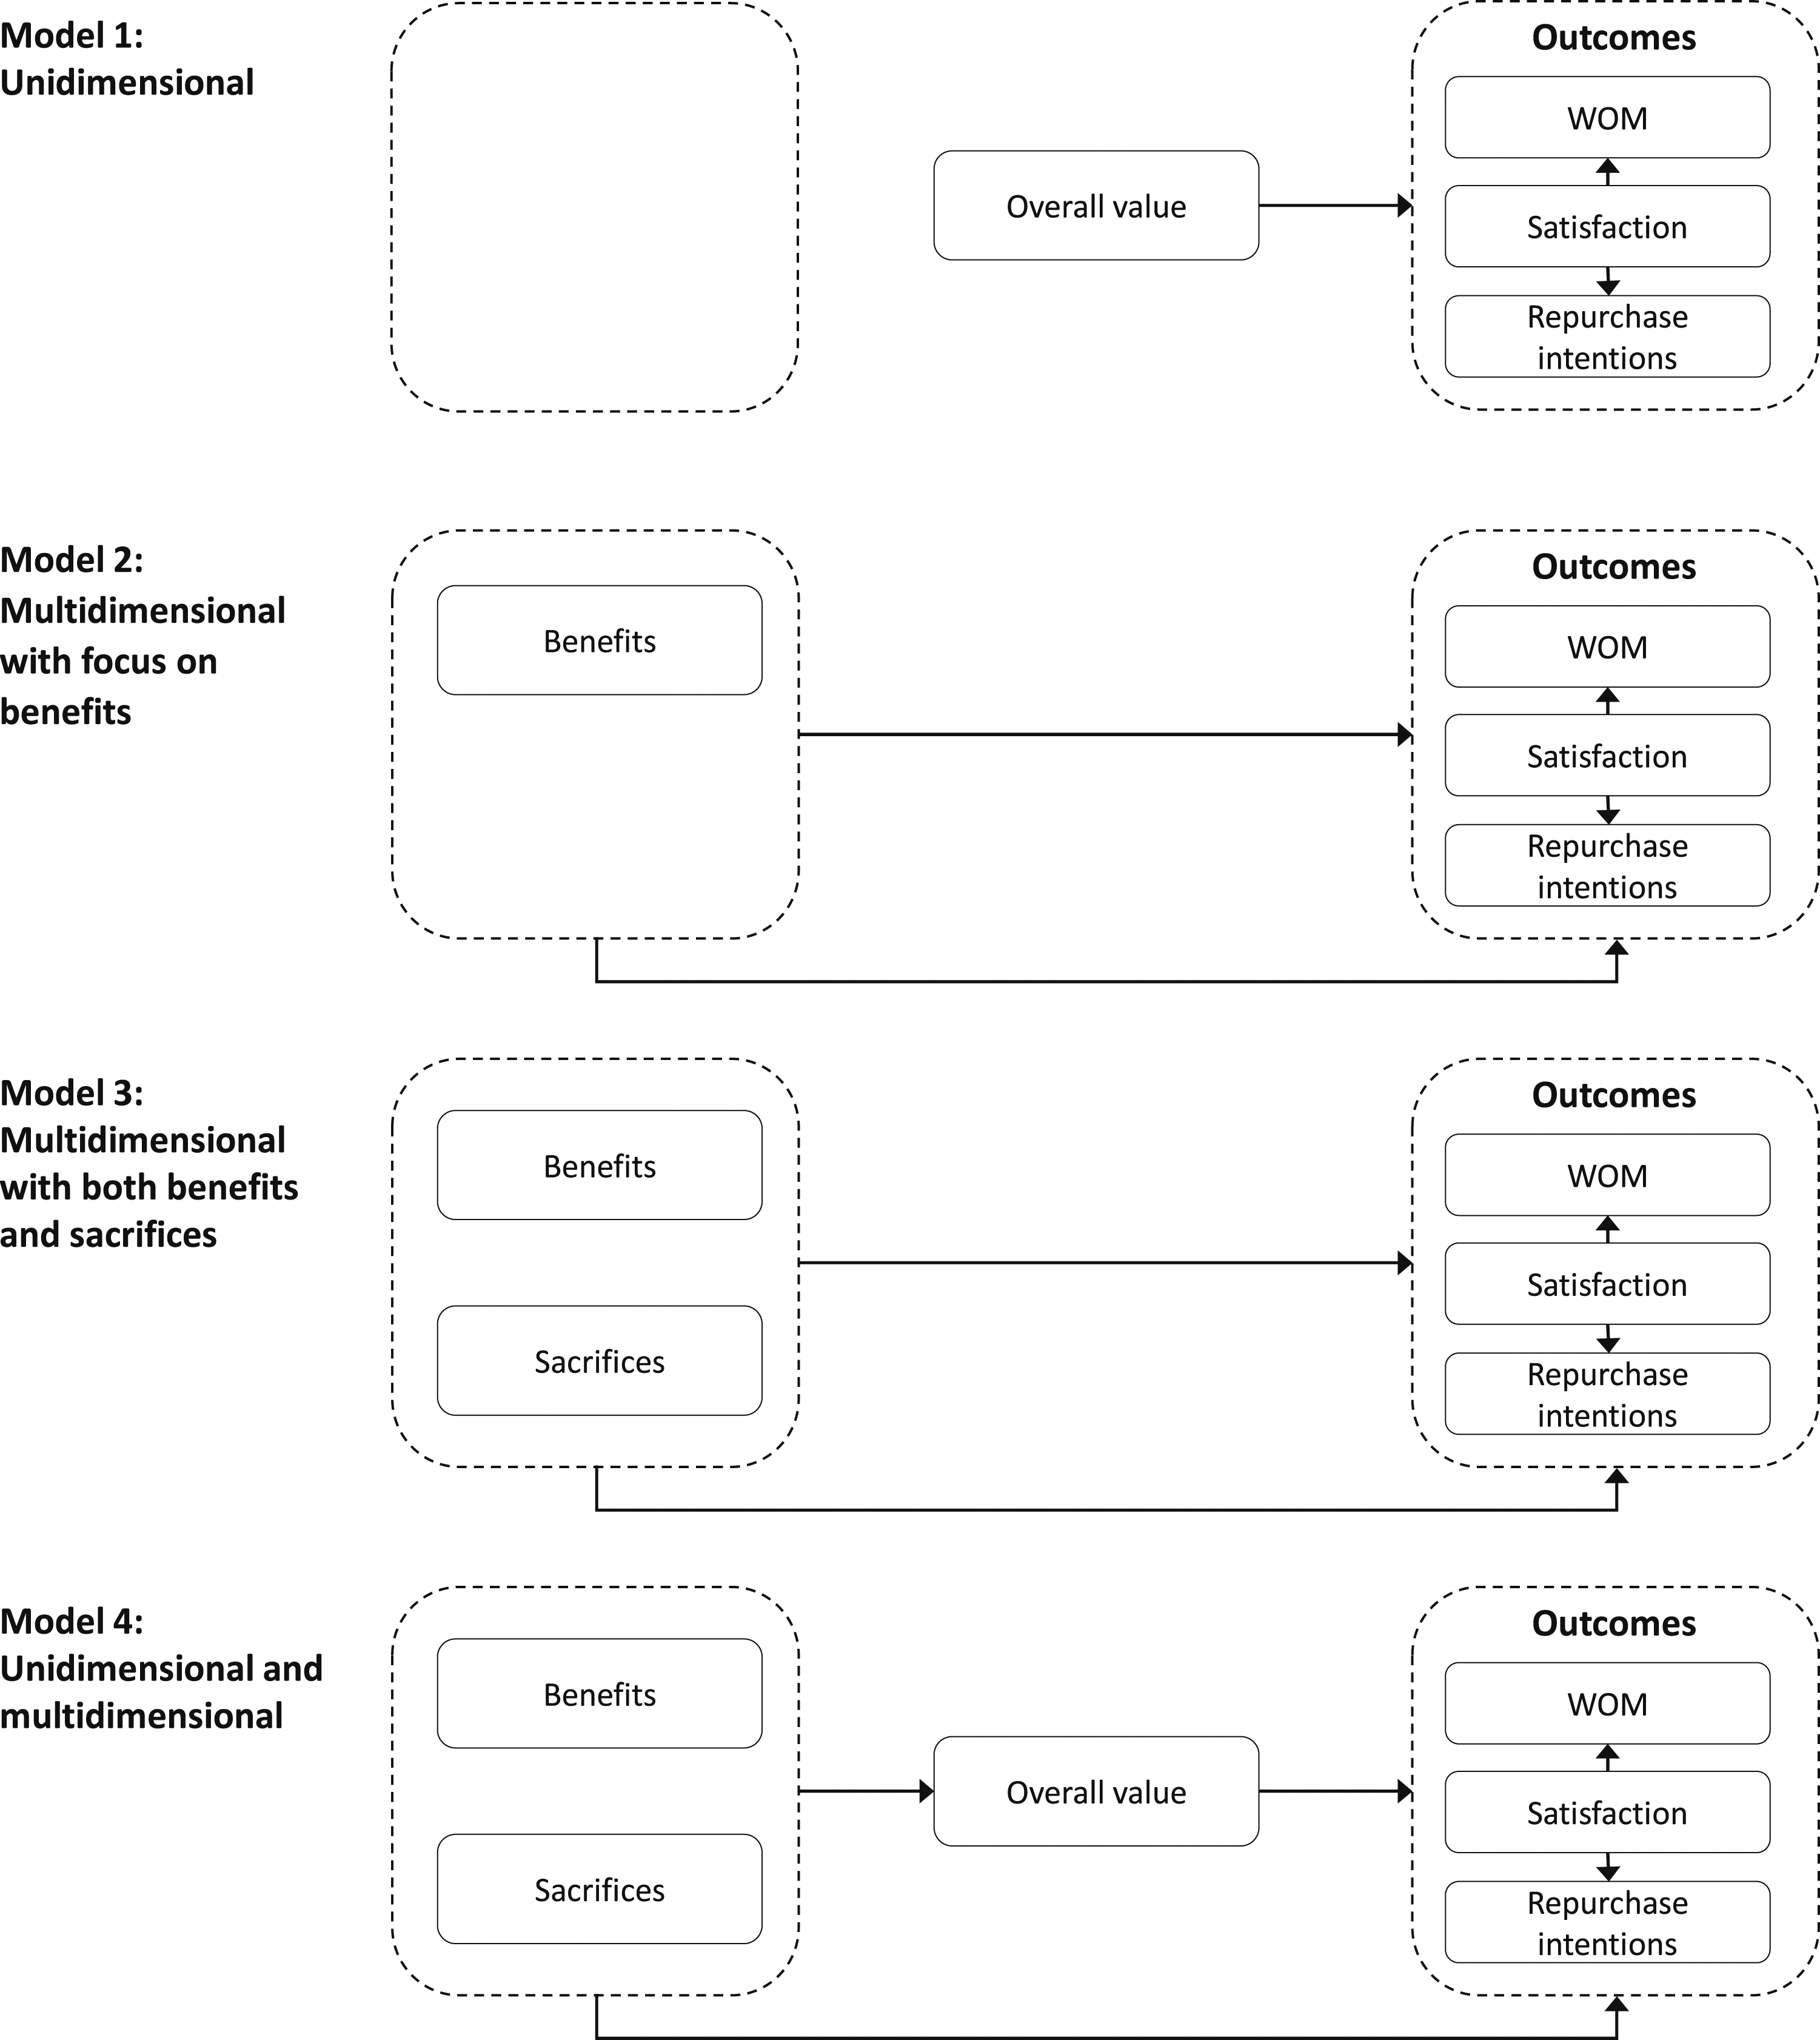
Moderator Analysis
We employed meta-regression (Grewal, Puccinelli, and Monroe 2018) to test the moderators in our meta-analysis. That is, we regressed the effect sizes on various moderator variables. The moderators included the coded relational moderators: nonprofit versus for-profit, public versus private, contractual versus non-contractual, online versus offline, B2B versus B2C, and goods versus services. We also considered the methodological moderators: correlation versus regression, student versus non-student, journal quality, and study year. Thus, we can test the unique impact of each moderator while controlling for the influences of the others. We ran 15 regression models, each corresponding to a relationship with sufficient effect size, to test the moderators for the relationships of benefits/sacrifices with overall value, as well as between overall value and the three outcomes (i.e., satisfaction, WOM, and repurchase intentions). To assess multicollinearity, we calculated variance inflation factors for each regression model.
Results
Relative Weights of Determinants and Effects of Value
Descriptive Results on CPV Model.
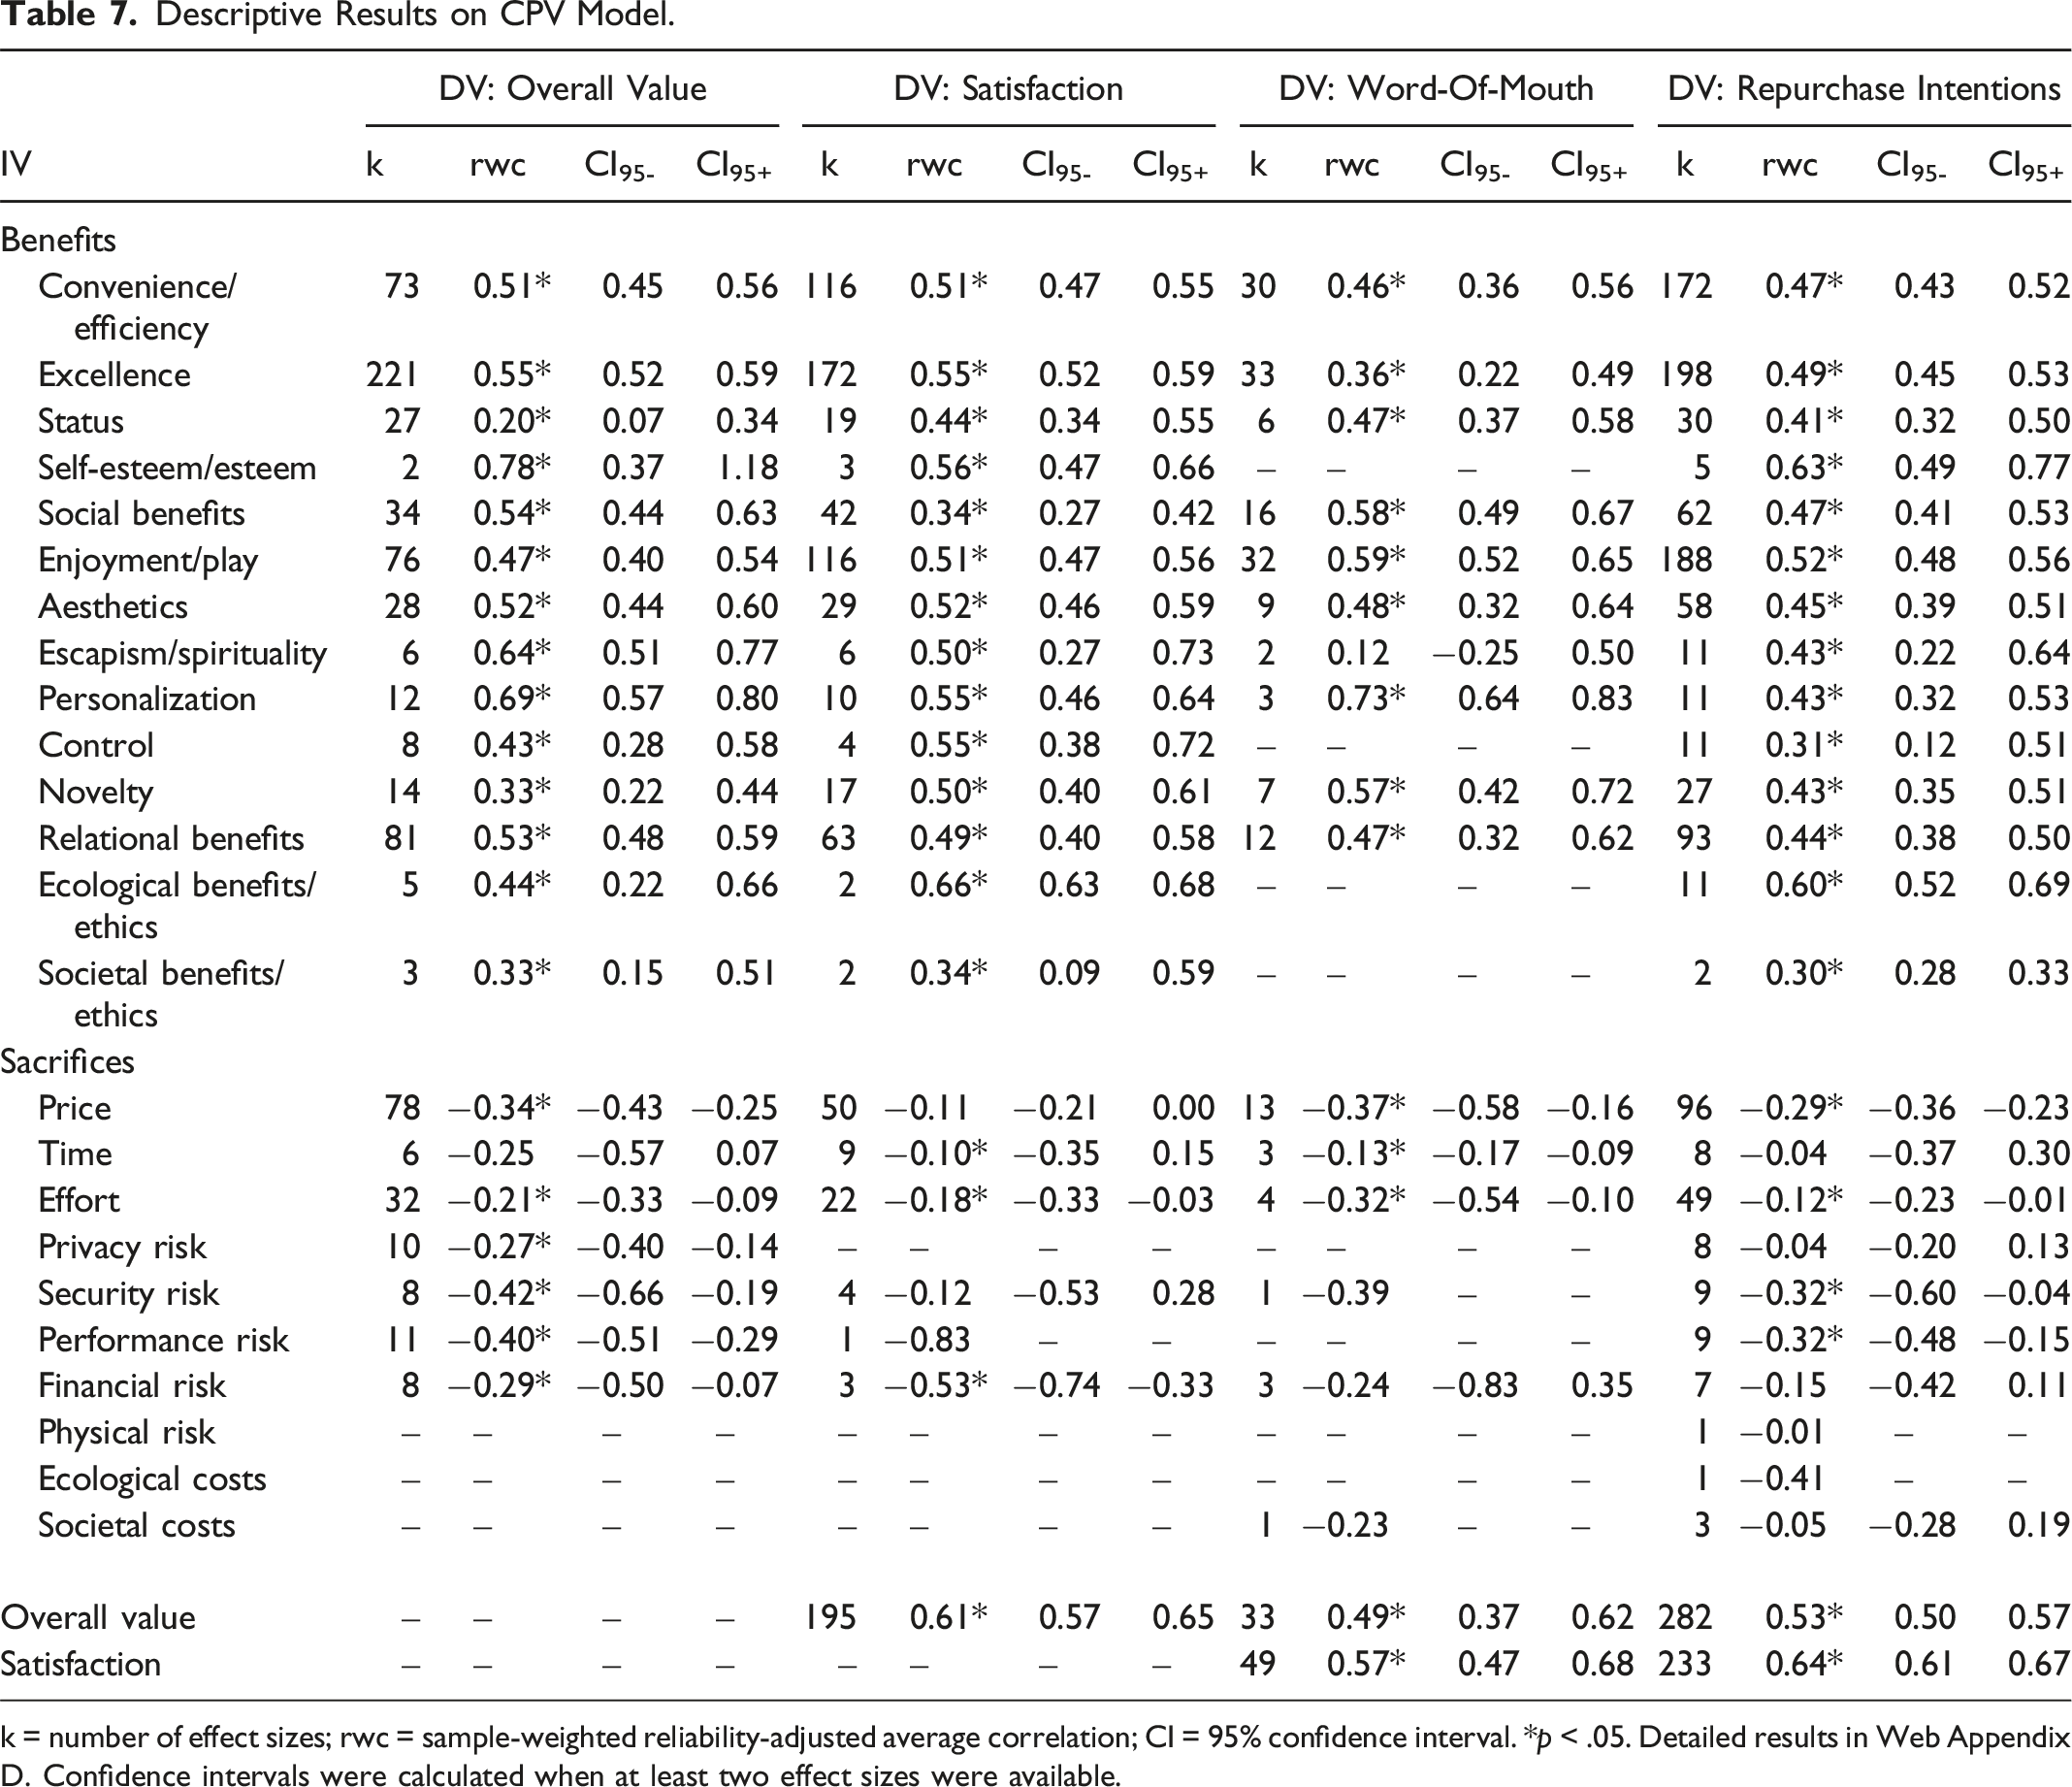
k = number of effect sizes; rwc = sample-weighted reliability-adjusted average correlation; CI = 95% confidence interval. *p < .05. Detailed results in Web Appendix D. Confidence intervals were calculated when at least two effect sizes were available.
As expected, most benefits are positively associated with overall value, as well as satisfaction, WOM, and repurchase intentions (Table 7). The only exception is the effect of escapism/spirituality on WOM, which is not significant. The strength of these effect sizes varies, indicating that some benefits are more influential than others. With regard to overall value, the effect sizes of various benefits range between 0.20 and 0.78; self-esteem/esteem emerges as the most powerful determinant of overall value (rwc = 0.78), whereas status is the weakest (rwc = 0.20). The effect sizes between benefits and satisfaction as an outcome range between 0.34 and 0.66, such that ecological benefits/ethics have the strongest effect sizes (rwc = 0.66), whereas social benefits and societal benefits/ethics exhibit the weakest (rwc = 0.34). In the link between benefits and WOM, effect sizes range from 0.12 to 0.73, revealing that personalization has the strongest effect on WOM (rwc = 0.73), and escapism/spirituality has the weakest effect (rwc = 0.12), which is also nonsignificant. Finally, the effect sizes for repurchase intentions range between 0.30 and 0.63. In this case, self-esteem/esteem has the strongest effect size for repurchase intentions (rwc = 0.63), followed by ecological benefits/ethics (rwc = 0.60), and societal benefits/ethics have the weakest effects (rwc = 0.30). In turn, these varying effect sizes of different benefits produce a range of explained variances (ranging from 1 percent to 61 percent; Web Appendix D).
Turning to sacrifices, we uncover mixed findings. All sacrifices relate negatively to overall value, satisfaction, WOM, and repurchase intentions, but some of the effects are nonsignificant. Hunter and Schmidt (2004) suggest focusing on the strength and direction of effect sizes, rather than their significance level; we report all the results for comprehensiveness though. We calculated confidence intervals if at least two effect sizes were available. The effect sizes of sacrifices generally are weaker than those of benefits, though again, they vary in strength, from −0.42 to −0.21, such that some sacrifices are more influential than others. In detail, security risk appears to be the most powerful determinant of overall value (rwc = −0.42), but effort emerges as the weakest (rwc = −0.21), and time is nonsignificant. Turning to satisfaction outcomes, the effects sizes for sacrifices range between −0.83 and −0.10, dominated by performance risk (rwc = −0.83), whereas time has the weakest effect size (rwc = −0.10). In this case, the effects of price and security risk are nonsignificant. When we consider the effects of sacrifices on WOM, we find a range between −0.39 and −0.13, from security risk with the strongest effect size (rwc = −0.39) to time with the weakest (rwc = −0.13). The effect of financial risk on WOM is nonsignificant. The range of effect sizes of sacrifices on repurchase intentions is between −0.41 and −0.01. Ecological costs display the strongest effects (rwc = −0.41), physical risk has the weakest effect (rwc = −0.01), and time, privacy risk, financial risk, and societal costs are all nonsignificant. The explained variances also vary for the different sacrifices (ranging from 0 percent to 69 percent; Web Appendix D).
In addition, overall value exhibits strong effect sizes for all three outcomes: satisfaction (rwc = 0.61), WOM (rwc = 0.49), and repurchase intentions (rwc = 0.53). Along with the strong direct effects of the different benefits and sacrifices on overall value, this finding indicates partial mediating effects of overall value. We employ SEM to test these effects.
Different CPV Conceptualizations
Results of Structural Equation Modeling.
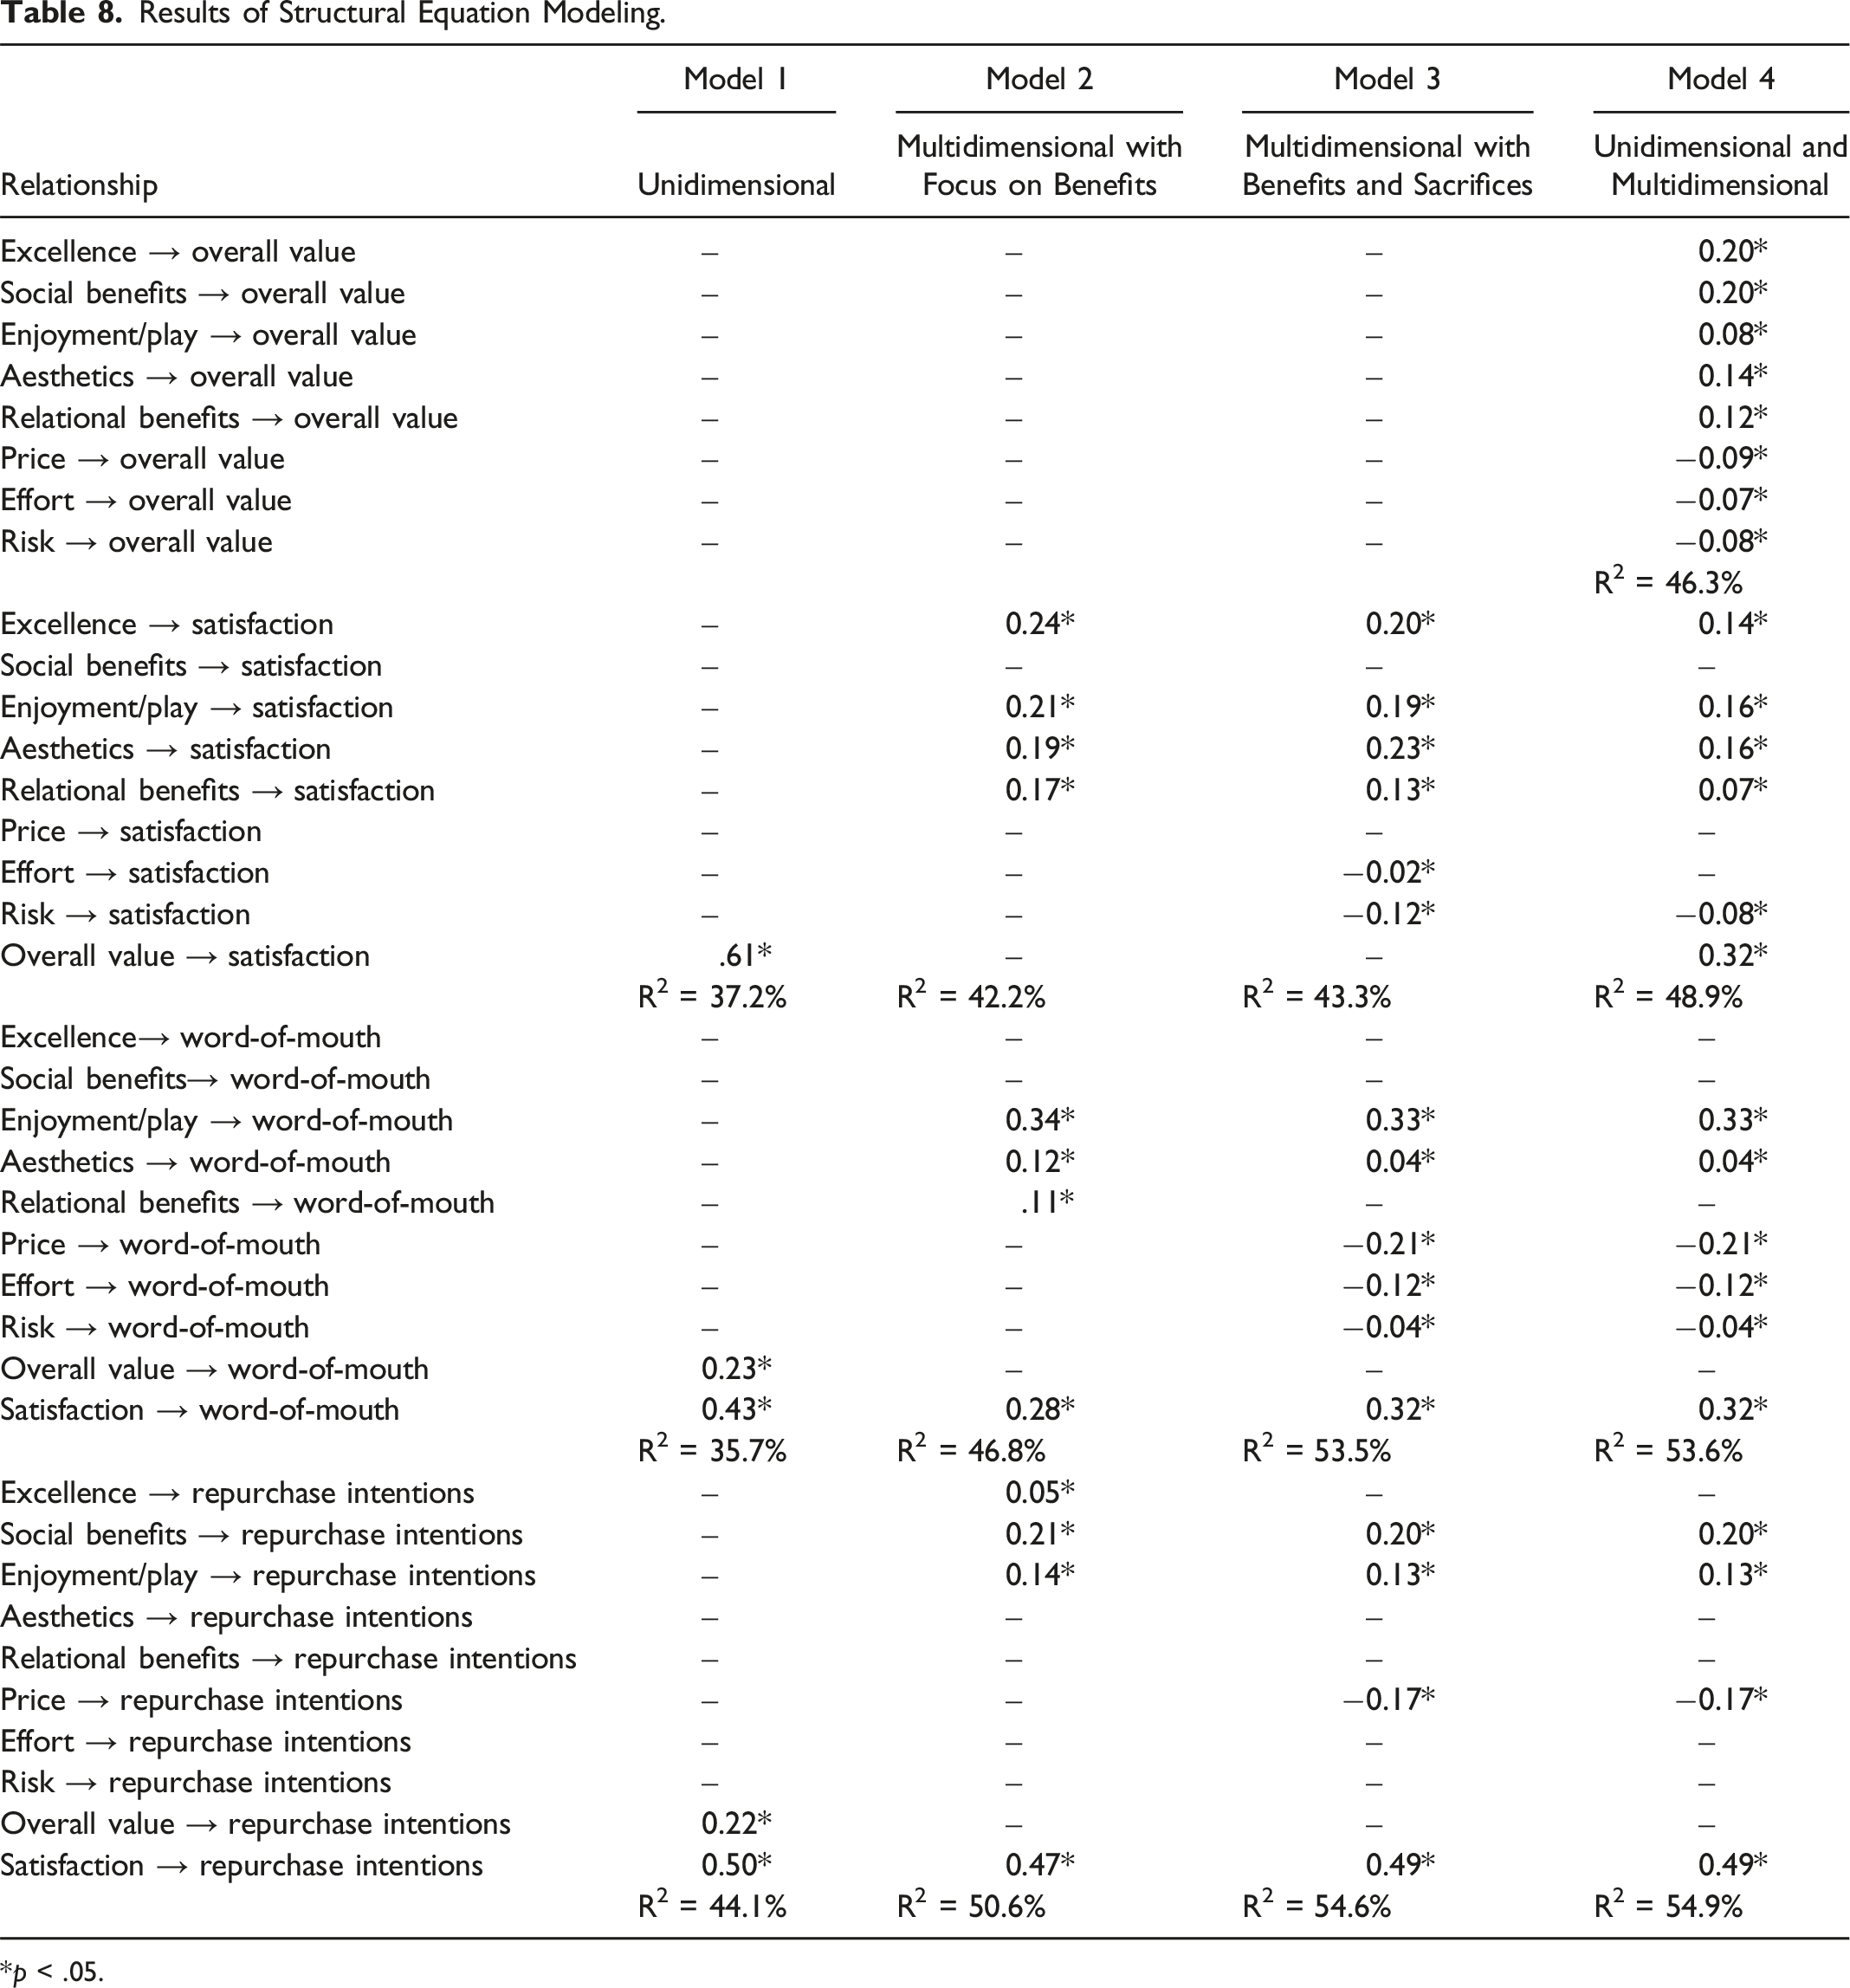
*p < .05.
Model 4 exhibits the highest explained variances: 46.3% for overall value, 48.9% for satisfaction, 53.6% for WOM, and 54.9% for repurchase intentions. All benefits and sacrifices display positive relationships with overall value: excellence (µ = 0.20), social benefits (µ = 0.20), enjoyment/play (µ = 0.08), aesthetics (µ = 0.14), relational benefits (µ = 0.12), price (µ = −0.09), effort (µ = −0.07), and risk (µ = −0.08). Furthermore, we find effects of overall value, benefits, and sacrifices on satisfaction. The effect of overall value (β = 0.32) is significant, as are the effects of excellence (µ = 0.14), enjoyment/play (µ = 0.16), aesthetics (µ = 0.16), relational benefits (µ = 0.07), and risk (µ = −0.08). Moreover, various benefits and sacrifices relate to WOM: enjoyment/play (µ = 0.33), aesthetics (µ = 0.04), price (µ = −0.21), effort (µ = −0.12), and risk (µ = −0.04). Satisfaction also indicates significance (β = 0.32). Several benefits and sacrifices are associated with repurchase intentions, including social benefits (µ = 0.20), enjoyment/play (µ = 0.13), and price (µ = −0.17). Satisfaction (β = 0.49) is significant too.
In summary, CPV is best conceptualized as a combination of benefits, sacrifices, and overall value. All studied benefits and sacrifices are significantly related to overall value. In addition, many of them, along with overall value, significantly influence satisfaction, WOM, and repurchase intentions.
Moderator Analysis Results
Results of Moderator Tests Using Meta-Regression.
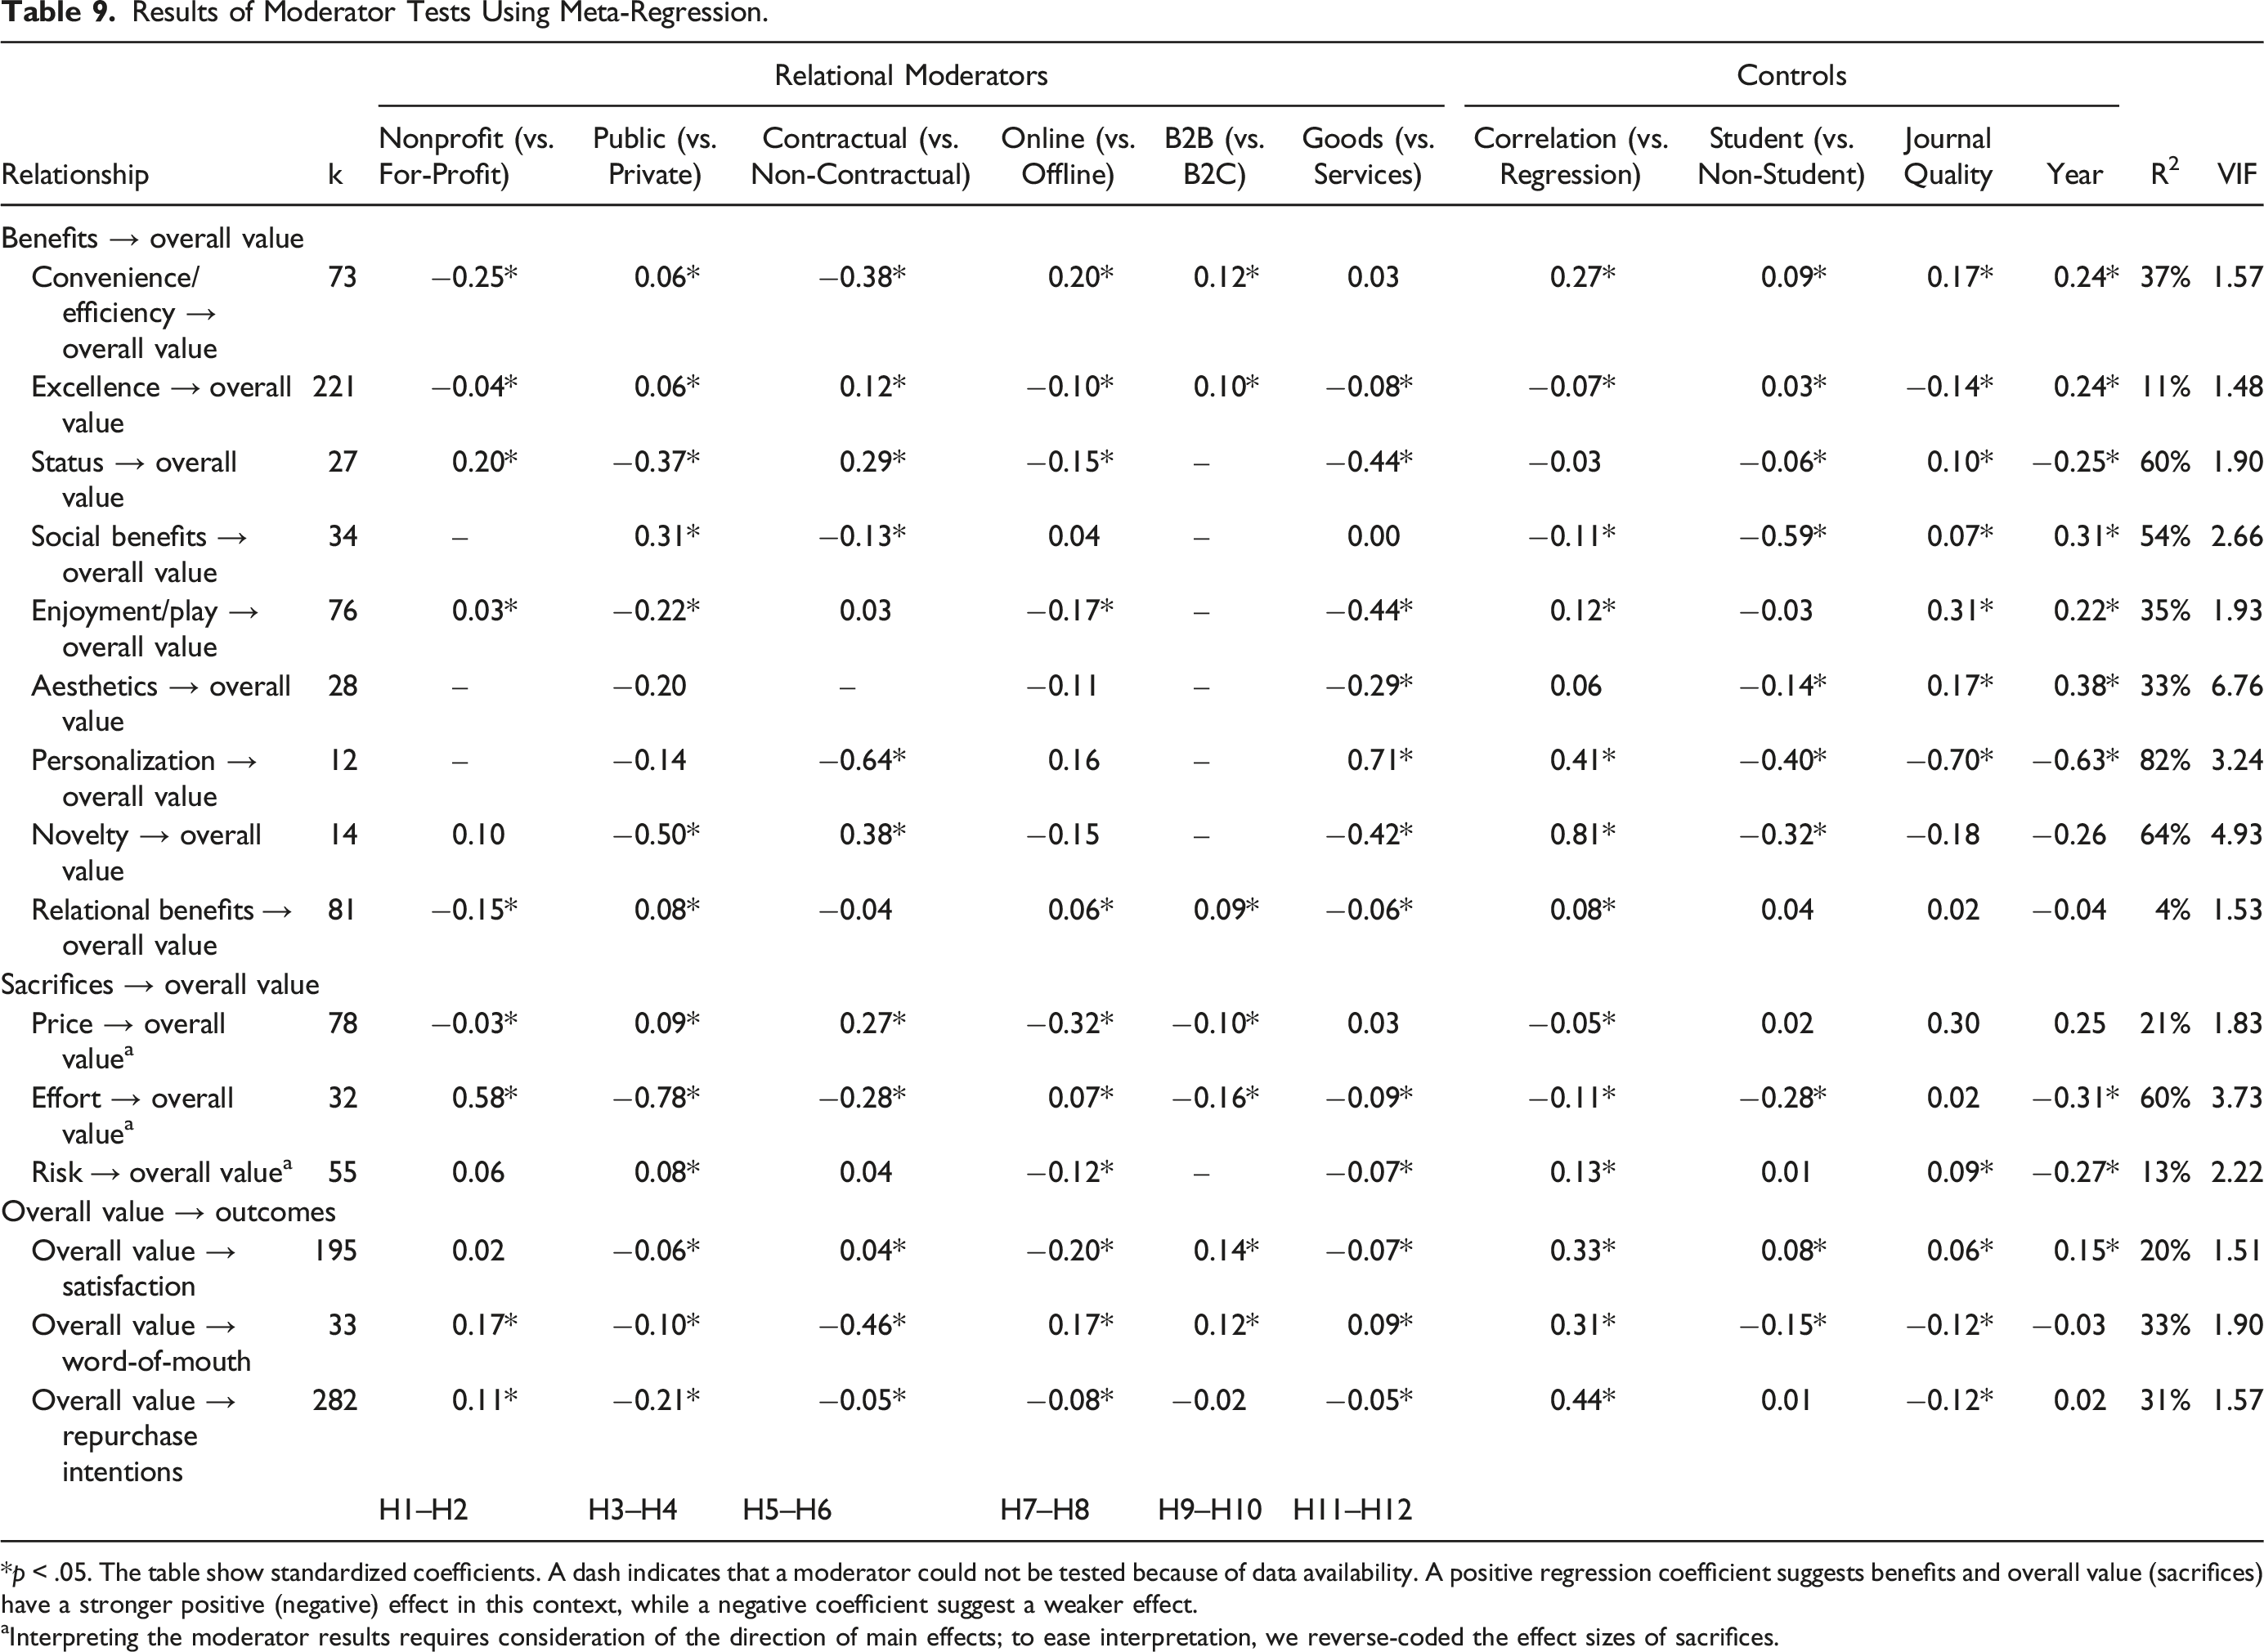
*p < .05. The table show standardized coefficients. A dash indicates that a moderator could not be tested because of data availability. A positive regression coefficient suggests benefits and overall value (sacrifices) have a stronger positive (negative) effect in this context, while a negative coefficient suggest a weaker effect.
aInterpreting the moderator results requires consideration of the direction of main effects; to ease interpretation, we reverse-coded the effect sizes of sacrifices.
First, in line with H1, the positive effect of status (β = 0.20) on overall value is stronger in nonprofit contexts, whereas the effects of convenience/efficiency (β = −0.25) and excellence (β = −0.04) are stronger in for-profit contexts. Consistent with H2, the effect of overall value on repurchase intentions (β = 0.11) and WOM (β = 0.17) are stronger in nonprofit contexts; the moderating effect on satisfaction is not significant. Although not hypothesized, we observe a stronger positive effect of enjoyment/play (β = 0.03) on overall value in nonprofit contexts; the positive effect of relational benefits (β = −0.15) also is stronger in for-profit contexts. Whereas the negative effect of effort (β = 0.58) on overall value is stronger in nonprofit contexts, the negative effect of price (β = −0.03) gains strength in for-profit contexts.
Second, the positive effect of social benefits (β = 0.31) on overall value is stronger in public contexts, and the positive effects of enjoyment/play (β = −0.22) and novelty (β = −0.50) are stronger in private contexts. The negative effect of effort (β = −0.78) is stronger in private contexts too. These findings support all the predictions in H3. Consistent with our expectations in H4, the positive effects of overall value on satisfaction (β = −0.06), WOM (β = −0.10), and repurchase intentions (β = −0.21) are stronger in private contexts. We also find that the positive effects of convenience/efficiency (β = 0.06), excellence (β = 0.06), and relational benefits (β = .08) on overall value are stronger in public contexts, whereas the positive effect of status (β = −0.37) is stronger in private contexts. Moreover, the negative effects of price (β = 0.09) and risk (β = 0.08) on overall value are stronger in public contexts.
Third, we find mixed results related to contractual versus non-contractual contexts. As we expected, the positive effect of status (β = 0.29) on overall value is stronger in contractual contexts, and the positive effect of convenience/efficiency (β = −0.38) is stronger in non-contractual contexts. The negative effect of effort (β = −0.28) on overall value also is stronger in non-contractual contexts. But the positive effect of personalization (β = −0.64) on overall value is stronger in non-contractual contexts, and we find no significant effect for relational benefits. Thus, H5 receives partial support. The positive effect of overall value on repurchase intentions (β = −0.05) and WOM (β = −0.46) are stronger in non-contractual settings, but its effects on satisfaction (β = 0.04) are stronger in contractual settings, which also indicates partial support for H6. The positive effects of excellence (β = 0.12) and novelty (β = .38) on overall value are stronger in contractual contexts, whereas social benefits (β = −0.13) have a stronger positive effect in non-contractual contexts. Finally, the negative effect of price (β = .27) is stronger in contractual contexts.
Fourth, the positive effect of convenience/efficiency (β = 0.20) on overall value is stronger in online contexts. However, we do not find significant effects for either personalization or social benefits. Contrary to our expectations, the negative effect of risk (β = −0.12) on overall value is stronger in offline contexts. Thus, we obtain only partial support for H7. The positive effect of overall value on WOM (β = 0.17) is stronger in online contexts, whereas its positive effects on satisfaction (β = −0.20) and repurchase intentions (β = −0.08) are stronger in offline contexts. These results provide partial support for H8. Moreover, the positive effect of relational benefits (β = 0.06) on overall value is stronger in online contexts, but the positive effects of excellence (β = −0.10), status (β = −0.15), and enjoyment/play (β = −0.17) are stronger in offline contexts. Online contexts produce a stronger negative effect of effort (β = 0.07) on overall value; offline contexts indicate a stronger negative effect of price (β = −0.32).
Fifth, in line with H9, B2B contexts reveal stronger positive effects of convenience/efficiency (β = 0.12), excellence (β = 0.10), and relational benefits (β = 0.09) on overall value. We also find that B2B contexts feature stronger positive effects of overall value on satisfaction (β = 0.14) and WOM (β = 0.12), though not on repurchase intentions, in partial support of H10. Although not hypothesized, we note that B2C contexts indicate stronger negative effects of price (β = −0.10) and effort (β = −0.16) on overall value.
Sixth and finally, services contexts show stronger positive effects of status (β = −0.44) and relational benefits (β = −0.06) on overall value, as well as a stronger negative effect of effort (β = −0.09), in support of H11. Services indicate stronger positive effects of overall value on satisfaction (β = −0.07) and repurchase intentions (β = −0.05), but in goods contexts, we find a stronger positive effect of overall value on WOM (β = 0.09), indicating partial support for H12. In addition, goods contexts reveal a stronger positive effect of personalization (β = 0.71) on overall value, whereas services lead to stronger positive effects of excellence (β = −0.08), enjoyment/play (β = −0.44), aesthetics (β = −0.29), and novelty (β = −0.42). Services also show a stronger negative effect of risk (β = −0.07) on overall value.
The variance inflation factors of all these regression models are acceptable, ranging from 1.48 to 6.76. The results are also robust when controlling for the influence of methodological moderators. Journal quality enhances some effects (e.g., convenience/efficiency) but weakens others (e.g., excellence and personalization). Prior meta-analysis approaches reflect the notion that the rigid control mechanisms imposed by quality journals prevent effect size inflation; we find these mechanisms support empirical studies that are likely to detect some effects. In addition, many benefits gain importance over time (e.g., social benefits), but others lose importance (e.g., status and personalization). In contrast with predictions that customer expectations always increase over time, we find that some benefits lose importance.
General Discussion
Theoretical Contributions
Empirical research on CPV has generated contradictory empirical findings. Responding to calls to “synthesize extant research findings by engaging in meta-analytical research endeavors” (Zeithaml et al. 2020, p. 18), we conduct a meta-analysis designed to summarize this empirical evidence and test the theoretical bases of the CPV construct. In turn, this article contributes to extant literature in three main ways.
First, we identify which conceptualization of CPV offers the best explanation of customers’ positive responses (Table 8). Our findings indicate that the model that integrates benefits, sacrifices, and overall value surpasses the others. It also matches Zeithaml’s (1988) foundational definition and represents the most comprehensive conceptualization of CPV. Because it accounts for advantages and disadvantages that shape value judgments, and also captures this process at a more abstract level (i.e., overall value), this model enhances theoretical understanding of the intricacies of CPV and therefore should be given preference in continued research on CPV.
Second, by leveraging Leroi-Werelds’s (2019) typology, we provide a more complete view of what creates (i.e., benefits) or hinders (i.e., sacrifices) overall value perceptions. We also provide meta-analytical evidence of the effects of overall value on satisfaction, WOM, and repurchase intentions. Precisely, self-esteem is the most important driver of overall value, and security risk is the variable that impedes it most (Table 7). These primary roles of status-related variables highlight the need to move beyond simple conceptualizations of value as a quality/price ratio (Dodds, Monroe, and Grewal 1991; Grewal, Monroe, and Krishnan 1998). We also note that status, as another social variable, is the benefit with the least importance, which may seem surprising at first glance. But this insight suggests that benefits that strengthen customers’ evaluations of their own worth (e.g., self-esteem), as opposed to external evaluations (e.g., status), may have the most influence on overall value perceptions. The finding that ecological benefits/ethics exert particularly strong direct effects on satisfaction and repurchase intentions also deserves more attention.
Summary of Hypothesis Testing and Explored Moderating Effects.
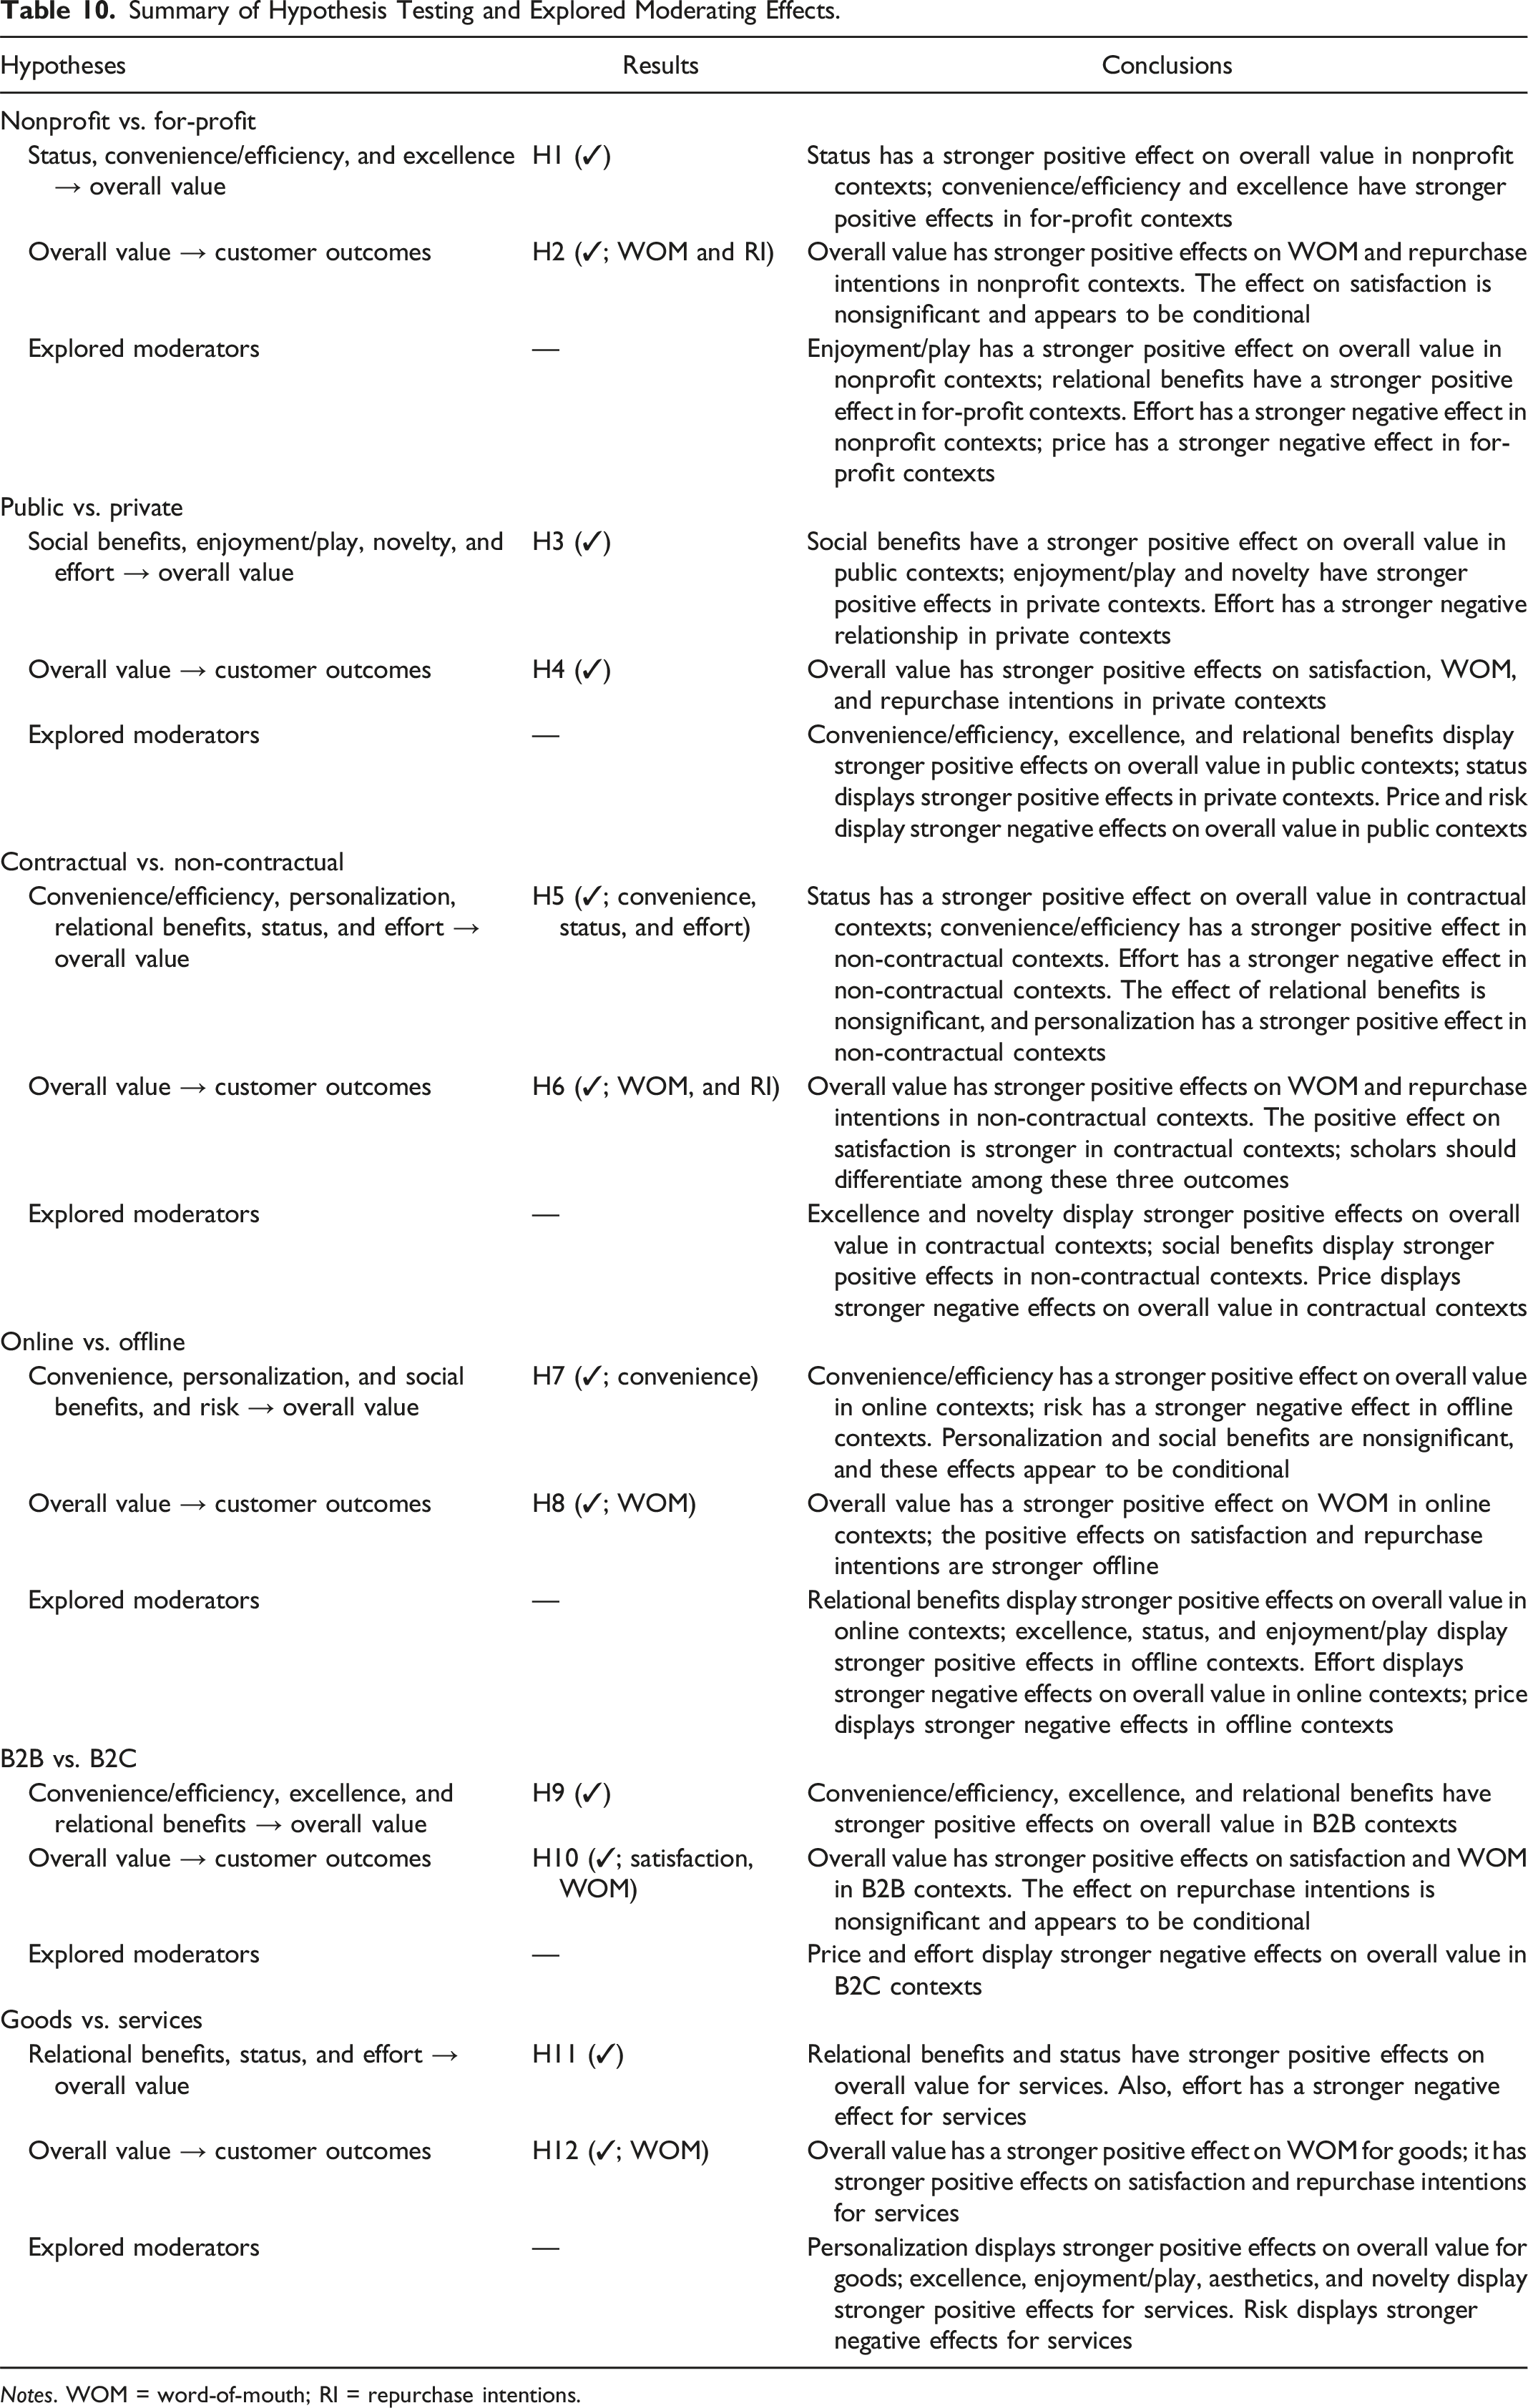
Notes. WOM = word-of-mouth; RI = repurchase intentions.
Varying importance of benefits and sacrifices on overall value.
Across nonprofit and for-profit contexts, several revealed differences can advance CPV theory. The stronger positive effect of status on overall value for customers of nonprofit organizations suggests that customers in these contexts seek to enhance their social standing by supporting these organizations (Parker and Lehmann 2011). However, the positive effects of convenience/efficiency and excellence are stronger in relation to for-profit organizations, seemingly because customers expect them to provide better services. The effects of other benefits/sacrifices on overall value also differ across these contexts, in ways we did not predict; we call on scholars to use qualitative methods to identify some underlying reasons. The stronger positive influences of overall value on WOM and repurchase intentions in nonprofit contexts also suggest that customers assess nonprofit organizations more favorably (Vock, Van Dolen, and Kolk 2013).
Between public and private contexts, we find the most differences, indicating the importance of accounting for these settings when studying CPV. Social benefits trigger overall value in a public context, but enjoyment and novelty prompt more of overall value in private contexts. The greater impact of social benefits on overall value in public settings might be attributed to the value linked to exposure and social acknowledgment. Effort appears to be perceived less negatively in public contexts, with weaker effects (Blut, Wang, and Schoefer 2016). We also observe that overall value has stronger positive effects on all customer outcomes in private contexts. It is likely that customers in private contexts focus more on CPV, which in turn leads to greater satisfaction, WOM, and repurchase intentions.
The moderating effects of contractual or non-contractual contexts also are influential, requiring scholarly attention. Status has a stronger positive effect on customers in contractual contexts, whereas convenience has a stronger effect in non-contractual contexts. Personalization, unexpectedly, show a stronger effect in non-contractual contexts, presumably, because of the greater freedom and flexibility of such contexts. We do not find any differences for relational benefits; customers in both contexts appreciate such benefits. However, we find that effort has a stronger negative effect in non-contractual contexts, perhaps reflecting customers’ expectations of the amount of effort they must perform to identify the most convenient offer (Pick and Eisend 2014). As expected, overall value enhances WOM and repurchase intentions in non-contractual contexts, where customers can switch providers easily. Overall value also appears beneficial to satisfaction among customers in contractual settings, an unexpected finding that requires further exploration.
The positive effects of convenience/efficiency are stronger in online contexts, where customers might appreciate the convenience of the offer. Yet social benefits and personalization exhibit no significant differences across contexts. Scholars should work to identify specific customer segments that might appreciate these benefits. In addition, and unexpectedly, in online contexts, effort is more detrimental to overall value than risk is, implying that customers grow impatient with browsing different websites to find an interesting offer (Harris et al. 2006). Even more surprising, we uncover inconsistent results for outcomes: Satisfaction and repurchase intentions are more strongly influenced by overall value in offline settings, whereas WOM is strongly affected by overall value in online settings. This result might reflect web characteristics that enable users to share opinions easily. Scholars could examine whether similar differences exist for other customer outcomes.
In B2B versus B2C contexts, we find relatively fewer differences that arise for the other moderators. Specifically, some benefits are more important in B2B than in B2C settings; convenience/efficiency, excellence, and relational benefits all have stronger positive effects on overall value. In some unexpected results, price and effort have stronger negative impacts on overall value in B2C contexts, perhaps due to the financial restrictions and limited resources of consumers. Overall value also has a stronger positive impact on satisfaction and WOM in B2B settings, where clients assess their relationships with suppliers very carefully (Ulaga and Eggert 2006). The effect on repurchase intentions is nonsignificant though.
Comparing goods and services, we find that most benefits and sacrifices are of greater relevance for services than for goods, such as status and relational benefits. This important finding should guide scholars’ investigations of CPV. Other benefits also are of greater relevance in service contexts, though we did not predict such outcomes. A notable exception, though, is personalization, which is unexpectedly more important for goods than services. Personalizing a physical product might create an emotional connection with the product, thus enhancing perceptions of overall value. Effort has a stronger negative effect on overall value when people consume services, reflecting the more active role of customers in service contexts (Vargo and Lusch 2004). Among the outcomes of overall value, we find, remarkably, that WOM is the only outcome that shows a more potent effect among customers of goods. Further research might investigate such differences by outcome type.
Managerial Implications
Managers can leverage CPV as a performance measure, but to do so, they should consider not only the benefits and sacrifices proposed by Leroi-Werelds (2019) but also the implications of overall value. Depending on the contexts in which managers operate, customers will have different expectations, such that certain benefits and sacrifices will be more effective for increasing overall value (Figure 3).
First, in for-profit settings, customers expect offers that make their life easier (convenience), offer high quality (excellence), and lead to better relationships with the provider (relational benefits). They also focus strongly on the price of the offer. But in nonprofit contexts, customers expect to make positive impression on others (status) and look for fun and pleasure (enjoyment). They are less willing to invest effort to interact with the firm. In contrast with arguments that nonprofit organizations should mobilize the same marketing tools as for-profit organizations, our meta-analysis reveals the different benefits and sacrifices that affect overall value in these two distinct contexts. In turn, managers of nonprofit organizations should actively work to develop offerings that generate emotional reactions and social consideration.
Second, in private contexts, overall value depends on the status, enjoyment, and novelty of the offering, whereas in public contexts (e.g., tourism, hospitality, entertainment, and education), customers expect social and relational benefits. They also appreciate utilitarian benefits (convenience and excellence) more and are more sensitive to monetary (price) and nonmonetary (risk) sacrifices. Managers working in public contexts should try to improve customer perceptions of these benefits and sacrifices.
Third, options for increasing overall value also vary across contractual and non-contractual settings. In the former context, because customers bear substantial switching costs, they expect companies to provide innovative (novelty) and high-quality (excellence) offerings, as well as distinctive status. In the latter context, customers expect offers that are useful (convenience), tailored (personalization), and capable of improving relationships with other customers (social benefits). Otherwise, they likely will take their businesses elsewhere, considering the low switching costs in non-contractual contexts.
Fourth, customers perceive greater value when digital offers on online contexts make their lives easier (convenience) and provide relational benefits. They are sensitive to how much effort they must invest though. Therefore, managers in digital contexts should provide efficient web interfaces and support for their customers. In offline contexts, customers are more likely to appreciate benefits related to excellence, enjoyment, and status. Our results suggest that companies should particularly focus on these three benefit types to increase overall value. Customers are also more price- and risk-sensitive.
Fifth, the more effective ways to increase overall value in B2B settings revolve around convenience, excellence, and relational benefits. The technical performance of a high-quality offer, combined with relational strategies (frequency of interaction, information exchange, active role for the customer and supplier) all can improve overall value in B2B contexts. In B2C contexts, our meta-analysis highlights the key roles of monetary (price) and nonmonetary (effort) sacrifices. Companies often emphasize the benefits of their offers; we recommend that they also reassure consumers about the importance of and rationale for their monetary and nonmonetary sacrifices.
Sixth, in goods contexts, customers appreciate personalization. Companies can and should use various tools to personalize their products (e.g., customization programs and product recommendations based on past choices). Managers in service contexts have more options to increase overall value, in that they can emphasize a variety of benefits associated with their services (excellence, status, enjoyment, aesthetics, novelty, and relational benefits). They also should reassure customers about the nonmonetary sacrifices (effort and risk) they must make.
Limitations and Further Research
The limitations of our meta-analysis largely stem from data availability issues. First, meta-analyses can only synthesize variables that have received sufficient attention in prior research and for which effect sizes have been reported in primary studies. Although our approach allowed for the assessment of the four most widely used conceptualizations of CPV—from unidimensional (Dodds, Monroe, and Grewal 1991) to the most integrative multidimensional (Leroi-Werelds 2019) models—we cannot test the entire set of benefits and sacrifices under consideration in this research, because too few studies reported effect sizes for some of these variables. Therefore, this study did not assess the effects of self-esteem, control, and societal and ethical benefits on WOM, nor could we test the effects of physical risk and ecological costs as sacrifices. Further research on these dimensions is needed to appraise their relative effects on satisfaction, WOM, and repurchase intentions, compared with those of other sacrifices that shape overall value.
Second, the outcomes we study are mainly relevant in the post-purchase phase. We call for more studies that explicitly differentiate between pre- and post-purchase phases and examine how CPV influences decision-making in the pre-purchase phase. Probably due to the relatively recent emergence of customer journey concepts (Lemon and Verhoef 2016), quantitative studies of value in the past 30 years have not addressed this dynamic aspect in the service experience. With a meta-analysis, we thus cannot identify whether CPV is more influential before or after the service experience.
Third, we tested six moderators that influence how overall value develops and its effects. To deliver managerial implications that can easily be implemented, we define these moderating variables to reflect macro indicators of the setting in which CPV has been examined. Our results reveal that among the three outcomes of overall value, WOM is affected by all six moderators, and satisfaction and loyalty each is affected by five, confirming the strong influence of the moderating variables. Due to the aggregated nature of the data though, differences between moderating effects within a given context might not be easily identifiable in a meta-analysis. For example, interactions with nonprofit organizations can span distinct situations, such as giving to a charity but also purchasing on a web platform of the circular economy. A more granular investigation might provide a deeper understanding of the specific conditions in which the effect of overall value is moderated. Furthermore, meta-analyses rarely include individual-level moderators like personality traits, even though such variables—while creating additional challenges for managers—may explain why a specific benefit or sacrifice varies or affects outcomes differently (Holbrook 1999). We call for more primary studies to test individual-level moderators of these relationships.
Supplemental Material
Supplemental Material - Customer Perceived Value: A Comprehensive Meta-analysis
Supplemental Material for Customer Perceived Value: A Comprehensive Meta-analysis by Markus Blut, Damien Chaney, Renaud Lunardo, Rémi Mencarelli, and Dhruv Grewal in Journal of Service Research
Supplemental Material
Supplemental Material - Customer Perceived Value: A Comprehensive Meta-analysis
Supplemental Material for Customer Perceived Value: A Comprehensive Meta-analysis by Markus Blut, Damien Chaney, Renaud Lunardo, Rémi Mencarelli, and Dhruv Grewal in Journal of Service Research
Footnotes
Declaration of Conflicting Interests
The author(s) declared no potential conflicts of interest with respect to the research, authorship, and/or publication of this article.
Funding
The author(s) received no financial support for the research, authorship, and/or publication of this article.
Supplemental Material
Supplemental material for this article is available online.
Note
Author Biographies
References
Supplementary Material
Please find the following supplemental material available below.
For Open Access articles published under a Creative Commons License, all supplemental material carries the same license as the article it is associated with.
For non-Open Access articles published, all supplemental material carries a non-exclusive license, and permission requests for re-use of supplemental material or any part of supplemental material shall be sent directly to the copyright owner as specified in the copyright notice associated with the article.