
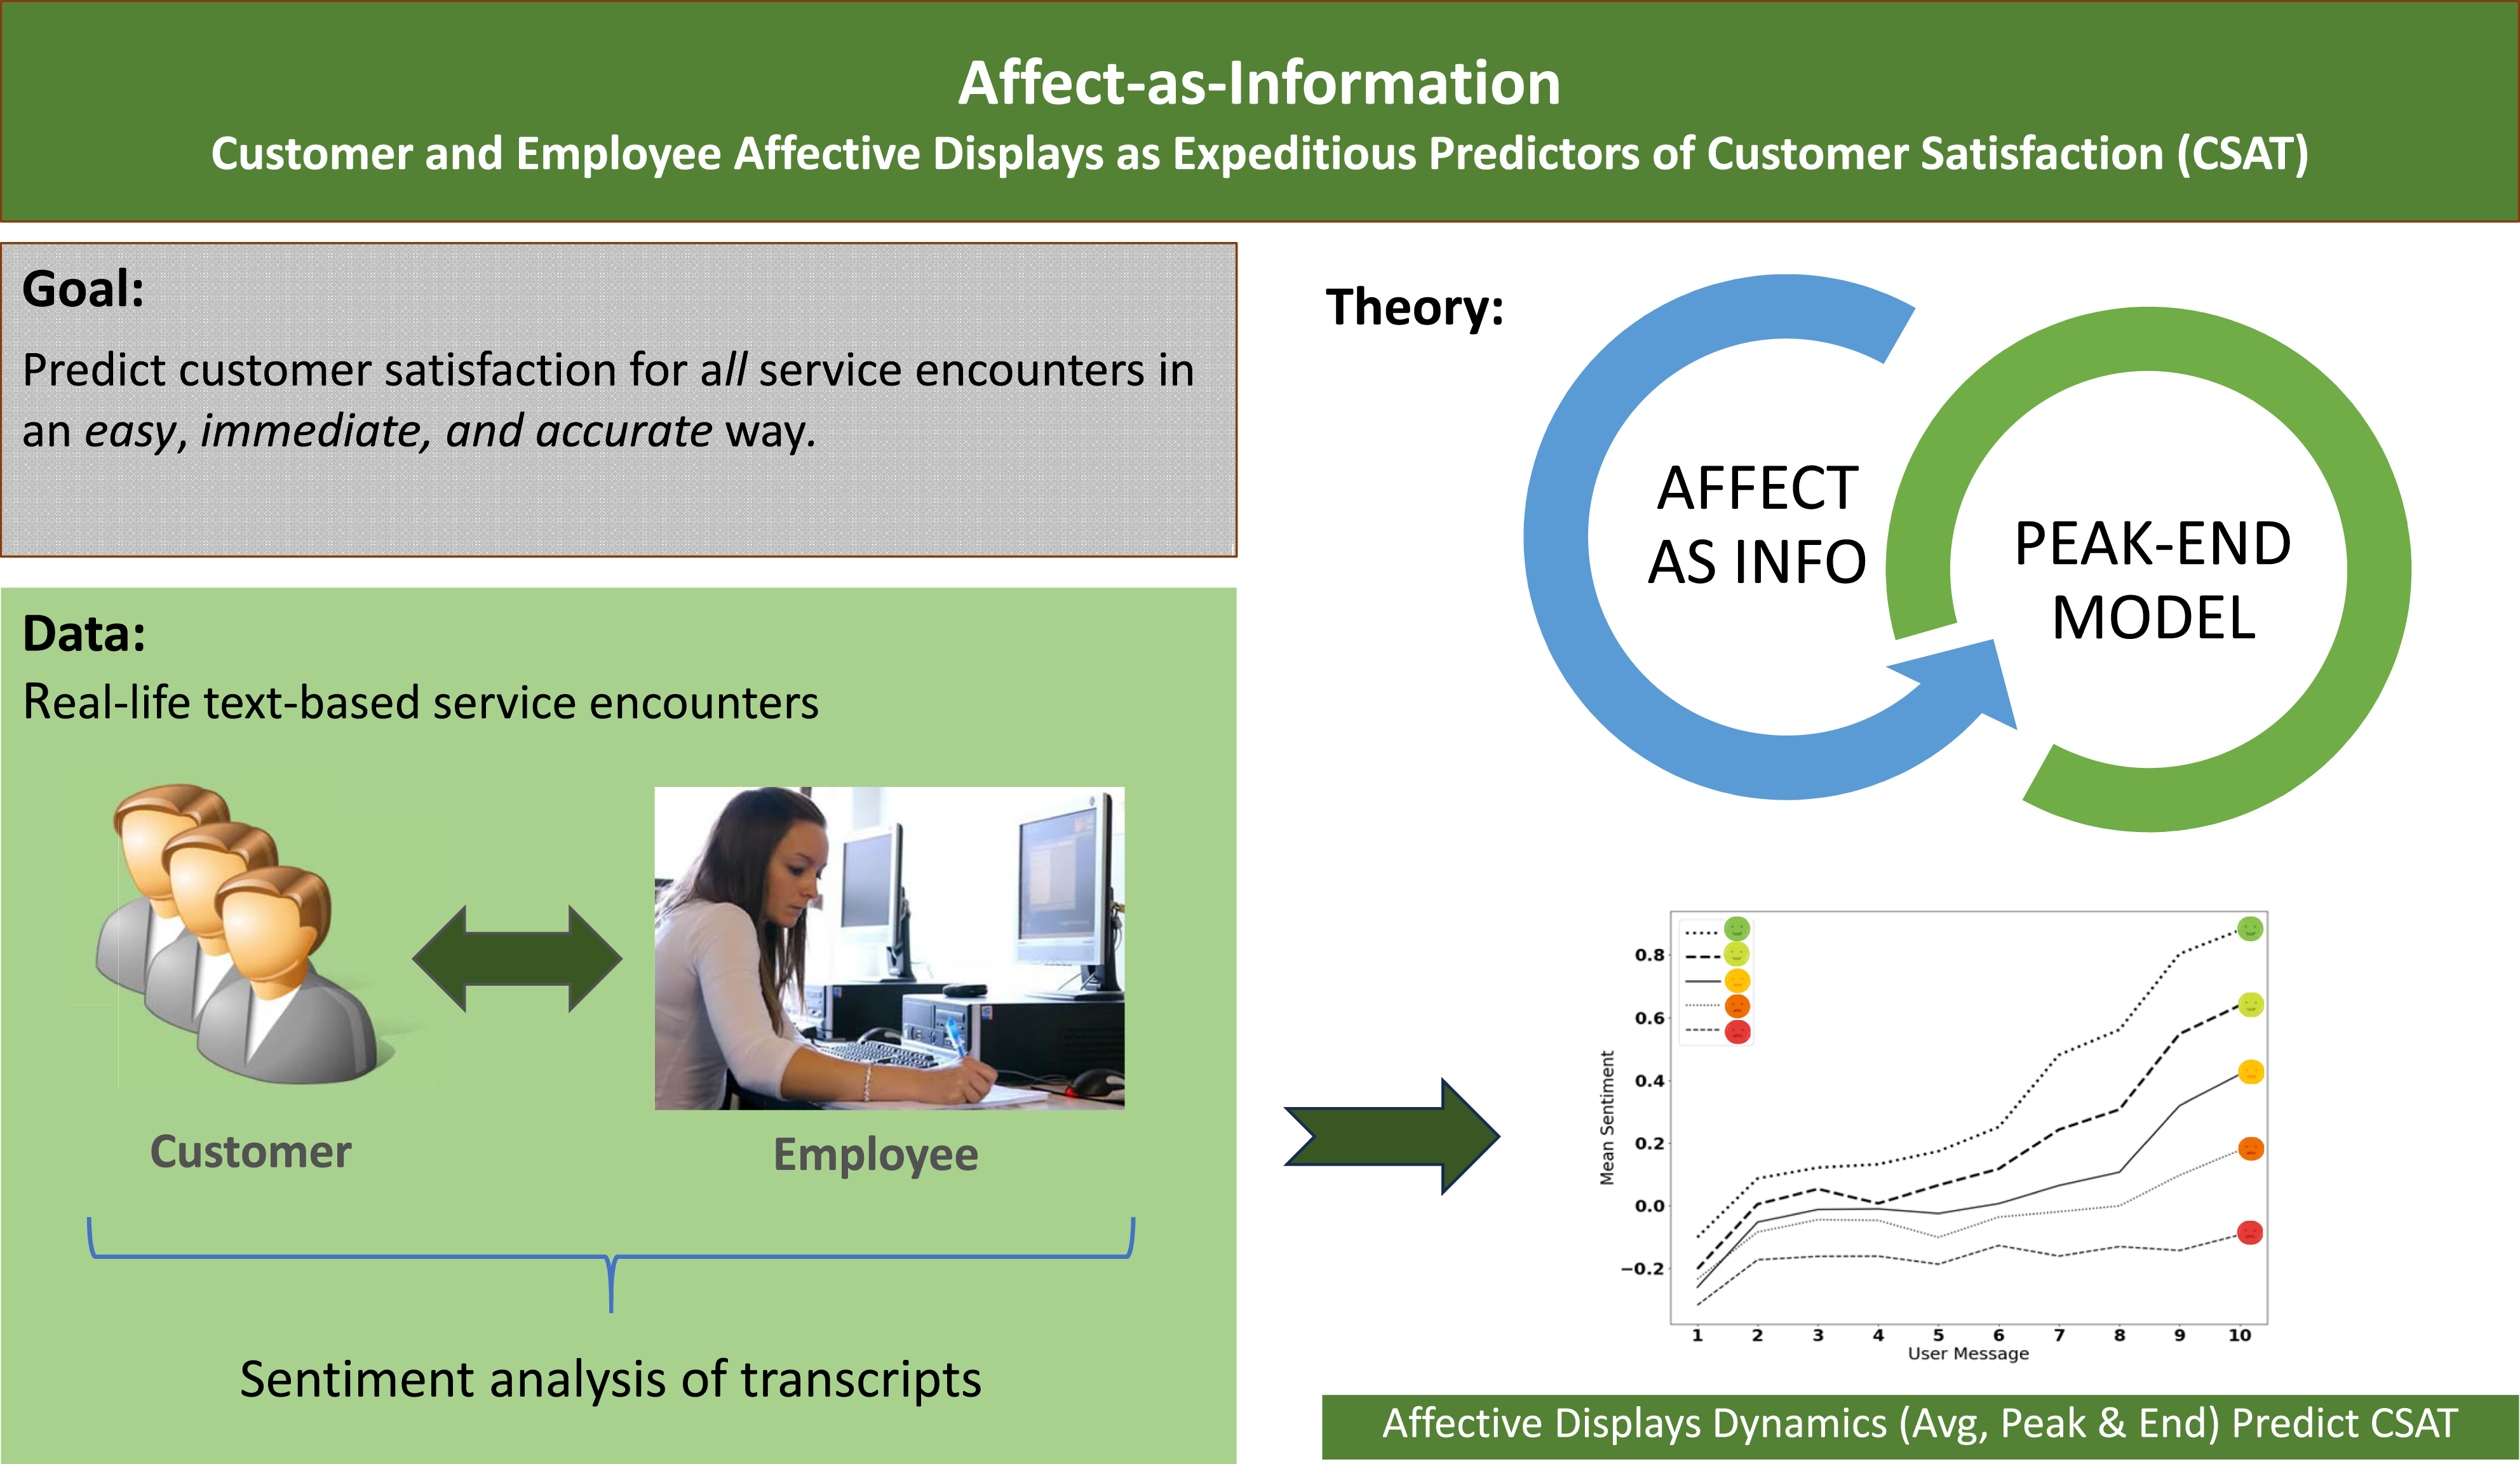
Abstract
This study introduces affect-as-information theory to the service encounter, integrates it with the peak and end model of affect, and thereby shows that these dynamic customer and employee affective displays can be used to estimate post-encounter customer satisfaction. A large-scale dataset of 23,645 real-life text-based (i.e., chat) service encounters with a total of 301,280 genuine messages written by customers and employees were used to test our hypotheses. Automatic sentiment analysis was deployed to assess the affective displays of customers and employees in every individual text message as a service encounter unfolded. Our findings confirm that in addition to customers’ overall (mean) affective display, peak (i.e., highest positive or least negative), and end (final) affective displays explain customer satisfaction. Further, as customer displays may not fully capture their satisfaction process and employees understand the service quality they deliver, we propose and confirm that employee displayed affect explains further variance in customer satisfaction. We also find that the predictive power of affective displays is more pronounced in service failure than non-failure encounters. Together, these findings show that automatic monitoring beyond customer overall affect (i.e., adding customer peak and end, and employee affective displays) can expedite the evaluation of customer satisfaction.
Introduction
Customer evaluations of service encounters provide critical feedback about the extent to which a service organization meets the needs and expectations of its customers (Anderson and Sullivan 1993; Andreassen 1999; Oliver 2010). Customer evaluations offer an opportunity to learn about what has been done well and what about a service delivery system may need improvement (Groth and Grandey 2012; McCollough, Berry, and Yadav 2000). However, dissatisfied customers do not necessarily complain, which is why managers must actively work to identify levels of customer satisfaction (Andreassen 1999). Service organizations invest extensive resources in follow-up customer satisfaction surveys; however, such surveys take considerable time and resources to administer and analyze (Wirtz and Tomlin 2000). Thus, insights about customer satisfaction may have to wait until a significant period of time has passed from when a service encounter occurred.
We propose that an analysis of the affective cues displayed by customers and employees while a service encounter unfolds can offer expeditious access to insights about customer satisfaction. We base this proposition on the affect-as-information theory (Clore, Gasper, and Garvin 2001; Schwarz 1990) which positions the emotions people feel as informational input into people’s assessments of situations and decisions. This theory emphasizes a within-person dynamic which connects the emotion a person feels to the way people decide to assess or evaluate their situation or experience. That is, extant research on affect-as-information refers to internal feelings which are hidden from service companies. We extend this theory to examine effects of affective displays as information. The term affective display refers to displays of any affective phenomena including emotions, moods, and attitudes (Bagozzi, Gopinath, and Nyer 1999; Scherer 2005).
Affective displays are inherent in customer and employee interactions that compose service encounters; display within an interaction may convey what a person feels, thinks, and chooses to display. Importantly, organizations cannot assess the genuine feelings of customers and employees without the use of obtrusive and costly measures. In contrast, as we show, people’s displayed affect can be directly and easily observed. We therefore propose that affective displays can serve as a readily accessible source of information for assessing customer satisfaction in the context of textual-based services and extend extant literature in the following ways.
First, our study is the first to use affect-as-information theory in a service encounter context and supports the use of automated sentiment analysis tools to estimate customer satisfaction of textual-based service interactions (cf. Wankhade, Rao, and Kulkarni 2022). Specifically, we build on the affect-as-information theory to propose that customers’ overall (mean) affective displays during a service encounter can help estimate their post-encounter satisfaction. This is novel as previous research focused primarily on felt affect and did not consider displayed affect (Clore, Gasper, and Garvin 2001; Schwarz 1990). In our study, we predict and show that rather than asking customers about their feelings, one can assess the emotions they display and use these as a proxy for the useful information they contain.
Second, past work on affect-as-information primarily used one-point reports of affect and did not consider affect as a dynamic notion in an experience (e.g., Schwarz 1990; Clore, Gasper, and Garvin 2001). In our paper, we develop a more finely grained approach that draws not only on customers’ overall affective display but on the full customer journey throughout service delivery. To do this, we extend the affect-as-information theory by integrating the dynamic effects of the peak and end model of displayed affect and its predictions (Ariely and Carmon 2000, 2003; Fredrickson and Kahneman 1993). Specifically, we hypothesize and show that customers’ peak (i.e., most positive or least negative) and end (final) affective displays add information about customers’ satisfaction beyond their overall (mean) affective displays.
Third, our study supplements customer affective displays with the affective displays of the employees who serve them. We propose that using employee affective displays offers additional information about the actual experience of customers that is not captured by customers’ affective displays. While affect is a powerful driver of customer satisfaction, it does not fully capture the satisfaction process (Oliver 1993; Wirtz and Bateson 1999), plus customers may not show their true emotions and use emotion regulation strategies to mask them (Medler-Liraz and Yagil 2013). On the other hand, employees have a good understanding of the service quality they deliver (Bowen and Schneider 2014; Schneider and Bowen 1985) and sense and respond to customer emotions with their own affect displays (Ashtar et al. 2021). We therefore propose and show that employees’ affective displays contain information over and above customers’ affective displays and explain additional variance in customer satisfaction.
Lastly, in line with prior findings about customers’ greater display of emotions in service failure situations (Grègoire, Laufer, and Tripp 2010), we examine affective displays in the particularly problematic case of outcome service failures. Here, we suggest and find that the predictive power of both customers and employees affective displays is more pronounced in service failure than in non-failure encounters.
In sum, our contribution is to apply the affect-as-information theory to the service encounter as a tool to expeditiously estimate customer satisfaction. We do this by combining the affect-as-information theory with the dynamic peak and end model of affect, and by using the affective displays of both customers and employees.
Literature Review and Hypotheses Development
Affect-as-Information and Customer Satisfaction
The important role of affect in guiding judgments has been repeatedly noted and recognized (Forgas 1995). When people make judgments about a particular event, they implicitly ask themselves, “How do I feel about it?” (Schwarz and Clore 1983) and subsequently use the answer to determine their evaluations. The affect-as-information framework proposed by Schwarz (1990) and Clore, Gasper, and Garvin (2001) broadened this notion, positing that people’s feelings comprise valuable information on which people rely in a wide range of evaluative judgments, perceptions, reactions, and behaviors. In particular, the theory was connected to multiple mental activities, notably judgments, perception, learning, memory, attitudes, and motivation (cf. Briñol, Petty, and Barden 2007; van den Bos 2003; Storbeck and Clore 2008). The theory has also been shown to explain critical aspects of customer management (cf., Kramer and Yoon 2007).
More broadly, the affect-as-information approach positions affect as a source of information that people use to guide their decisions in everyday lives (Clore, Gasper, and Garvin 2001). Experiencing a sense of pleasantness, for instance, is argued to provide people with information about the value of the matter at hand and thus prompts them to evaluate and interpret their environment as positive. Hence, when elicited feelings are positive, people are likely to perceive the context or situation as desirable, whereas if elicited feelings are negative, people are likely to perceive it as undesirable.
Thus, in the context of service encounters, the affect-as-information approach implies that there is a relationship between affect and customer satisfaction, a notion that has been widely supported by research (e.g., Bagozzi, Gopinath, and Nyer 1999; Oliver 1993; Wirtz and Bateson 1999); this association has even been demonstrated in short-lasting service encounters (Mattila and Enz 2002). In particular, emotions of discontent reduce customer satisfaction, whereas pleasure emotions and positive affect increase satisfaction (Schoefer 2008; Schoefer and Diamantopoulos 2008b). In a meta-analysis of 13 studies, which examined 72 correlations between affect and customer satisfaction, 67% of the correlations were found to be positive and significant, and an additional 20% were positive although not significant (Szymanski and Henard 2001).
Customer satisfaction research has established that affect experienced during a service encounter drives customer satisfaction in two ways. First, the cognitive disconfirmation-of-expectations process is at least partially mediated by affect (Wirtz and Bateson 1999). That is, a positive disconfirmation-of-expectations assessment increases pleasure, which in turn increases satisfaction, and vice versa for a service performance below expectations. Second, other psychological and perceptual factors (e.g., environmental stimuli in a servicescape, even if not perceived consciously) shape affect, which in turn drives customer satisfaction and explains variance over and above the cognitive disconfirmation-of-expectations process (Oliver 1993; Wirtz and Bateson 1999).
As such, studies of customer satisfaction in service encounters support predictions that the affect-as-information theory would suggest, though they did not build on this theory. Specifically, research on service encounters positioned affect as a part of the service experience, while the affect-as-information theory considers people’s use of affect as information in formulating their post service assessments and evaluations. This addition provides substantial insight to service research. Service is known to have an element of uncertainty due to its heterogeneity and intangibility, and psychological research based on affect-as-information shows affective cues to be particularly useful as information in situations comprising information uncertainty (Van den Bos 2003). We note that previous research on affect-as-information did not consider affective displays (focusing primarily on felt affect) and did not consider affect as a dynamic notion (examining primarily one-point reports), which are two core contributions of our study, as elaborated below.
Customer Affective Displays in Service Encounters
Service encounters comprise a sequence of interactions that unfold over time (Verhoef, Antonides, and de Hoog 2004). Affective displays of individuals in this sequence can vary between interactions within the same service encounter, reflecting what Weiss and Cropanzano (1996) call “affective events.”
We advance that affective displays in a sequence of interactions in a service encounter are a proxy of customer feelings; they may not precisely reflect what a person feels but can serve as a useful indicator of customer affect during a service encounter. Specifically, customer displays can be positive, showcasing displays of gratitude (“You were very helpful. Thanks!” Biron and Bamberger 2010; Bock, Folse, and Black 2016), or politeness (“Oh, I totally love your uniform … I’m sure you’re able to help me,” Frey-Cordes, Eilert, and Büttgen 2020). Customer affective displays can also be negative: customers may display anger (“I’m really angry about the commission!” Glikson et al. 2019; Jerger and Wirtz 2017; “Your service is extremely inefficient! ... This is an outrage!” Miron-Spektor et al. 2011), incivility (“I hope you’re at least somewhat competent,” Frey-Cordes, Eilert, and Büttgen 2020; “Can’t you count? One,” Henkel et al. 2017), and aggression (“No wonder this is the best job you could get,” Hershcovis and Bhatnagar 2017). That is, affective displays offer cues about felt affect (Rafaeli Anat et al. 2020; Yom-Tov et al. 2018), and we propose similarly that an analysis of affective displays can offer predictive information about subsequent customer satisfaction. Specifically, we expect that a display of higher overall customer affect indicates higher customer satisfaction. Formally:
A higher overall (mean) level of positive customer affect displayed during a service encounter explains higher post-encounter satisfaction.
Peak and End Affective Displays
It has been shown that people do not consider all moments of an experience equally when determining an overall evaluation because they rely on shortcuts, which make some parts of an experience more salient (Ariely and Carmon 2003). Available analyses on how people summarize and evaluate experiences posit that overall evaluations are based on affective experience information that is most representative extreme (Fredrickson and Kahneman 1993; Kahneman 2000). Such a representative extreme moment, or snapshot moment, is constructed and then used as input to evaluate the total experience. Here, the peak and end model holds that the moments with the most extreme (peak) and final (end) affect are highly representative moments (Ariely and Carmon 2000, 2003; Fredrickson and Kahneman 1993) that determine the global evaluation of an entire experience (Kahneman 2000). The peak and end effect has been shown in different contexts. These include negative experiences such as pain ratings for a medical procedure (Redelmeier and Kahneman 1996) and positive experiences such as evaluating vacation experiences (Geng et al. 2013) or watching video clips (Fredrickson and Kahneman 1993).
In a service context, an interesting question therefore emerges of how customer affect during different parts of a service encounter relates to overall customer satisfaction. Here, we introduce the peak and end model to the customer satisfaction context and suggest that the variance explained in satisfaction by a customer’s overall affect alone can be significantly improved by adding two additional dynamic points to the model—the peak and end customer affect displays (see also Chase and Dasu 2001). As such, we expect in our study context that customers whose peak displayed affect is extremely positive will report higher levels of satisfaction as compared to customers whose peak displayed affect is lower, even for the same level of overall displayed affect. That is, we predict that a customer who writes, “Thank you! That is wonderful; you are extremely helpful”—indicating a rather high peak display—is likely to report being more satisfied than a customer who just writes, “Thanks” during a service encounter as their peak affective display.
In addition to the “peak” effect, we expect an effect of the “end” (or final) affective display to explain additional variance in satisfaction. For example, Geng et al. (2013) asked participants to report on their level of happiness on each day of their vacation and to evaluate the overall vacation 1 day after it ended. The most extreme happiness rating (i.e., peak) and the final rating (i.e., end) together gave the best prediction of overall evaluations. In a service encounter context, we also expect an end effect to occur because service encounters reflect a goal-directed situation where customers contact service providers for a particular purpose. As Fredrickson (2000) noted, in goal-directed situations, an end effect is likely because the end symbolizes the outcome of one’s objective. Customers who display positive affect in their final message to an employee are likely to be more satisfied than customers who end an interaction with displays of discontent (e.g., “I’m extremely disappointed with your service. Bye.”). The latter are likely to be less satisfied, even if their mean and peak affective displays are identical. Thus, we propose that a higher peak and end display will lead to higher satisfaction:
A higher positive (a) peak and (b) end affect displayed by customers during a service encounter explain higher post-encounter satisfaction over and above the overall (mean) affect displayed.
Affect in Service Failure Situations
We further propose that customer affective displays have more predictive power in service failure than in non-failure situations. We offer two related reasons for this proposition. First, a number of studies have shown that during service failure, customers’ affective displays reflect the emotions experienced. Smith and Bolton (2002) reported that expressions of discontent prevail in customer responses to service failures (e.g., “discouragement” and “distress”). Schoefer and Diamantopoulos (2008a), who developed a scale of emotions during service recovery (ESRE), reported that some emotions, such as discontent (assessed by the items: “upset,” “angry,” “sad,” “in a bad mood,” and “annoyed”) are highly frequent, whereas others, such as pleasure (assessed by the items: “joyful,” “happy,” “proud,” “warm feelings,” and “being valued”) and involvement (“attentive,” “active,” and “interested”) are also present, but with less frequency.
Second, we suggest that customer satisfaction evaluations, first and foremost, reflect whether a service need was resolved. If needs are resolved, customers experience confirmation-of-expectations and satisfaction is therefore likely (Oliver 1980). However, when needs are not met, customers experience disconfirmation-of-expectations and thus are likely to display more intense negative affective cues (e.g., Grègoire, Laufer, and Tripp 2010), which in turn are important predictors of satisfaction. Taken together, we suggest that affective displays will be more indicative of subsequent satisfaction in service failure situations than in non-failure situations:
Customer affect observed during a service encounter explains more variance in customer satisfaction in failure compared to non-failure service encounters.
Employee Affective Displays as Additional Information
Employee affective displays in service encounters can be positive, neutral, and apologetic (Cheshin, Amit, and van Kleef 2018; Henkel et al. 2017; Herzig et al. 2016). We propose that such employee affective displays can help to explain further variance in customer satisfaction over and above customer affective displays for two reasons.
First, while customer affect is a powerful driver of customer satisfaction (Oliver 1993), customer affect may not fully capture the customers’ cognitive disconfirmation-of-expectation process. This is because when expectations are met, customers typically do not feel strong emotions (cf. Oliver 1993; Wirtz and Bateson 1999). As employees are integral to the service encounter (e.g., Dallimore, Sparks, and Butcher 2007; Staw, DeCelles, and de Goey 2019), they tend to have a good understanding of the service quality they deliver (Bowen and Schneider 2014; Schneider and Bowen 1985), plus they can quite accurately sense customer emotions (Ashtar et al. 2021).
While service employees are discouraged and generally do not display negative affect such as anger or rudeness (Grandey and Diamond 2010; Grandey et al. 2010), they can vary the intensity of their affective displays; for example, employees may apologize mildly (“Sorry to keep you waiting”) or mightily (“I really apologize for your long wait”). Neutral displays can be purely technical and include no affective display (“My name is …,” “We can replace the phone for you?” Rafaeli et al. 2012). Positive displays may convey happiness (“I am happy to offer you this movie,” Cheshin, Amit, and van Kleef 2018), cheerfulness, and gratitude (Herzig et al. 2016). Given that employees understand customer affect and respond to it, we propose that employees’ variations in affective displays contain information over and above customers’ affective displays and can help estimate customer satisfaction.
Second, a number of studies have shown that service employee affective displays influence customer satisfaction (Pugh 2001; Tsai 2001; Tsai and Huang 2002). For example, a study of food service providers showed that overall employee smile scores (rated by coders) positively predicted customers’ reported satisfaction (Barger and Grandey 2006), and a study across 10 service industries showed that employee affective displays, as measured by independent observers, positively predicted service encounter satisfaction (Lin and Lin 2011).
The common assumption is that employee affect influences customer satisfaction through customer felt affect (Liu, Chi, and Gremler 2019). That is, the tight interdependent linkages between customers and employees drive a relationship between employee expressions and customer satisfaction outcomes (Pugh et al. 2002). However, customer felt affect is not necessarily displayed by customers. Customer affective displays, which are what organizations can assess, sometimes diverge from felt affect because people may choose not to show their true emotions and utilize emotion regulation strategies to mask their emotions (Medler-Liraz and Yagil 2013). Thus, assessments of customer affective displays are unlikely to capture the full range of customer felt affect. To compensate for this lack of complete information on customer affect, we propose that employee affective displays can serve as an additional source of information for estimating customer satisfaction.
In sum, employee affective displays may fill in additional information on (a) the customer’s cognitive disconfirmation-of-expectations variance that is not mediated by affect (Oliver 1993; Wirtz and Bateson 1999) and therefore not shown in the customer’s affective displays, and (b) provide information when a customer felt affect deviates from his/her affective display. Here too, dynamic changes in affect may garner some importance, and peak and end display may provide additional information regarding the peak and final experience of the customer. We therefore hypothesize that:
Employee (a) overall (mean), (b) peak, and (c) end affect displayed during a service encounter explains additional variance in customer satisfaction over and above all customer affective displays.
Furthermore, as for customers, we advance that the affective displays of employees provide more useful insights in service failure than in non-failure situations as stronger emotions can be expected in the former compared to the latter (c.f., Grègoire, Laufer, and Tripp 2010; Schoefer and Diamantopoulos 2008a; Smith and Bolton 2002). Hence, our final prediction:
Employee affect displayed during a service encounter explains more variance in customer satisfaction in failure compared to non-failure service encounters.
Method
Text-Based Service Encounters
We tested our hypotheses using data on genuine frontline, text-based service encounters conducted online. Such interactions are common in customer service, and the affect that customers and employees display in this type of interaction is yet to be thoroughly studied (Rafaeli Anat et al. 2020). Service encounters conducted in writing offer an excellent platform for testing our predictions because we can access the texts of customers and employees, analyze the affective displays in them, and connect these assessments to customer responses in post-service surveys regarding outcome service failure and satisfaction. Although computer-mediated and text-based interactions include relatively limited non-verbal cues (i.e., no vocal or facial cues), research has shown that they demonstrate affective displays (cf., Cheshin, Rafaeli, and Bos 2011; for a review, see Derks, Fischer, and Bos 2008), thus affording us a suitable platform for testing our predictions.
Context and Data
We obtained and analyzed a large-scale dataset of 23,645 text-based service encounters (i.e., complete service episodes) of an airline company. These service interactions were mediated by LivePerson Inc., a worldwide leader in the provision of text-based service. More than 18,000 companies used LivePerson platforms, resulting in more than 20 million service encounters per month. The firm provided us with real-life data, after removing all identifying information. The 23,645 service encounters included a total of 301,280 text messages of which 146,091 were written by customers and 155,189 by employees. The service encounters ranged from as few as two messages to as many as several hundred messages. The mean number of customer messages in a service encounter was 6.3 (SD = 3.7), and the mean number of employee messages was 6.6 (SD = 3.7).
Operationalization of Customer and Employee Affective Displays
We assessed the affective displays in each message during a service encounter using an automated and objective sentiment analysis tool called SentiStrength (Thelwall 2017). It is a novel approach to measuring affective displays in large-scale data (Birjali, Kasri, and Beni-Hssane 2021; Serrano-Guerrero et al. 2015) and avoids biases inherent to observer perceptions and self-reports, which are known to be influenced by people’s awareness of the fact that their affective displays are being measured (Donaldson & Grant-Vallone 2002; Paulhus & Vazire 2007).
SentiStrength was shown to be valid for analyzing affect in relatively short texts that individual messages of service encounters comprise (Yom-Tov et al. 2018) in contrast to other tools that are designed for analyzing longer, carefully crafted texts. SentiStrength searches through each message to identify words and word stems that appear in widely-used dictionaries of sentiment words (e.g., Linguistic Inquiry and Word Count; Pennebaker, Francis, and Booth 2001) and assigns each word both a negative score that can range from “not negative” (−1) to “extremely negative” (−5), and a positive score that can range from “not positive” (+1) to “extremely positive” (+5). Scores are then modified based on various predefined rules; for example, capital letters strengthen the score, whereas negation words (e.g., “not”) neutralize the score. These scores are then combined into a single bipolar sentiment score by rebasing both scales to zero (i.e., making zero the “neutral” score for both scales), such that each message receives a unified score ranging from “extremely negative” (−4) to “extremely positive” (+4) (see Thelwall 2017). This final score is used in our analyses.
The bipolar displayed-emotion scores are based on the assumption that each individual message either does not include any affect or conveys one dominant affective display that is either negative or positive. We validated this assumption (and our use of the bipolar scale) using crowdsourcing. We recruited participants to read a sub-batch of 1,764 messages and indicate if the message reflected a negative or positive emotion, both, or neither. Because of privacy concerns, we could not use the authentic sentences in this crowdsourcing task; therefore, we used sentences from simulated text-based service interactions that were collected for another study. The tagging showed that only one of the 1,764 messages included both positive and negative emotions, clearly a negligible proportion. Similar results were reported by Yom-Tov et al. (2018). Moreover, similar to Baier et al. (2021), we ran correlations between the separate positive and negative scores and the bipolar score and found high Pearson correlations of .70 (positive) and .75 (negative), which further reinforced our use of one bipolar scale. Thus, each message in our data is described by a single positive, neutral, or negative value, with messages that convey neither positive nor negative affect receiving a zero (i.e., neutral) score. Scores represent the intensity of either the positive or negative affective display in each message.
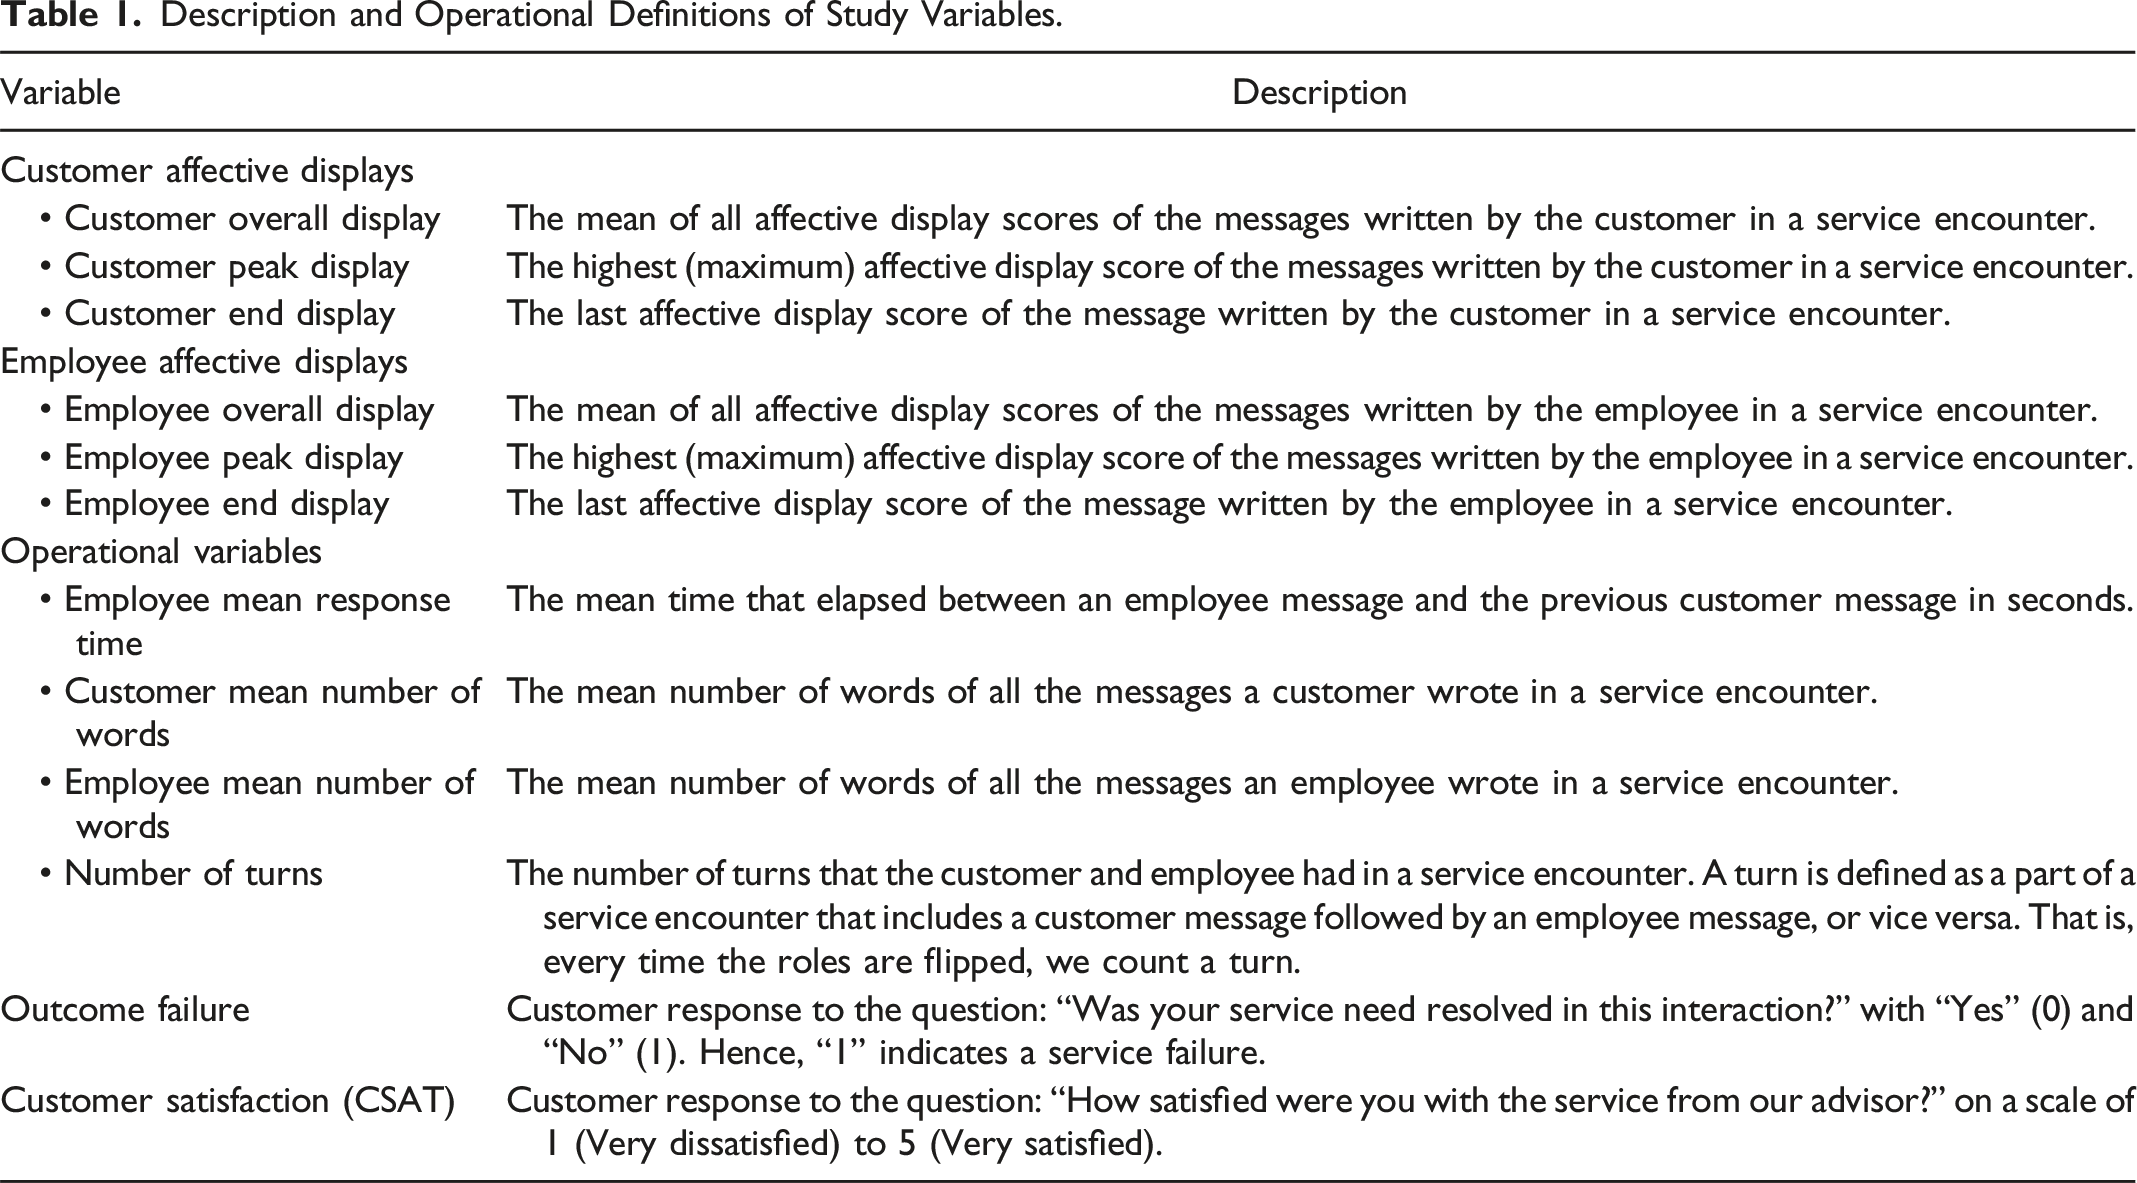
To test our hypotheses, we used the affective display score of all the messages of a given service encounter to identify three values—overall, peak, and end—for both the customer and the employee participating at that encounter. These values were used to operationalize customer and employee overall (i.e., mean) affective display, peak (i.e., highest positive or least negative) display, and end (i.e., last) display. See Figure 1 for an illustration of overall, peak, and end affective customer displays in three service encounters, and Table 1 for the description and operationalization of our variables. For the testing of H1 and H2, we use only customer affective displays, and for testing H3, H4, and H5 we use both customer and employee affective displays. Sample illustrations of overall, peak, and end affective displays. Note. Each of the three charts illustrates the displayed customer affect across 10 messages of an interaction and their overall, peak and end affective display scores. Description and Operational Definitions of Study Variables.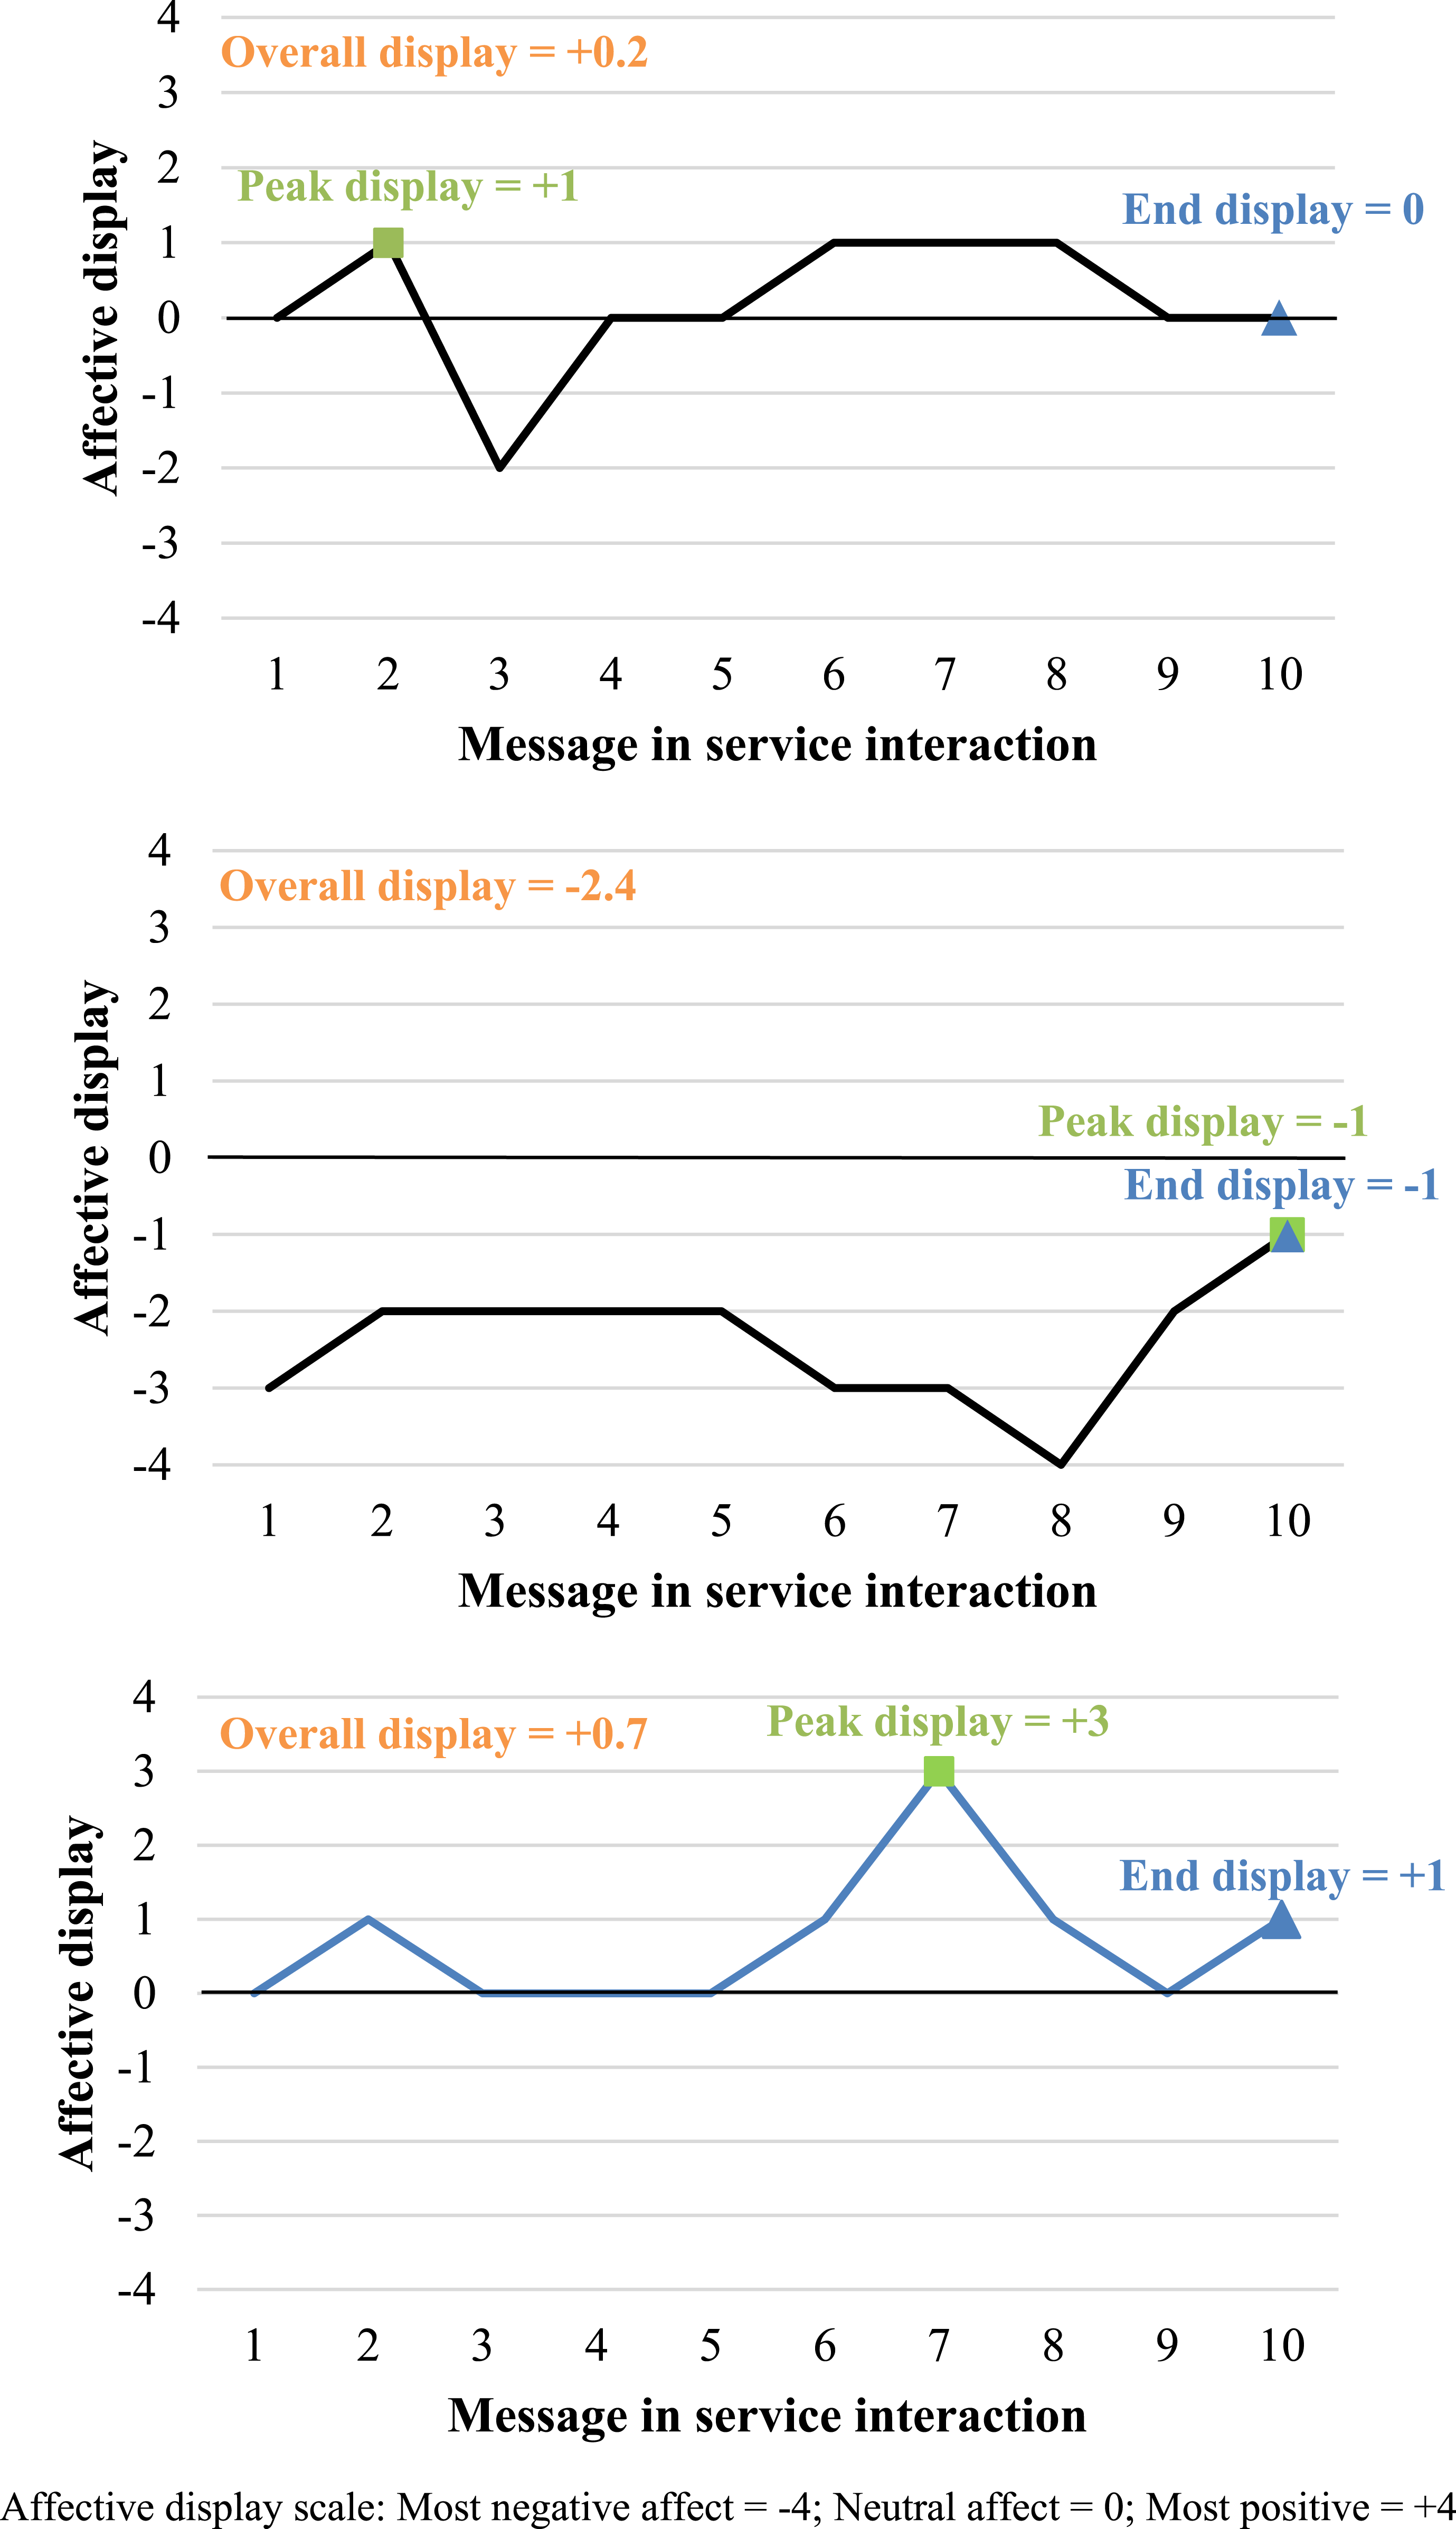
Operational Variables as Controls
To examine the unique contribution of affective displays, our analysis controlled for multiple variables during the service encounters which may influence customer satisfaction. Specifically, we controlled for employee response time because it can be an indicator of responsiveness and is the time a customer must wait to receive support, which can influence customer satisfaction (Maister 1985). We also controlled for the length of the text (number of words) of customer and employee messages, and the length of the interaction (i.e., number of times the conversation switch between customer and employee messaging, referred to as number of turns) which reflect the issue’s complexity and the effort it required to solve (see Altman et al. 2021). Therefore, for each interaction, we controlled for the following variables: (1) Employee mean response time in seconds; (2) customer mean number of words; (3) employee mean number of words; and (4) number of turns. See Table 1 for a description of the variables.
Service Failure and Customer Satisfaction
Outcome service failure (hereafter, outcome failure) was measured with a one-item question posed to customers immediately after the service encounter ended: “Was your service need resolved in this interaction?” (0 = “yes”; 1 = “no”). Hence, “1” indicates a service failure.
Customer satisfaction (CSAT) was measured with a one-item question posed to customers after the service interaction had ended: “How satisfied are you with the service from our advisor?” (1 = “Very dissatisfied” to 5 = “Very satisfied”).
Results
Descriptive Results of Affective Displays on Customer Satisfaction
Figure 2 shows the development of displayed affect over the course of our service encounters. Only service encounters with at least 10 turns were included to correct for variation in the lengths of interactions. The length of interactions was then normalized by splitting each interaction into 10 roughly equal sections (or 10 deciles). Figure 2(a) shows the customers’ affective service encounter journey by levels of post-encounter satisfaction, and Figure 2(b) shows the same for employees. Affective display across interactions by customer satisfaction. (a) Affect displayed by customers, (b) Affect displayed by employees. Note. This figure is included for illustration purposes only. It is based on service encounters with at least 10 turns. Each of these encounters was sliced into 10 deciles (i.e., section in the service interaction). We then computed the mean affect score for each decile. This figure shows how (a) customer and (b) employee affective display evolved across these 10 deciles for each of the five satisfaction levels. This figure is the only time in which this subset of the data was analyzed. All hypothesis testing was conducted on the full data set.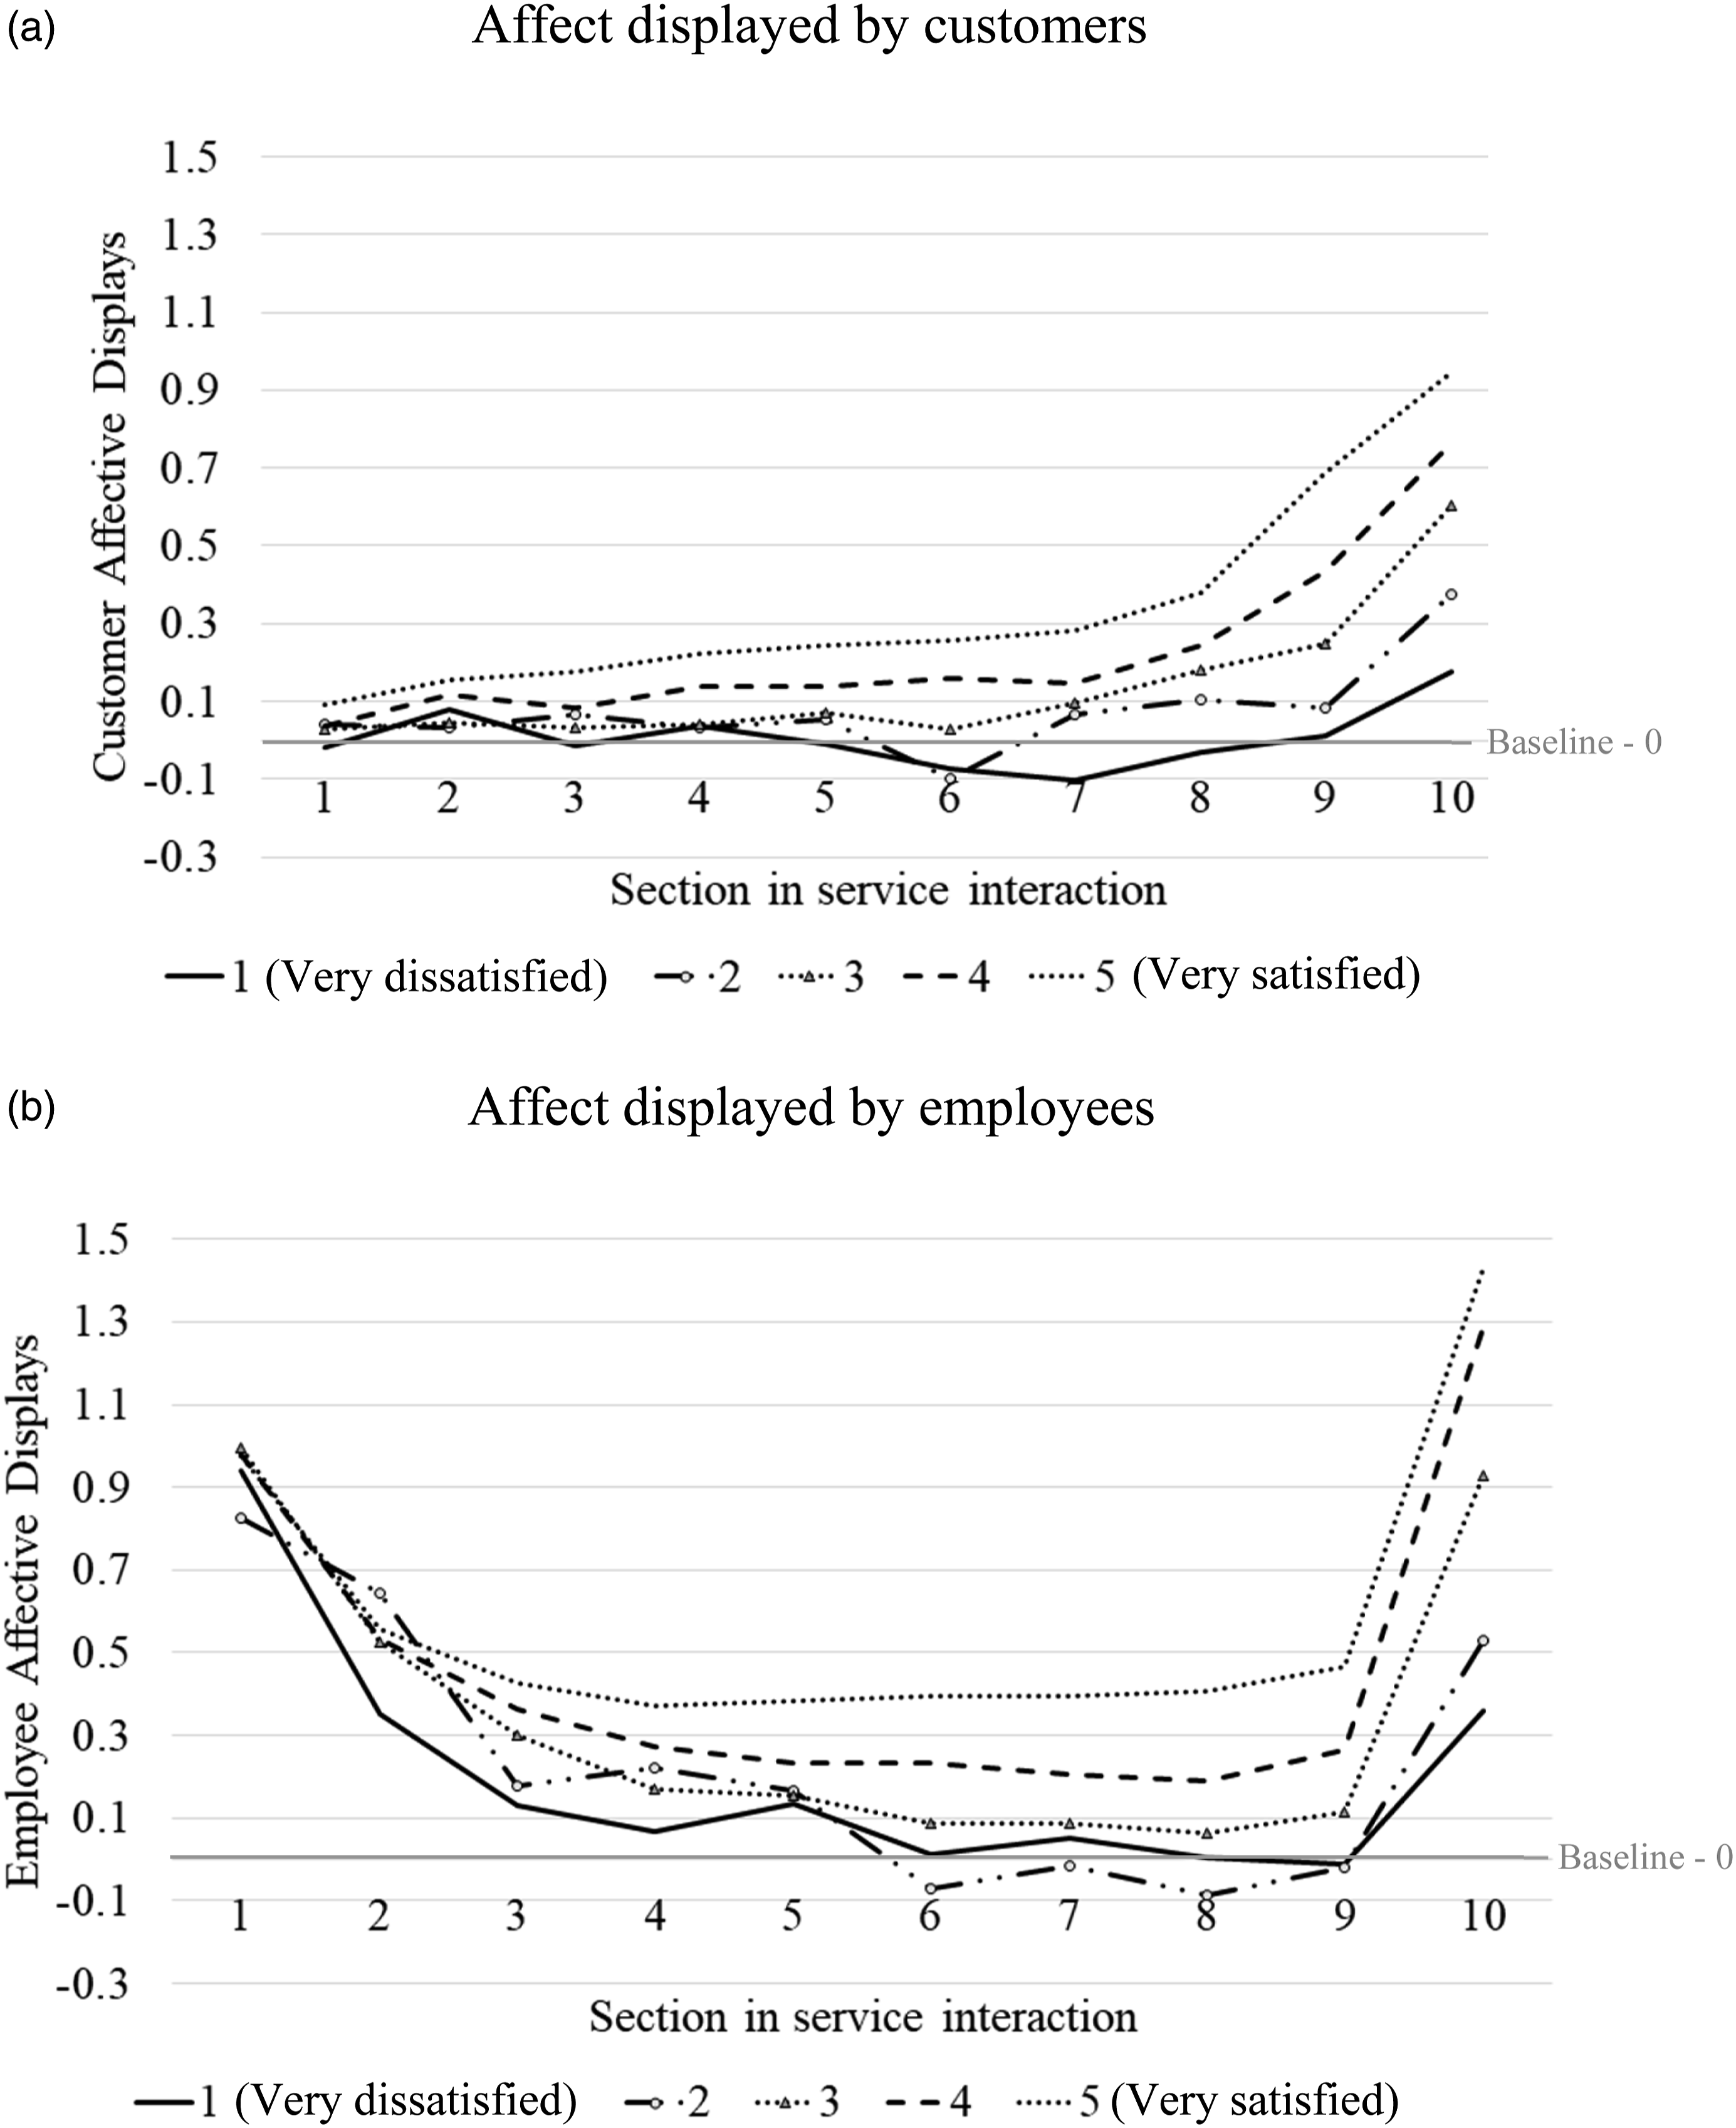
A visual inspection of Figure 2(a) shows that customers in general started their journey with neutral to marginally positive affective displays, but then larger divergences emerged for each level of post-encounter satisfaction as the service encounter unfolded. In particular, more satisfied customers displayed increasingly positive affect especially from the eighth decile onwards. Employees, on the other hand, started with a distinctly positive affective display (e.g., giving a “warm welcome”), and displays dropped during the middle of the service encounter, but then peaked again at the end (see Figure 2(b)). It seems, employees wanted to close the service encounter on a positive note. Service journeys that lead to higher customer satisfaction had more positive employee affective displays as the service encounter unfolded. In sum, Figure 2 provides initial support for our hypotheses and suggests that the customer and employee affective displays during a service encounter are good indicators for post-encounter customer satisfaction.
Descriptive Statistics, Intercorrelations, and Variance Inflation Factor.
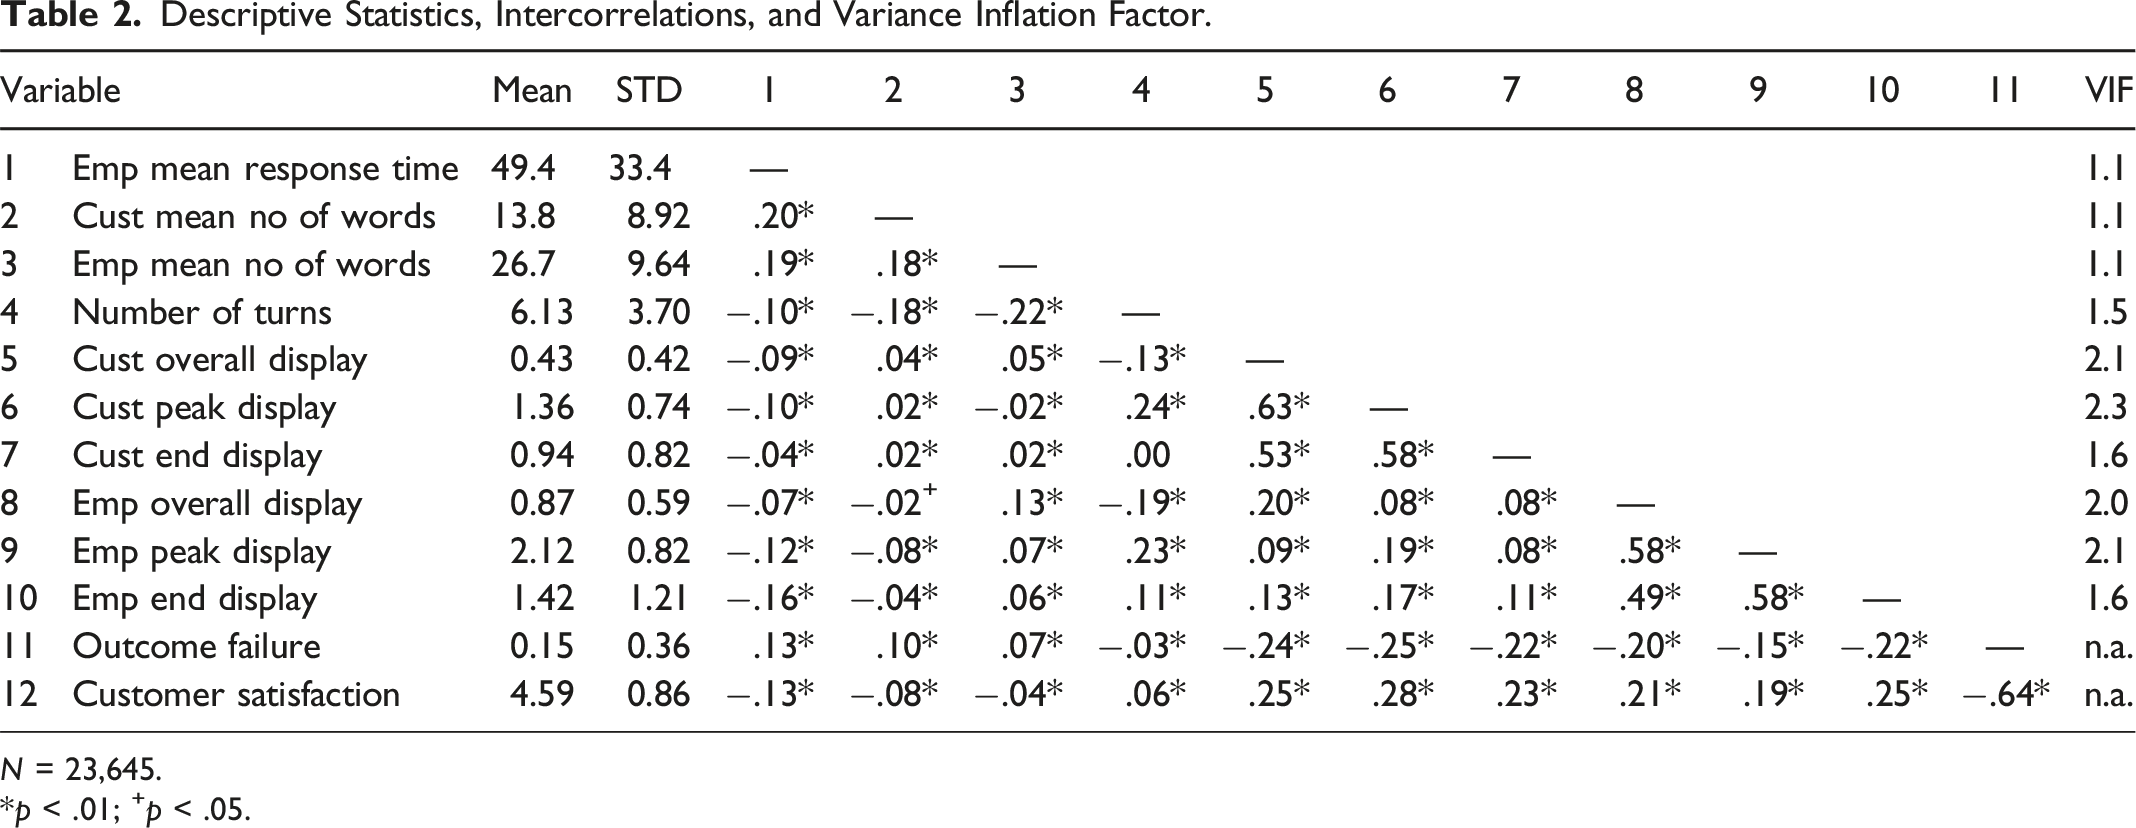
N = 23,645.
*p < .01; +p < .05.
Hypothesis Testing
Ordinary Least Squares Regressions Predicting Customer Satisfaction.
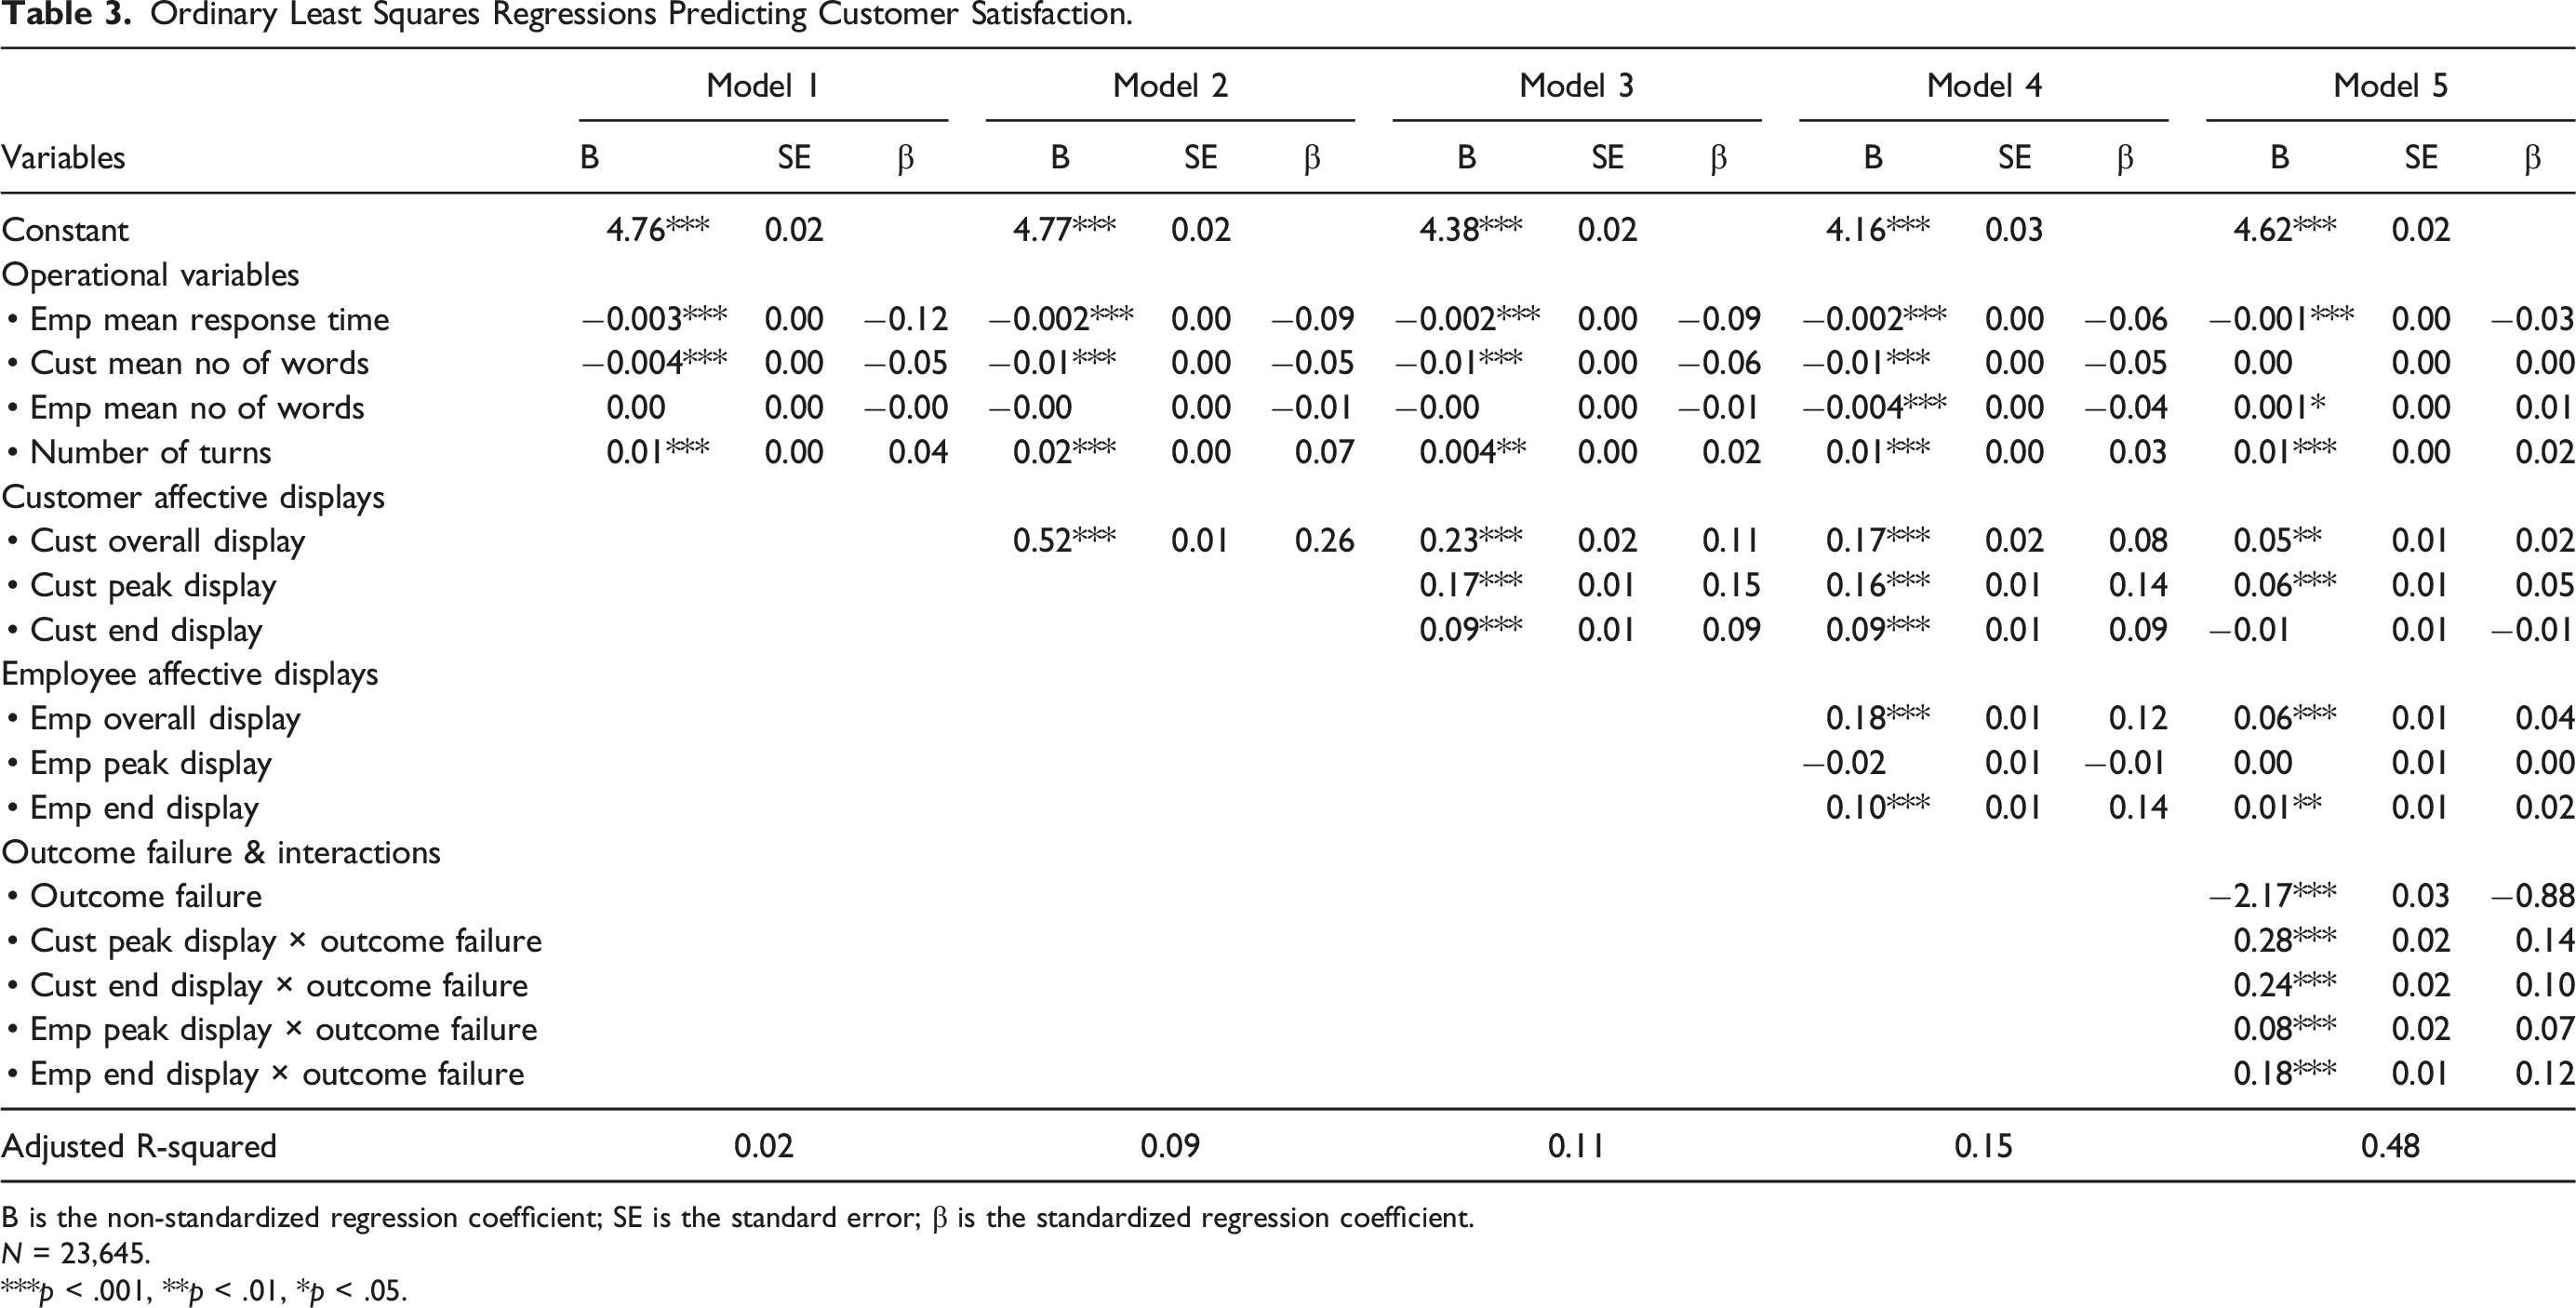
B is the non-standardized regression coefficient; SE is the standard error; β is the standardized regression coefficient.
N = 23,645.
***p < .001, **p < .01, *p < .05.
Practical Effects of Affective Displays on Customer Satisfaction.
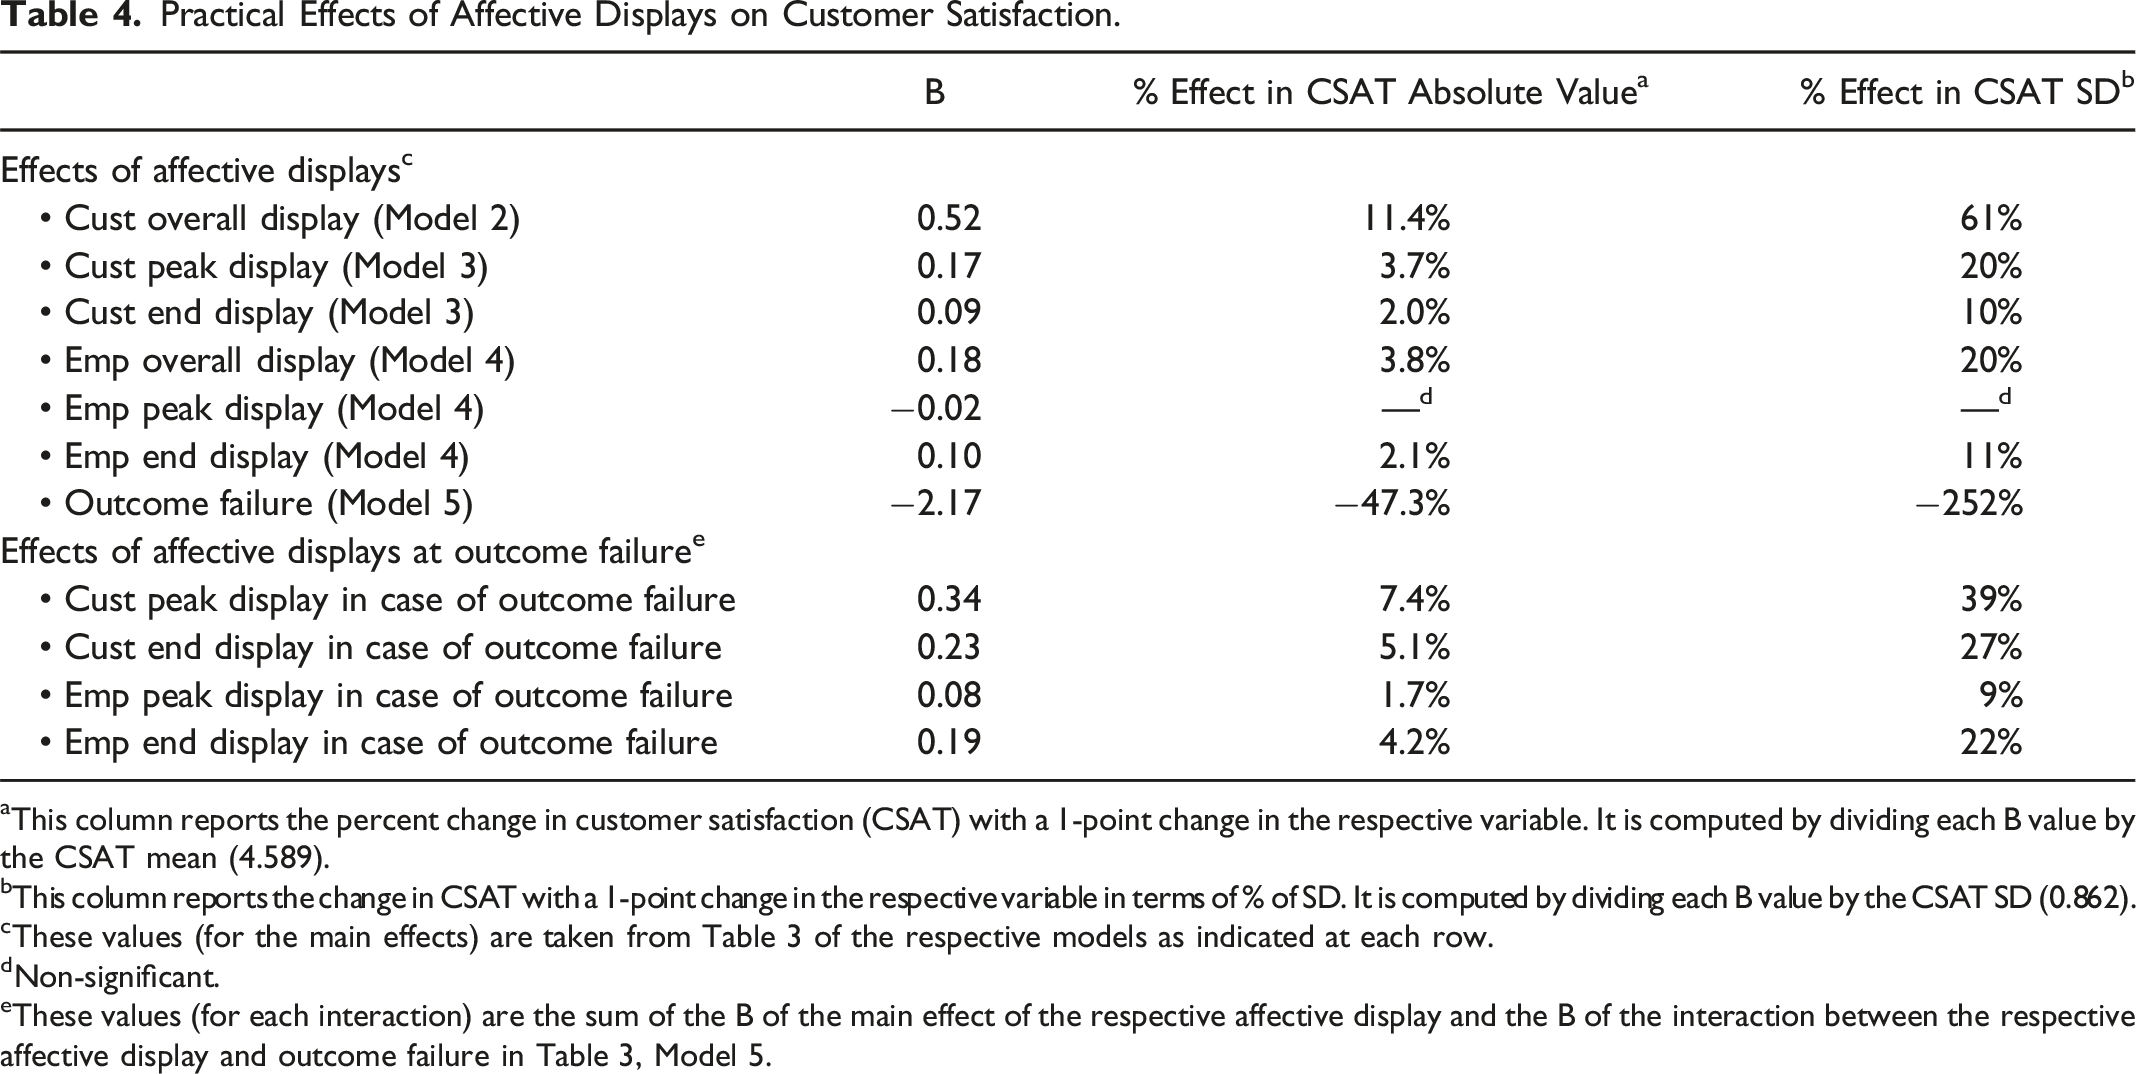
aThis column reports the percent change in customer satisfaction (CSAT) with a 1-point change in the respective variable. It is computed by dividing each B value by the CSAT mean (4.589).
bThis column reports the change in CSAT with a 1-point change in the respective variable in terms of % of SD. It is computed by dividing each B value by the CSAT SD (0.862).
cThese values (for the main effects) are taken from Table 3 of the respective models as indicated at each row.
dNon-significant.
eThese values (for each interaction) are the sum of the B of the main effect of the respective affective display and the B of the interaction between the respective affective display and outcome failure in Table 3, Model 5.
Controls and Customer Overall Affective Display
Model 1 in Table 3 includes all our control variables and demonstrates that the total contribution of the four operational control variables (i.e., employee response time, number of words in customer messages, number of words in employee messages, and number of turns) is relatively modest [Adj. R2 = 0.02]. Model 2 supports H1, which predicted that the overall customer affective display score positively predicts customer satisfaction (B = 0.52, SE = 0.013, p < .001) beyond the effects of the control variables as is evident by the adjusted R-square increase in Model 2 over Model 1 [Δ Adj. R2 = 0.06, F(1, 23,558) = 1,619.4, p < .001].
The results of Model 2 show that a 1-point increase in overall customer affective display increases customer satisfaction by 11.4%, which is 61% of the CSAT standard deviation (SD; see Table 4). Further, our results demonstrate that the contribution of the overall affective display to estimating customer satisfaction is three times larger than the contribution of the four operational control variables combined.
Customer Peak and End Affective Displays
Model 3 supports H2. It confirms that both customer peak and end display positively predict customer satisfaction (peak: B = 0.17, SE = 0.011, p < .001; end display: B = 0.09, SE = 0.011, p < .001), providing support for H2a and H2b, respectively. Peak and end affective display together explain additional variance in customer satisfaction over and above the customers’ overall affective display as is shown by the adjusted R-square increase from Model 2 to 3 [Δ Adj. R2 = 0.02, F(2, 23,556) = 285.3, p < .001].
The results of Model 3 show that a 1-point increase in the peak display is associated with a 3.7% increase of customer satisfaction, which is 20% of the CSAT standard deviation (SD); and a 1-point increase in the end display is associated with a 2.0% increase in customer satisfaction, which is 10% of the CSAT SD (see Table 4). These results provide further support that customer peak and end affective displays offer additional information for predicting customer satisfaction beyond what is conveyed by the overall displayed affect.
Employee Affective Displays
Model 4 adds the employee overall, peak, and end affective display variables (H4) as additional predictors of customer satisfaction. The results support H4a and H4c, whereby employee overall and end affective display scores are positive and significant estimators of customer satisfaction (overall: B = 0.18, SE = 0.012, p < .001; end display: B = 0.10, SE = 0.005, p < .001). However, unlike for customers, peak employee display on customer satisfaction was not significant, rejecting H4b (B = −0.02, SE = 0.009, p = .11). Together, overall and end employee affective displays explained additional variance in customer satisfaction over and above customer affective displays as evident by the significant increase in the adjusted R-square between Models 3 and 4 [Δ Adj. R2 = 0.04, F(3, 23,553) = 397.0, p < .001].
Furthermore, a 1-point increase in the overall employee affective display is associated with a 3.8% increase in customer satisfaction, which is 20% of CSAT SD (Table 4), and a 1-point increase in the end employee affective display is associated with a 2.1% increase in customer satisfaction, which is 11% of CSAT SD.
In summary, higher employee overall and end affective displays are associated with higher levels of customer satisfaction, but no such effect was found for peak employee display. More broadly, the analyses support our prediction that the affective displays of employees during a service encounter explain additional variance in post-encounter customer satisfaction beyond the indicators provided by the customer affective displays.
Outcome Failure
Model 5 tests the hypotheses that the effects of customer and employee affective displays in estimating customer satisfaction would be stronger in outcome failure situations (H3, H5). Hence, we examine how outcome failure would moderate the effects of customer and employee affective displays on customer satisfaction.
Not surprisingly, Model 5 shows that outcome failure has a large negative main effect on customer satisfaction (B = −2.17, SE = 0.031, p < .001). H3 advanced that the effects of customer affective displays in estimating customer satisfaction would be stronger in case of outcome failures and is supported by Model 5. 1 All interaction terms between outcome failure and customer affective displays are significant. Specifically, Model 5 shows that peak and end customer affective displays have larger positive effects on customer satisfaction in the outcome failure group (B = 0.28, SE = 0.02, p < .001 and B = 0.24, SE = 0.017, p < .001, respectively). In the event of an outcome failure, a 1-point increase in the peak and end customer affective display is associated with a 7.4% and 5.1% increase in customer satisfaction, respectively (which represents 39% and 27% of the CSAT SD, respectively; Table 4), providing further support for H3.
The results of the employee affective displays are consistent with those of customer affective displays. As predicted in H5, the effects of employee peak and end displays are stronger in the outcome failure group (peak: B = 0.08, SE = 0.015, p < .001; end display: B = 0.18, SE = 0.011, p < .001). A 1-point increase in the peak and end employee affective display in the service failure encounter is associated with a 1.7% and 4.2% increase in customer satisfaction, respectively (which represents 9% and 22% of the CSAT SD, respectively; Table 4).
Furthermore, Model 5 shows that adding outcome failure significantly improves the model fit over Model 4 [Δ Adj. R2 = 0.33, F(5, 23,548) = 2,951.5, p < .001], proving further support that service failure is an important variable to add to the model.
Finally, to compare the effects of the different affective display variables, we included the standardized coefficients (β) in Table 3. In Model 5, we see that outcome failure has the largest effect, and that in outcome failure encounters customer and employee affective displays provide additional and substantial information, as hypothesized, for estimating customer satisfaction. Thus, assessments of both customer and employee affective information during a service encounter provide an important benefit for approximating post-encounter customer satisfaction. These findings support our theory that customer satisfaction ratings can be estimated by customer and employee affective cues, especially so in service failure situations.
Discussion
Our study contributes to theory by showing the applicability of the combined affect-as-information theory and the peak and end model of affect to the service encounter context and their ability to estimate customer satisfaction. Using a large-scale dataset of real customer–service employee interactions, we show that assessments of affective dynamic displays of both customers and employees provide expeditious insight into customer satisfaction after a service encounter. We discuss the theoretical and managerial implications next.
Theoretical Implications
Customer Affective Displays
The affect-as-information theory holds that people’s feelings comprise valuable information on which they rely on when making judgments (Clore, Gasper, and Garvin 2001; Schwarz 1990). We build on this theory and show that affective displays are a proxy of customer feelings; they may not precisely reflect what a customer feels but can serve as a useful indicator of customer affect during a service encounter. Thereby, we show that rather than asking customers about their feelings, we can assess the emotion they display and use it as predictive information. This is novel as extant research focused on felt affect and did not consider displayed affect (Clore, Gasper, and Garvin 2001; Schwarz 1990). As such, our findings extend the affect-as-information theory to the field of frontline service by showing that assessments of affective customers’ displays during a service encounter can be used to predict their post-encounter satisfaction.
Furthermore, past work on affect-as-information primarily focused on one-point reports or overall affect and did not consider the dynamics of affect at it evolves in an experience (e.g., Schwarz 1990; Clore, Gasper, and Garvin 2001). In contrast, we use a more finely grained approach that draws not only on customers’ overall affective display but also on the dynamics throughout a customer journey. To do this, we extend the affect-as-information theory by integrating the dynamic effects of the peak and end model of displayed affect (Ariely and Carmon 2000, 2003; Fredrickson and Kahneman 1993). Integrating these two theories, we show that the dynamics of emotions within a person’s experience offers important insight into the person’s assessments. In particular, customer’s the peak (i.e., most positive or least negative) and end (i.e., final) displayed affect are uniquely informative and explain customer satisfaction beyond the explanation offered by a customer’s overall or average affective displays.
Employee Affective Displays
Our analyses provide novel insight into the merit of considering affective displays of both partners to a service encounter, adding employees who are co-creators of service and are integral participants in service encounters (e.g., Dallimore, Sparks, and Butcher 2007; Grönroos and Voima 2013; Daw et al. 2023). Our findings extend the influence of frontline employees, showing that their affective displays offer additional information about customer satisfaction above and beyond the information provided by customer affective displays.
Furthermore, previous research examined one-time or aggregated measures of employees’ affective displays on customer satisfaction (e.g., Barger and Grandey 2006; Lin and Lin 2011; Pugh 2001; Tan, Foo, and Kwek 2004; Tsai 2001; Tsai and Huang 2002). We add to this important line of research the effects of nuances of displays in a service encounter. We demonstrate separate and distinct effects of overall and end affective displays. Our work thus adds the “texture” of employee displays in a service encounter as a useful source for predicting post-encounter customer satisfaction. This finding also refines prevailing theory about emotional display requirements of service employees. We highlight the unique importance of employee displays in specific points within an interaction—notably the end of the service encounter—rather than the general affect displayed which was the focus of previous research (Grandey 2003, 2015; Grandey et al. 2010; Rafaeli and Sutton 1987).
Finally, we contribute novel insights to research on the peak and end model by connecting it to service delivery and by considering dyadic (rather than within person) effects. Previous research on the peak and end model referred primarily to within-person (intrapersonal) effects (see Jiang, Yin, and Liu (2019) for a rare exception, which is unrelated to service delivery). In contrast, we show the explanatory power of a service employee’s end display on a second person’s (customer’s) overall evaluation.
In sum, our findings show that employee affective displays can compensate for some of the limitations of observing customer affect and are uniquely indicative for estimating post-encounter customer satisfaction, beyond the predictive power of customer affective displays.
Affective Displays in Service Failure Situations
Our work offers a connection between affective displays and outcome service failure. Extant research showed that customers display more intense emotions in service failure than non-failure situations (Grègoire, Laufer, and Tripp 2010). We integrate these findings with the affect-as-information and peak-end models and confirm that customers’ mean, peak, and end affective displays are more indicative of customer satisfaction when customers’ issues are not resolved. In such situations, customers experience disconfirmation-of-expectations (Oliver 1980) and thus display more intense affective cues (Grègoire, Laufer, and Tripp 2010), which in turn are important predictors of satisfaction. We extend this logic to employees and confirm that they too display stronger emotions in failure situations that explain additional insight into customer satisfaction. That is, we find that the predictive power of affective displays of both customers and employees is more pronounced in service failure than in non-failure encounters.
Managerial Implications
Affective Displays as Source of Information
Our study reveals a shortcut option for gaining expeditious insight into customer satisfaction and offers an approach that can be used for immediate, automatic, large-scale monitoring of customer satisfaction. Through automated assessments of customer and employee affective displays, service managers can obtain swift insights about the quality of their organizational service interactions. Current practices for assessing customer satisfaction take considerable time (Wirtz and Tomlin 2000). Our models and methods offer a way to obtain insights immediately after an interaction ends, for every single service encounter. Moreover, these methods allow analyses of large-scale datasets without being overly burdensome, labor-intensive, time-consuming, and costly. In the current study, we were able to analyze 23,645 service interactions and measure customer and employee affective displays in 301,280 messages. As our analyses show, this in-depth look into a wide spectrum of interactions offers a refined picture of text-based service delivery.
Our research demonstrates the utility and versatility of novel tools for studying affective features of service encounters (see also Rafaeli et al. 2017; Altman et al. 2021). The finely grained automated sentiment analysis technology (Birjali, Kasri, and Beni-Hssane 2021; Serrano-Guerrero et al. 2015) can offer insights into affective dynamics (i.e., including peak and end affective displays as used in our study) of both customer and employees. Our approach differs in important ways from the sentiment analyses typically done in social media review contexts (e.g., Almuqren and Cristea 2022; Botchway et al. 2019). The latter typically assess average affect of customers reports, and do not capture nuanced dynamics within a service interaction itself. Furthermore, our findings emphasize the importance of including affective displays of both customers and frontline employees in such assessments.
Improved Monitoring of Affective Displays in Service Encounters
Service managers typically monitor operational indicators, such as employee speed of response time and number of turns for completing a service encounter. Indeed, these are important operational features of service interactions. However, we show that routine assessments of affective displays within interactions are better predictors of customer satisfaction than operational features, especially in the important case of outcome service failure.
Moreover, our method offers managers a way to obtain estimates of customer satisfaction immediately upon completion of an interaction, allowing managers to identify dissatisfied customers who may not necessarily complain, and firms could potentially take corrective action swiftly to avoid an escalation of customer dissatisfaction (Gelbrich and Roschk 2011; Orsingher, Valentini, and de Angelis 2010).
Furthermore, clearly, service failure is a strong indicator of customer satisfaction, and employees need to try their best in solving customer problems. Monitoring customer affective displays may help to prevent service failures, so long as employees take preventive action upon identifying low affect levels among customers. Ideally, employees would monitor the affective displays of customers throughout the entire interaction, while also working to address customer needs and provide efficient service. However, frontline service work is complex (Subramony et al. 2021), and employees can easily overlook the task of affective display monitoring given the pressures put on them to deliver quick service. However, our results suggest affective cues are more important than employee response time. Thus, managers should encourage employees to invest more time and effort in monitoring their customers’ and their own affective displays, even at the cost of slower response times. To do this, visual cues could be implemented on employee dashboards that are automatically generated by sentiment analysis. They can provide real-time and easy to read “emotion thermometers” for both customers and employees. Indeed, our industry partner started to experiment with such cues on its service platform.
Employee Management and Training
The traditional “service with a smile” mantra implies that service employees must generally display positive affect (Grandey et al. 2010). Our findings confirm that display of general positive affect during a service encounter and the end display are associated with higher customer satisfaction. As such, we suggest that managers should use sentiment analysis to analyze and monitor the level of employee affect during interactions with a specific emphasis on the end displays as part of their quality management. This finding also supports recommendations to train front-line service employees to display positive affect with a special emphasis on ending encounters on a positive note.
Limitations and Further Research
Limitations
Naturally, there are several limitations to our study. First, the sentiment analysis tool we used could only identify some (but, not all) affective displays (e.g., Yom-Tov et al. 2018) and could not identify discrete emotions (e.g., anger, disappointment, surprise, or delight). Furthermore, we test our theory on text-based service encounters using only textual-based affective displays which means that the displays examined did not include verbal and nonverbal affective displays (e.g., facial expression, posture, and eye gaze). Yet, we believe our findings are also relevant to verbal affective displays and affective displays in face-to-face service encounters, as both the affect-as-information and the peak-end theory were proved relevant in other contexts (e.g., Clore, Gasper, and Garvin 2001; van den Bos 2003). Furthermore, these limitations in observing a wider range of affective displays also means that the effects we report are conservative tests of our hypotheses, suggesting that actual effects—if we could assess more types of affective displays—would likely be much stronger. Nonetheless, these limitations call for further research. As new sentiment analysis tools are being developed, the accuracy of assessing different types of affective displays and specific emotions are likely to improve (Heitmann et al. 2023), enabling future research to test our theory with a wider range of affective display types and with discrete emotions.
Second, the complexity of customer issues and their previous experiences with the company—which we could not code in the data that we received—might have also affected their satisfaction. To partially overcome this limitation, we controlled for measures that might account for issue complexity, including response time, length of customer and employee messages, and the number of turns required to complete an interaction. The question remains how operational factors and affective displays influence one another and whether they are interacting in predicting customer satisfaction. We hope that future research will use advanced automated methods that are being developed (Banks et al. 2018; Short, McKenny, and Reid 2018) to unveil the full spectrum of information available in service interactions.
Our study offers directions for further research related to the immediate topic of predicting customer satisfaction and to areas that are distinct from our context. We discuss these next.
Further Improving the Prediction of Customer Satisfaction
Based on both the novel methodological contributions of the current research, we offer some questions for future research. Specifically, our findings highlight that the integration of salient (i.e., peak) and final moments of an interaction have powerful effects on customer satisfaction. While this finding is theoretically supported by the combination of affect-as-information and peak-end model, it opens new questions regarding the process of creating customer satisfaction. An open question remains as to whether the overall, peak, and end effects may somehow interact to mitigate or strengthen satisfaction. 2 For example, our findings suggest that an extremely positive ending by the employee is likely to elevate subsequent satisfaction; but our analysis does not tell whether it might make an employee’s overall pleasant affect less important. Similarly, a very negative moment within an interaction might lead customers to ignore all other more positive moments.
Furthermore, what other dynamic textual indicators (e.g., specific techniques for addressing customer complaints like apology or compensation) might be indicative of customer satisfaction? We are hopeful that our methods and findings will inspire future research that will use text analysis to disentangle such complexities.
Extending the Study’s Findings to Related Fields
The novel contributions of the current study can extend to avenues for future research that are quite distinct from what we have examined in this paper. First, our work suggests new directions for related literature regarding emotional labor. Previous work on employee emotion displays (cf. Rafaeli and Sutton 1987; Tsai and Huang 2002; Pugh 2001), largely argued an influence of employees' affect displays on customers through a process of contagion (cf. Pugh 2001) or directly (cf. Barger and Grandey 2006). Such work relied on observers’ coding of employee emotion displays with a specific focus on employee smiles. Our work extends such findings substantially by showing the informativeness of all employee emotion displays. It also suggests that research on employee emotional labor should extend from observing overall emotional display to their dynamics.
Second, further studies can explore the use of the data, tools, and affective display analysis for predicting other aspects of consumer responses. For example, are specific affective displays and dynamic changes therein also indicative for predicting performance measures such as sales, cross-selling, and upselling? However, using such sophisticated customer affective display analysis may also cross ethical boundaries when customers are analyzed, predicted, influenced, nudged, and manipulated without being aware and for the profit motive of the organization. Corporate digital responsibility guidelines will be needed to safeguard customer wellbeing when affective display and more sophisticated analytical tools are deployed in the service frontline (Wirtz et al. 2023).
Overall, we are excited to have introduced affect-as-information theory to the service encounter and managed to establish that using dynamic affective customer and employee displays explain customer satisfaction and can be used to monitor service quality in real-time. We hope that our article together with the increasing power of analytical tools will yield impactful future research on this topic.
Footnotes
Acknowledgments
We thank LivePerson Inc. for providing data for this research; to Ella Nadjharov, Igor Gavako, the dedicated team of the SEELab at the Technion, for managing the data resources and preparing them for research.
Declaration of Conflicting Interests
The author(s) declared no potential conflicts of interest with respect to the research, authorship, and/or publication of this article.
Funding
The author(s) disclosed receipt of the following financial support for the research, authorship, and/or publication of this article: This research was partially supported by the Israel Science Foundation (Grant No. 336/19) and Deutsche Forschungsgemeinschaft (KR 4492/2-1).