
Abstract
In this article, the authors demonstrate a tendency among consumers to use the arithmetic mode as a heuristic basis when drawing inferences from graphical displays of online rating distributions in such a way that service evaluations inferred from rating distributions systematically vary by the location of the mode. The rationale underlying this phenomenon is that the mode (i.e., the most frequent rating which is represented by the tallest bar in a graphical display) attracts consumers’ attention because of its visual salience and is thus disproportionately weighted when they draw conclusions. Across a series of eight studies, the authors provide strong empirical evidence for the existence of the mode heuristic, shed light on this phenomenon at the process level, and demonstrate how consumers’ inferences based on the mode heuristic depend on the visual salience of the mode. Together, the findings of these studies contribute to a better understanding of how service customers process and interpret graphical illustrations of online rating distributions and provide companies with a new key figure that—aside from rating volume, average ratings, and rating dispersion—should be incorporated in the monitoring, analyzing, and evaluating of review data.
Over the past two decades, the way service customers inform their decisions has fundamentally changed. While in the past, people were reliant on the quality of frontline employees’ advice or recommendations from their peers, they can now share, with anyone, their experiences and opinions about services, companies, and brands on a variety of websites and review platforms such as TripAdvisor, Yelp, and Google. As a consequence, customers can easily access numerous online reviews at the click of a mouse. For example, TripAdvisor’s website offers more than 830 million reviews covering about 8.6 million accommodations, airlines, attractions, and restaurants to 460 million unique users per month (TripAdvisor 2019). Due to their enormous popularity, online reviews have become highly influential in driving sales and other performance metrics in today’s service industry (for a meta-analysis, see Floyd et al. 2014). For instance, Luca (2011) finds that a one-star increase in a restaurant’s average Yelp rating leads to a roughly 9% increase in revenue.
On many review websites, a common practice to inform prospective customers about the evaluations from previous customers is to illustrate the distribution of rating scores through graphical formats, typically via bar charts, wherein each bar represents the number of votes a specific rating score has received. Although a broad body of literature has been devoted to acquiring insights into consumers’ response to different characteristics of rating distributions (for an overview, see Babić Rosario et al. 2016), our knowledge of the effects of distribution characteristics beyond average ratings (e.g., Chevalier and Mayzlin 2006; Dellarocas, Zhang, and Awad 2007; Godes and Mayzlin 2004), dispersion of rating scores (e.g., He and Bond 2015; M. Sun 2012; Zhang 2006), and rating volume (e.g., Liu 2006; Moe and Trusov 2011; Zhu and Zhang 2010) is still limited. Extending previous research on the impact of online ratings, the present work investigates how customers’ interpretations of rating distributions are affected by the location of the arithmetic mode; that is, the rating score that has received the largest number of votes and, therefore, the most salient element in graphical visualizations of rating distributions. We argue that consumers tend to use the mode as a heuristic basis when making inferences in such a way that evaluations inferred from rating distributions systematically vary by the location of the mode—a phenomenon we refer to as the mode heuristic.
The contribution of this research is of equal relevance from both perspectives, theoretical and managerial. First, this article complements extant knowledge about the consequences of different rating distribution characteristics by placing a largely neglected feature under scrutiny. Although prior research suggests that the mode might play a role in consumers’ interpretations of rating distributions (Fisher, Newman, and Dhar 2018; see also Fisher and Keil 2018; Ibrekk and Morgan 1987), it is still unclear how, when, and why consumers’ evaluations of online ratings are affected by the mode. Second, by establishing the mode of rating distributions as an important parameter in consumers’ interpretations of online ratings, we provide service firms with a new key figure that—aside from rating volume, average ratings, and rating dispersion—should be incorporated in the monitoring, analyzing, and evaluating of review data. Third, by demonstrating that the modal rating serves as a heuristic cue, we also contribute to prior research that has reported systematic biases in the manner in which people process graphical illustrations of information (e.g., Cleveland and McGill 1984; Hutchinson, Alba, and Eisenstein 2010; Jarvenpaa 1990; Lewandowsky and Spence 1989; Raghubir and Das 2010).
The rest of this article is organized as follows: We begin by reviewing previous research on consumers’ responses to different characteristics of rating distributions. We then outline insights into how people process graphical visualizations of information like the bar charts that online platforms typically use to aggregate and summarize customer ratings (e.g., TripAdvisor, Google Reviews) and apply them to the present research to derive the mode heuristic hypothesis. Then, we report the results of a series of eight studies that demonstrate how consumers’ interpretations of rating distributions are affected by the location of the mode. We conclude with a discussion of theoretical contributions, managerial implications, and future research directions.
Conceptual Background
Consumers’ Response to Different Characteristics of Rating Distributions
Just as any other distribution, distributions of customer ratings can be summarized by a variety of descriptive statistics such as frequencies of rating scores, measures of location (e.g., mean, mode, and median), measures of variability (e.g., standard deviation and variance), and measures of shape (e.g., skewness and kurtosis). Given the great popularity of online reviews, it is hardly surprising that a broad body of literature has been devoted to acquiring insights into how consumers respond to different statistical features of rating distributions.
Most of this research concentrates on the effect of review valence revealing that higher average ratings are associated with favorable outcomes reflected in, for instance, higher purchase intentions, better sales ranks, revenues, and future ratings (e.g., Chevalier and Mayzlin 2006; Chintagunta, Gopinath, and Venkataraman 2010; Clemons, Gao, and Hitt 2006; Dellarocas, Zhang, and Awad 2007; Godes and Mayzlin 2004; Liu 2006; Zhu and Zhang 2010). Interestingly, this relationship has been found to depend on brand strength, such that the positive effect associated with higher average ratings is more pronounced for weak brands rather than for strong brands (Ho-Dac, Carson, and Moore 2013; Luca 2011). In addition, a number of studies have examined the influence of review volume (i.e., the number of ratings) on sales and related performance figures, albeit with mixed results. Several studies have revealed a positive effect of the number of ratings (e.g., Chevalier and Mayzlin 2006; Dellarocas, Zhang, and Awad 2007; Liu 2006; Moe and Trusov 2011; M. Sun 2012; Zhu and Zhang 2010), while others could not support this relationship (Chintagunta, Gopinath, and Venkataraman 2010; Clemons, Gao, and Hitt 2006). In addition to review valence and volume, some studies have focused on the impacts of rating dispersion in terms of the variance or standard deviation of rating distributions—reflecting the degree of consensus among reviewers’ judgments. However, findings on these distribution characteristics are notably ambiguous; they range from positive (e.g., Clemons, Gao, and Hitt 2006; Lu, Ye and Law 2014; Moe and Trusov 2011) and nonsignificant (e.g., Chen, Liu, and Zhang 2011; Chintagunta, Gopinath, and Venkataraman 2010; Zhang 2006) to negative effects (e.g., Bao and Chang 2014; Hu et al. 2010; Moon, Bergey, and Iacobucci 2010; Zhu and Zhang 2010; see also He and Bond 2015, for an overview). The effects of dispersion have been shown to vary by consumers’ prior expectations (Park and Park 2013) and need for self-expression (Rozenkrants, Wheeler, and Shiv 2017), as well as by product type (He and Bond 2015; Langan, Besharat, and Varki 2017; Park and Park 2013). For instance, He and Bond (2015) found that consumers are more tolerant of dispersion in taste-dissimilar domains (e.g., paintings or music albums) than in taste-similar categories (e.g., desk lamps or flash drives). Finally, a few studies have documented interaction effects between the described distribution characteristics (Chintagunta, Gopinath, and Venkataraman 2010; Khare, Labrecque, and Asare 2011; Kostyra et al. 2016; M. Sun 2012; Watson, Ghosh, and Trusov 2018). For example, Khare, Labrecque, and Asare (2011) reported that the positive effect of review valence is enhanced by rating volume, while M. Sun (2012) found that an increasing dispersion has a positive effect on sales if and only if the average rating is low (see also Khare, Labrecque, and Asare 2011; Kostyra et al. 2016).
In summary, although a great deal of research has studied consumers’ response to different characteristics of rating distributions, insights beyond the effects of rating volume, valence, and dispersion as well as their interactions are still scarce. In the next section, we draw from extant research on how people process graphical formats like the bar charts used by review websites to display the distribution of online ratings in order to demonstrate that consumers’ response to such illustrations can be crucially affected by their visual appearance.
People’s Interpretations of Graphical Displays and the Role of Visual Salience
Similar to aggregated illustrations of individual rating scores by means of bar charts used by a variety of review platforms, graphical visualizations of information are ubiquitous in our daily lives. For instance, graphics, such as bar and pie charts, as well as line graphs, are commonly used in reporting election results, visualizing weather forecasts, communicating health risks, or illustrating the development of stock prices. Unsurprisingly, research on people’s interpretations of such visualizations has a long tradition, generally highlighting the usefulness of graphics as opposed to simple alphanumeric representations (for a review, see Lipkus 2007; Shah Freedman, and Vekiri 2005; Spiegelhalter, Pearson, and Short 2011; or Visschers et al. 2009). However, although graphical formats allow quick insights into the visualized data, the manner in which people process and interpret graphical information can be systematically biased (Cleveland and McGill 1984; Hutchinson, Alba, and Eisenstein 2010; Lewandowsky and Spence 1989; Lurie and Mason 2007; Pinker 1990; Raghubir and Das 2010; Simkin and Hastie 1987). For instance, Spence (1990) found that graphical displays tend to be processed faster but less accurately than their alphanumeric counterparts.
Extant research (e.g., Hegarty, Canham, and Fabrikant 2010; Ibrekk and Morgan 1987; Jarvenpaa 1990; Raghubir and Das 2010) suggests that conveying information graphically may enhance the visual saliency of certain aspects and, thereby, affects the order and extent to which informational items are attended and integrated, leading to an overemphasis of more salient and underweighting of less salient information. For instance, in one of their studies on potential differences in risk avoidance when communicating health risks via graphs or alphanumeric displays, Stone, Yates, and Parker (1997; see also Stone et al. 2003) found that participants were willing to pay a significantly higher price for an improved toothpaste, with a reported likelihood of gum disease of 15 of 5,000 people, relative to a standard toothpaste, with 30 of 5,000 people affected by gum disease, when the chances of developing the disease for both alternatives were displayed as a bar chart, making the risk differences between the two alternatives more perceptually salient. In a similar vein, Y. Sun, Li, and Bonini (2010) documented that altering the distance between two data points in a graph by simply stretching a chart’s axis increased the relative importance of the plotted attribute. In addition, a study conducted by Weber and Kirsner (1997) revealed that decisions between gambles can be biased toward elements of a bar chart representing possible payoffs that were highlighted in a darker color.
While prior research consistently demonstrates that people’s interpretations of graphical formats are biased toward more salient graphical features (e.g., visual properties in terms of physical size or color), it is still unclear whether statistical features of distributions (e.g., mean, variance, or mode) become more salient when presented graphically and, thus, affect graph comprehension according to the salience principle as well. In the next section, we present our rationale for why consumers’ inferences from graphical displays of online rating distributions might be affected by a distribution’s modal rating.
The Mode Heuristic
It is well known that individuals are typically unable to process all relevant information when forming judgments or arriving at decisions. Instead, they tend to base their judgments on simple cues or rules of thumb that facilitate the evaluation process (see Gilovich, Griffin, and Kahneman 2002, for an extensive review). The use of such heuristics often leads to an inappropriate weighting and integration of available informational cues. For instance, people’s judgments have been found to be disproportionally affected by the first piece of information acquired (Tversky and Kahneman 1974), information that is easy to retrieve (Reyes, Thompson, and Bower 1980; Tversky and Kahneman 1973), or—as described above—information that is most perceptually salient.
Because visually salient information is more likely to be attended and acquired (e.g., Janiszewski 1998; Milosavljevic et al. 2012; Parkhurst, Law, and Niebur 2002), we assume people’s inferences drawn from the bar charts that review platforms typically use to summarize customer ratings might be biased toward the tallest and, thus, presumably the most salient bar within the graph, namely, the bar of the distribution’s mode. By way of illustration, consider the rating distributions of two Parisian hotels displayed in Figure 1. The two distributions have a similar average rating (MA = 3.15 vs. MB = 3.13 on a 5-point scale, where higher ratings are more favorable), standard deviation (SDA = 1.22 vs. SDB = 1.02), and number of ratings (NA = 226 vs. NB = 192). However, they differ in terms of the location of the mode: The mode of Distribution A is 3, while the mode of Distribution B is 4.
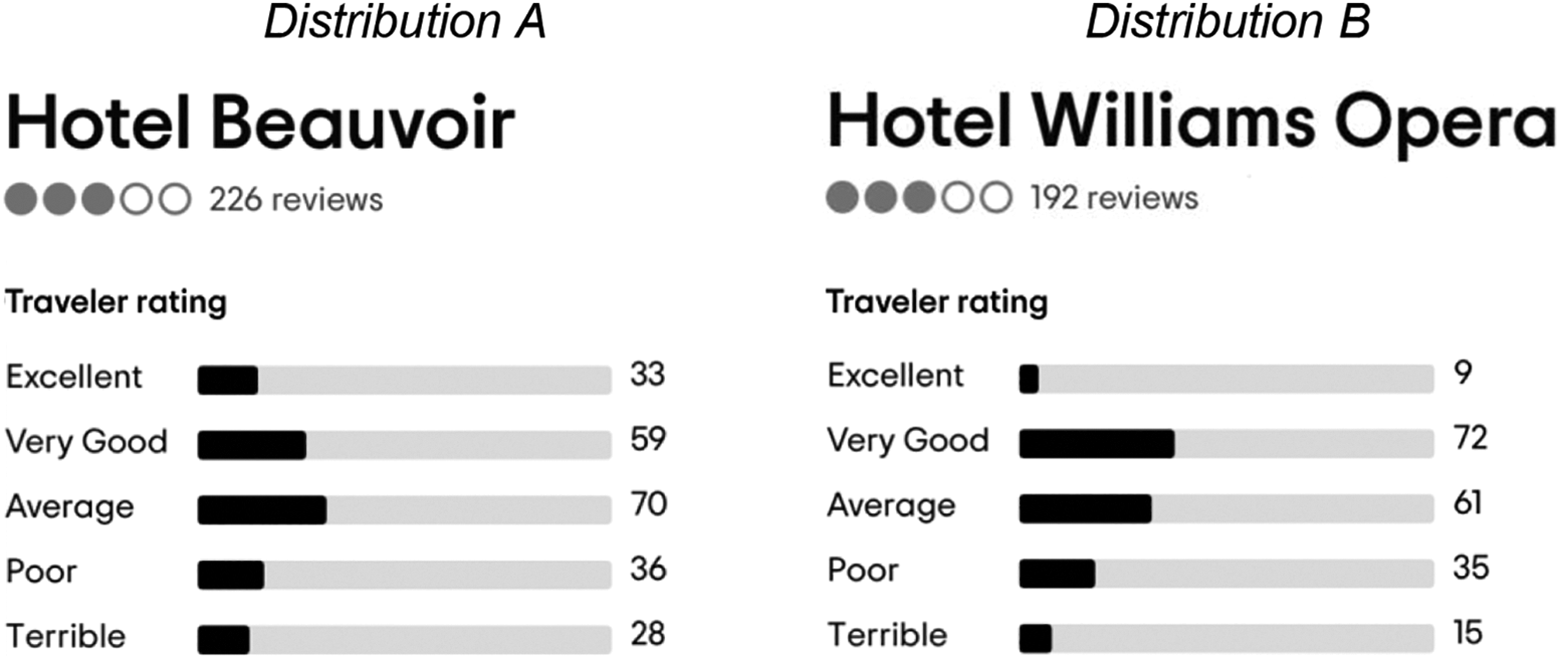
Two exemplary rating distributions from TripAdvisor. Source. Retrieved January 18, 2021, from http://www.tripadvisor.com
According to our postulate, people might be prone to use the mode as a heuristic basis when drawing inferences, such that evaluations inferred from the two illustrated distributions systematically diverge. More precisely, since the mode is the tallest bar, it may attract consumers’ attention more easily than the other bars and thus might be most influential when people form an overall impression of the reviewed hotel. Since the mode of Distribution B directs consumers’ attention to more favorable evaluations (i.e., four out of five points) than the mode of Distribution A (i.e., three out of five points), inferences derived from Distribution B should be more favorable than those derived from Distribution A. We refer to the tendency to disproportionally weight the mode when drawing conclusions from rating distributions as the mode heuristic.
Empirical Approach
In the series of eight studies reported in this article, we provide convergent evidence of the existence of the proposed mode heuristic. More precisely, in Study 1, we demonstrate that consumers’ service inferences from graphical displays of rating distributions are affected by the location of the mode in the predicted manner, while interpretations of alphanumeric representations of rating distributions are not influenced by the modal rating. Study 2 examines the mode heuristic at the process level by investigating the mediating role of consumers’ focus of attention when processing graphical (vs. alphanumeric) summaries of customer ratings. Studies 3 and 4 provide further evidence of the proposed attention account by showing that the impact of the mode on consumers’ inferences drawn from rating distributions is a function of the mode’s visual salience. In Studies 5a and 5b, we explore whether the mode heuristic also manifests in service customers’ preferences and choices between different alternatives. In Study 6, we investigate consumers’ reliance on the modal rating from a different angle by examining the implicit utility associated with different rating distributions in the presence of other service attributes (e.g., price) using a choice-based conjoint exercise. Finally, in Study 7, we rule out that other distribution characteristics that are typically strongly related to a distribution’s mode (i.e., skewness and median) can account for the observed effects. In addition, in three ancillary studies reported in Web Appendixes A–C, we demonstrate that consumers’ response to the two exemplary real-world rating distributions shown in Figure 1 is consistent with the proposed mode heuristic (ancillary Study 1), examine whether the effect of the modal rating in consumers’ interpretations of rating distributions is robust across different levels of rating dispersion (ancillary Study 2), and explore whether it is conditioned by the presence of numerical frequency information (i.e., the number of votes each rating score has received; ancillary Study 3).
Study 1
The purpose of Study 1 was to provide first evidence of the proposed mode heuristic by examining consumers’ service evaluations inferred from graphical displays of rating distributions as well as in situations where the frequency of each rating score is presented only alphanumerically (i.e., without graphical support). If the integration of the mode is indeed a function of its visual salience as we predicted, then the effect of the mode’s location on consumers’ inferences should be stronger under graphical than under alphanumeric conditions.
Method
Two hundred seventeen students (Mage = 21.3 years, 43.3% female) participated in this study for partial course credit. This study employed a 2 (location of the mode: 3 vs. 4) × 2 (representation format: graphical representation vs. alphanumeric representation) between-subjects design. Participants were asked to imagine that they wanted to book a hotel room for a weekend sightseeing trip and thus searched the TripAdvisor website for an overview of available hotels. Participants then saw an illustration picturing a hotel on TripAdvisor including one of the two rating distributions shown in Figure 2. The two rating distributions used in this study share the same average rating (3.5 on a 5-point scale, where higher ratings are more favorable), standard deviation (SD = 0.84), and number of ratings (N = 176), but they differ in terms of the location of the mode (Mode = 3 vs. Mode = 4). 1 However, apart from varying the location of the mode, we also manipulated whether a bar chart illustrating the distribution of rating scores was present (graphical representation condition) or absent, such that the frequency of each rating was reported only alphanumerically (alphanumeric representation condition). Participants were randomly assigned to one of the four conditions.
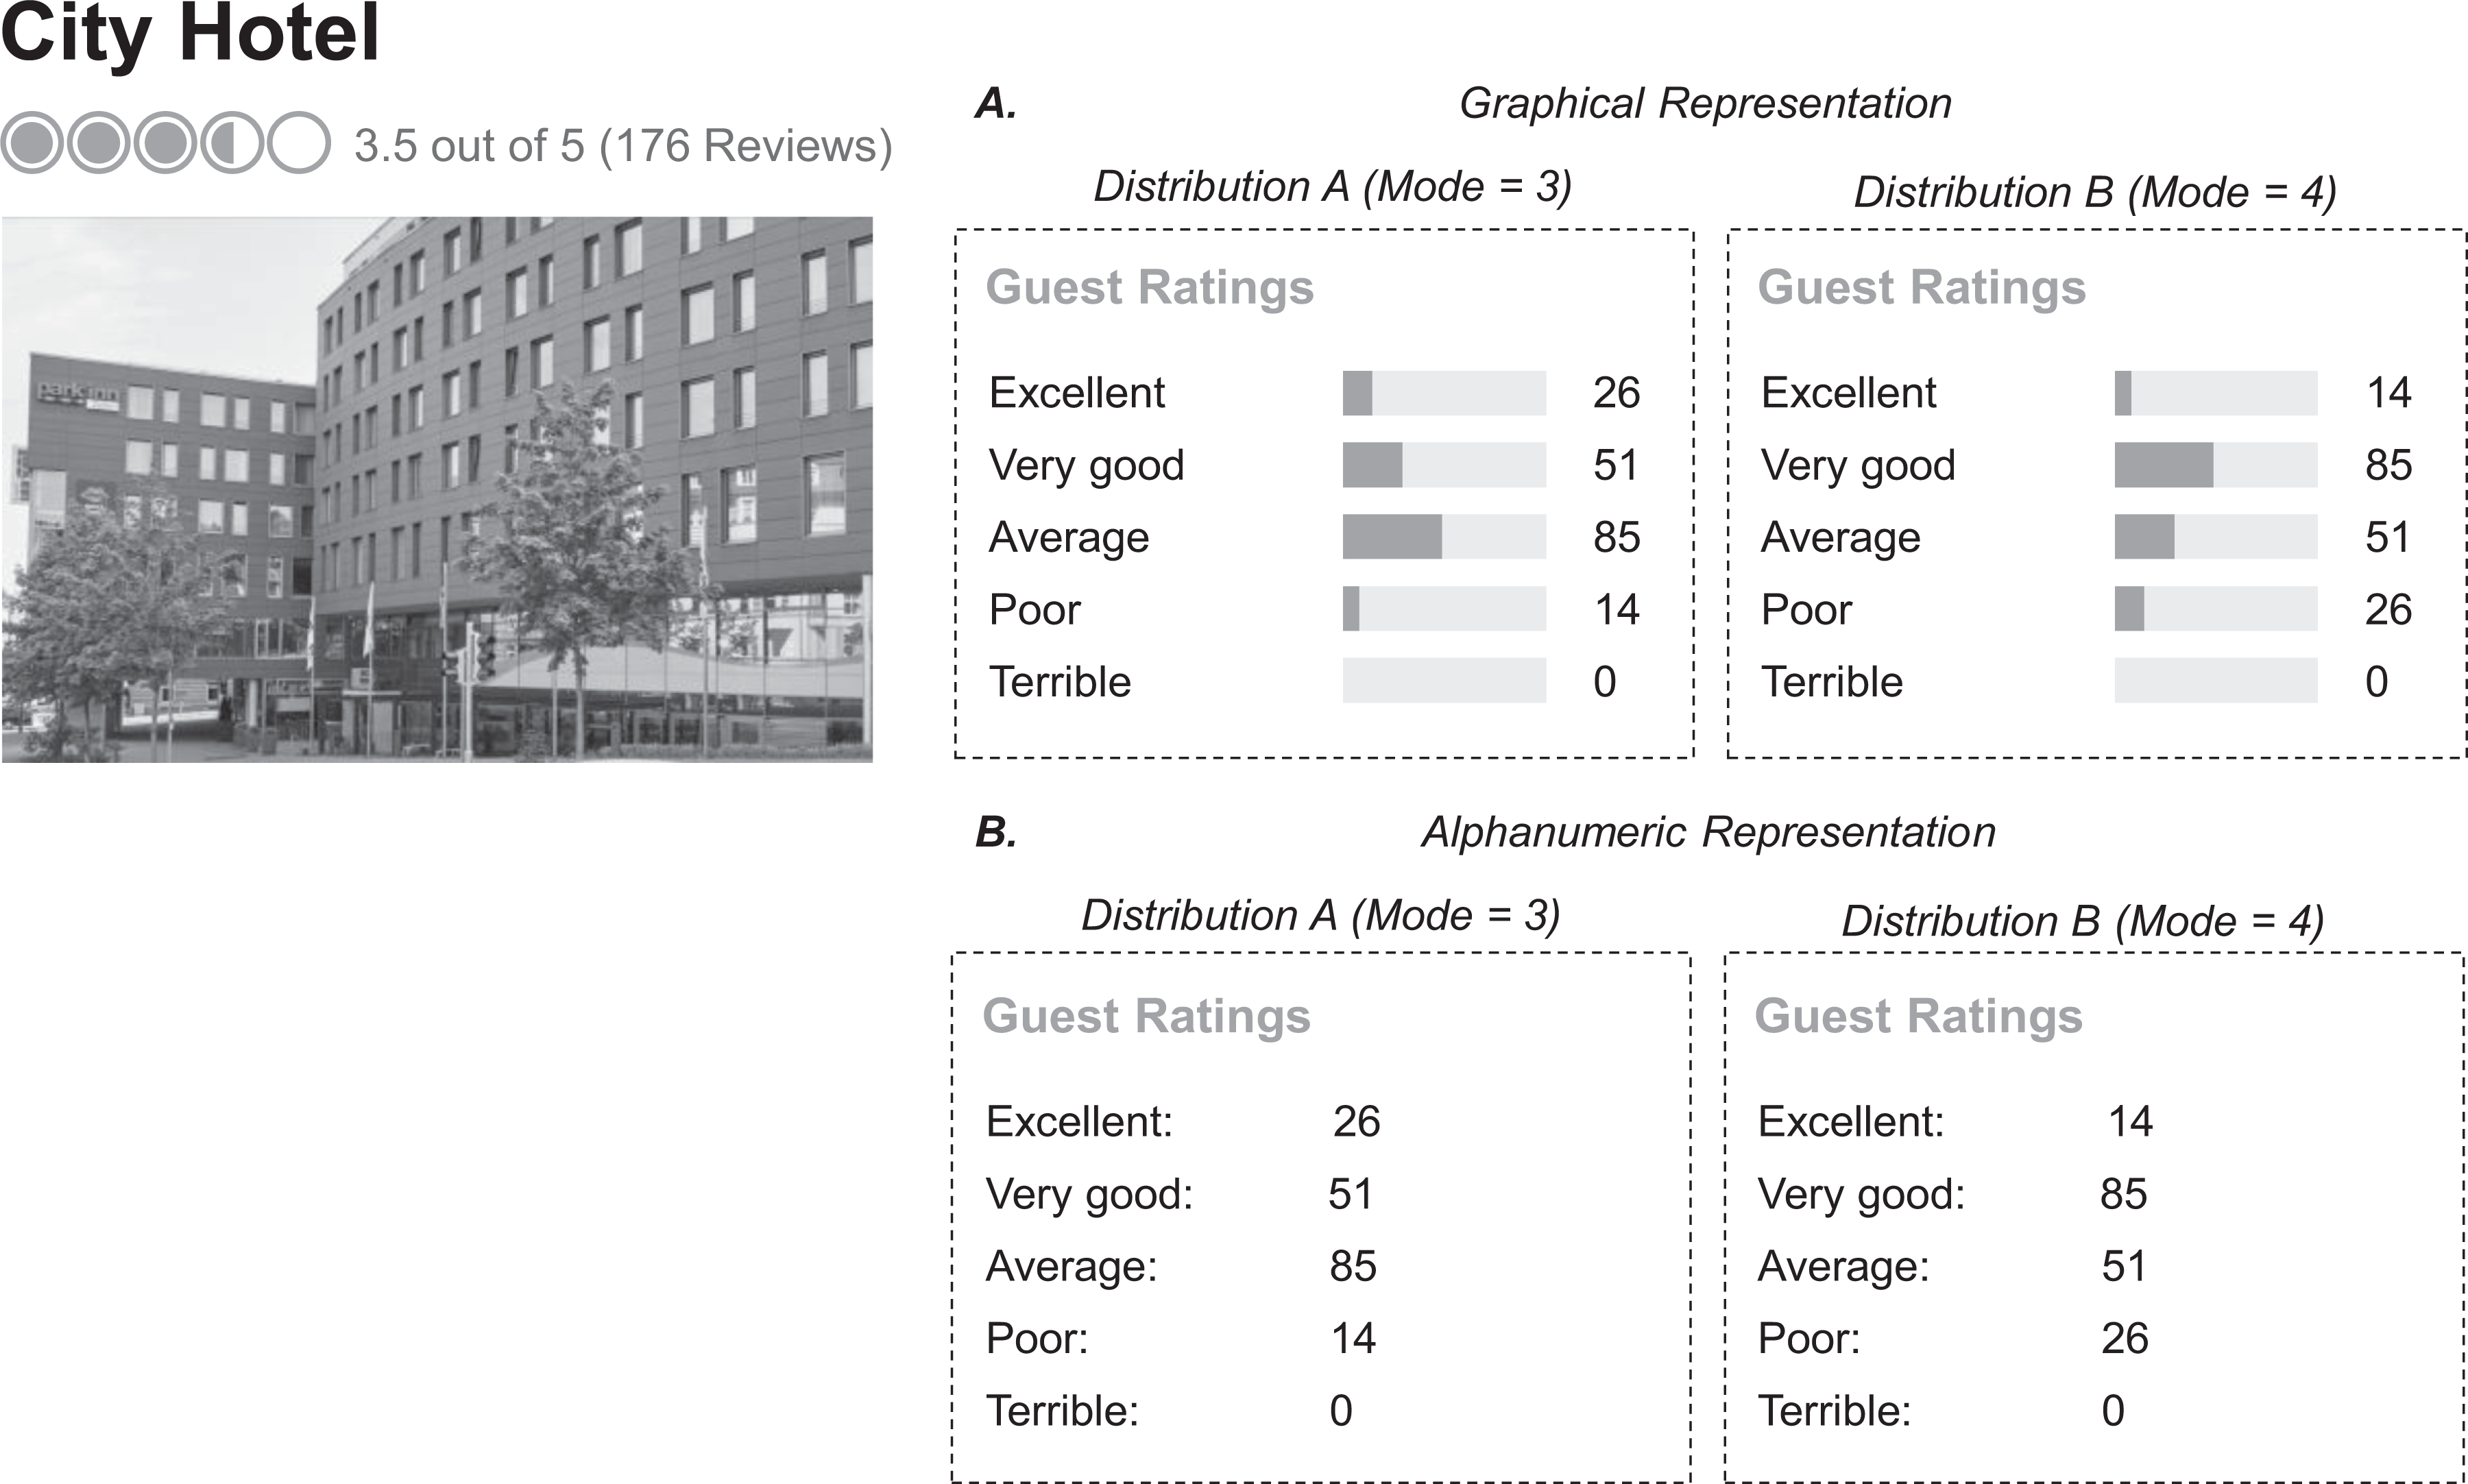
Rating distributions used in Study 1. (A) Graphical representation. (B) Alphanumeric representation.
To assess participants’ interpretations of the displayed rating distribution, they were asked to evaluate their first impression of the rated hotel (negative/positive, bad/good, unappealing/appealing; α = .88) and to indicate their hotel booking intentions (“Based on the information provided, how likely would you stay at this hotel?” from 1 = very unlikely to 7 = very likely).
Results and Discussion
An analysis of variance (ANOVA) on participants’ evaluations of the rated hotel revealed a significant main effect of location of the mode, F(1, 213) = 11.83, p < .01,
Similarly, an ANOVA on booking intentions revealed a significant main effect of location of the mode, F(1, 213) = 6.31, p = .01,
In line with our visual salience account, these results indicate that consumers’ inferences from rating distributions with an equal average, standard deviation, and number of ratings systematically vary by the location of the mode when the frequency of each rating score is illustrated through a bar chart (in which the mode is the most visually salient bar). These findings suggest that in particular under graphical conditions—compared to a sheer alphanumeric presentation of frequency information—the mode is weighted disproportionately.
Study 2
Having shown that consumers’ interpretations of graphical illustrations of the rating distributions are affected by the modal rating, the objective of Study 2 was to provide more direct evidence for our theorizing by examining the manner in which people process such graphical formats. More precisely, we hypothesized that the mode—as the most salient element of a bar chart—attracts consumers’ attention. Since the amount of attention directed to a specific piece of information has been shown to be positively related to its integration in judgment formation (e.g., MacKenzie 1986; Mandel and Johnson 2002; Shavitt and Fazio 1992), we assume that the focus on relatively positive (negative) ratings as induced by a more favorable (unfavorable) location of the mode can be held responsible for the demonstrated effect. Formally stated,
However, please note that if the attention-grabbing nature of the modal rating indeed drives the effect as we predicted, then this process should only occur if customer ratings are presented graphically but not when presented alphanumerically, as seen in Study 1.
Method
Two hundred twenty-two students (Mage = 23.9 years, 59.0% female) participated in the experiment for partial course credit. This study employed a 2 (location of the mode: 3 vs. 4) × 2 (representation format: graphical representation vs. alphanumeric representation) between-subjects design. Basically, we used the same distributions as in Study 1 but simply added three 1-point ratings, such that the rating scores were distributed over the entire rating scale (the stimuli used in this study are provided in Web Appendix E). Thus, the two rating distributions used in this study share the same average rating (3.5 of the five), 2 standard deviation (SD = 0.89), and number of ratings (N = 179), but they differ in terms of the location of the mode (Mode = 3 vs. Mode = 4). As in Study 1, we also manipulated whether the distribution of rating scores was represented graphically or alphanumerically. Participants were randomly assigned to one of the four conditions.
Participants evaluated the rated hotel (α = .89) and rated how likely they would stay at this hotel. After completing these judgment measures, they were asked to indicate the ratings from the presented rating distribution that most captured their attention, that is, 1 = terrible ratings, 2 = poor ratings, 3 = average ratings, 4 = very good ratings, and 5 = excellent ratings.
Results and Discussion
Service Evaluations and Booking Intentions
An ANOVA on service evaluations revealed a significant main effect of location of the mode, F(1, 218) = 19.17, p < .01,
An ANOVA on booking intentions revealed a significant main effect of location of the mode, F(1, 218) = 14.17, p < .01,
Focus of Attention
An ANOVA on self-reported focus of attention revealed significant main effects of location of the mode, F(1, 218) = 3.84, p = .05,
Mediation Analysis
Finally, we conducted a bootstrapping analysis (Hayes 2013; Model 8) with the rating score that reportedly captured most attention as a mediator of the relationship between location of the mode and service evaluations; representation format was used as moderator. This analysis revealed a significant indirect effect of location of the mode on service evaluations via focus of attention in the graphical conditions (B = .157, SE = .073, 95% CI [.052, .337]); the indirect effect was not significant in the alphanumeric conditions (B = −.031, SE = .052, 95% CI [−.165, .051]). Similarly, we found a significant indirect effect of location of the mode on booking intentions in the graphical conditions (B = .221, SE = .095, 95% CI [.074, .454]), but not in the alphanumeric conditions (B = −.044, SE = .072, 95% CI [−.209, .082]).
In sum, these findings shed light on the underlying mechanism of the mode heuristic. When processing graphical displays of rating distributions, participants’ focus of attention was directed toward more favorable (unfavorable) rating scores when the mode had a value of 4 (a value of 3). This attentional shift, in turn, prompted more favorable (unfavorable) service evaluations. In line with our attention explanation, the location of the mode → focus of attention → evaluation mediation pathway was not significant in the alphanumeric conditions.
Study 3
The objective of Study 3 was to provide further evidence of the proposed attention account underlying the mode heuristic by using a process by moderation approach (Spencer, Zanna, and Fong 2005). Consistent with our theorizing, Study 2 provides support of the mediating role of attentional focus in consumers’ interpretations of graphical displays of rating distributions. However, this attention account also implies that the sensitivity of consumers’ evaluations to the modal rating is contingent on the extent to which the mode is visually salient. Hence, if the use of the mode is indeed driven by attention as we proposed, then making the modal rating more salient and, thus, more attention-grabbing—such as by highlighting the bar relating to the mode in a different color (e.g., Milosavljevic et al. 2012)—should strengthen the extent to which interpretations of rating distributions are affected by the modal rating. On the basis of this, we propose:
Furthermore, apart from our attention account, two intuitive alternative explanations for why the modal rating is more influential under graphical than under alphanumeric conditions may come to mind. First, it is possible that alphanumeric representations of rating distributions are perceived as confusing and, thus, may be ignored when interpreting review information, explaining the lack of the effect of the mode in the alphanumeric conditions in Studies 1 and 2. Second, it could be that the mode is perceived as more diagnostic and, therefore, becomes more influential (e.g., Feldman and Lynch 1988; Menon, Raghubir, and Schwarz 1995) under graphical than under alphanumeric conditions. Study 3 also addresses these alternative accounts.
Method
Three hundred seventy-five students (Mage = 23.3 years, 45.2% female) participated in the experiment for partial course credit. This study employed a 2 (location of the mode: 3 vs. 4) × 3 (representation format: alphanumeric representation vs. typical graphical representation vs. graphical representation with mode highlighted) between-subjects design. Using the same rating distributions as in Study 2, participants were confronted with either an alphanumeric or graphical summary of hotel ratings. However, unlike Study 2, we also included a graphical condition in which the bar relating to the modal rating was highlighted using red color in order to increase the mode’s visual salience and, thereby, its ability to attract attention (see Web Appendix E). If the use of the mode is driven by attention, then participants’ reliance on the modal rating should be most pronounced in this condition. Participants were randomly assigned to one of the six conditions.
Participants were asked to evaluate the rated hotel (α = .90) and indicated how likely they would stay at this hotel. They then responded to a three-item measure capturing the perceived clarity of the provided summary of customer ratings (confusing, irritating, clear; α = .82; responses to inverse items were reversed before analysis), ranging from 1 = strongly disagree to 7 = strongly agree. Thereafter, we captured participants’ attention toward the modal rating in a more subtle manner than in Study 2. Precisely, following prior research that has used recall for objects as an indirect measure of attention (e.g., Coleman et al. 2017), participants were asked to recall the rating score that has received the largest number of votes. Finally, participants rated the degree to which the most frequent rating was relevant and important for their hotel evaluations on a 7-point scale (not at all relevant/very relevant, not at all important/very important, r = .61; Aaker 2000) to assess the perceived diagnosticity of the mode.
Results and Discussion
Recall of the Modal Rating
An overall χ2 test revealed a significant impact of representation format on participants’ recall of the mode, χ2(2) = 23.60, p < .01. As we expected, significantly more participants recalled the modal rating correctly in the typical representation format condition (91.2%; i.e., 114 of 125 respondents) than in the alphanumeric condition (80.0%; i.e., 100 of 125 respondents), χ2(1) = 6.36, p = .01. In addition, and as we intended, participants in the graphical condition in which the bar relating to the modal rating was highlighted in a different color showed the highest level of correct recall of the mode (98.4%; i.e., 123 of the 125 respondents; all χ2s > 6.57, all ps ≤ .01). Within all three representation format conditions, the effect of location of the mode on recall was insignificant (all χ2s < .95, all ps > .33). These findings indicate that the proportion of participants who paid a sufficient amount of attention to the modal rating required to correctly recall it increases from the alphanumeric and the typical representation conditions to the condition wherein the modal rating was highlighted, suggesting that the amount of attention paid to the modal rating increases with its visual salience.
Service Evaluations and Booking Intentions
An ANOVA on service evaluations revealed significant main effects of location of the mode, F(1, 369) = 37.38, p < .01,
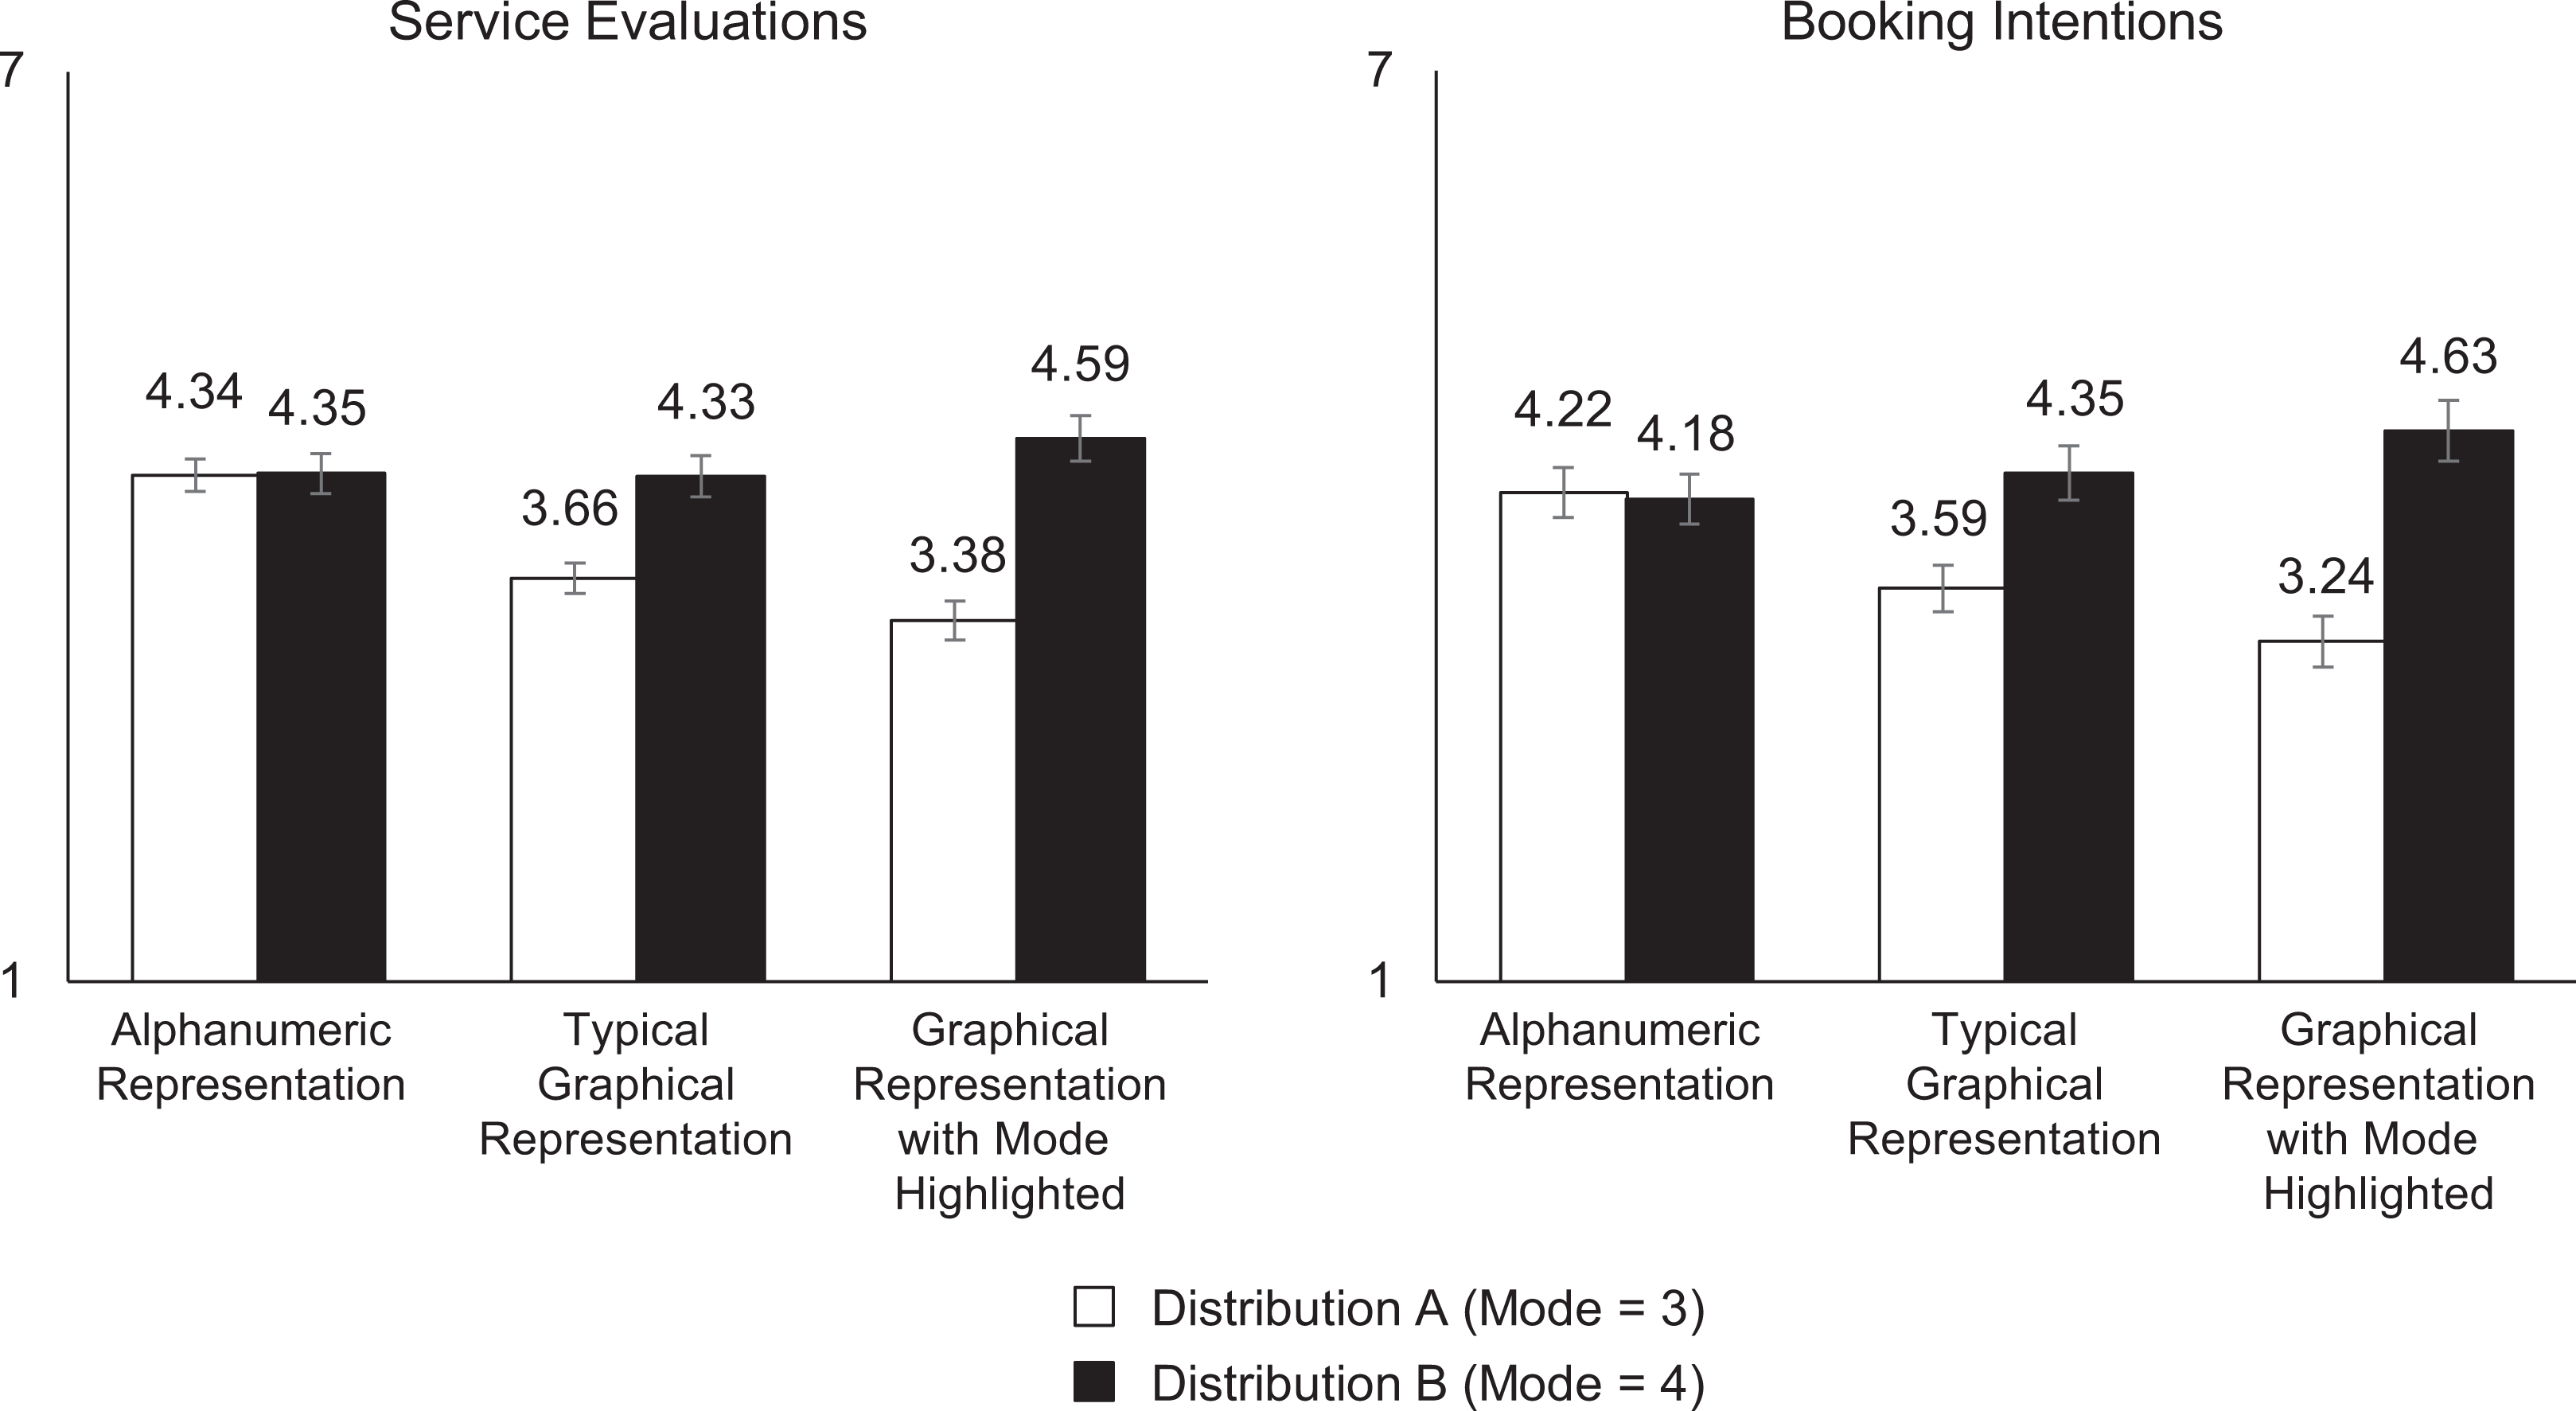
The effects of location of the mode and representation format on service evaluations and booking intentions (Study 3). Note. Error bars denote standard errors.
An ANOVA on booking intentions found a significant main effect of location of the mode, F(1, 369) = 25.43, p < .01,
Test of Alternative Accounts
Neither information clarity (M = 5.28, SD = 1.37, all Fs < 1.38, all ps > .25) nor perceived diagnosticity of the mode (M = 4.80, SD = 1.32, all Fs < 1.68, all ps > .19) were affected by the experimental manipulations, ruling out these alternative explanations for why the modal rating is more or less influential under different representation format conditions.
In sum, these findings provide further evidence for the proposed attention account underlying the mode heuristic. Specifically, examining participants’ ability to recall the mode as an indirect measure of attention, we found that the attention directed toward the modal rating increases as a function of its visual salience. In addition, and in line with our theorizing, the strength of the effect of the modal rating on participants’ interpretations of the presented rating distributions, in turn, appears to increase with the mode’s ability to attract participants’ attention.
Study 4
Having shown that highlighting the modal rating in a different color directs people’s attention to it and, thereby, increases the influence of the mode when drawing inferences from visualized rating distributions, the purpose of Study 4 was to provide further evidence for the crucial role of the mode’s visual salience in this process. However, in this study, we manipulated the visual salience of the mode in a more subtle manner. Precisely, using the same distributions as in Study 1, we varied by how much the bar of the mode stood out from the other bars by either compressing or stretching the bars within the presented charts (see Web Appendix F).
Method
Two hundred twenty-four students (Mage = 21.5 years, 49.6% female) participated in this study in exchange for partial course credit. This study employed a 2 (location of the mode: 3 vs. 4) × 2 (physical length of the bars: compressed vs. stretched) between-subjects design. Participants saw an illustration picturing a hotel on TripAdvisor including one of the four resulting review summaries, evaluated the illustrated hotel (α = .92), and indicated how likely they would stay at this hotel. We randomly assigned participants to one of the four conditions.
Results and Discussion
An ANOVA on service evaluations revealed significant main effects of location of the mode, F(1, 220) = 47.11, p < .01,
Similarly, an ANOVA on booking intentions found significant main effects of location of the mode, F(1, 220) = 31.10, p < .01,
Studies 5a and 5b
The main purpose of Studies 5a and 5b was to demonstrate the mode heuristic in (a) consumers’ relative preferences and (b) choices between different alternatives. Both studies employed a single factor between-subjects design with two experimental conditions (representation format: graphical vs. alphanumeric representation) where participants faced two restaurant rating distributions that were either presented through a bar chart or alphanumerically (see Figure 4).
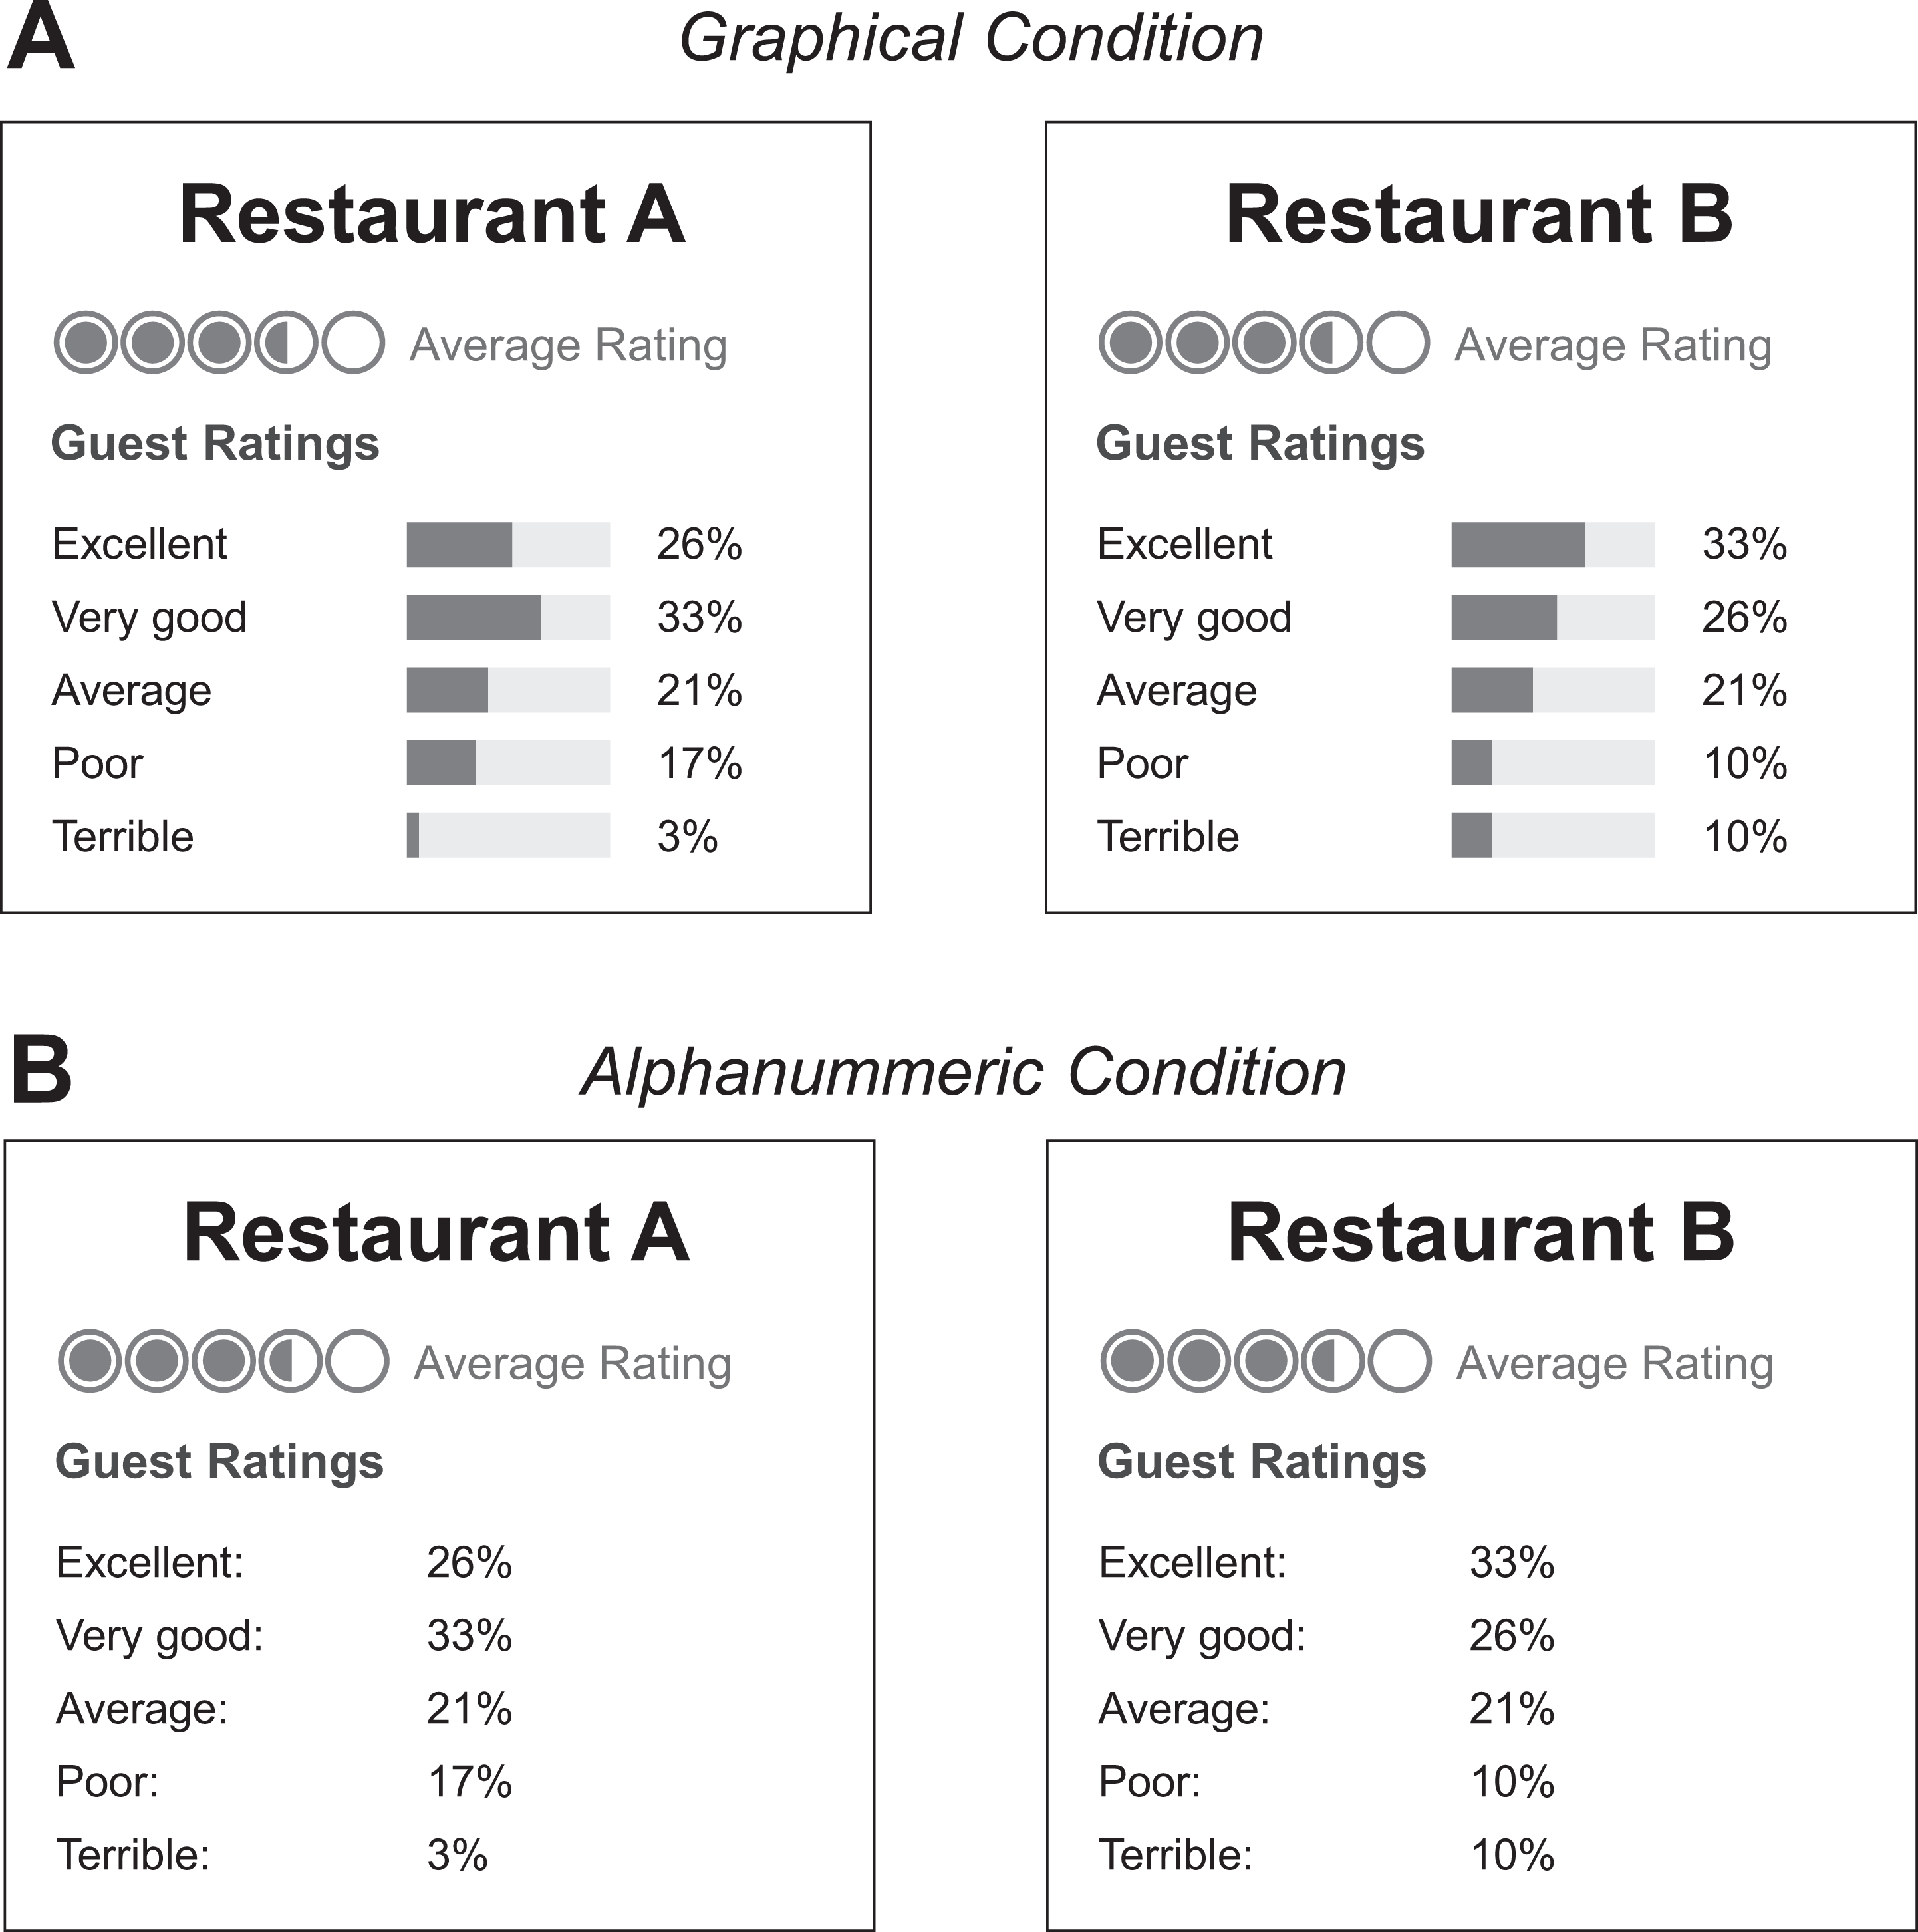
Rating distributions used in Studies 5a and 5b. (A) Graphical condition. (B) Alphanumeric condition.
These rating distributions differed in two important ways from the rating distributions used in the above experiments. First, in contrast to the previous studies, the modal rating of the distributions used in Studies 5a and 5b was either 4 or 5 rather than 3 and 4. Second, Fisher, Newman, and Dhar (2018; Fisher and Keil 2018) recently demonstrated that consumers tend to engage in binary thinking when evaluating online ratings and do not sufficiently distinguish between five- and four-star ratings and between one- and two-star ratings, such that subjective representations of rating distributions are influenced by the extent to which the number of positive ratings (four- and five-star ratings) exceeds (or falls below) the number of negative ratings (one- and two-star ratings). Thus, the two rating distributions used in this study had an identical proportion of positive (59%) and negative (20%) rating scores, in order to rule out binary thinking as an explanation for our findings. Furthermore, because the proportion of positive ratings (i.e., scores above the midpoint) was held constant across the two rating distributions, Studies 5a and 5b are also instrumental in ruling out that the observed effect of the modal rating occurs because consumers exclusively integrate positive rating scores when they draw inferences from rating distributions.
Study 5a
Method
One hundred thirty-two students (Mage = 23.5 years, 47.7% female) participated in this study for partial course credit. Participants were instructed that they would view online ratings for two restaurants from TripAdvisor and were asked to indicate their relative preference between the two alternatives (strongly prefer Restaurant A/strongly prefer Restaurant B). Participants were randomly assigned to either the graphical or the alphanumeric condition. The presentation order of the two rating distributions was counterbalanced, such that approximately half of the respondents were confronted with a choice set wherein the rating distribution of Restaurant A had a mode of 5, while the other participants saw a choice set wherein Restaurant B had a modal rating of 5. Before analyzing the data, we transformed the relative preference measure, such that higher values on this measure indicate a stronger preference for the restaurant with a modal rating of 5.
Results and Discussion
The effects of presentation order were not significant (all Fs < 0.45, all ps > .50), so we collapsed the data across the two order conditions. An ANOVA on the relative preference measure revealed a significant effect of representation format, F(1, 130) = 10.84, p < .01,
Study 5b
Method
One hundred ninety-eight students (Mage = 22.9 years, 48.5% female) participated in this study for partial course credit. Basically, the experiment employed the same format as Study 5a with one exception: Instead of indicating their relative preference between Restaurants A and B on a 7-point scale, participants were asked to make a discrete choice between the two restaurants differing regarding their modal rating. As in Study 5a, the presentation order of the two rating distributions was counterbalanced.
Results and Discussion
A logistic regression with representation format (alphanumeric vs. graphical representation condition) and presentation order as predictors of participants’ preference for the restaurant with a higher modal rating revealed a significant main effect of representation format, Wald χ2(1) = 5.83, p = .02; the effect of presentation order on restaurant choice and the Presentation Order × Representation Format interaction were not significant (all Wald χ2 values < .88, all ps > .35). Consistent with Study 5a, participants were more likely to choose the restaurant with the higher modal rating in the graphical representation condition (64.4%; i.e., 65 of 101 respondents; significantly greater than 50%, χ2(1) = 8.33, p < .01), than in the alphanumeric condition (47.4%; 46 of 97 respondents; not different from 50%, χ2(1) = .26, p = .61). In sum, the results of Study 5b documenting a manifestation of the mode heuristic in decision making confirm that consumers’ reliance on the modal rating is not only reflected in service evaluations, purchase intentions, and relative preferences but can also be observed when considering choice.
Study 6
Study 6 used a conjoint-based exercise to examine consumers’ inferences from graphical displays of rating distributions from a different angle. This approach allowed us to estimate the implicit utility associated with different rating distributions in the presence of other service attributes and, thus, to examine whether consumers still tend to make inferences based on the modal rating when further information is available. As an additional test of the robustness of the impact of a rating distribution’s mode, we also manipulated two distribution characteristics that were held constant across the previous studies, namely, average rating and rating volume.
Method
Two hundred eleven students (Mage = 22.9 years, 48.3% female) participated in this study for partial course credit. Participants were asked to imagine that they wanted to order pizza and therefore searched Google for pizza delivery services. They then completed eight consecutive choices between three providers, each described by four attributes, namely, rating volume (six levels: 239, 262, 285, 308, 331, and 354 reviews), rating distribution (six levels), price per pizza (four levels: pizza prices starting at €5.30, €6.10, €6.90, and €7.70), and average delivery time (four levels: 32, 36, 40, and 44 minutes). The six rating distributions used in the study were defined according to a 2 (location of the mode: 3 vs. 4) × 3 (average rating: 3.3 vs. 3.5 vs. 3.7 on a 5-point scale, where higher ratings are more favorable) design (see Figure 5). We constructed the choice sets using the complete-enumeration procedure provided by Sawtooth Software (e.g., Hennig-Thurau et al. 2007). A sample choice task is shown in Web Appendix G.
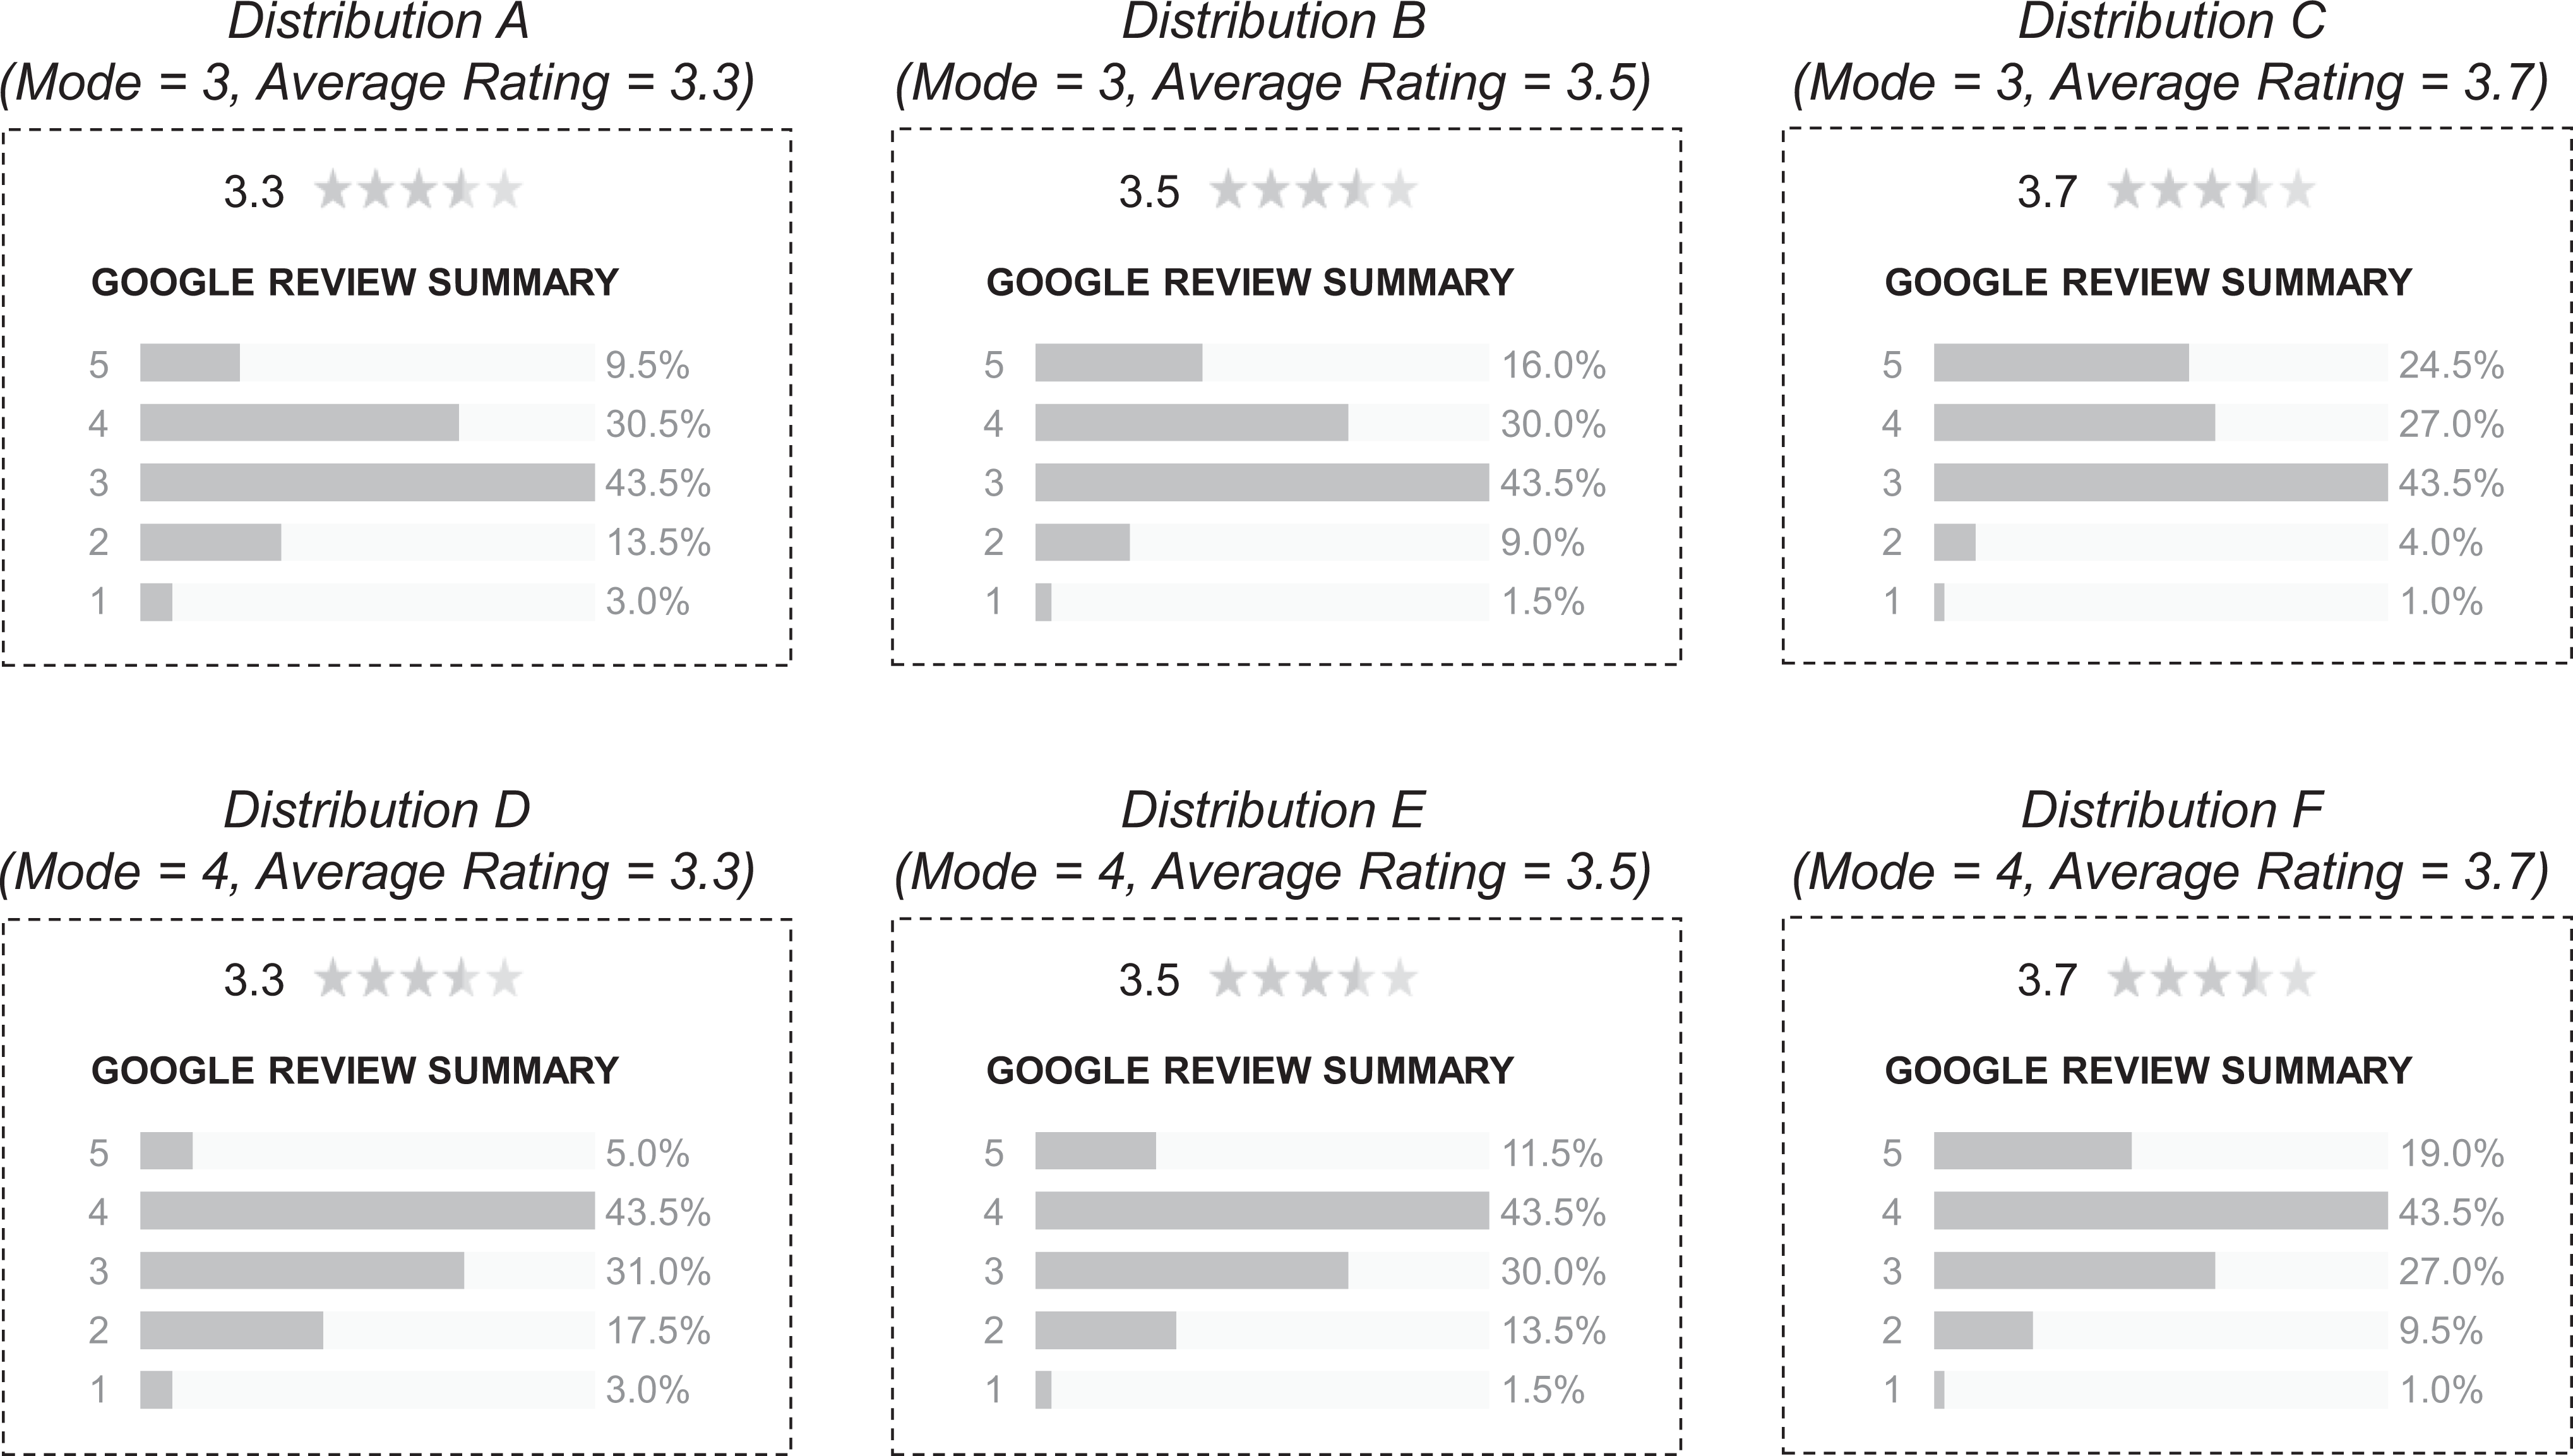
Rating distributions used in Study 6. Note. Although the displayed distributions differ regarding their modal and average rating, they still share the same standard deviation (SD = 0.92). The information displayed above the dashed boxes was not shown to participants.
As a means to ensure respondents’ involvement and motivation during the task, the study followed an incentive-alignment scheme, the most common technique for making choice experiments closer to real-life choices (e.g., Ding, Grewal, and Liechty 2005; Yang, Toubia, and de Jong 2018). Specifically, at the beginning of the study, participants were told that they would join a lottery upon completion of the study. Each of the three winners of this lottery would receive a €10 voucher for a delivery service that was randomly selected from one of the eight choices that the winning participants had made. At the end of the study, we included three items (“I took the tasks of choosing a pizza delivery service seriously,” “I really made the choices as if I actually selected a pizza delivery service,” “I took extra care to always identify the best pizza delivery service”; Pham and Avnet 2004; α = .80) to assess participants’ involvement in the choice tasks. Responses to this measure confirm a high level of task involvement (M = 6.18, SD = 0.95; on a 7-point scale).
Results and Discussion
We estimated attribute-level utilities using the Hierarchical Bayesian module in Sawtooth. For rating volume, price, and delivery time, we used a linear attribute coding. Thus, for these attributes, we estimated a single linear utility that describes the change in utility due to a unit change in the level of the attribute (e.g., the increase in utility provided by each additional rating). The results of this estimation revealed that the utility provided by rating volume increases with the number of ratings (βrating volume = .013 [per additional rating], SD = 0.069), while the estimated utility parameters of price (βprice = −3.09 [per additional euro], SD = 5.53) and delivery time (βdelivery time = −.179 [per additional minute], SD = 0.373) were negative.
In contrast, we estimated partworth parameters for each of the six rating distributions using partworth coding. In order to examine the difference in the utilities associated with the presented rating distributions, we then submitted the resulting partworths to a repeated measures ANOVA with location of the mode and average rating as within-subjects factors. This analysis found significant main effects of location of the mode, F(1, 210) = 186.76, p < .01,
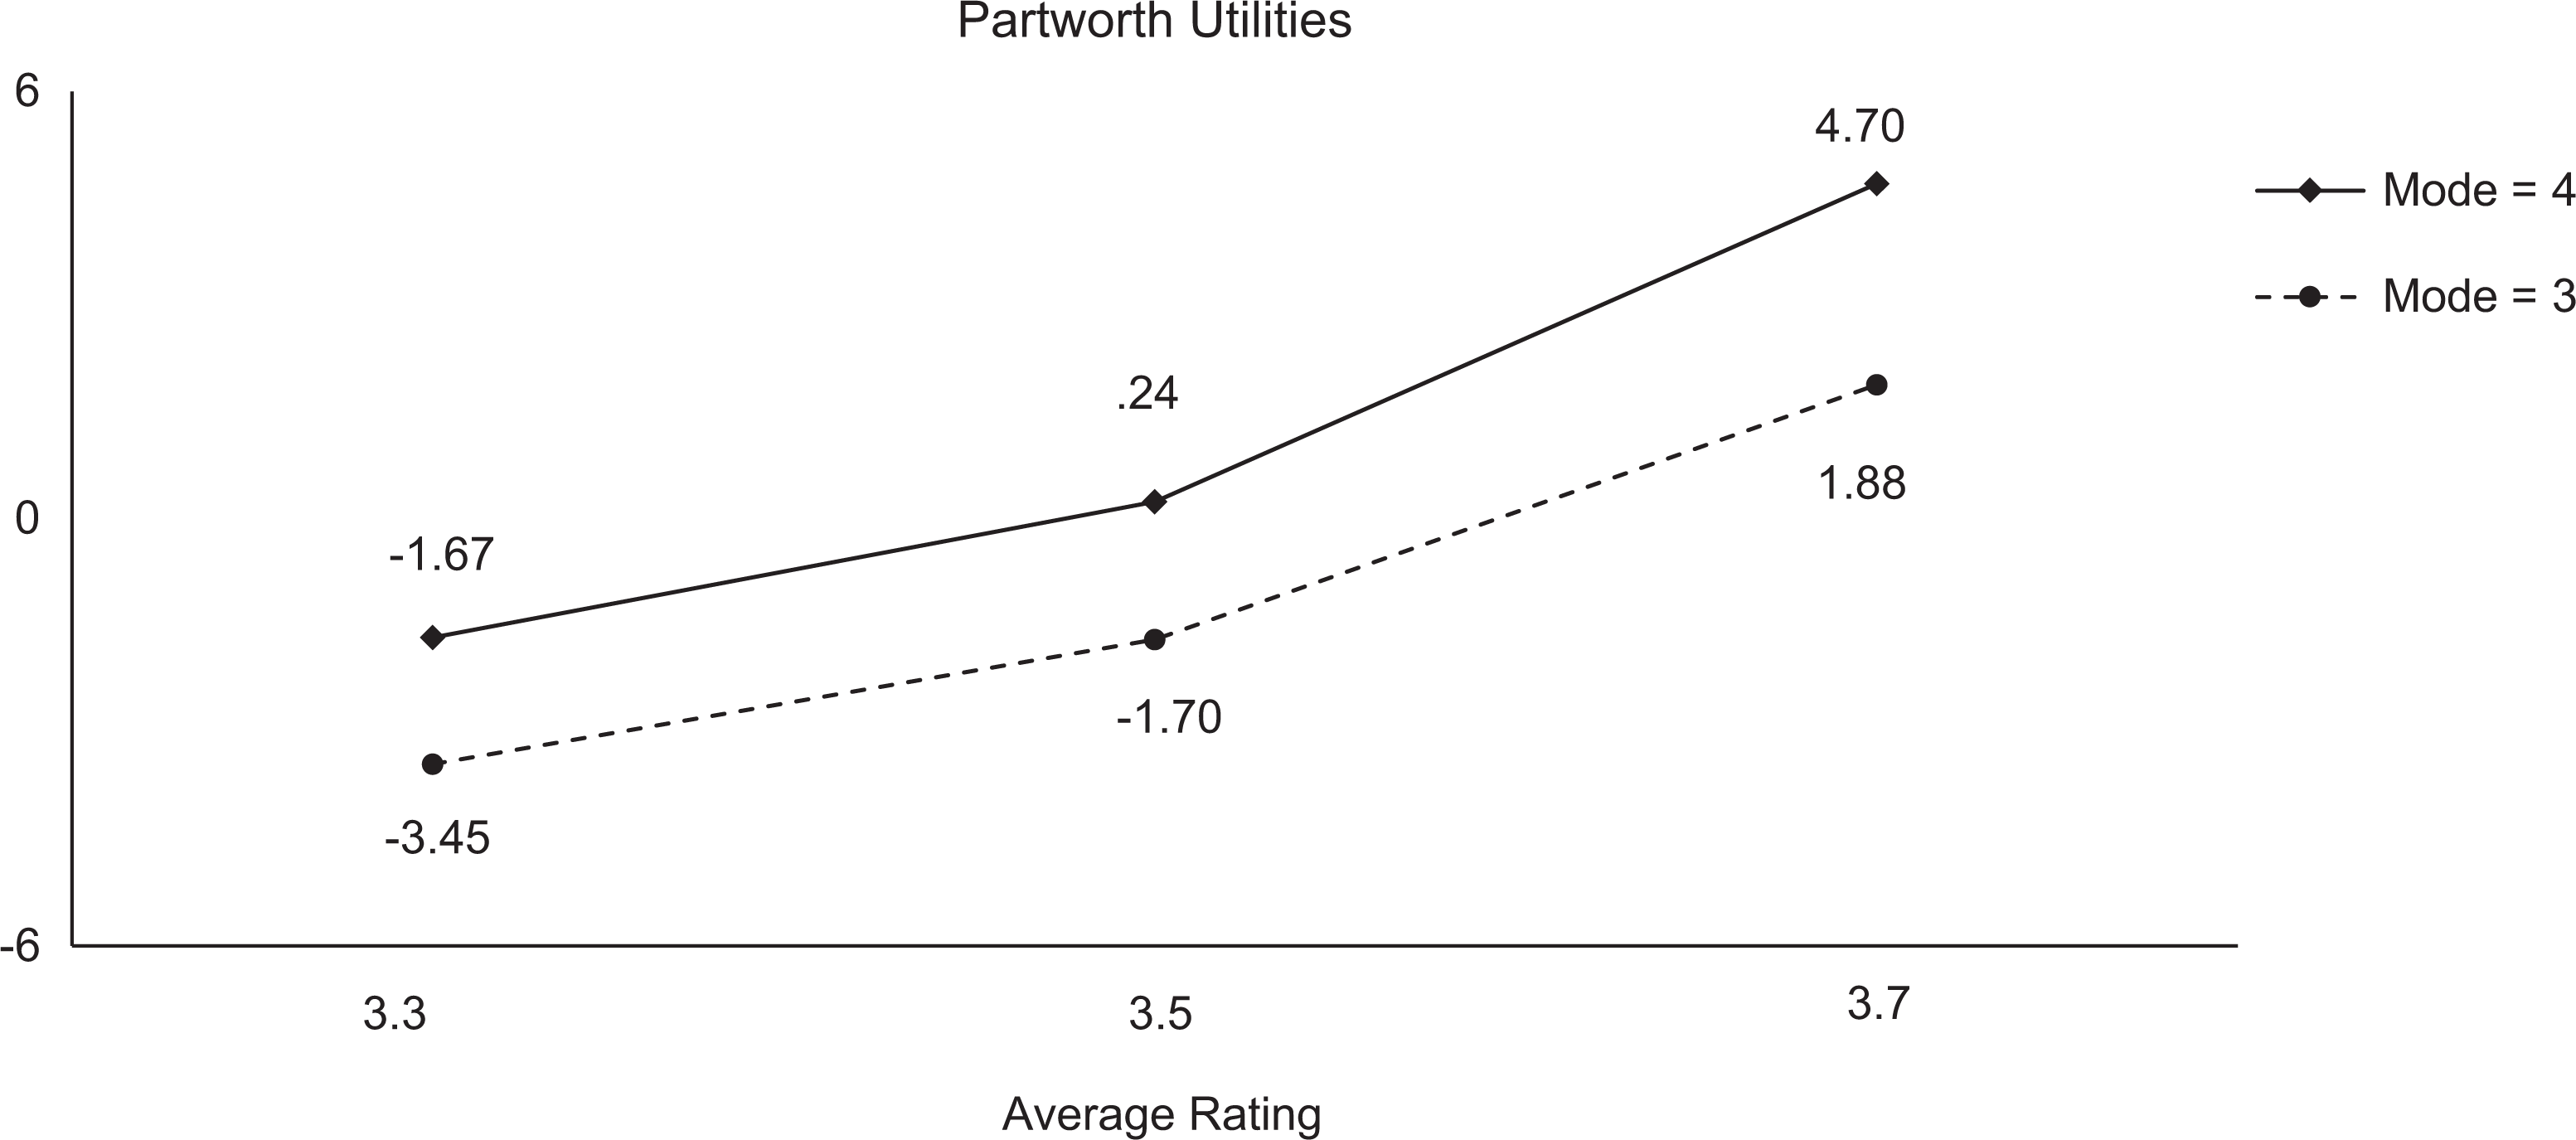
Partworth utilities associated with different rating distributions.
In sum, the results of this choice-based conjoint study in which respondents traded off different rating distributions against other service characteristics provide additional evidence for consumers’ use of the mode when interpreting graphical displays of online ratings. In line with our theorizing, even in the presence of other service information and when controlling for a rating distribution’s average rating and rating volume, respondents preferred service providers with a more favorable modal rating.
Study 7
The previous studies consistently demonstrated that consumers’ inferences from graphical displays of rating distributions systematically vary by the location of the mode. However, it is still possible that other distribution characteristics are responsible for the observed effect. Specifically, since the location of the mode is typically strongly related to a distribution’s median and skewness (e.g., Malhotra 2010; Moore, McCabe, and Craig 2012), it is hardly possible to manipulate the modal rating without also altering other distribution characteristics. So far, we cannot explicitly preclude that the documented effects have been caused by changes in the skewness and/or the median of the used distributions rather than by the location and visual salience of the mode as hypothesized. Hence, the purpose of Study 7 was to rule out these alternative accounts of our findings.
Based on von Hippel’s (2005) observation of occasions where the interrelationships between mode, median, and skewness of a distribution are disrupted, we constructed three rating distributions with several important properties that allowed us to analyze the impacts of each of the three distribution characteristics under scrutiny (i.e., median, skewness, and location of the mode) in isolation (see Figure 7). First, all three distributions had the same median. Hence, if the detected effects were driven by the changes of a distribution’s median, participants’ inferences should be equal across the three distributions. Second, Distributions A and B differed merely in terms of their skewness, that is, we increased the imbalance between positive and negative rating scores and, thus, the extent to which the distributions were negatively skewed. However, we kept the skewness constant between the second and third distributions. Thus, if the skewness was responsible for the occurrence of the documented effects, participants’ evaluations should differ only between Distributions A and B but not between Distributions B and C. Finally, we manipulated the modal rating from 3 (Distributions A and B) to 4 (Distribution C). Hence, if only the location of the mode was the driver of the reported effects as we predicted, then participants’ inferences should differ between Distributions B and C. We held the average rating (M = 3.3), standard deviation (SD = 1.02), and rating volume (N = 358) constant across the three rating distributions.
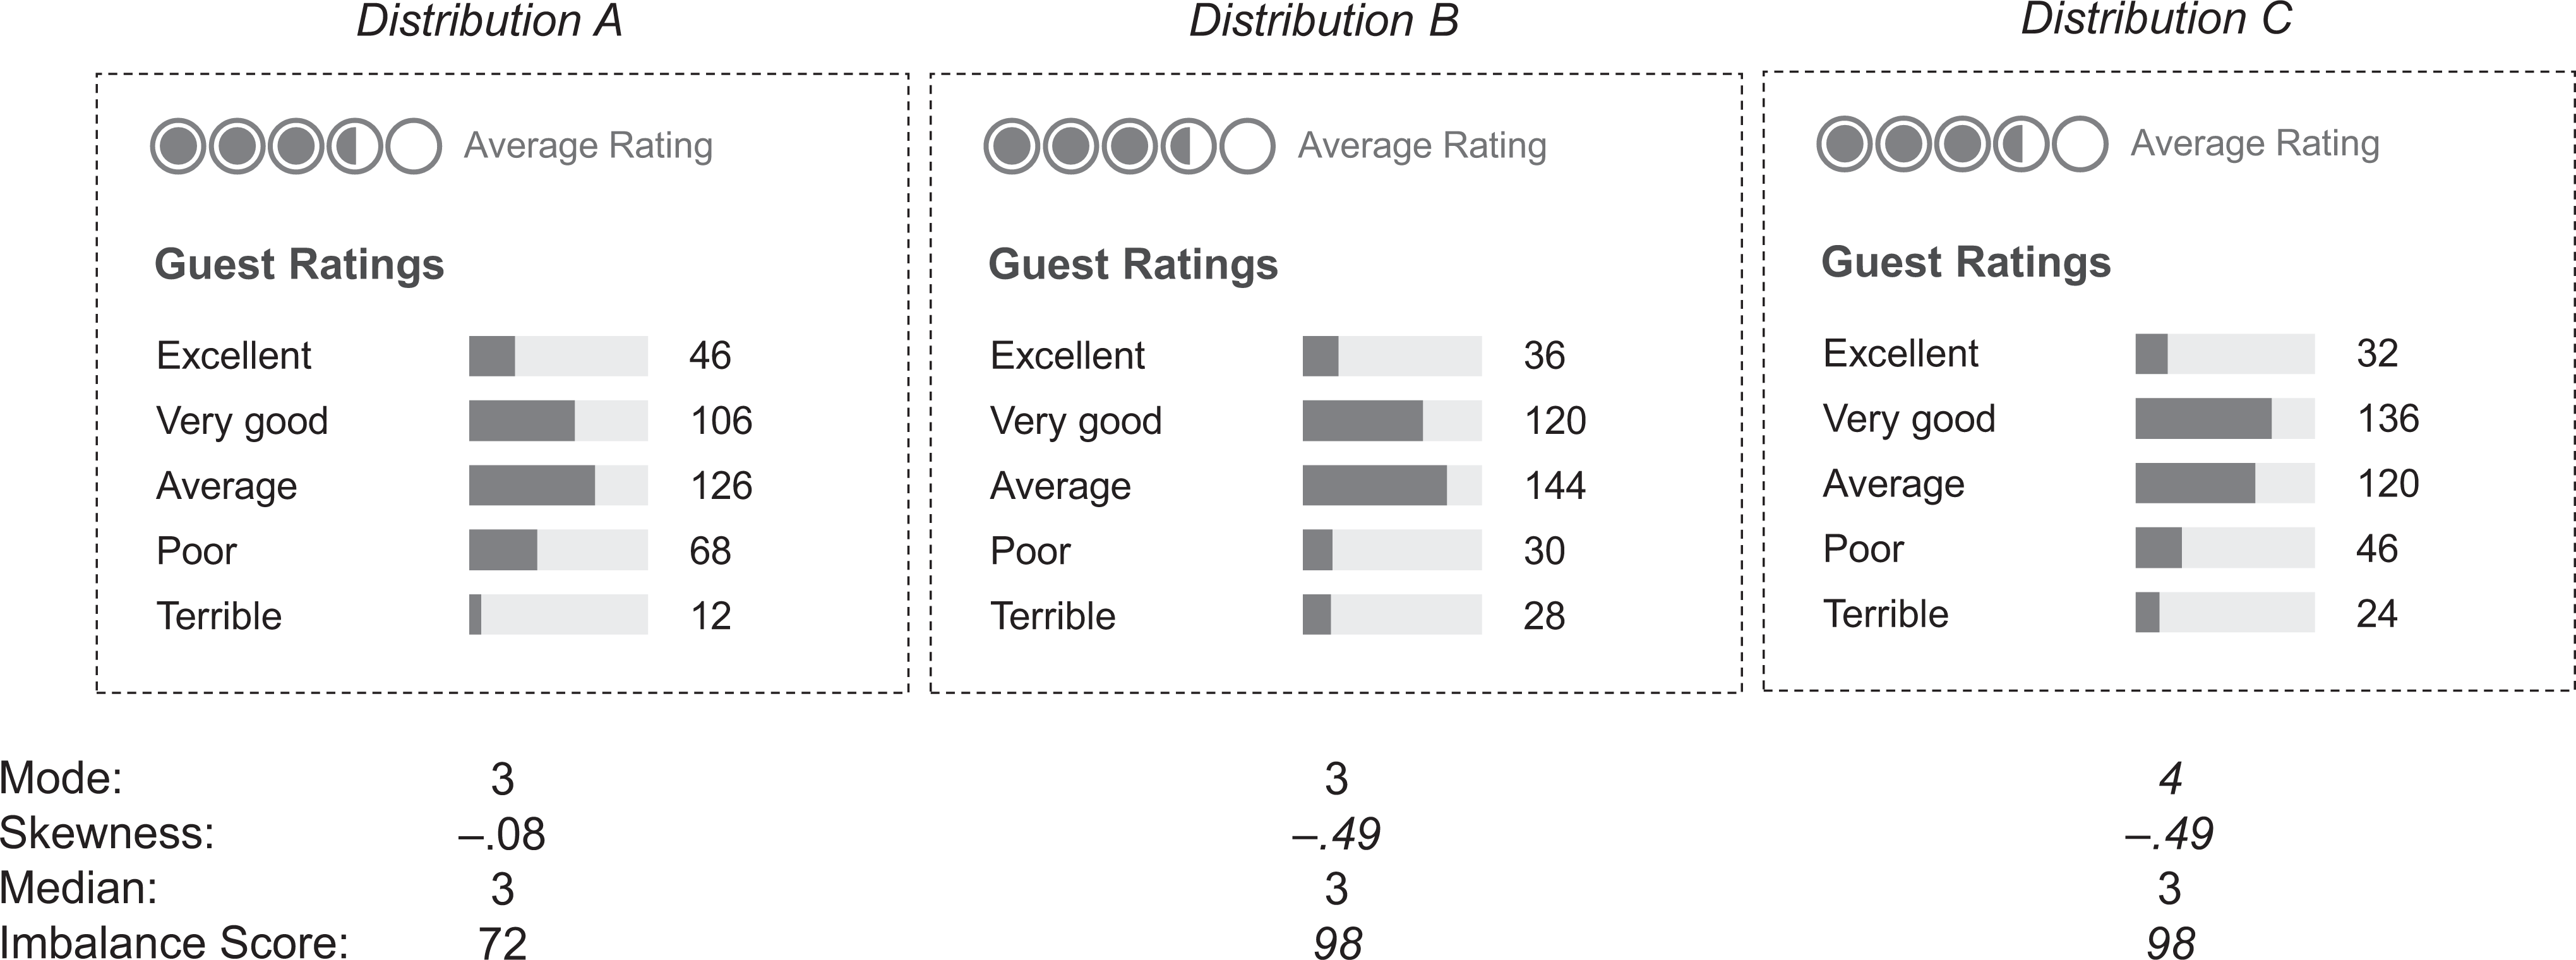
Rating distributions used in Study 7. Note. Numbers written in italics indicate changes relative to Distribution A; the distribution characteristics that appear below the bar charts were not shown to participants.
Method
One hundred ninety-four students (Mage = 21.4 years, 46.4% female) were randomly assigned to one of the three rating distributions shown in Figure 7. They participated in this study for extra course credit. Participants were told that the figure depicted guest ratings for a hotel from TripAdvisor and were asked to evaluate the rated hotel (α = .87) as well as to indicate how likely they would stay at this hotel.
Results and Discussion
An overall one-way ANOVA on service evaluations revealed a significant difference between the three rating distributions, F(2, 191) = 5.42, p < .01,
Similar effects emerged when considering hotel booking intentions. An overall one-way ANOVA revealed a significant difference between the three rating distributions, F(2, 191) = 4.89, p < .01,
In sum, these findings support our theorizing about the mode heuristic and preclude that other distribution characteristics that are typically strongly connected to the location of the mode within a distribution can be held responsible for the identified effects. Precisely, the results of this study suggest that consumers’ inferences from rating distributions can be affected by the modal rating independent of any changes in the skewness of a distribution or its median.
General Discussion
Today, when informing their decisions, service customers increasingly rely on online ratings to form an opinion about the available options (e.g., Keh and Sun 2018; van Doorn et al. 2010). The present research provides a systematic examination of how consumers’ service evaluations inferred from rating distributions illustrated as a bar chart are determined by the location of the arithmetic mode, that is, the rating score that has received the highest number of votes, which is thus represented by the most salient bar within the graph. In short, we found that when customer ratings are summarized graphically, the most frequent rating is disproportionally weighted when consumers draw inferences, a phenomenon we refer to as the mode heuristic. Across the series of eight studies reported in this article (and three ancillary studies in Web Appendixes A–C), we provide strong empirical evidence for consumers’ use of the mode heuristic that is reflected in a set of different variables, namely, service evaluations, booking/visiting intentions, relative preference and choice between different alternatives, and implicit utility associated with different rating distributions. In addition, using both measurement-of-mediation and moderation-of-process designs (Spencer, Zanna, and Fong 2005), we shed light on the mechanism underlying this phenomenon and demonstrate how inferences based on the mode heuristic depend on the visual salience of the mode. Finally, we preclude that other characteristics of rating distributions can account for the observed effects.
However, please note that it is important to conceptually differentiate between consumers’ heuristic use of the mode when interpreting online rating distributions and their use of the mode because it may carry relevant information. In other words, we do not assume that the use of the mode is entirely irrational per se and consumers should completely ignore it. For instance, the most frequent rating could be considered informative because it represents the most popular opinion and people may infer that the modal rating is credible and trustworthy. However, the degree to which the mode is integrated should be determined by the extent to which it is perceived as informative and diagnostic rather than by the extent to which it is visually salient. Thus, the finding that consumers’ interpretations of rating distributions are stronger affected by the location of the mode when the distribution of rating scores is provided graphically instead of alphanumerically (Studies 1–3 as well as 5a and b)—although the informational value of the modal rating should be equivalent—as well as the finding that the mode becomes more or less influential when altering physical properties of a bar chart (Study 4) indicate a heuristic rather than a systematic integration of the mode. In a similar vein, the finding that the impact of the modal rating is influenced by different representation formats while its perceived diagnosticity remains unaffected (Study 3) as well as the finding that diagnosticity ratings are relatively close to the scale midpoint (M = 4.80 on a 7-point scale) suggest that consumers seem to be rather unaware of the mode’s impact on their judgments. In addition, although we demonstrate that the mode can shape consumers’ interpretations of online review data to a significant extent, our claim is not that the modal rating is the only feature of rating distributions consumers use. In fact, the results of Study 6 reveal that consumers’ evaluations of rating distributions with varying modal ratings are still determined by other statistical features (i.e., average ratings and rating volume). Thus, the mode should be considered as an additional feature affecting people’s inferences from rating distributions. In the following sections, we discuss the contribution of our research to theory, implications for business practices, and opportunities for further research.
Theoretical Contributions
Our research makes three fundamental theoretical contributions. First, we add to the large body of literature studying the impacts of online ratings in consumer behavior (see Babić Rosario et al. 2016, for an overview). To date, extant research on consumers’ response to different distribution characteristics of online ratings has focused mostly on the effects of the number of ratings, average ratings, and rating dispersion, while the mode of rating distributions has been largely neglected (for an exception, see Fisher, Newman, and Dhar 2018). Our findings suggest that consumers tend to use the mode as a shortcut when they draw conclusions from graphical displays of rating distributions. Hence, by establishing the mode as an important parameter in people’s interpretations of rating distributions, we broaden the understanding about the impacts of customer ratings on prospective customers’ service evaluations.
Second, we contribute to the literature on visual information processing and graphical perceptions. Our results are consistent with the idea that people’s interpretations of graphical formats are determined not only by the provided content per se but also by the physical properties of the elements of a chart (e.g., Jarvenpaa 1990; Simkin and Hastie 1987; Spence 1990; Stone, Yates, and Parker 1997, 2003; Weber and Kirsner 1997). Adding to prior studies in this field that demonstrate that people’s interpretations of graphical formats are biased toward more salient graphical features (e.g., visual properties in terms of physical size or color), we uncover that a statistical feature of frequency distributions (i.e., the arithmetic mode) can crucially affect graph comprehension according to the salience principle as well. In addition, shedding light on our findings at the process level (Studies 2–4), we found that the attention paid to an object is dependent on its visual salience and that the most attended element of a graphical display determines people’s conclusions drawn from it. Hence, by demonstrating that consumers’ reliance on the modal rating can be explained—at least in part—by this attention account while ruling out two alternative mediators (i.e., information clarity and perceived diagnosticity of the mode), we respond to several calls for research to provide direct evidence for the process underlying salience effects in people’s interpretations of graphical formats (e.g., Jarvenpaa 1990; Raghubir and Das 2010; Stone et al. 2003).
Third, our study also adds to the wide array of research on heuristics and biases in judgment and decision making (Gilovich, Griffin, and Kahneman 2002). By demonstrating an instance wherein the integration of information in a judgmental task is determined by alternative representation formats, we document a violation of the rationality criterion of invariance that demands that responses to different representations of the same information are consistent. Therefore, the documented mode heuristic aligns with other previously reported heuristics entailing that the weighting of available informational cues in judgment formation deviates from a normative mindset, for example, the anchoring (Tversky and Kahneman 1974) and availability heuristic (Tversky and Kahneman 1973), as well as the peak-end rule (Kahneman et al. 1993).
Managerial Implications
Customer ratings have become a vital driver of consumer judgment and decision making in today’s service landscape. In times when consumers place more trust in the opinions of unknown people posted online than in any form of communication initiated by a company (Nielsen 2015), it is essential to develop a deeper understanding regarding the cues that consumers integrate when interpreting such review data. The findings of the current work offer several useful implications to service providers who allow their customers to share their opinions and experiences on review websites such as TripAdvisor, Yelp, or Google Reviews.
First and foremost, by highlighting the relevance of the mode in consumers’ inferences from online rating distributions, we provide managers monitoring, analyzing, and evaluating customer reviews with a new key figure that—aside from the number of ratings, average ratings, and rating dispersion—should be involved in the assessment of online review data. In other words, with our results in mind, service providers can better anticipate the consequences of different rating distributions on service evaluations of prospective customers.
Second, beyond simply accepting the impact of the mode in consumers’ interpretations of rating distributions, our findings reveal graphical features by which managers can proactively affect the extent to which the mode is incorporated into decision making. More precisely, our manipulations in Studies 1–3 as well as 5a and b (alphanumeric vs. visual representation of rating frequencies) as well as in Study 4 (compressing vs. stretching the length of the bars in a chart) uncover two parameters that can be used to make the mode of rating distributions more or less influential. For example, these findings could be particularly useful for service firms incorporating snapshots of review summaries on their websites or using them for advertising or digital retargeting purposes—for example, when sending website visitors an email message concerning a hotel they recently looked at or when placing a lately viewed hotel on other websites—by helping them to strategically decide whether to show or hide a bar chart providing insights into the distribution of rating scores when favorable to do so or, alternatively, whether to shrink or expand a bar chart’s horizontal axis in order to minimize or maximize the mode’s impact. Basically, the findings of our studies suggest that increasing the visual salience of the modal rating by varying a rating distribution’s representation format is most beneficial when the mode is in a favorable position (i.e., four- and five-star ratings).
Finally, customer ratings could also be informative when it comes to pricing decisions. For instance, Kostyra et al. (2016) report a substantial increase in consumers’ willingness-to-pay as the average rating of a product increases. Hence, building on our key finding that the favorability of consumers’ inferences from rating distributions is a positive function not only of a distribution’s mean and volume but also of its mode, managers who integrate customer ratings into their pricing strategies could also benefit from the results of our study.
Limitations and Future Research Directions
Although our work provides valuable new insights into customers’ interpretations of rating distributions, it has some limitations that point to promising opportunities for further research. First and foremost, since our studies highlight the important role of the mode of rating distributions, our findings might encourage researchers to pursue deeper insights into this distribution characteristic. For instance, future research could explore further conditions under which the mode heuristic is more or less likely to be used and, thereby, contribute to an explanation of when and why different locations of the mode influence consumer judgment and decision making. For example, though not explicitly hypothesized, the findings of Study 6 suggest that consumers’ response to the modal rating may also depend on the average rating of a distribution in such a way that the mode becomes more influential as the average rating increases. Thus, future studies could generate a better understanding of the interaction between modal and average rating. In addition, building on factors that have been found to prompt heuristic (rather than systematic) information processing, other potentially relevant amplifiers and boundaries of consumers’ use of the mode may include situational factors such as time constraints (e.g., Nowlis 1995; Suri and Monroe 2003) and outcome relevance (e.g., Martin, Hewstone, and Martin 2007) as well as personal characteristics such as need for cognition (e.g., Axsom, Yates, and Chaiken 1987). Furthermore, while our studies provide convergent evidence for the crucial role of attention in driving consumers’ reliance on the modal rating, a worthwhile issue for future research might be to investigate whether other processes are informative as well. For example, since the majority’s position has been demonstrated to be (sometimes disproportionately) influential in attitude formation (e.g., Martin, Hewstone, and Martin 2007), this may further explain the heuristic use of the mode beyond our reasoning about its eye-catching physical salience.
Second, in our studies, we have established the mode heuristic in consumers’ response to rating distributions in terms of service evaluations, relative preferences, and choices between different alternatives. However, investigating whether the mode heuristic is also applied in other judgmental tasks in the context of online ratings might be another promising route for future research. For instance, extant literature has suggested that consumers’ rating behavior is influenced by already existing ratings (e.g., Moe and Trusov 2011; Sridhar and Srinivasan 2012). These studies, however, typically focus on the relationship between average ratings and subsequent ratings. Given the reported effects of the mode on people’s prepurchase service evaluations, it would be worthwhile to examine whether consumers also anchor their (postpurchase) assessments on the mode of an existing rating distribution when giving a rating.
Third, the aggregated summaries of customer ratings by means of horizontal bar charts in our studies were strongly geared to the illustrations used by review platforms in the real world. However, extant studies on graphical perceptions have examined and compared people’s interpretations of a variety of different types of graphs (e.g., vertical bar charts, pie charts, line graphs, and scatter diagrams) and a variety of different contexts (e.g., financial and health risks). Consequently, future research could investigate whether the overpowering effects of the mode, the most perceptually salient element within a chart of frequency distributions, are robust among different graph formats and informational contexts.
Supplemental Material
Supplemental Material, sj-pdf-1-jsr-10.1177_10946705211012475 - The Mode Heuristic in Service Consumers’ Interpretations of Online Rating Distributions
Supplemental Material, sj-pdf-1-jsr-10.1177_10946705211012475 for The Mode Heuristic in Service Consumers’ Interpretations of Online Rating Distributions by Sarah Köcher and Sören Köcher in Journal of Service Research
Footnotes
Acknowledgments
The authors thank the editor-in-chief, Michael K. Brady, as well as the associate editor, and three anonymous reviewers for their constructive feedback and helpful comments.
Author Contribution
Sarah Köcher and Sören Köcher contributed equally to this article.
Declaration of Conflicting Interests
The author(s) declared no potential conflicts of interest with respect to the research, authorship, and/or publication of this article.
Funding
The author(s) received no financial support for the research, authorship, and/or publication of this article.
Supplemental Material
The supplemental material for this article is available online.
Notes
Author Biographies
References
Supplementary Material
Please find the following supplemental material available below.
For Open Access articles published under a Creative Commons License, all supplemental material carries the same license as the article it is associated with.
For non-Open Access articles published, all supplemental material carries a non-exclusive license, and permission requests for re-use of supplemental material or any part of supplemental material shall be sent directly to the copyright owner as specified in the copyright notice associated with the article.