
Abstract
Increasingly, customers use social media to voice complaints, making those comments visible to a wide range of uninvolved, virtually present others (VPOs). Many companies seek to shift their complaint-handling efforts away from public online platforms and toward private interactions. However, this approach might not be optimal due to the importance of transparency in social media recovery and its impact on VPOs. Using multiple experiments and building on signaling theory, vicarious learning, and trust repair mechanisms, this study reveals that service recovery transparency acts as an important signal of quality, eliciting trust, and improving VPOs’ word-of-mouth (WOM) and purchase intentions. However, service recovery transparency forms a signal of poor quality when the service recovery is unsuccessful, resulting in negative implications for VPOs’ WOM and purchase intentions. Conditional transparency provides transparency about selected aspects of the service recovery (i.e., the process or result), enabling companies to exploit the positive aspects of transparency and evoke more favorable VPO intentions than would arise with complete opaqueness. Such efforts are necessary because even high brand equity firms suffer when failing to provide recovery transparency.
Customers use social media platforms not only to gain information about products, write reviews, or ask questions but also to voice complaints in public and thereby seek a resolution (Causon 2015; Schaefers and Schamari 2016). Companies are reluctant to handle such openly voiced complaints in public, however, because they fear damage to their reputation (Einwiller and Steilen 2015). Consequently, companies often move the service recovery off of public online platforms and into private environments, such as by contacting the customers via e-mail or asking them to make contact through customer service. In this effort to avoid public attention, companies overlook the role played by other consumers in the social media environment, that is, virtually present others (VPOs), who have already read the complaint and expect to learn about its resolution. Similar to complainers, these VPOs can be significant sources of word of mouth (WOM); on average, 825 VPOs read each complaint posted by a dissatisfied customer (Customer Rage Survey 2017).
Considering recent suggestions that consumers want more transparency in service performances (Liu et al. 2015) and the strong potential influence of customers’ copresence in digital service environments (Colm, Ordanini, and Parasuraman 2017), we question whether taking social media service recoveries off the public stage is an effective strategy. VPOs having the chance to observe the service recovery appear decisive for transforming negative quality information (i.e., a complaint) into positive communications that limit unwanted side effects and negative WOM. Although prior research cites the positive effects of performance transparency on customers’ purchase intentions and willingness to pay a price premium (Liu et al. 2015), as well as discussing the influence VPOs have on complainants during service recovery (Schaefers and Schamari 2016), we know of no research investigating the impact on VPOs of transparent social media service recovery. Therefore, to gain a better understanding of how transparency in social media service recovery influences VPOs and their reactions, we investigate several key research questions: Does service recovery transparency in social media affect VPOs’ intentions and can companies benefit from it? What process variables might explain the effect of transparency on VPOs’ behavior? Which boundary conditions are at play?
Our research contributes to service literature in several ways. First, we respond to recent calls for research on the role of the presence of others, especially in social media (Colm, Ordanini, and Parasuraman 2017) because we scrutinize the effects of service recovery on VPOs. Most prior research has focused on the effects of witnessed service recovery encounters on observing customers in off-line contexts (e.g., Mattila, Hanks, and Wang 2014; Van Vaerenbergh, Vermeier, and Larivière 2013). But online service recovery and its effects on VPOs likely differ from off-line service recovery attempts because social media complaints tend to reach vast audiences of actual and potential customers (Customer Rage Survey 2017). This potential audience widens the scope of the complaint, increasing the negative signaling effects, such that they threaten the service provider’s ability to acquire new customers among VPOs. Recent discussions have noted VPOs’ reactions to social media service recoveries (Weitzl and Hutzinger 2017), but these insights remain scarce.
Second, we examine service recovery transparency by analyzing its influence on VPOs. In so doing, we build on research that shows that transparency leads to favorable customer outcomes (Liu et al. 2015). We argue that transparent service recovery can transform the potential negative information of an observed service failure into a positive service quality signal. Transparent service recoveries also signal better service quality, which can increase feelings of trust among VPOs, ultimately strengthening their WOM and purchase intentions. In extending previous research on transparency, we differentiate process transparency from result transparency and scrutinize their different effects on VPOs. Specifically, we investigate whether conditional transparency, revealing either the process or the result of the service recovery, can be effective when full transparency is not advisable (e.g., an issue has not been solved). Our finding that conditional transparency exerts a positive quality signaling effect on VPOs and related outcomes is both novel and relevant for practitioners.
Third, we specify two important contextual factors. In particular, unsuccessful service recoveries function as boundary conditions; in such situations, transparency does not exert positive effects on VPOs’ intentions. Therefore, when handling unsuccessful service recoveries publicly, being transparent turns the positive into a negative service quality effect. Being transparent about all components of the service recovery process and its result might be a questionable strategy for service providers that fail to recover, though. Furthermore, brand equity provides another contextual factor, and by testing it, we clarify the implications of service recovery transparency when other service quality information is also available. Brand equity can act as a quality signal that affects the customer evaluations of positive and negative service encounters (e.g., Brady et al. 2008; Erdem and Swait 1998). By comparing the importance of service recovery transparency for firms with low and high brand equity, we gain new insights into whether transparency has an additional effect, despite or precisely because of the strong brand equity signal. Consequently, we contribute to current research on signaling phenomena in service recovery (e.g., Hazée, van Vaerenbergh, and Armirotto 2017) and advance understanding of the effects of transparency (Liu et al. 2015).
In gathering these insights, we also offer practical guidance for firms that must cope with complaints on social media platforms. Many companies try to sweep social media service recoveries off the public stage to decrease attention on them (Einwiller and Steilen 2015). We recommend against this approach, as it can have unintended effects on VPOs. Instead, this study provides detailed information about when and how managers should increase transparency in social media service recovery and under which conditions transparency requires more caution. For service firms, we also outline the consequences of using conditional transparency in service recovery efforts when being fully transparent is not possible. Even companies with high brand equity cannot underestimate the appeal of service recovery transparency to VPOs.
Theoretical Framework
VPOs in Service Recovery
In most service encounters, other customers are present, and they observe the interaction, including service failures and recoveries (Schaefers and Schamari 2016). The presence of other customers is a critical determinant of the customer experience and the image of the service provider (Colm, Ordanini, and Parasuraman 2017). Focal and observing customers influence each other’s service and recovery experiences (e.g., Baker and Wakefield 2012; Schaefers and Schamari 2016). Accordingly, research increasingly examines the effects of other customers on the focal customer in both off-line and online settings (Table 1). Whereas some articles concerning off-line settings test the effects on the focal customer or complainant (e.g., Argo, Dahl, and Manchanda 2005; Chen, He, and Alden 2014; Tombs and McColl-Kennedy 2013), others consider the effects on the observers (e.g., Steinhoff and Palmatier 2016; Wan, Hui, and Wyer 2011). Similarly, in an online context, research has investigated the impacts of others on the focal customer or complainant (e.g., Naylor, Lamberton, and West 2012; Schaefers and Schamari 2016) as well as the influence on others who observe a focal customer’s service encounter (e.g., Wu et al. 2015).
Research on the Influence of Observing Customers in Service (Recovery) Encounters.
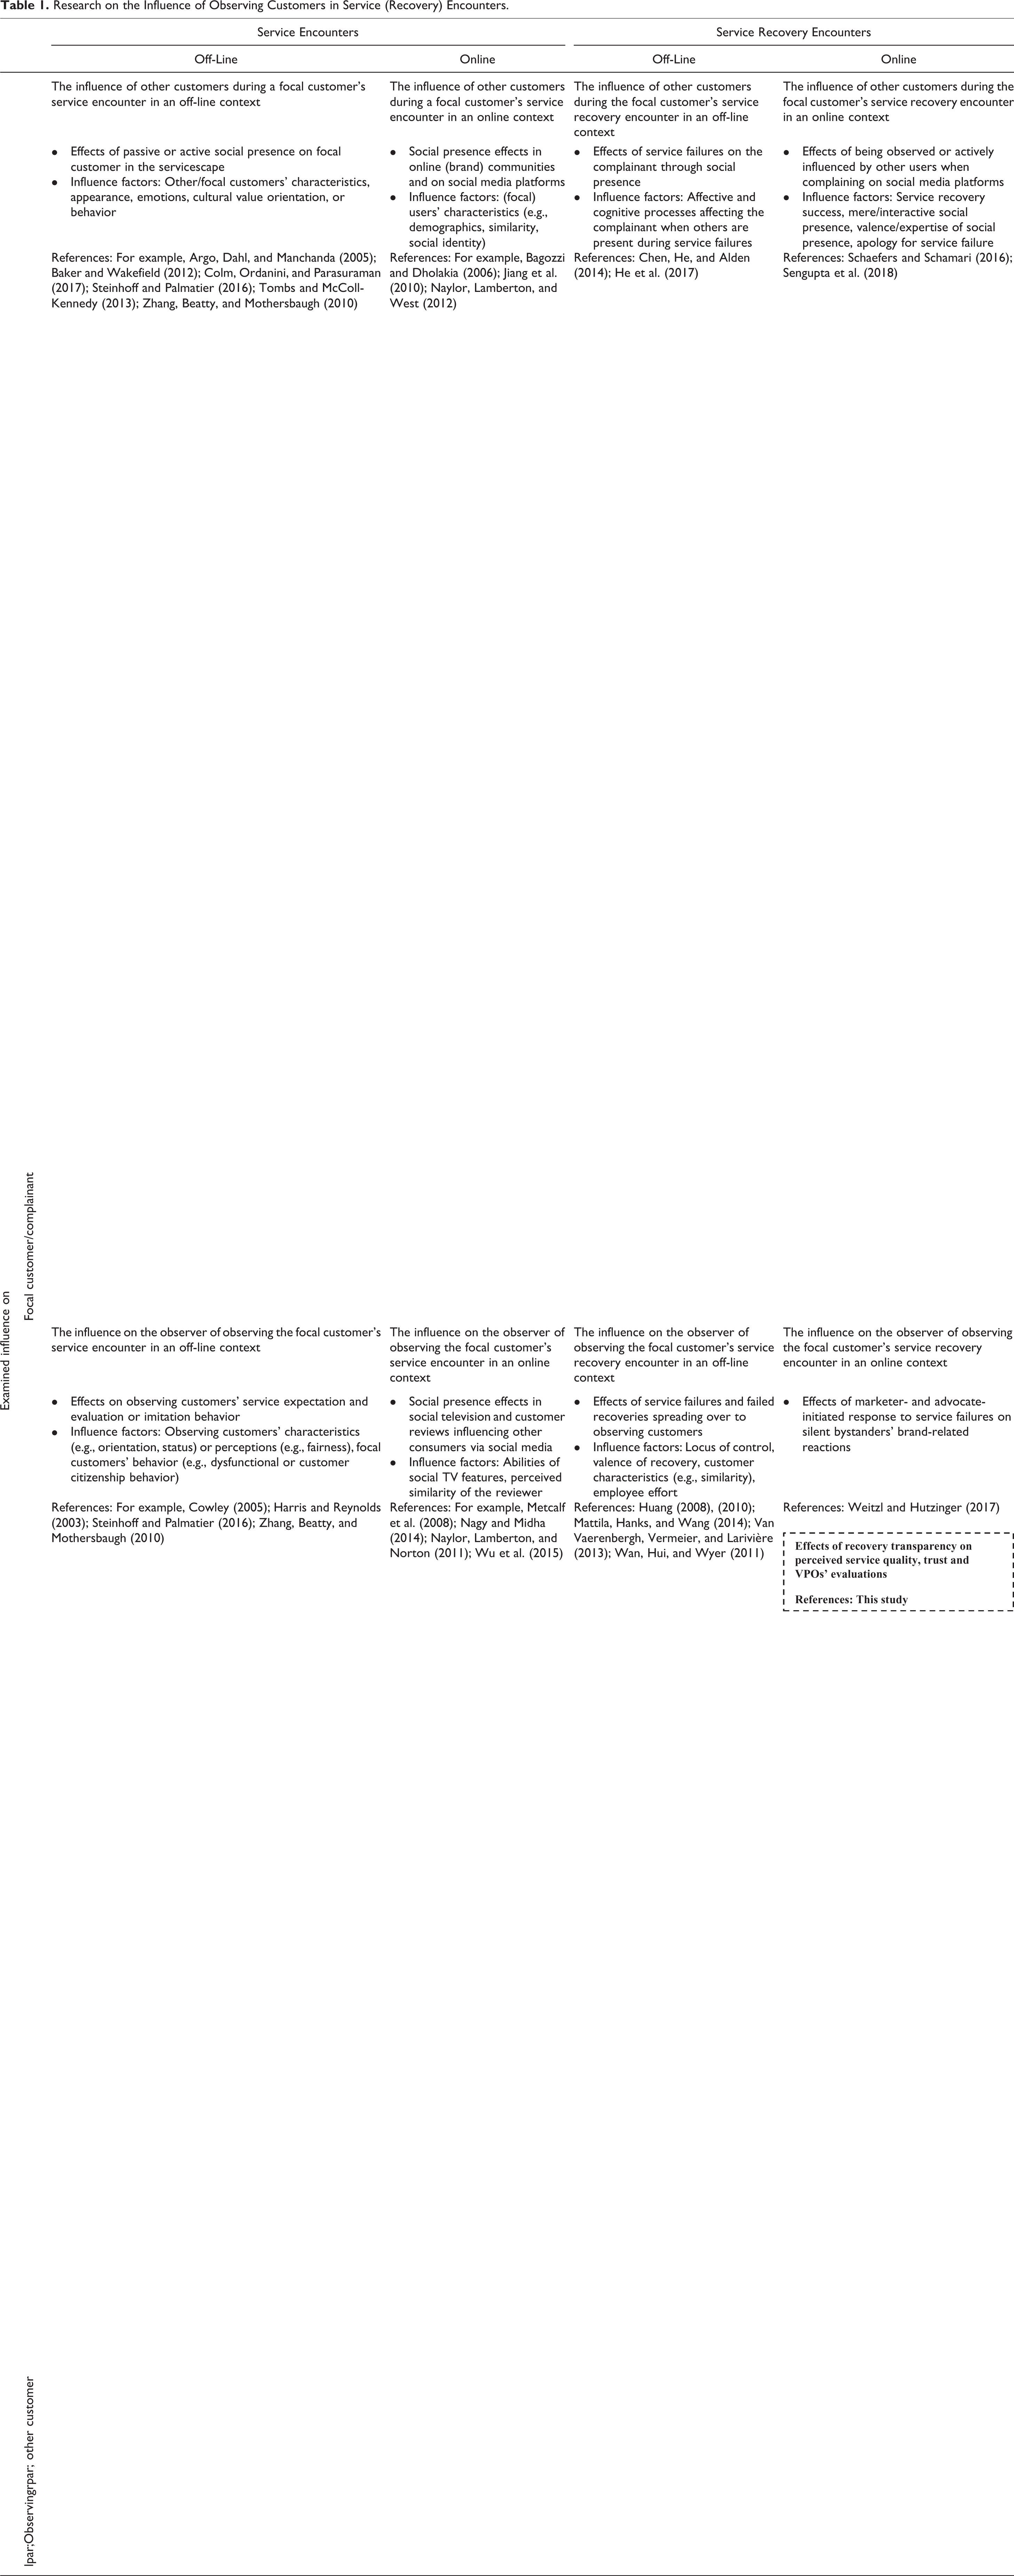
Yet limited evidence is available regarding the effects of witnessing a firm’s service recovery efforts online (Table 1). Weitzl and Hutzinger (2017) recently compared the effects on bystanders of marketer- versus advocate-initiated online service recovery responses, but otherwise, we did not identify any studies referring to the effects on bystanders of observing service recoveries online. Given the vastly increasing volume of negative service experience descriptions on social media platforms, or their considerable potential threats to service providers (Customer Rage Survey 2017), this is surprising. To determine how observing an online service recovery might affect the observers’ intentions, we focus on social media contexts where the other customers’ presences are abstract (Naylor, Lamberton, and West 2012). Accordingly, we refer to observers as VPOs, defined as other consumers in a social media environment who are virtually present, and who observe the service recovery experience of a focal customer.
Service Recovery Transparency for VPOs
We define service recovery transparency as the extent to which a customer’s reactions toward the service failure and recovery or a service provider’s recovery efforts, handling, or results are visible to other observing consumers (i.e., VPOs). Thus, this definition comprises three facets that constitute service recovery encounters: (a) the customer’s perception of the nature and severity of the problem or failure, (b) the company’s response to the complaint, and (c) the customer’s evaluation of the company’s response. This research, however, focuses on the transparency pertaining to the provider’s response and thus on the second facet mentioned.
Transparency can provide an important quality signal that VPOs use to learn about the service provider’s capabilities through observation as predicted by signaling theory. Observable signals can help receivers overcome information asymmetry (Spence 1973). If receivers cannot observe the signal, communication becomes more difficult (Connelly et al. 2011). For example, if a seller’s quality can be evaluated only after making a purchase, observable signals help consumers learn about the seller’s quality before consumption (Kirmani and Rao 2000). Providing information about a firm’s service offerings signals their goodwill, reduces customers’ uncertainty, and influences purchase intentions (Liu et al. 2015).
According to research on trust repair (Gillespie and Dietz 2009), applying appropriate trust repair mechanisms, such as signaling trustworthiness with an accurate, transparent repair process, is especially valuable after the service provider has broken a customer’s trust by causing a service failure (Korsgaard, Brodt, and Whitener 2002). In service failure situations, adequate signals from the violator of the trust (i.e., the service provider) are essential in preventing harm to the company’s reputation, minimizing negative WOM, and stimulating future purchases (Burton and Khammash 2010; Maxham and Netemeyer 2002). In a social media context, we anticipate that a transparent service recovery similarly offers receivers a signal of quality and evokes trust repair effects.
We also borrow from social learning theory, relying on vicarious learning as a third theoretical foundation for predicting why signals elicited by transparency affect VPOs. According to social learning theory, “virtually all learning phenomena resulting from direct experiences can occur on a vicarious basis through observation of other people’s behavior and its consequences for them” (Bandura 1971, p. 2). That is, people can develop behavioral patterns and emotional responses by observing the behavior and emotions of others, without having to undergo the experiences themselves (Bandura 1971). Vicarious learning implies an “increase or decrease of an observer’s behavior that is similar to that of a model, as a result of watching the model’s behavior be reinforced or punished” (Masia and Chase 1997, p. 41). In this sense, vicarious learning should enable VPOs to process trust-repairing signals sent through transparent service recoveries, leading to changes in their intentions. Online environments provide substantial amounts of customer-generated data to help customers easily and precisely observe or learn about others’ behaviors (Libai et al. 2010). Thus, it is important to understand the signals connected with customers’ interpretation of transparency and to analyze when and how customers’ inability to observe this signal evokes negative perceptions (Libai et al. 2010). We posit that handling online complaints transparently on social media platforms serves as a quality signal to VPOs, which repairs consumer trust and changes consumer intentions merely through observation.
Overview of Studies
To address our research questions, we conducted four experimental studies to ensure robust support for the effects of service recovery transparency on VPOs’ intentions. Study 1a, featuring a delivery service, reveals that transparent service recovery on social media platforms leads to more favorable outcomes and that service quality and trust constitute underlying cognitive processes for VPOs. In Study 1b, we test whether the positive effect of transparency on VPOs’ intentions persists when the service recovery is unsuccessful. With Study 2, we seek a fine-grained understanding of service recovery transparency by differentiating process transparency from result transparency. Finally, in Study 3, we investigate the role of transparency when additional information sources are present. Specifically, we strive to understand whether the effects of service recovery transparency depend on brand equity levels.
Study 1: Service Recovery Transparency Effects on VPOs
The Influence of Service Recovery Transparency on VPOs’ Intentions
Service recovery performance clearly affects the purchase and WOM intentions of complainants (Maxham and Netemeyer 2002). However, it also affects external, observing customers who witness the failure and recovery (Mattila, Hanks, and Wang 2014; Van Vaerenbergh, Vermeier, and Larivière 2013). In social media environments, information on the service recovery performance is only observable to others when shared publicly. In accordance with vicarious learning, we expect that transparent information provided during social media service recoveries influences VPOs’ perceptions of the company. Specifically, we reason that a transparent service recovery sends a signal of trustworthiness (Lazarus and McManus 2006), which may increase (potential) customers’ behavioral intentions (Liu et al. 2015). That is, companies that act transparently are likely to increase customers’ intentions to spread positive WOM and to purchase from them (Kang and Hustvedt 2014). Thus, service providers must provide (potential) customers with observable signals, such as a transparent service recovery, to facilitate the information search that shapes the purchasing decisions and WOM intentions of those customers. Consequently, we propose:
The Mediating Roles of Service Quality and Trust
Observable signals can help consumers learn about a seller’s quality level before consumption (Kirmani and Rao 2000). Transparent information may represent such an observable cue by emitting a signal of service quality that can reduce customers’ uncertainty (Liu et al. 2015). Consequently, and building on vicarious learning, we state that providing transparent service recovery information on social media platforms is a prerequisite for transmitting the important quality signals that enable VPOs to learn, through observation, about a service provider’s performance. This perception of service quality is, in turn, an important requirement for installing trust—defined as a collection of beliefs about a vendor’s ability, integrity, and benevolence (Bhattacherjee 2002)—in service interactions. Gounaris and Venetis (2002) found that perceptions of service quality positively influence the degree of trust between a company and its stakeholders. Therefore, we assume that a positive quality signal that installs trust and improves customer intentions can be generated only if the VPOs receive sufficient information about another customer’s service recovery. The quality trust mechanism is viable during service recovery situations wherein trusting relationships between customers and organizations have been damaged by a service failure (Aaker, Fournier, and Brasel 2004) and trust must be repaired (Gillespie and Dietz 2009).
Consumers use certain explicitly and implicitly provider-related cues, such as service quality, to progressively build up trust (Doney and Cannon 1997). Judging a provider’s performance to be either of high or low quality and attributing this perceived quality to the ability of the service provider leads to an increase or decrease of a consumer’s trust in the competence of the service provider (Singh and Sirdeshmukh 2000). Therefore, transparency in service recovery can provide an effective tool for trust repair (Gillespie and Dietz 2009), by emitting a signal of service quality. In turn, a trusting relationship between a company and stakeholders, such as VPOs, should lead to favorable outcomes, like purchases (Schlosser, White, and Lloyd 2006) as well as WOM intentions (Sichtmann 2007). We expect VPOs to express these outcomes when their feelings of trust have increased due to heightened perceptions of service quality, as achieved by observing the company’s transparent service recoveries of others. We accordingly offer a serial mediation hypothesis:
1
The Unintended Effects of Service Recovery Transparency
Not all service failures can be resolved (Michel, Bowen, and Johnston 2009), and poor service recoveries affect complaining customers’ service evaluations to the extent that they even might terminate the relationship (Keaveney 1995). Such negative experiences can also spread from the complaining to the observing customers (Van Vaerenbergh, Vermeier, and Larivière 2013). Witnessing unsuccessful service recoveries decreases observers’ likelihood of returning to a store (Mattila, Hanks, and Wang 2014), as well as their intentions toward repurchasing (Van Vaerenbergh, Vermeier, and Larivière 2013). In line with signaling theory, we predict that these negative effects also occur when VPOs confront a failed service recovery on a social media platform. It is likely that observing the inability of the service provider to resolve the problem turns the strong positive signal of quality into a negative one, negatively affecting VPOs’ intentions.
Study 1a: The Effect of Service Recovery Transparency on VPOs’ Intentions
Study design and sample
Study 1a was a single-factor, between-subjects experiment conducted in a delivery service setting. Participants were asked to imagine they were looking for a new food delivery service and came across a firm called Delivericious on social media. While they reviewed information about the firm, they noticed a recent complaint from a customer named Alex. Alex noted that in a recent delivery, Delivericious had forgotten items despite charging them for the full order. Unfortunately, Alex did not notice the error until after the delivery person had left, so she or he was contacting the firm to see whether they could retroactively resolve the problem. To manipulate the degree of service recovery transparency, we varied the extent of the service recovery that respondents could witness (see Figure 1). These participants all came from a Western European country and were gathered by the crowdsourcing platform Prolific. 2 Participants were randomly assigned to the treatment groups. We eliminated nine participants who failed the quality or attention checks, and the final sample consisted of 97 respondents (48.5% female; 19–67 years old, M = 37.47 years; standard deviation [SD] = 10.90).
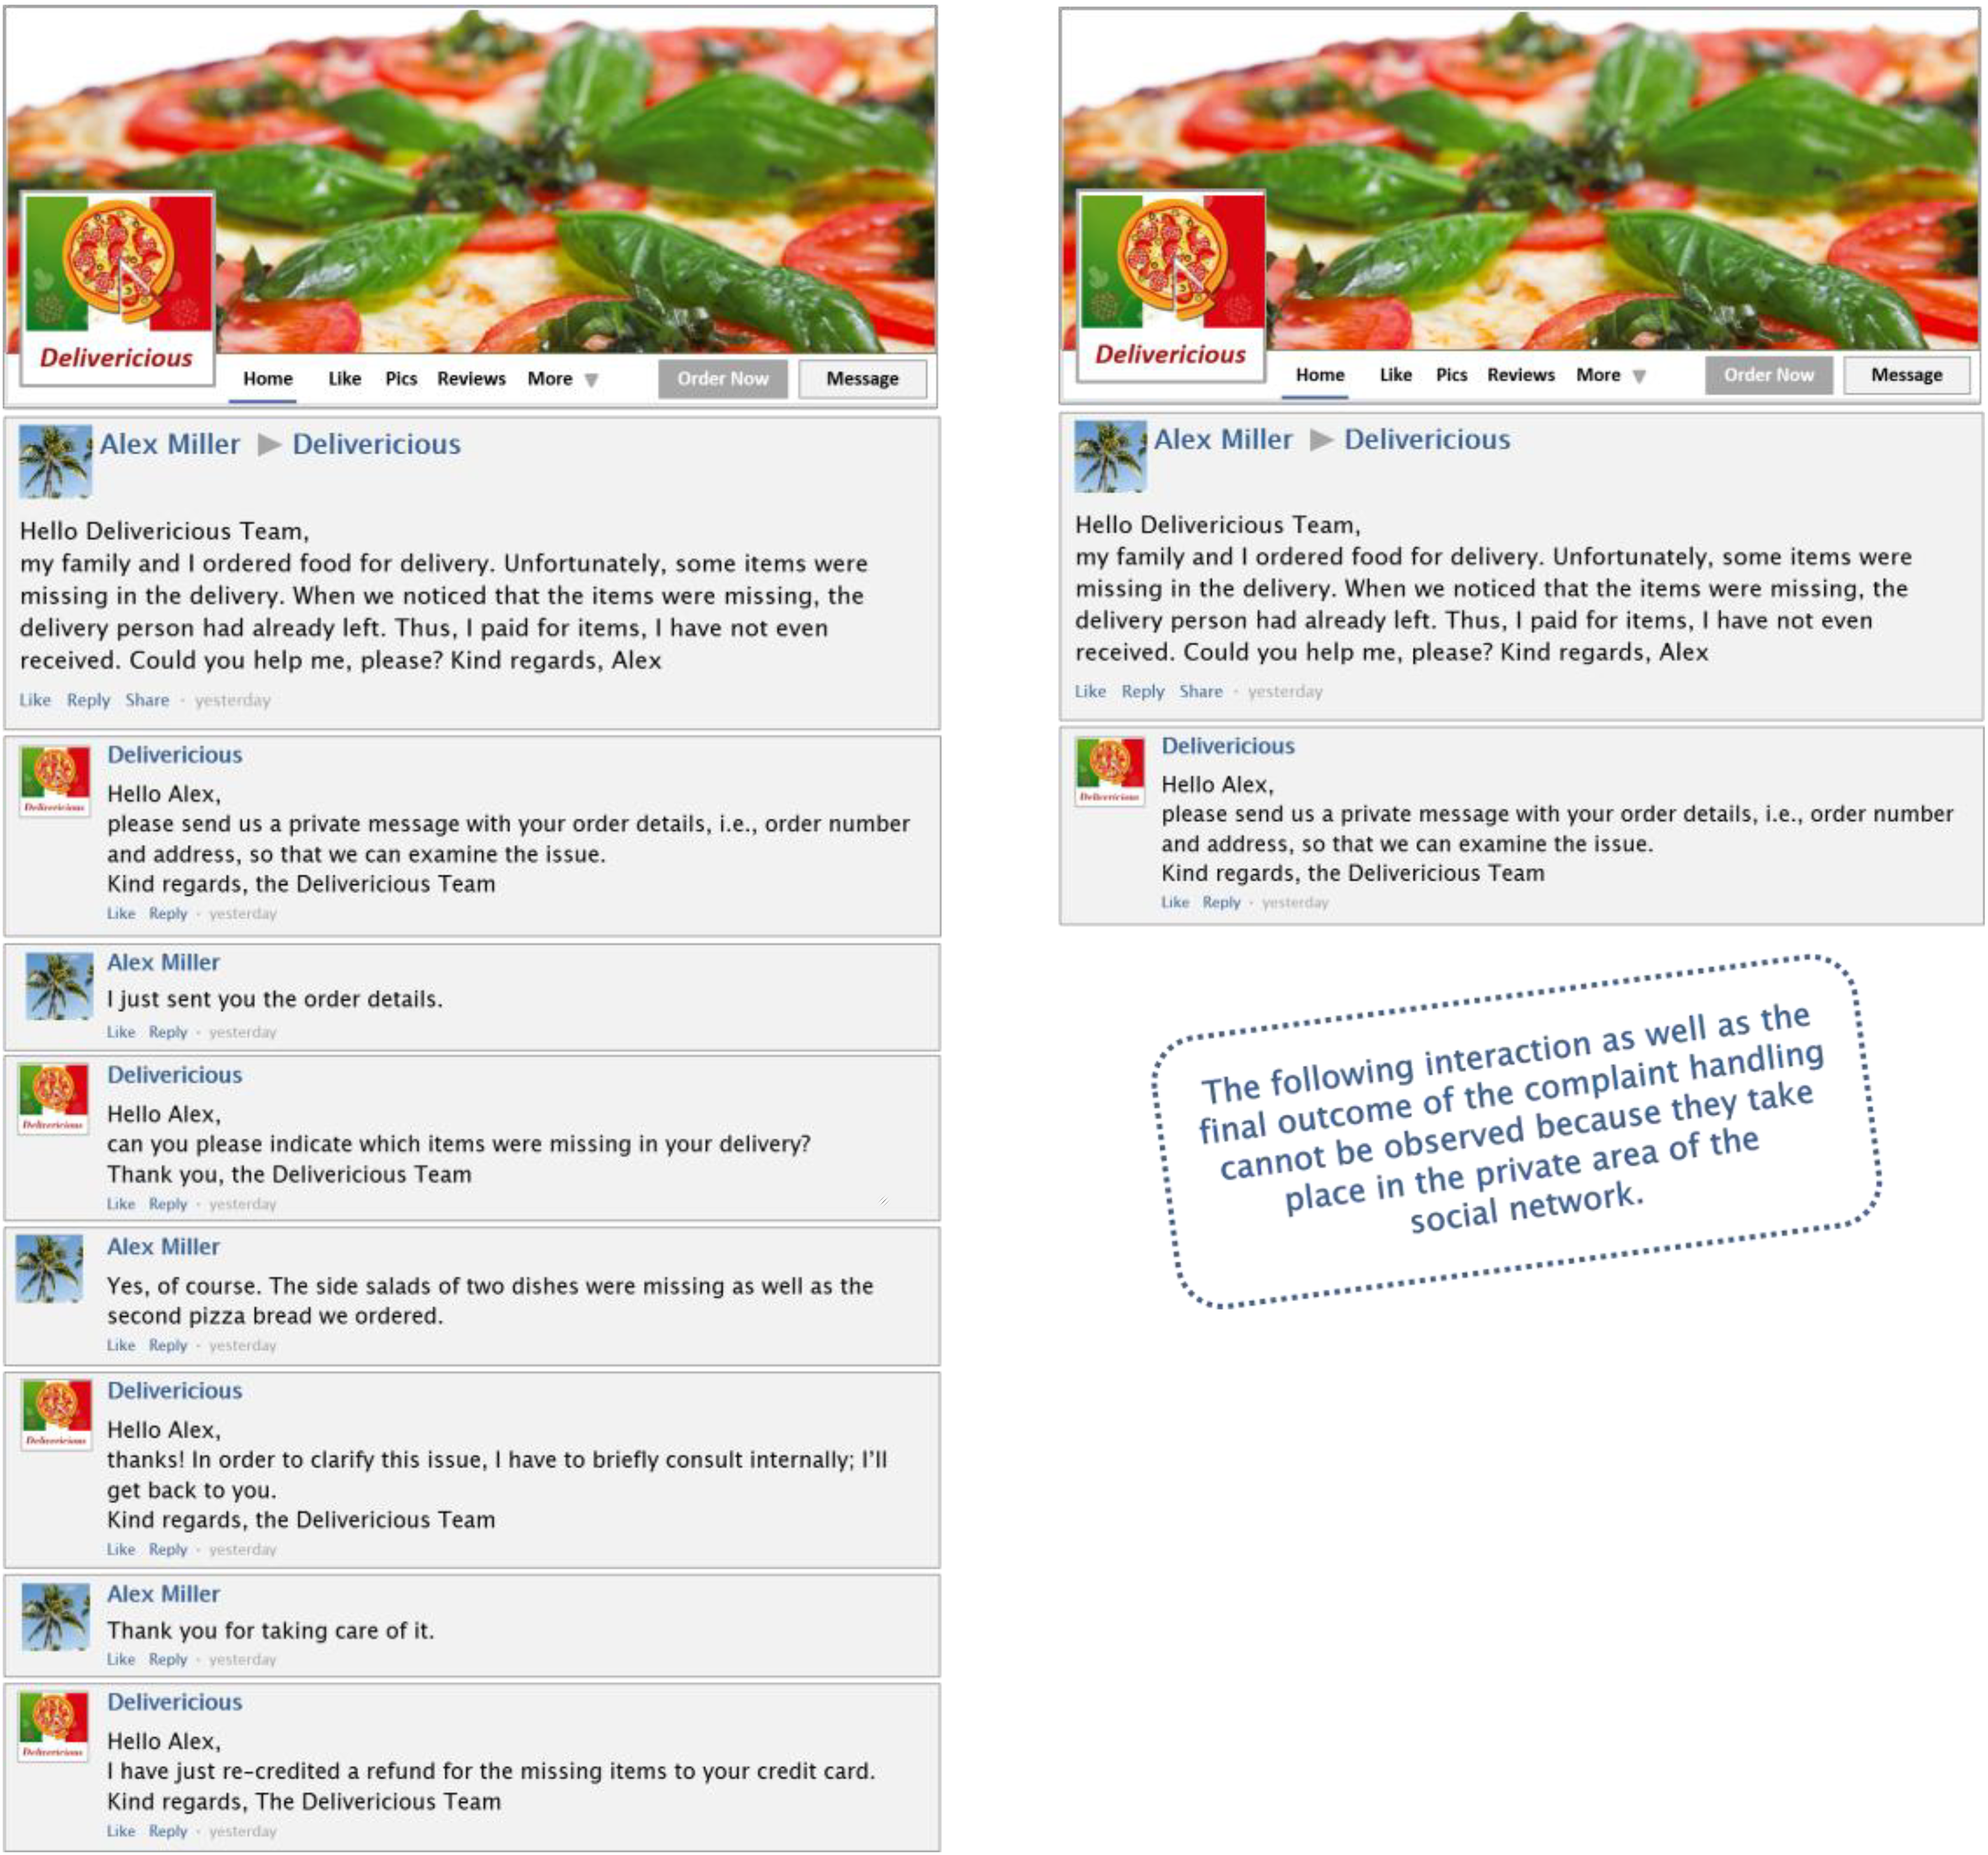
Transparent and opaque scenarios, Study 1a.
Manipulation checks and psychometric properties
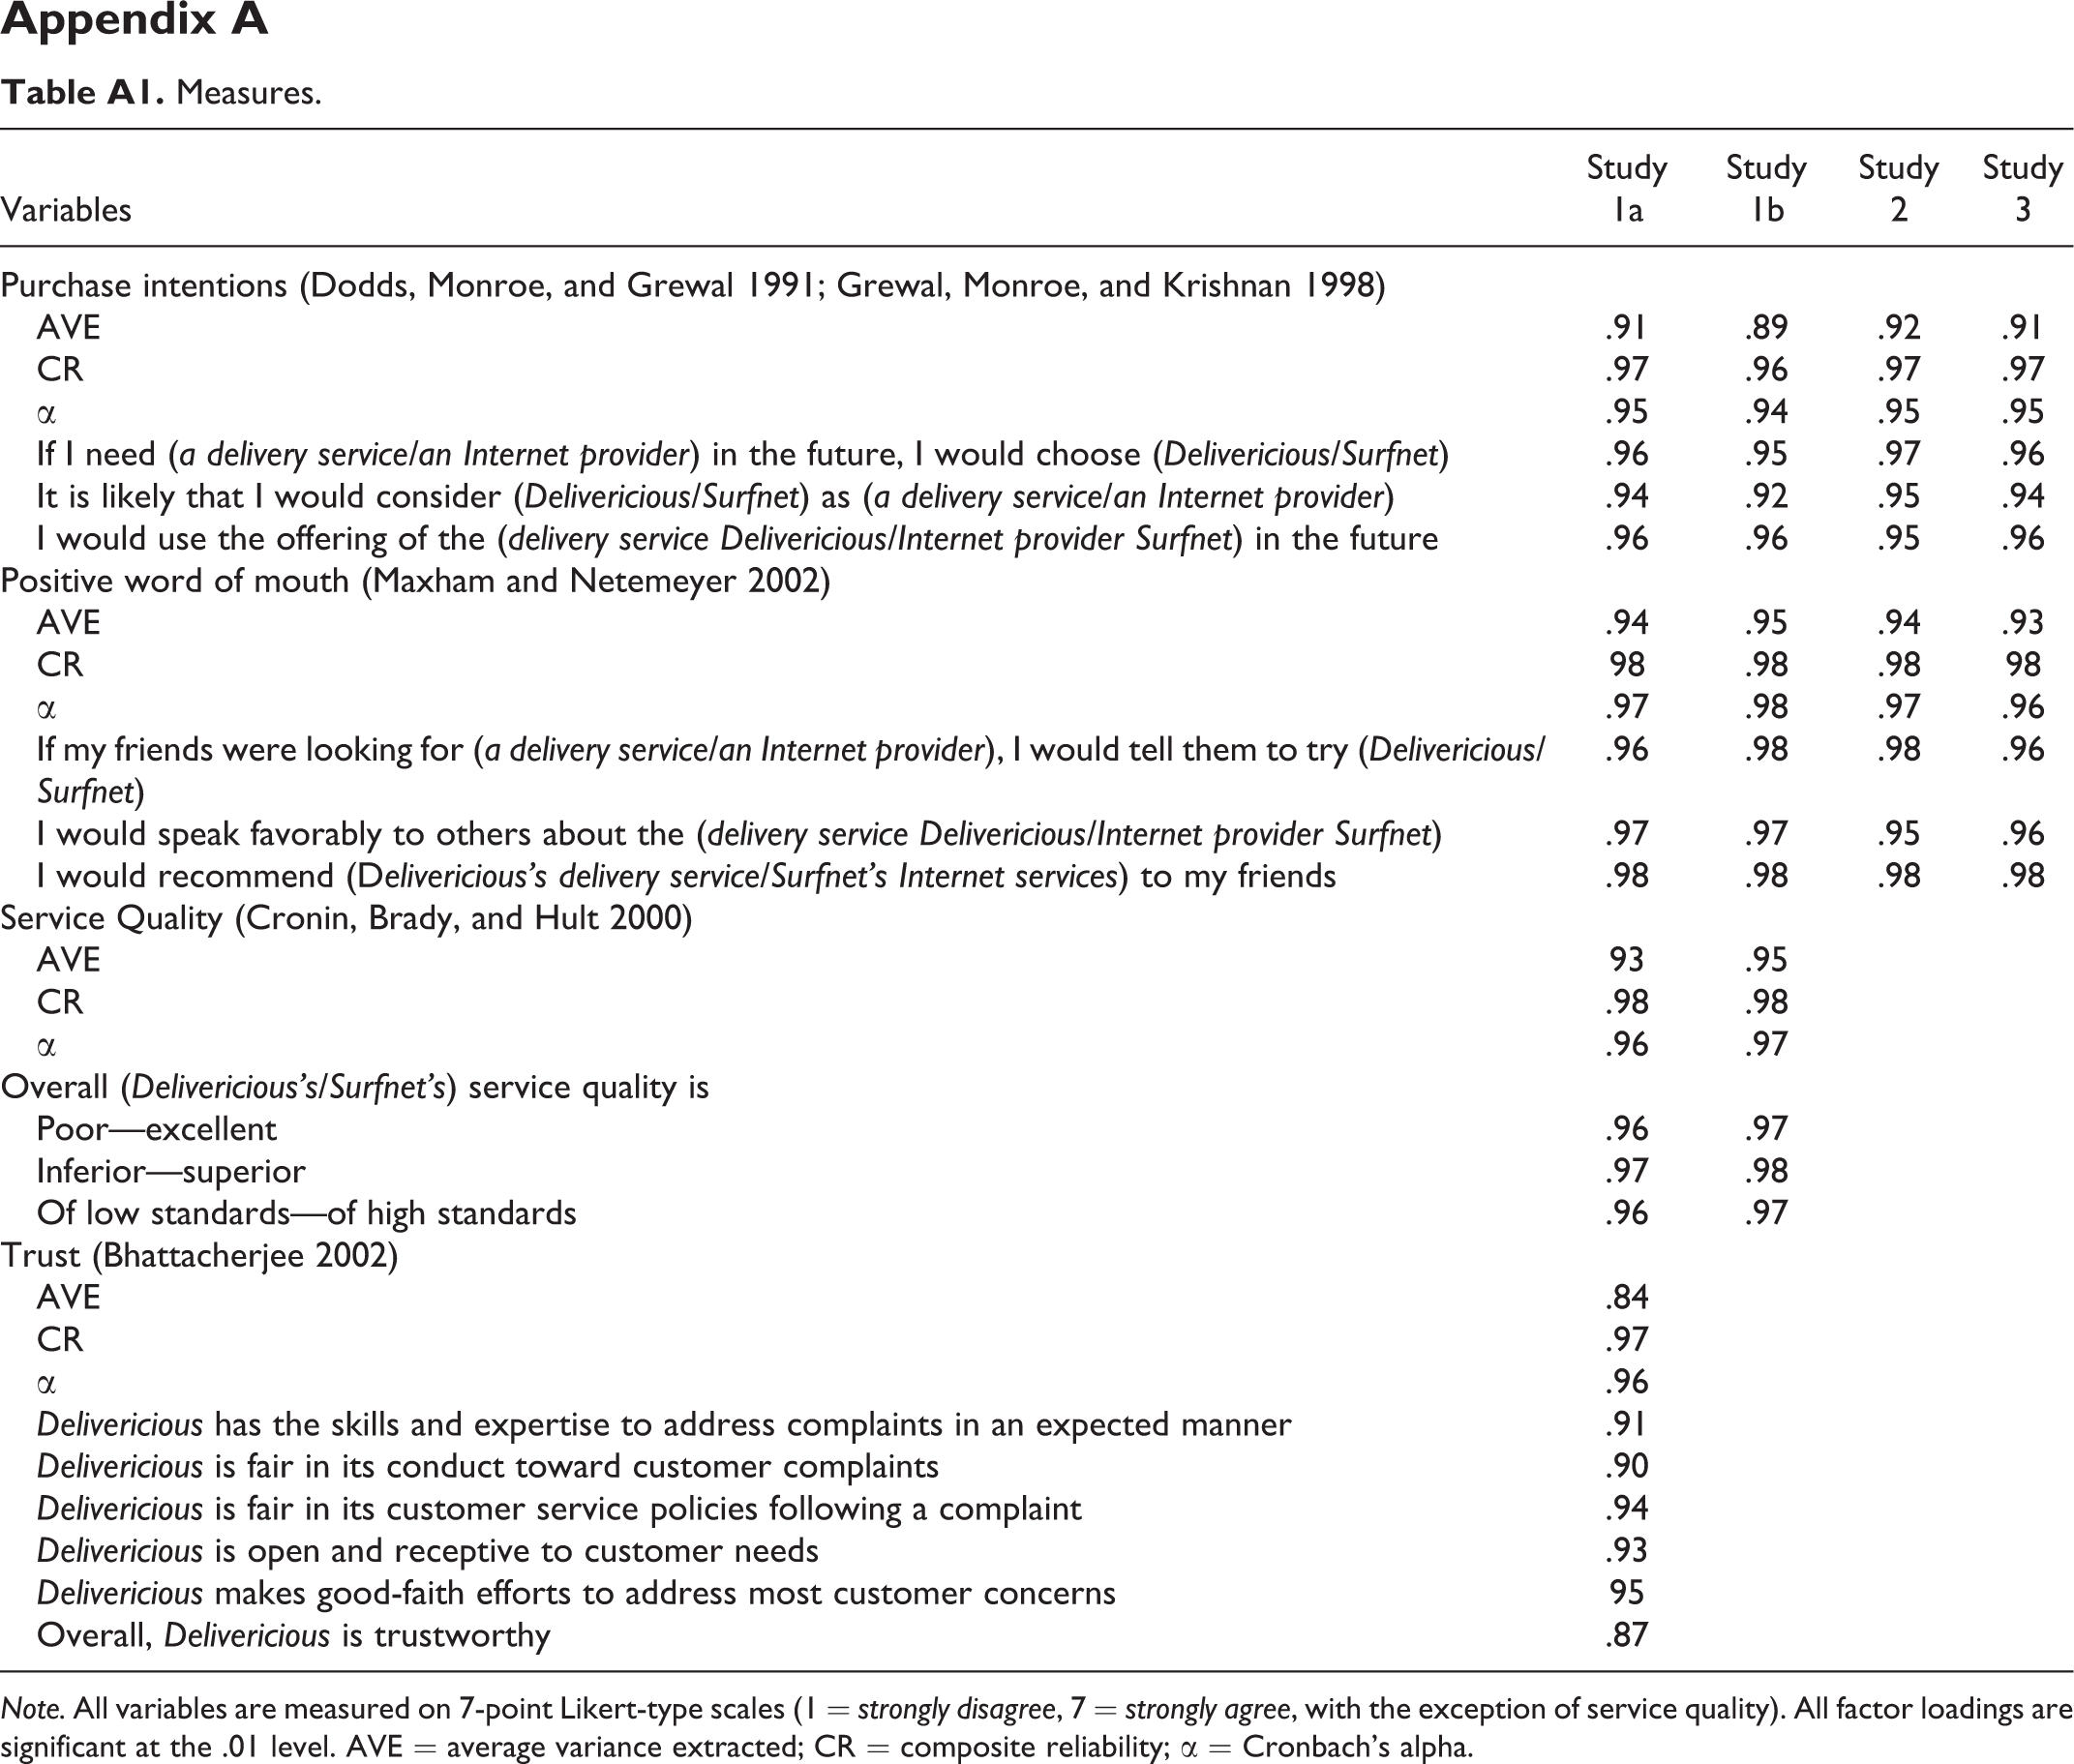
After reading the scenario, the participants responded to questions about the dependent variables and the mediators, and they completed the manipulation and attention checks. All variables were measured using established scales adapted to the study’s context (see Appendix A) and rated on 7-point Likert-type scales (1 = strongly disagree, 7 = strongly agree; with the exception of service quality). As a manipulation check, we asked respondents to indicate the extent to which they agreed with, “I was able to fully observe how Alex’s problem was handled by the delivery service Delivericious.” They correctly indicated whether they were in the transparent (Mtransp = 5.47) or opaque (Mopaque = 2.58; t = −10.31, p < .001) condition. The respondents also understood that they were independent observers in the service recovery scenario (M = 6.00, SD = 1.63). Realism checks confirmed that they perceived the scenario as realistic (M = 6.29, SD = 1.00).
To assess the psychometric properties, we used partial least squares structural equation modeling (PLS-SEM; Ringle, Wende, and Becker 2015). The Cronbach’s αs, composite reliabilities, and average variances extracted indicated good reliability and convergent validity (see Appendix A). To check for discriminant validity, we applied two different criteria. First, we used the Fornell and Larcker’s (1981) criterion, confirming discriminant validity for all constructs. In a second step, we checked for the more conservative heterotrait–monotrait (HTMT) criterion (Henseler, Ringle, and Sarstedt 2015; Voorhees et al. 2016). As suggested by Voorhees et al. (2016), we took a cutoff value of .85, this value has been shown to offer “the best balance between high detection and low arbitrary violation rates” (p. 131). In doing so, we detected problems with meeting the HTMT.85 for purchase intentions in two cases (i.e., with WOM intentions and service quality). We then deleted the first item from the Purchase Intentions Scale, allowing us to reach discriminant validity according to the HTMT.85 value in all cases except for the comparison of WOM and purchase intentions, which met a cutoff of .90. As WOM and purchase intentions are conceptually highly related constructs, the usage of the HTMT.90 criterion appears warranted (Henseler, Ringle, and Sarstedt 2015).
Results
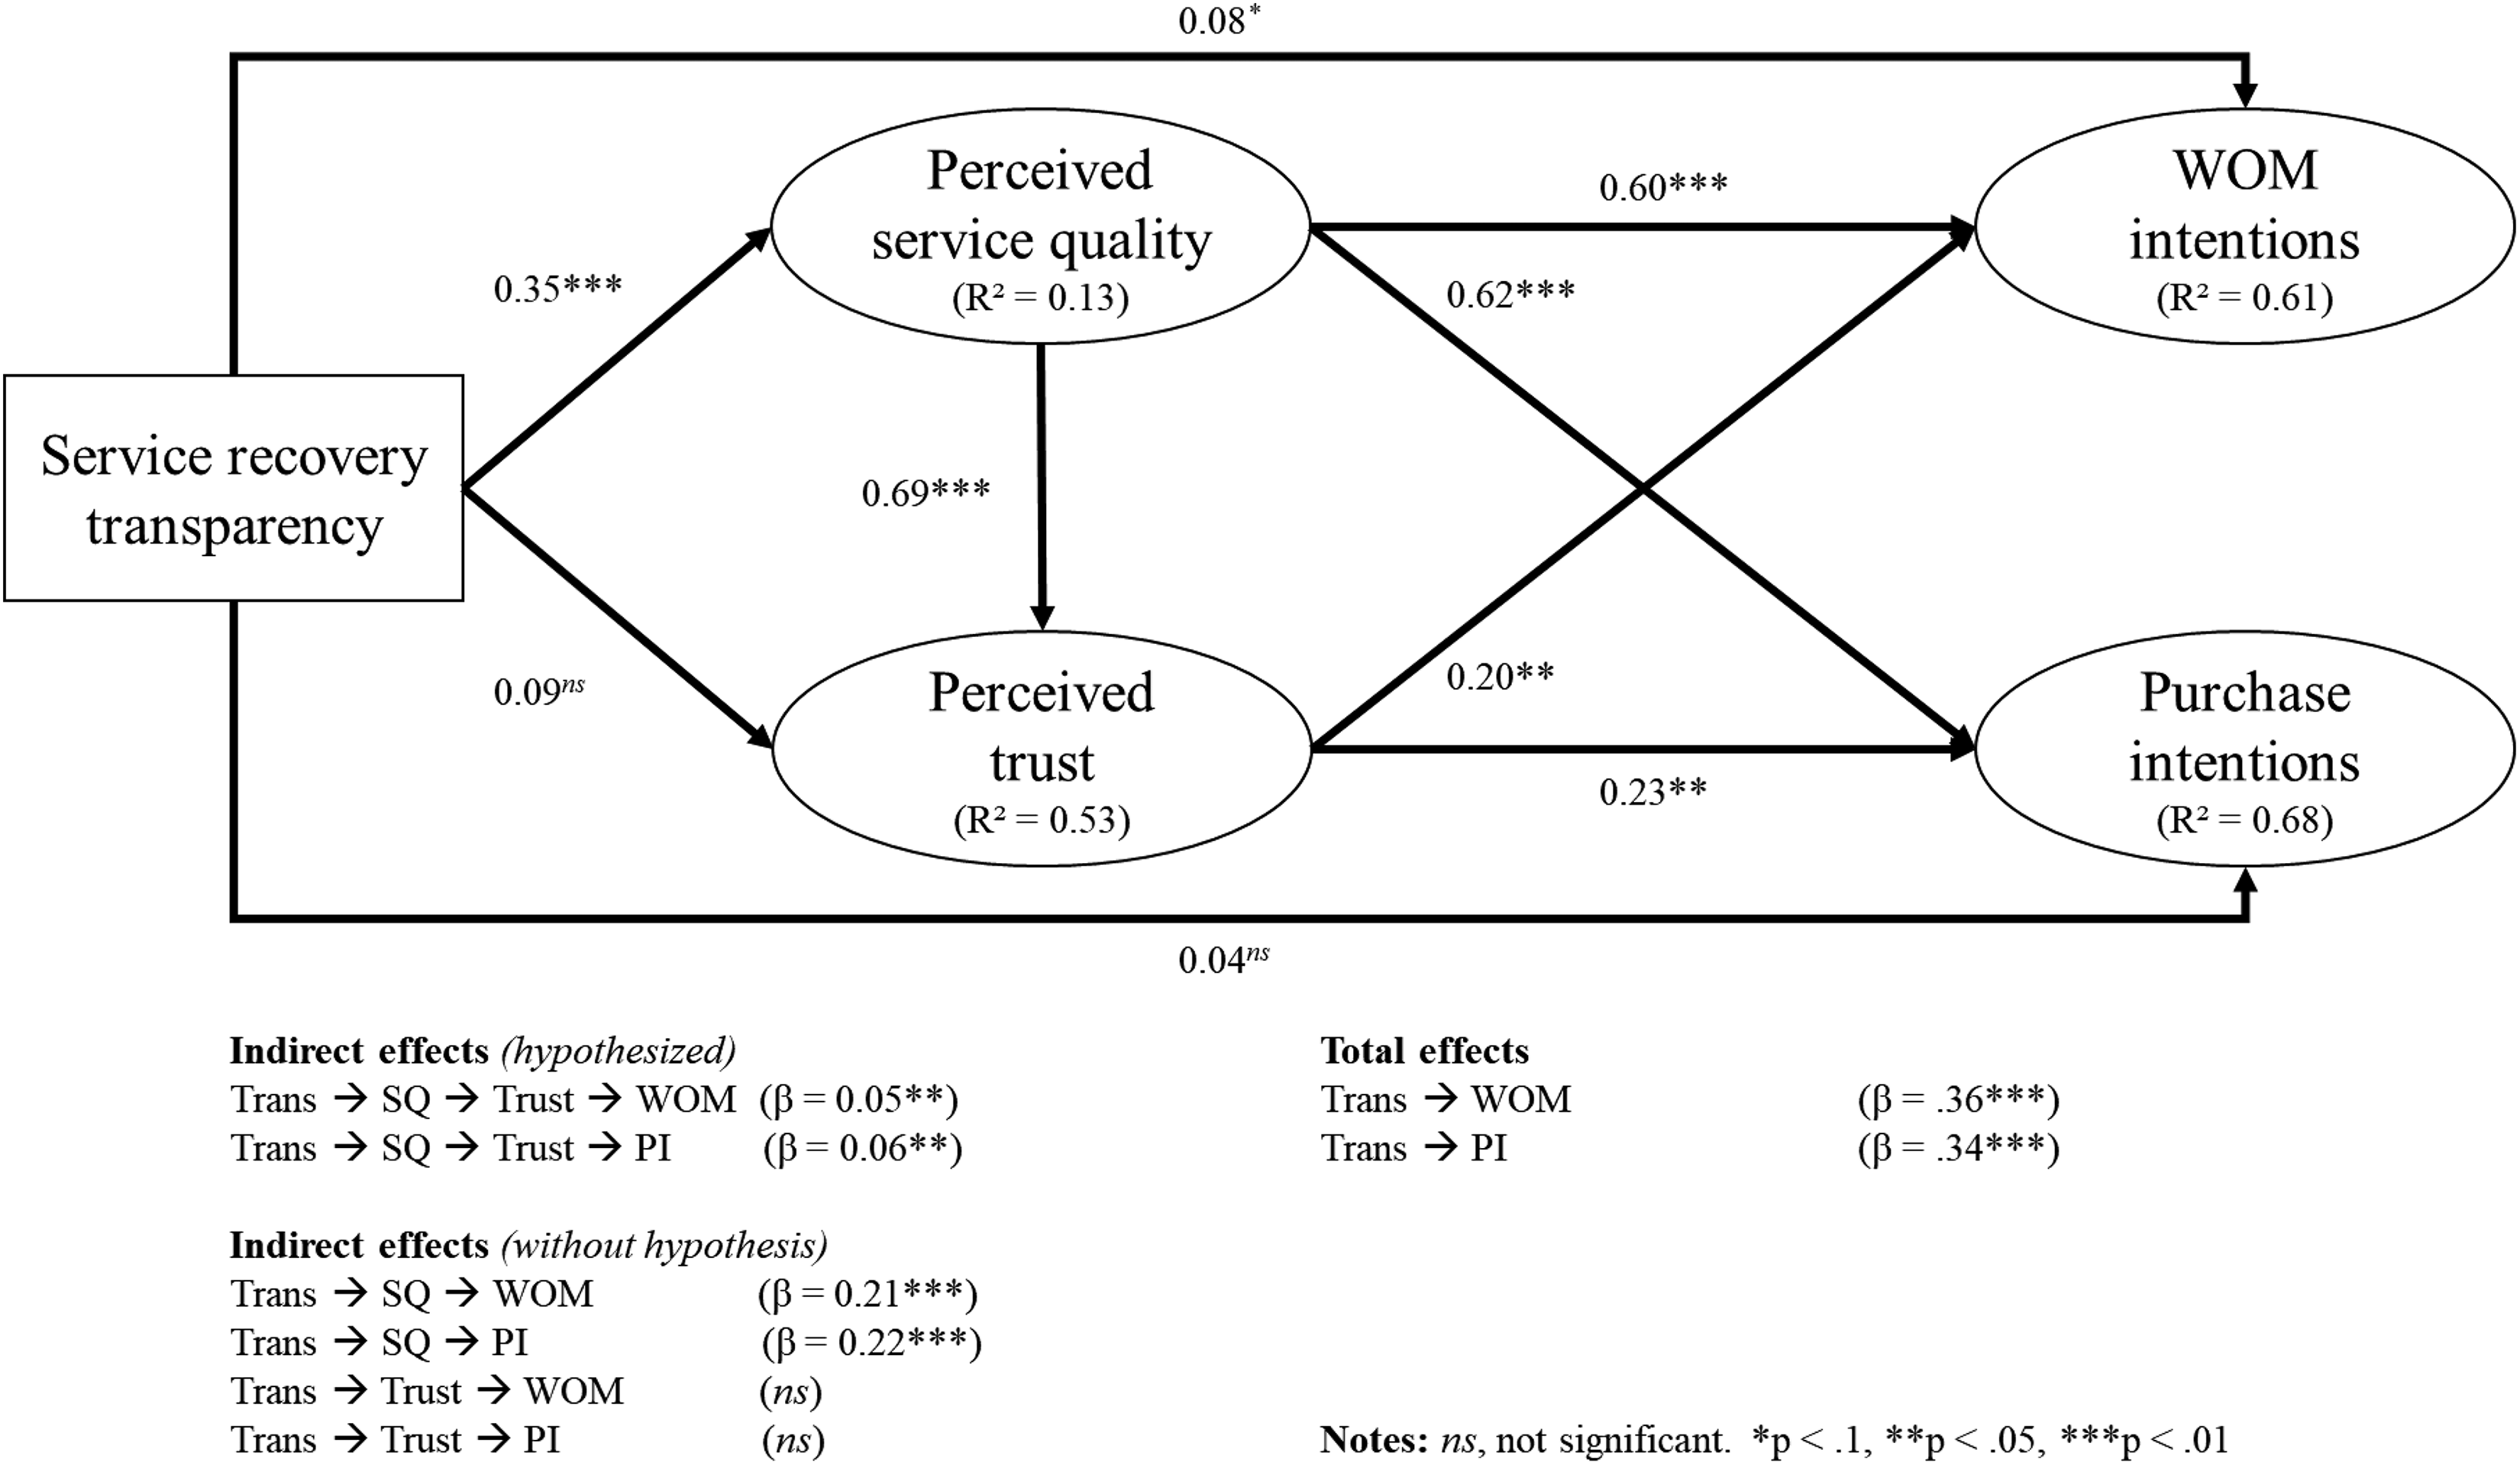
To account for multiple correlated dependent variables in our model, and because we aimed to test mediations, we tested our hypotheses using PLS-SEM (Ringle, Wende, and Becker 2015). The primary reason for using PLS instead of a covariance-based SEM was the sample size. Studies have found that using PLS is recommended and most appropriate for samples sizes of 250 and below (Reinartz, Haenlein, and Henseler 2009). Apart from the effects hypothesized in Hypotheses 1 and 2, we also included paths for mediations via service quality or trust, respectively, to rule out different explanations for the underlying process we hypothesized in Hypothesis 2. Figure 2 displays the PLS-SEM and its results. In line with our hypotheses, we present one-sided p values to show the significance of the effects. The bootstrap was conducted using 5,000 subsamples. In support of Hypothesis 1a and b, we find significant positive total effects of transparency on VPOs’ WOM intentions (β = .36, t = 4.10, p < .001) and purchase intentions (β = .34, t = 3.86, p < .001). 3 Moreover, we find significant indirect effects, suggesting serial mediation through service quality and trust, for WOM (β = .05, t = 1.68, p < .05; accounting for 13.9% of the total effect) and purchase intentions (β = .06, t = 1.69, p < .05; accounting for 17.6% of the total effect). Thus, Hypothesis 2a and b is supported. The mediation analysis also indicates single mediation through service quality for the two outcome variables (WOM intentions β = .21, t = 3.35, p < .001; accounting for 58.3% of the total effect; purchase intentions, β = .22, t = 3.68, p < .001; accounting for 64.7% of the total effect). For purchase intentions, the positive direct effect of service recovery transparency vanishes in the presence of the mediators (β = .04, t = 0.62, ns), suggesting an indirect-only mediation (Zhao, Lynch, and Chen 2010). For WOM, the positive direct effect remains marginally 4 significant (β = .08, t = 1.33, p < .1), proposing a complementary mediation (Zhao, Lynch, and Chen 2010). For both outcome variables, we observe no single mediation through trust. 5 The blindfolding procedure revealed positive Q2 values for all constructs, indicating that the Stone–Geisser’s criterion is met. Online Appendix 1 (Panel a) presents the means, SDs, and correlations of all variables.
Effect of service recovery transparency on virtually present other’s intentions, Study 1a.
Study 1b: The Effects of Transparency for Unsuccessful Service Recovery
Study design and sample
In this single-factorial, between-subjects, control group design, we kept transparency constant and manipulated whether the service recovery was successful (transparent unsuccessful vs. transparent successful). The control group saw the opaque condition. Thus, we compared the effects of an opaque service recovery with both successful and unsuccessful transparent service recoveries. Again, participants were randomly assigned to the three groups. We chose a scenario in which a consumer named Luca complains on the corporate social media site of the Internet service provider Surfnet. In the scenario, Luca notes that, after having signed a service contract, an additional fee for an antivirus package appeared on the bill, though she or he never requested that service. The scenarios in the opaque control group and the transparent successful service recovery condition mimic the design from Study 1a. Respondents in the opaque control group only read the first response of the service provider; those in the transparent successful service recovery observed the whole process, leading to a successful result. Respondents in the transparent unsuccessful service recovery condition learned that it was not possible to cancel the antivirus package or receive a refund (Online Appendix 2). We collected these data with the help of a professional market research firm. After deleting 31 respondents who failed quality and attention checks, the final sample included 106 responses (48.1% female; 18–68 years old, M = 41.25 years, SD = 12.79 years).
Manipulation checks and psychometric properties
The manipulation checks worked as intended. Respondents in the two transparent cells reported higher means (Mtransp = 5.15) than those in the opaque cell (Mopaque = 2.36; t = −7.62, p < .001). To confirm the service recovery success manipulation, we included the item, “In my opinion, the Internet provider Surfnet offered a satisfactory solution to the problem.” Respondents who read about a successful recovery offered higher means than those observing an unsuccessful one (Munsuccessful = 2.16, Msuccessful = 6.08; t = −9.10, p < .001). Participants also understood their role as observers (M = 6.13, SD = 1.51) and perceived the scenario as realistic (M = 6.07, SD = 1.26).
We used the same scales as in Study 1a (see Appendix A), reaching good reliability and convergent validity, as well as discriminant validity according to the Fornell and Larcker’s (1981) criterion. To ensure discriminant validity in line with the HTMT.85 criterion (Voorhees et al. 2016), or HTMT.90 criterion (Henseler, Ringle, and Sarstedt 2015) for WOM and purchase intentions, we excluded the second item from the Purchase Intentions Scale.
Results
We used PLS-SEM (Ringle, Wende, and Becker 2015) to test our hypotheses. Again, and in line with our hypotheses, we present one-sided p values to show the significance of the effects. To include the effects of both unsuccessful and successful recoveries in our model, we created two dummy variables. The first dummy variable contained the transparent successful condition which was coded as 1 while the other cells were coded as 0 (i.e., opaque condition and transparent unsuccessful cases). For the second dummy variable, the transparent unsuccessful condition was coded as 1 and the other cells (i.e., opaque condition and transparent successful cases) as 0. In doing so, we established the opaque condition as reference group to which the transparent successful and unsuccessful conditions were compared (Cohen et al. 2003). For both outcome variables, we replicated the findings from Study 1a regarding the positive total effects of transparency when a successful service recovery was transparent (WOM, β = .36, t = 3.79, p < .001; purchase intentions, β = .30, t = 3.17, p < .001). In unsuccessful service recovery contexts, however, we found that transparency is negatively linked to the outcome variables. Thus, we observe significant negative total effects (WOM, β = −.17, t = 1.70, p < .05; purchase intentions, β = −.22, t = 2.23, p < .05) in support of our Hypothesis 3a and b.
To check for the meaning of transparency as a signal of high quality, our PLS-SEM also contained the service quality construct as a mediator. We replicated the positive indirect effects of successful transparency on the outcome variables mediated by service quality (WOM, β = .22, t = 3.43, p < .001; purchase intentions, β = .18, t = 3.07, p < .001). 6 For unsuccessful service recoveries, our model suggests that perceptions of service quality decrease when transparency increases, resulting in negative indirect effects of transparency on the two outcomes transmitted by service quality (WOM, β = −.18, t = 2.45, p < .01; purchase intentions, β = −.15, t = 2.46, p < .01). Therefore, we demonstrate the negative effect of unsuccessful service recovery observations on service quality perceptions. 7 Again, Online Appendix 1 (Panel b) presents the means, SDs, and correlations of all the variables.
Discussion
Study 1a and b sheds light on the impact of service recovery transparency on VPOs by using different service contexts and service failures. A transparent service recovery, in which VPOs can follow the full dialogue between the complainant and the service provider, enhances WOM and purchase intentions. These relationships can be explained by VPOs’ service quality perceptions, which mediate the influence of service recovery transparency on the two outcome variables. We also observe serial mediations, suggesting that service quality stimulates trust, which, in turn, leads to higher WOM and purchase intentions. In contrast, we observe no isolated mediation by trust; service recovery transparency must stimulate VPOs’ service quality perceptions before they can elicit trust. These results reveal detailed insights into transparency, in a way that only if service recovery transparency builds a quality signal that can be observed, it can determine the VPOs’ perceptions and intentions, even in service failure scenarios.
Our findings also suggest a boundary condition of transparency. We show that being transparent in an unsuccessful service recovery will create a similarly effective quality signal, but for low quality. Thus, being transparent in unsuccessful service recovery initiatives confronts the service provider with important decisions: On the one hand, frankly showing the unsuccessful result might turn the effective signal of high quality into a signal of poor quality. Consumer intentions and behaviors might be affected negatively. On the other hand, hiding the outcome of an unsuccessful service recovery, which might appear advisable, may alert consumers that the firm is disguising the result to confuse the quality signal. This, in turn, would cause negative effects. Therefore, our next study discusses whether conditional transparency might provide a solution in situations when service providers cannot offer a successful service recovery, allowing firms to benefit from the positive effects of transparency while avoiding the negative consequences deriving from presenting an unsuccessful result.
Study 2: Conditional Service Recovery Transparency
In some situations, it might not be advisable or possible for service providers to display their service recovery processes and service recovery results on social media sites. Study 1b indicates that an unsuccessful service recovery is one such situation; other cases might include processes that require handling sensitive data (e.g., payment information). Therefore, in Study 2, we investigate whether conditional transparency, in which the firm reveals only some components of the service recovery (process or result), still can serve as a signal that enhances VPOs’ intentions.
Differentiating Service Recovery Process Transparency and Service Recovery Result Transparency
As Smith, Bolton, and Wagner (1999) suggest, a service recovery encounter can be viewed as a series of events: The complaint initiates a procedure that includes a social interaction between the service provider and the customer, resulting in an outcome. Therefore, transparency could pertain to the service recovery process, its result, or both. By service recovery process transparency, we refer to the extent to which the procedure (including the social interaction) leading to the problem’s solution is visible to other, observing consumers. Service recovery result transparency defines the extent to which the result of the service provider’s problem solution is visible to other, observing consumers. Complaining customers develop expectations about both the service recovery process and its result (Andreassen 2000). After a service failure, they expect a successful recovery, wherein the firm resolves the problem through an adequate process (Tax, Brown, and Chandrashekaran 1998). Thus, both the service recovery process and the service recovery result influence customers’ postrecovery evaluations. Additionally, any corporate action that provides information about the firm’s true characteristics can provide signals that can be observed by VPOs (Kirmani and Rao 2000). Especially in service failure situations, consumers use any available information to form postfailure reactions (Folkes 1984). If service providers offer transparency about either the service recovery process or its result, even when full transparency is not possible, this limited degree of transparency, or conditional transparency, may still function as a signal of quality VPOs can evaluate to recover their trust. Specifically, a conditionally transparent service recovery may evoke more favorable VPO responses than hiding information about both the process and result because VPOs can observe part of the service recovery, at least.
Study Design and Sample
Study 2 is a 2 (process: opaque vs. transparent) × 2 (result: opaque vs. transparent) between-subjects experiment. The scenario builds on the opaque and transparent successful conditions of Study 1b, but we split service recovery transparency into process transparency and result transparency (see Online Appendix 3). All participants were able to read the customer complaint and the service provider’s first post, which instructed the complainant to send a reference number via private message. We then manipulated the service recovery process transparency by varying the visibility of the dialogue between Surfnet and the complainant. In the transparent service recovery process condition, the whole dialogue, leading up to the final post that described the recovery result, was visible to the VPOs. In the opaque service recovery process condition, no information on the process was available. For service recovery result transparency, we either provided a final post that contained information about the result (transparent result condition) or did not (opaque result condition). The completely opaque and completely transparent scenarios were identical to the two conditions in Study 1b.
A market research firm recruited a sample of respondents. As in the previous studies, respondents were randomly assigned to the treatment groups. After eliminating 30 participants who did not pass the quality and attention checks, we obtained responses from 129 participants (48.1% female; 18–69 years old, M = 41.66 years, SD = 12.92 years).
Manipulation Checks and Measurement Model
We measured the participants’ agreement that “In the given situation, the process of the complaint handling was completely visible to me” (service recovery process transparency) and “In the given situation, the result of the complaint handling was completely visible to me” (service recovery result transparency). These manipulations worked as intended; the participants judged process transparency significantly higher when the process was observable compared with when it was not (Mopaque = 2.62, Mtransp = 4.33; t = −4.68, p < .001). The results were similar for service recovery result transparency (Mopaque = 1.75, Mtransp = 5.09; t = −11.64, p < .001). Participants also perceived themselves in the role of an observer (M = 6.14, SD = 1.44) and regarded the scenario as realistic (M = 6.05, SD = 1.13). Again, we used scales from previous studies to capture how different aspects of service recovery transparency influenced the VPOs’ intentions (Appendix A). The Fornell and Larcker’s (1981) criterion was met when all items were included; however, we deleted the second item from the Purchase Intentions Scale to achieve discriminant validity based on the HTMT.90 criterion (Henseler, Ringle, and Sarstedt 2015).
Results
Online Appendix 1 (Panel c) shows the means, SDs, and correlations of all variables. We used PLS-SEM to test for the effects of conditional transparency on the two outcome variables. We created two dummy variables; one for process transparency (coding 0 for opaque process and 1 for transparent process) and another for result transparency (coding 0 for opaque result and 1 for transparent result). Again, the bootstrap was conducted using 5,000 subsamples, and we used one-sided p values. The model revealed satisfactory R2 values for the constructs (
To test for Hypothesis 4a, we followed up the significant effects of WOM in a second step with planned contrasts. The first contrast analysis revealed that VPOs observing service recoveries but not recovery results expressed significantly higher WOM intentions when the service recovery process was transparent, Mprocess_opaque = 2.71, Mprocess_transp = 3.55; F(1, 125) = 4.37, p < .05. The second contrast analysis supported the finding that, if the service recovery process is opaque, service providers can increase the VPOs’ WOM intentions by transparently showing the service recovery result, Mresult_opaque = 2.71, Mresult_transp = 3.90; F(1, 125) = 9.02, p < .01. In both cases, conditional transparency applied to either the process or the result was enough to raise the VPOs’ WOM intentions to the level of full transparency, Mprocess_trans/result_opaque = 3.55, Mfull_transp = 4.02; F(1, 125) = 1.47, ns; Mprocess_opaque/result_trans = 3.90, Mfull_transp = 4.02; F(1, 125) = 0.10, ns. In line with these results, we support Hypothesis 4a.
Discussion
Based on the idea that service recovery incorporates a series of events (e.g., Smith, Bolton, and Wagner 1999), we differentiated service recovery process transparency and result transparency in Study 2. Both service recovery process transparency and result transparency exert significant effects on VPOs’ intentions. If service providers are unable to reveal the service recovery result, transparency about the service recovery process helps mitigate the negative effect of opaqueness and increases VPOs’ WOM intentions. But process transparency has no such beneficial impact on VPOs’ purchase intentions given an opaque result. Moreover, in situations wherein the service providers cannot display information about the service recovery process online, they should offer a visible post about the result because result transparency significantly increases VPOs’ WOM and purchase intentions. These results support the overall reasoning that even conditional transparency in service recovery can have positive effects on VPOs’ evaluations; consequently, offering some information is better than offering no information at all. At first glance, result transparency appears to be a key lever. Still, this observation only holds for purchase intentions, as similar levels of WOM can be reached by being transparent only about the process.
Study 3: The Role of Brand Equity
The previous studies offer evidence that service recovery transparency positively influences VPOs’ behavioral intentions in different service contexts due to its signaling effect. Such intentions might also depend on brand equity, though investigations of this function in service recovery settings are rare (Hazée, van Vaerenbergh, and Armirotto 2017). In response, we examine whether the transparency effect holds when another strong signal, such as customer-perceived brand equity, is present. The effect of transparency in the presence of brand equity is not evident; we, therefore, consider different perspectives. Without completely convincing arguments supporting either direction, we tested competing hypotheses to avoid confirmation bias (Armstrong, Brodie, and Parsons 2001).
Brand Equity as a Buffer Concerning Transparency in Social Media Recovery
Brand equity, or “the differential effect of brand knowledge on consumer response to the marketing of the brand” (Keller 1993, p. 8), offers an indicator of strong quality (Erdem and Swait 1998). Creating high equity brands is beneficial for companies, in that high brand equity stimulates positive WOM (Westbrook 1987) and purchase intentions (Chaudhuri and Holbrook 2001). Furthermore, high brand equity leads to reduced levels of risk and uncertainty, especially during service failures (Keller and Lehmann 2006). Customers might expect service providers with high brand equity to act in their best interests even during service failures. They might also feel less need to monitor the provider’s actions closely (Hazée, van Vaerenbergh, and Armirotto 2017). In this sense, brands with high equity might not need to provide transparent social media recoveries because VPOs already rely on the strong signal that the brand equity offers.
In contrast, customers perceive greater risk and lower quality regarding low equity brands, intensifying their uncertainty about service recovery results and their desire to control the service provider’s actions (Grewal et al. 2007; Hazée, van Vaerenbergh, and Armirotto 2017). Referring to vicarious learning, we suggest that, for low equity brands, transparently performed service recoveries can mitigate the negative effect of low brand equity on VPOs’ purchase and WOM intentions. Therefore:
Brand Equity as Booster Concerning Transparency in Social Media Recovery
Trust is the foundation for strong relationships between brands and consumers (Delgado-Ballester, Munuera-Alemán, and Yagüe-Guillén 2003). In trusting relationships, experiencing failures can be particularly harmful. As Gillespie and Dietz (2009) explain, organizational-level failures harm customers’ trust in a company, which then leads to a breakdown in, or a desire to renegotiate, relationships. Effective trust repair mechanisms after such failures, such as demonstrations of trustworthiness through voluntary, public, and transparent communications (Korsgaard, Brodt, and Whitener 2002), may repair the damage and restore the trust. In our study’s context, we posit that high equity brands already evoke high levels of customer trust (Aaker 1991). A trusting relationship also becomes particularly important when companies operate in online environments lacking physical cues (Gupta, Yadav, and Varadarajan 2009). Therefore, for high equity brands, conserving or reestablishing a trusting relationship with stakeholders (customers and VPOs) after a failure is of paramount importance. Companies can send clear, consistent signals by providing transparency about their service recoveries, which may then operate as an effective trust repair mechanism (Gillespie and Dietz 2009), increasing VPOs’ WOM and purchase intentions. For this alternative hypothesis, we suggest:
Study Design and Sample
Study 3 features the delivery service scenario from Study 1a, while also manipulating the condition of brand equity. Thus, the study uses a 2 (recovery transparency: opaque vs. transparent) × 2 (brand equity: low vs. high) between-subjects experiment. The manipulation for transparency is the same as in Study 1a; for brand equity, we followed Brady et al. (2008) and Hazée, van Vaerenbergh, and Armirotto (2017). Specifically, participants in the high brand equity cells learned that Delivericious is a worldwide well-known brand, so they know its brand name, even if they were not experienced with it. Additionally, they are familiar with Delivericious’s many advertisements and its image as a quality service provider. In the low equity cells, participants read that Delivericious is not a well-known brand, so they are not familiar with it; they also learned that Delivericious is attempting to compete with top brands in the industry. Participants were randomly assigned to the four cells. We collected data from consumers in a Western European country, with the help of Prolific, as in Study 1a. After deleting 14 cases due to quality and attention checks, the sample contained 199 participants (52.3% female; 18–71 years old, M = 37.47 years; SD = 12.28).
Manipulation Checks and Psychometric Properties
We used the same items and constructs to measure the dependent variables as in the previous studies. All measures displayed good reliability and convergent validity (see Appendix A), as well as discriminant validity according to the Fornell and Larcker’s (1981) criterion and the HTMT.85 criterion (Henseler, Ringle, and Sarstedt 2015; Voorhees et al. 2016). Afterward, participants answered the manipulation and attention checks. To test the effectiveness of the brand equity manipulation, we used 3 items (α = .92) on 7-point scales, adapted from Brady et al. (2008): “What kind of image does Delivericious have?” (“negative image” to “positive image”), “How would you rate the quality delivered by Delivericious?” (“low quality” to “high quality”), and “What kind of attitude do you have about Delivericious?” (“negative attitude” to “positive attitude”). All manipulations were successful. Participants in the transparent condition reported significantly higher means than in the opaque condition (Mtransp = 5.48, Mopaque = 2.39; t = −14.68, p < .001), and participants in the high brand equity cells displayed significantly higher means (Mhigh_BE = 4.93) than those in the low equity cells (Mlow_BE = 4.54; t = −2.14, p < .05). Participants perceived the scenario as realistic (M = 6.36, SD = .84) and understood that they were observers of the situation (M = 5.86, SD = 1.53).
Results
To test the competing hypotheses, we used a PLS-SEM and coded the two manipulations into two dummy variables (i.e., “transparency” and “brand equity”). As we examined competing hypotheses, we used two-tailed tests to show the significance of our path coefficients in this study. The bootstrap was conducted using 5,000 subsamples. The model displayed good values for R2 (
Discussion
With Study 3, we scrutinized competing hypotheses on the impact of brand equity on service recovery transparency. The results indicate that service recovery transparency influences VPOs’ outcomes, even in the presence of another strong signal (high brand equity). Thus, high equity brands are not immunized against the demand for transparency in their social media service recovery efforts if they want to stimulate VPOs’ purchasing intentions. Even if the brand already exerts a strong signaling function (Erdem and Swait 1998), this function apparently cannot replace the signaling function of service recovery transparency. We did not observe a significant interaction for WOM suggesting that the effect of transparency does not vary with brand equity. Still, we find strong effects for service recovery transparency and brand equity, suggesting that both signals emit a strong effect of WOM on their own.
General Discussion and Implications
Theoretical Contributions
Customers frequently use social media to voice their complaints. Although many service providers react by moving the service recovery to private interaction settings (Einwiller and Steilen 2015), the present research indicates that such an opaque approach creates unwanted effects among the VPOs uninvolved in the service failure or recovery. Using four experimental studies, we specify the influence of service recovery transparency on VPOs, who report higher WOM and purchase intentions when the service recovery is transparent rather than opaque. Service quality and trust perceptions function as underlying cognitive processes (Studies 1a). We also observe a boundary condition (Study 1b) indicating that transparency is no longer a signal of high quality if the service recovery is unsuccessful. In such situations, or when companies cannot reveal some parts of the service recovery, conditional transparency can provide a tool for leveraging the positive signals associated with transparency (Study 2). In Study 3, we demonstrate that transparency matters even in the presence of another strong signal; namely, high brand equity.
Whereas most service recovery studies scrutinize the effects on a focal customer (e.g., Chen, He, and Alden 2014; Schaefers and Schamari 2016), we address the effects of service recovery on observing customers, extending the relatively sparse insights on this consumer group (e.g., Van Vaerenbergh, Vermeier, and Larivière 2013). Furthermore, we expand on prior research by pointing the discussion to an online context, which is critical considering the vast reach of social media complaints (Customer Rage Survey 2017). In social media settings, thorough complaint handling may have implications not only on the future behavior of the single complainant but also on the perceptions and behavioral intentions of multiple VPOs. What makes investigations in social media contexts so worthwhile is that the observers might not be customers of the service provider. Off-line observers must be in the same servicescape as the focal complainant; usually, they are customers of the service provider already (Mattila, Hanks, and Wang 2014). But social media platforms make it possible for virtually any consumer to gain insights about a service provider.
By investigating service recovery transparency, we also contribute to recent discussions regarding the signaling and trust-creating functions of transparency, and their positive impacts on purchase intentions (Liu et al. 2015). Applying this reasoning to the service recovery domain, we show that service recovery transparency increases perceptions of service quality, which increase VPOs’ level of trust in the service provider, leading to positive behavioral intentions. Additionally, by showing that the underlying effect of service recovery transparency is based primarily on VPOs’ perceptions of service quality, we contest recent findings that emphasize emotions as the underlying process explaining customers’ reactions to a service failure (e.g., Mattila, Hanks, and Wang 2014). By identifying service quality as a mediator in social media recovery, we also offer support for research that anticipates how cognitive processes explain customers’ postrecovery evaluations and behaviors in off-line environments (e.g., Van Vaerenbergh, Vermeier, and Larivière 2013). As this study shows, perceived service quality can increase VPOs’ perceptions of trust in the service provider, which act as a key facilitator for electronic commerce (Schlosser, White, and Lloyd 2006) and social media complaint handling.
The findings also contribute to prior research by disentangling process transparency from result transparency. In testing different transparency strategies applicable to situations wherein service providers cannot make the complete service recovery transparent, we show that even conditional transparency may serve as a positive signal, and results in better outcomes than offering no information at all or being totally opaque. At first glance, our results may seem to suggest that result transparency is the principal lever; this is true for VPOs’ purchase intentions. This finding resonates with research indicating that service recovery results contribute more meaningfully to customers’ service evaluations than the service recovery process does (Andreassen 2000). However, similarly WOM intentions can be increased by being transparent about the process without disclosing the result. Thus, VPOs’ WOM intentions still can benefit, even if service providers do not want to, or cannot publicly, announce the service recovery result as long as the providers are transparent about the process. However, we do not observe this effect related to purchase intentions, possibly because purchases have more inherent risk than WOM intentions. Especially in the prepurchase phase, potential consumers seek to increase relevant information to gain certainty that the purchase will be satisfying (Mitchell 1992). In a recovery context, information about the process alone may not be sufficient for encouraging purchase intentions. Not knowing how a company has dealt with another customer’s problem might create risk and uncertainty for VPOs considering purchasing from the company (Liu et al. 2015; Mitchell 1992), even if they speak positively about a firm. Still, transparency in the process seemingly creates an impression that the company cares about and invests in its relationship with complaining customers (De Wulf, Odekerken-Schröder, and Iacobucci 2001).
These nuances advance the literature that advocates for providing unbiased, accurate (Granados, Gupta, and Kauffman 2006), and objective (Liu et al. 2015) information in all cases. Transparency in unsuccessful recoveries may reduce information asymmetry, but it also reduces the service quality effect, decreases VPOs’ service evaluations, and, thus, constitutes a boundary condition. To mitigate this issue, conditional transparency offers a viable solution; the firm can avoid the damages incurred because of complete opaqueness or complete transparency in a failed service recovery situation. This finding also contributes to research concerning the negative consequences of unsuccessful service recoveries by expanding beyond off-line settings (Van Vaerenbergh, Vermeier, and Larivière 2013) and revealing that a strategy of conditional transparency can be effective for service providers.
Finally, we enhance brand equity literature by testing competing hypotheses to clarify whether brand equity has a buffering or boosting effect on transparency in social media recoveries. High brand equity serves as an indicator of strong quality (Erdem and Swait 1998), usually linked to positive outcomes, such as reduced risk perceptions (Aaker 1991; Keller and Lehmann 2006). Most literature seems to suggest that brand equity has a buffering effect, indicating that service recovery transparency should be more important for low equity brands, but that high equity brands can rely on their strong brand signal. Instead, our results indicate a booster effect, showing that high equity brands cannot rely solely on the signaling function of their brands; they also need the positive signal elicited by a transparent social media service recovery. We explain this finding according to a trust repair mechanism; signals from different organizational components should be congruent and free from contradiction (Gillespie and Dietz 2009). In our study, the signaling effect of high brand equity appears incongruent with the signal transmitted by an opaque service recovery. Thus, VPOs likely hold high equity brands to higher standards, requiring a superior service recovery strategy on the part of such brands. Transparency can indicate such perceived superiority, thereby stimulating the VPOs’ purchasing intentions.
Managerial Implications
For service providers that must manage customer complaints on social media sites, this study offers several recommendations. First, service providers cannot limit their attention to the complainant. Instead, service recovery efforts must account for the effects on VPOs—even those who are not directly affected by the service failure—because these (potential) customers may still make decisions based on their observations of the service recovery. These decisions could potentially affect VPOs’ intentions to recommend or purchase from the service provider.
Second, transparency must be central to any company’s social media service recovery strategy. Service providers should redefine their social media complaint-handling behavior to provide as much transparency as possible. Rather than issuing inherently negative quality signals to VPOs and harming their trust perceptions, complaints handled transparently can create positive quality signals and improve trust perceptions, thereby enhancing VPOs’ intentions toward the provider. High equity brands are not exempt from the need to invest in transparent social media complaint-handling strategies. Many high equity brands, such as Starbucks, American Express, FedEx, and Samsung, still handle social media service recoveries opaquely, directing customer complaints away from the public and toward a private interaction. Our findings suggest these companies must rethink these strategies if they want to avoid causing harm to the VPOs’ perceptions and intentions. In line with Einwiller and Steilen (2015), we recommend that service providers integrate transparency into their customer communication strategies and empower social media managers to handle complaints transparently, in front of VPOs, instead of moving the service recovery into a private channel.
Third, we acknowledge the potentially negative effects of transparency, especially when the service recovery is unsuccessful. This poses a particular threat for stock-listed companies that prioritize private interactions in an effort to prevent any harm to their share value. Instead, we recommend conditional transparency, which is preferable to complete opaqueness, as it provides a meaningful strategy when service providers legally or ethically cannot be fully transparent about their service recovery activities, such as when sensitive customer data are involved (e.g., IDs, payment information) in the failure’s resolution. In these situations, we recommend hiding the recovery process but making the result transparent. Furthermore, some providers might prefer to keep the result opaque if they compensate customers differently, according to their status. To avoid feelings of unfairness, imitation effects, or other negative influences, it would be reasonable for such providers to hide the recovery result but transparently show the process.
Fourth, adequately using transparency in social media recovery strategies can improve VPOs’ perceptions and intentions, so we recommend that service providers leverage transparency strategically to differentiate themselves from competitors (Liu et al. 2015). Open, transparent communication between a company and a complainant provides a strong quality signal that can be observed by VPOs and, in turn, establishes trust between VPOs and a service provider. Thus, while transparency in an unsuccessful service recovery may increase the costs of such a “poor” recovery even further by sending out a signal of low quality to VPOs, transparency can amplify the payoffs from an “excellent” service recovery. The service provider can establish an image of itself as a transparent company with nothing to hide, working to facilitate information exchanges about its service offerings by providing observable signals to (potential) customers. To heighten the likelihood that these signals are positive, companies are advised to provide more resources to their frontlines to allow for “excellent” service recovery. Service recovery transparency may also offer an effective tactic for stimulating referrals. The quality signal created by greater transparency may make it easier for VPOs to recommend a service provider; their own intentions to purchase from a provider that transparently works to solve another customer’s service problem should also increase. Thus, transparency is an effective means for signaling both service quality and trust.
Limitations and Further Research
Some limitations of our research provide directions for further research. First, we focused on service recovery transparency pertaining to the provider’s response in our analysis (i.e., second facet according to our definition). In doing so, we provide detailed insights on the impact of making provider’s responses transparent on social media and thus concentrate on means that can be implemented by the firm to increase VPOs’ WOM and purchase intentions. Future research should scrutinize how service recovery transparency pertaining to the complainant’s perception of the nature and severity of the issue (first facet of the definition) and the complainant’s evaluation of the company’s response (third facet of the definition) influences VPOs intentions. On the one hand, future studies may vary the locus or severity of the failure as perceived by the customer and articulated in its comment via social media. On the other hand, studies could assess the impact on VPOs’ intentions of a complainant’s finishing statement on social media, which summarizes the complainant’s positive or negative assessment of the company’s response. Second, we conducted studies across three service contexts, which limits the generalizability of our findings to other service sectors. Social media activity is crucial for many companies in various industries, and many companies maintain corporate sites on social media platforms that face challenges concerning efficient complaint handling. We recommend expanding the investigation to establish implications for companies in a range of industries, preferably by also using field data. Third, other moderators that we did not include in this study might influence the impact of service recovery transparency on VPOs. For example, we held the recovery time constant over our studies; additional research could investigate the effect of elapsed time between postings by the service provider and the complainant. Multiple service recoveries might also exert different influences on VPOs’ perceptions and intentions as they accumulate over time. Other moderators may pertain to the use of standardized versus customized replies, as social media service recovery transparency may have less effect if companies issue only standardized responses. Fourth, we explore transparency without specifying the service failure characteristics because our goal was to reveal the pure effect of transparency in social media environments as an initial step. Investigating how failure characteristics such as locus of control, failure severity, or failure stability (Huang 2008; Van Vaerenbergh, Vermeier, and Larivière 2013) affect VPOs in this environment would be helpful. Finally, we faced difficulties in achieving discriminant validity following the HTMT criterion without deleting items in three of our four studies. This was surprising given that we used well-established scales that all displayed discriminant validity according to the Fornell and Larcker’s (1981) criterion. This underlines the superiority of the HTMT criterion in detecting violations of discriminant validity, as discussed by Henseler, Ringle, and Sarstedt (2015) and Voorhees et al. (2016), even for established scales. Therefore, we highly recommend that future research incorporates this criterion.
Supplemental Material
Supplemental Material, Executive_summary_final - Service Recovery on Stage: Effects of Social Media Recovery on Virtually Present Others
Supplemental Material, Executive_summary_final for Service Recovery on Stage: Effects of Social Media Recovery on Virtually Present Others by Jens Hogreve, Nicola Bilstein and Kathrin Hoerner in Journal of Service Research
Supplemental Material
Supplemental Material, Web_Appendices_final - Service Recovery on Stage: Effects of Social Media Recovery on Virtually Present Others
Supplemental Material, Web_Appendices_final for Service Recovery on Stage: Effects of Social Media Recovery on Virtually Present Others by Jens Hogreve, Nicola Bilstein and Kathrin Hoerner in Journal of Service Research
Footnotes
Appendix A
Measures.
| Variables | Study 1a | Study 1b | Study 2 | Study 3 |
|---|---|---|---|---|
| Purchase intentions (Dodds, Monroe, and Grewal 1991; Grewal, Monroe, and Krishnan 1998) | ||||
| AVE | .91 | .89 | .92 | .91 |
| CR | .97 | .96 | .97 | .97 |
| α | .95 | .94 | .95 | .95 |
| If I need (a delivery service/an Internet provider) in the future, I would choose (Delivericious/Surfnet) | .96 | .95 | .97 | .96 |
| It is likely that I would consider (Delivericious/Surfnet) as (a delivery service/an Internet provider) | .94 | .92 | .95 | .94 |
| I would use the offering of the (delivery service Delivericious/Internet provider Surfnet) in the future | .96 | .96 | .95 | .96 |
| Positive word of mouth (Maxham and Netemeyer 2002) | ||||
| AVE | .94 | .95 | .94 | .93 |
| CR | 98 | .98 | .98 | 98 |
| α | .97 | .98 | .97 | .96 |
| If my friends were looking for (a delivery service/an Internet provider), I would tell them to try (Delivericious/Surfnet) | .96 | .98 | .98 | .96 |
| I would speak favorably to others about the (delivery service Delivericious/Internet provider Surfnet) | .97 | .97 | .95 | .96 |
| I would recommend (Delivericious’s delivery service/Surfnet’s Internet services) to my friends | .98 | .98 | .98 | .98 |
| Service Quality (Cronin, Brady, and Hult 2000) | ||||
| AVE | 93 | .95 | ||
| CR | .98 | .98 | ||
| α | .96 | .97 | ||
| Overall (Delivericious’s/Surfnet’s) service quality is | ||||
| Poor—excellent | .96 | .97 | ||
| Inferior—superior | .97 | .98 | ||
| Of low standards—of high standards | .96 | .97 | ||
| Trust (Bhattacherjee 2002) | ||||
| AVE | .84 | |||
| CR | .97 | |||
| α | .96 | |||
| Delivericious has the skills and expertise to address complaints in an expected manner | .91 | |||
| Delivericious is fair in its conduct toward customer complaints | .90 | |||
| Delivericious is fair in its customer service policies following a complaint | .94 | |||
| Delivericious is open and receptive to customer needs | .93 | |||
| Delivericious makes good-faith efforts to address most customer concerns | 95 | |||
| Overall, Delivericious is trustworthy | .87 | |||
Note. All variables are measured on 7-point Likert-type scales (1 = strongly disagree, 7 = strongly agree, with the exception of service quality). All factor loadings are significant at the .01 level. AVE = average variance extracted; CR = composite reliability; α = Cronbach’s alpha.
Authors’ Note
This project was a team effort, with all researchers contributing equally. Author names are in random order and the authors contributed equally to this research.
Acknowledgments
The authors would like to thank Yves van Vaerenbergh, H. Rao Unnava, and the participants at multiple workshops and conferences for their valuable feedback on former versions of this article. They would also like to thank the Journal of Service Research review team for their constructive and very helpful comments. Nicola Bilstein thanks the German Research Foundation (DFG) for financial support (Grant BI 1763/1-1).
Declaration of Conflicting Interests
The author(s) declared no potential conflicts of interest with respect to the research, authorship, and/or publication of this article.
Funding
The author(s) disclosed receipt of the following financial support for the research, authorship, and/or publication of this article: This research was partially fundet by the Deutsche Forschungsgemeinschaft (DFG, German Research Foundation) – Projektnummer/grant BI 1763/1-1.
Supplemental Material
Supplemental material for this article is available online.
Notes
References
Supplementary Material
Please find the following supplemental material available below.
For Open Access articles published under a Creative Commons License, all supplemental material carries the same license as the article it is associated with.
For non-Open Access articles published, all supplemental material carries a non-exclusive license, and permission requests for re-use of supplemental material or any part of supplemental material shall be sent directly to the copyright owner as specified in the copyright notice associated with the article.