
Abstract
Dominance and unfolding response processes describe two ways in which individuals may respond to rating scale items. The dominance process assumes a monotonic relationship between a latent trait and the probability of endorsement and is typically modeled using a linear factor model within structural equation modeling (SEM). In contrast, the unfolding process assumes single-peaked response functions, with endorsement most likely when item and person locations are close on the latent continuum. Fitting unfolding models usually requires specialized software, which limits their integration with SEM. In this article, we proposed the ordered categorical response unfolding model (OCRUM), which can be estimated in Mplus. We illustrated its use with two empirical datasets and found that item and person locations were comparable to those obtained from the generalized graded unfolding model (GGUM). We also conducted Monte Carlo simulations to examine parameter recovery under varying sample sizes, test lengths, and response formats. Finally, we demonstrated that OCRUM can serve as the measurement component of a general structural equation model, enabling dominance and unfolding response processes to be represented within a single SEM framework.
Organizational research commonly uses rating scales. Respondents are typically presented with statements describing behaviors, feelings, or attitudes and are instructed to rate the extent to which the items accurately describe a target (e.g., self, supervisors, subordinates, team, or organization). A notable rating scale is the NEO Personality Inventory-Revised (NEO-PI-R) (Costa & McCrae, 1992), a well-known measure of the five domains of personality. It requires individuals to evaluate each statement on a rating scale comprising five response options: “strongly disagree,” “disagree,” “neutral,” “agree,” and “strongly agree.”
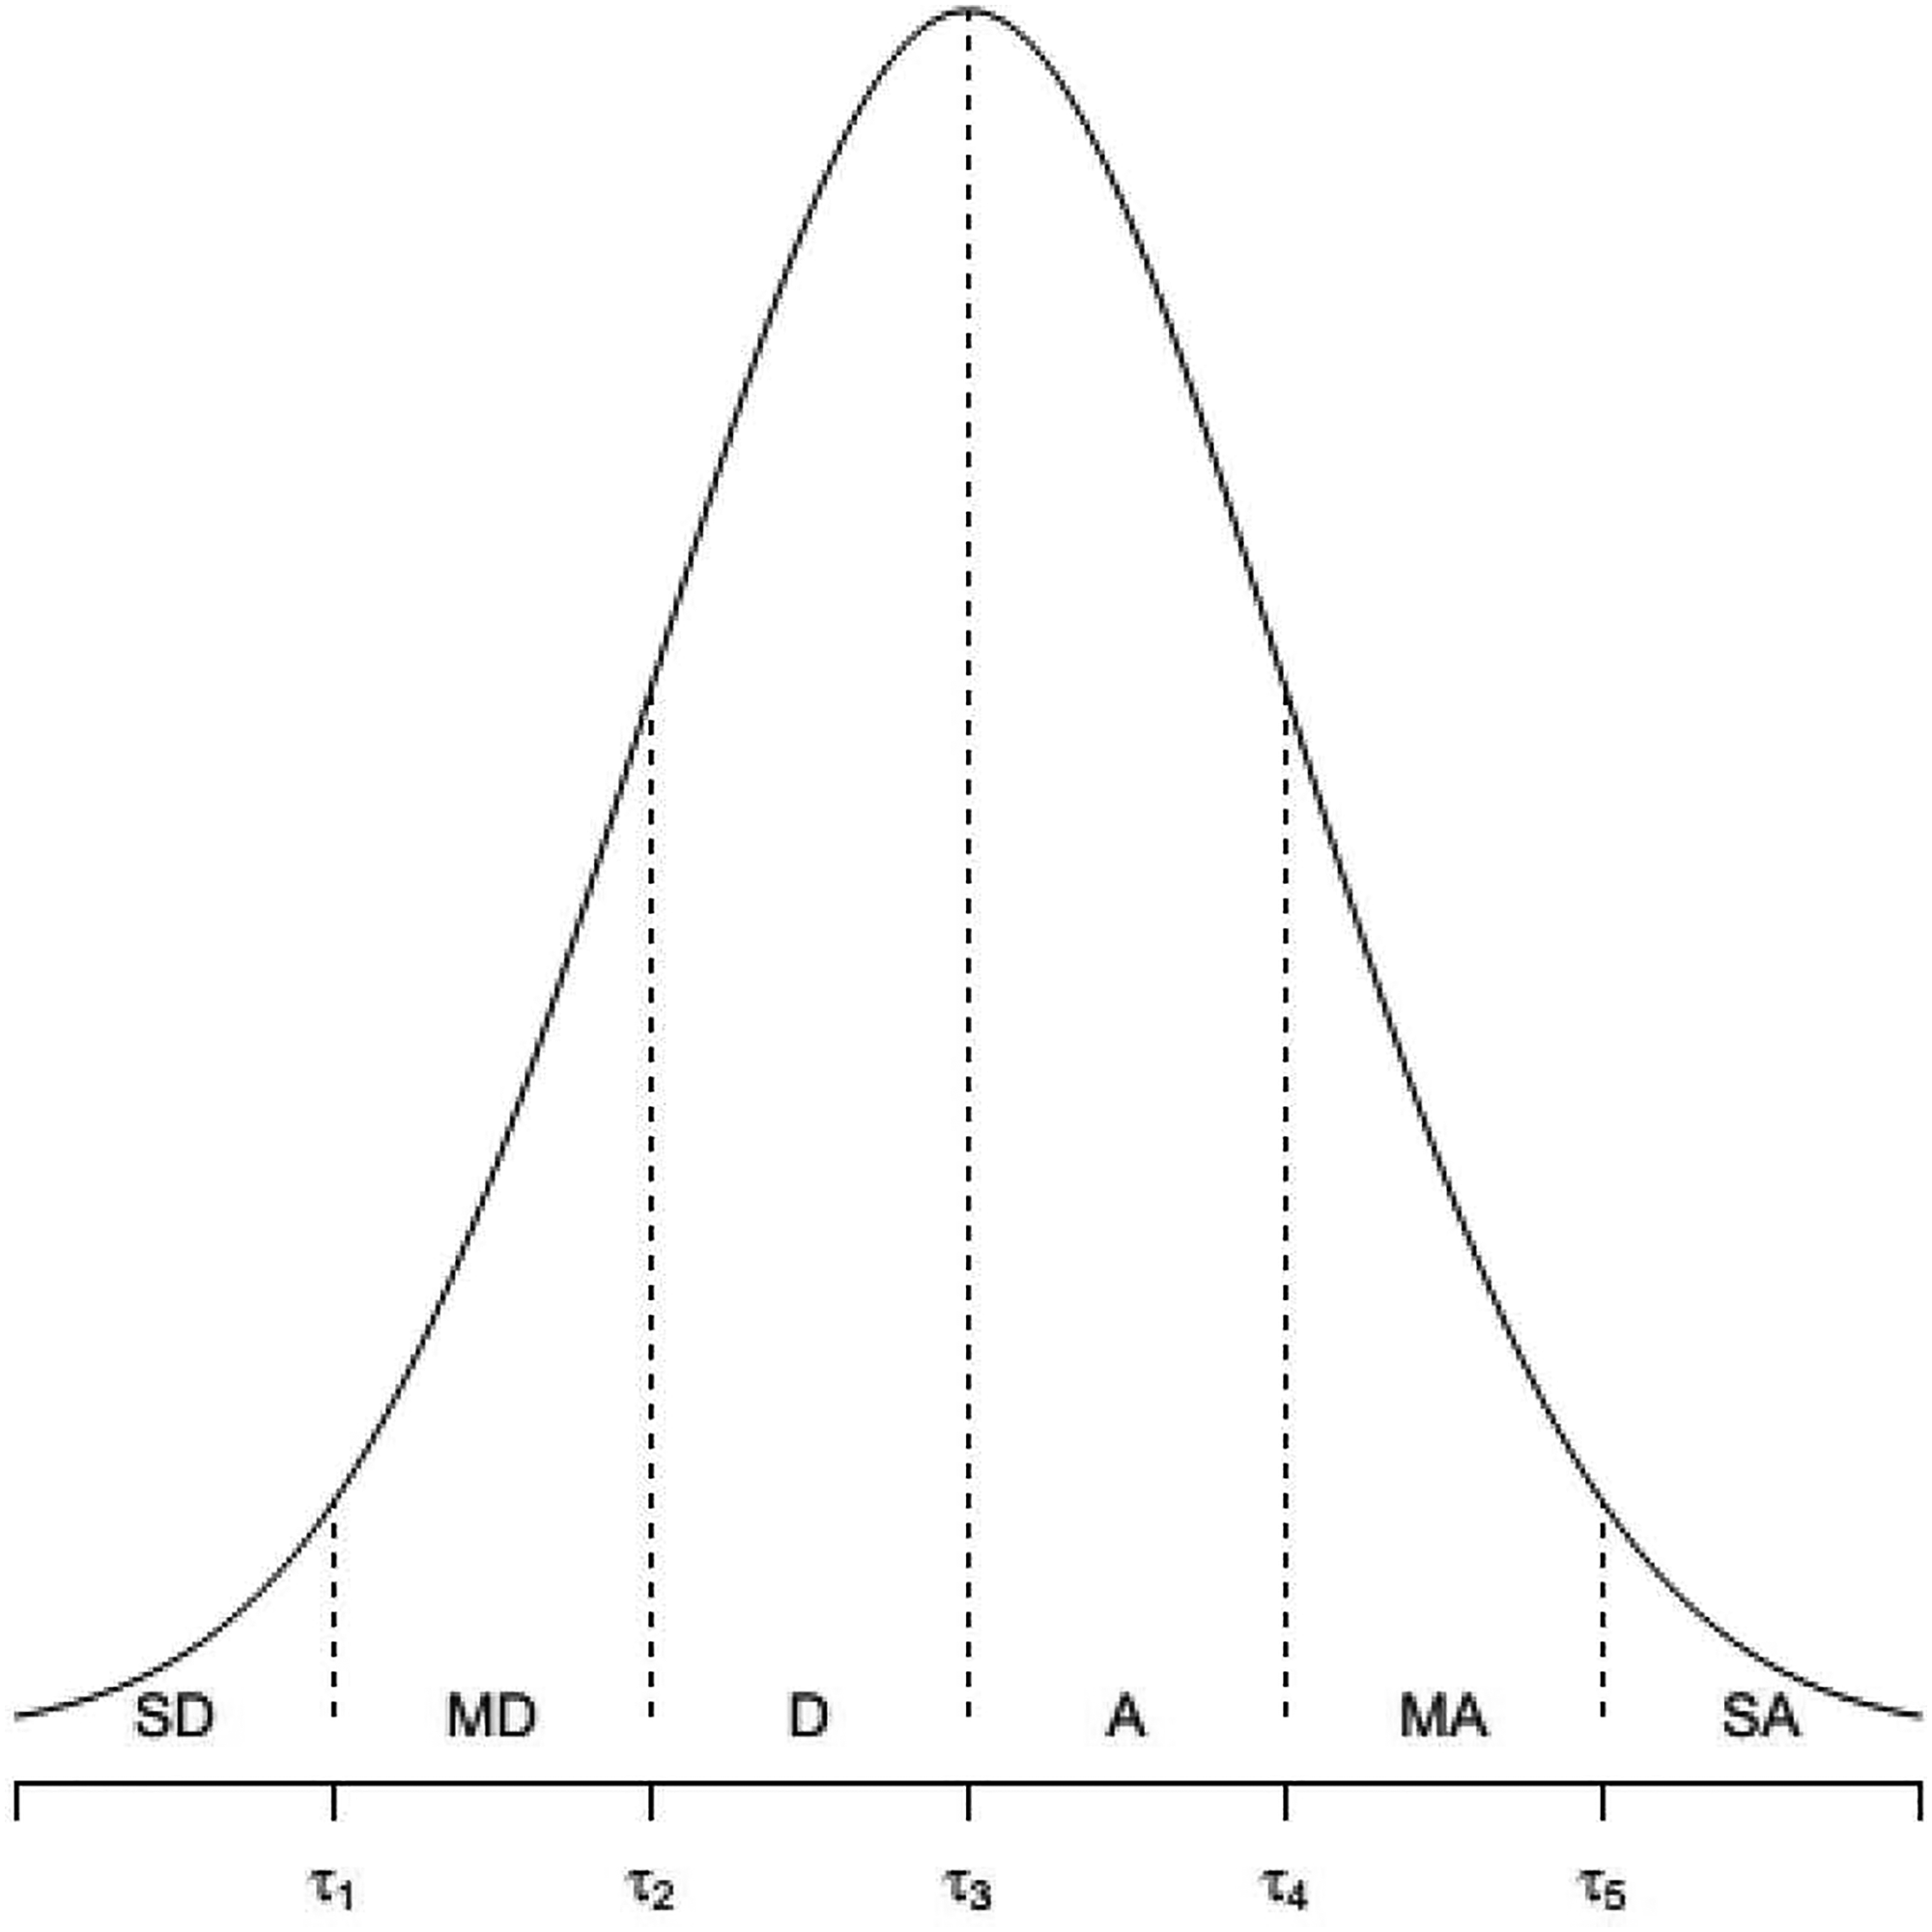
The development of rating scaling methods can be traced back to Thurstone's (1928) and Likert's (1932) pioneering work on attitude measurements (Krosnick et al., 2005). Coombs (1964) noted that these pioneers made two divergent assumptions on how individuals would respond to the rating scale items. Thurstone (1928) assumed that a person would endorse items that accurately described their attitude level and would not endorse those too dissimilar. This response process, called the unfolding or ideal-point response process by Coombs (1964), implies a single-peaked response function (Andrich, 1996; Roberts et al., 1999; Stark et al., 2006; Thurstone & Chave, 1929). To illustrate, if individuals are presented with an item describing moderate conscientiousness (e.g., I write notes to myself only if I have too many things to do at once; an example taken from Chernyshenko et al., 2007), those with extremely high and low degrees of conscientiousness will
Likert (1932) proposed the use of total scores as a scale score estimate and item–total correlations as an indicator of item quality. This implied a different underlying response process, which Coombs (1964) referred to as the dominance response process. This process is most easily understood in the context of cognitive ability items, where individuals with higher ability levels are expected to endorse (i.e., answer correctly) more items on the scale compared with those with lower ability levels. Therefore, the dominance process assumes that the probability of endorsement increases as a person's trait level increases, leading to a monotonically increasing function rather than single-peaked item response function. Most psychometric models used in current organizational research, such as the classical test theory, linear factor analysis, and logistic item response theory (IRT), are consistent with the dominance response process. Notably, almost all published structural equation modeling (SEM) analyses use the linear factor model as the primary measurement model for relating latent factors to observed responses.
However, in the past two decades, numerous researchers have argued that models consistent with the ideal-point response process should be used when rating scales are employed to measure constructs in noncognitive domains, such as attitudes (Andrich, 1996; Roberts et al., 1999), personality (Chernyshenko et al., 2007; Stark et al., 2006), and vocational interests (Tay et al., 2009). Tay et al. (2009; Tay & Ng, 2018) contended that it is important to consider whether a scale is designed to measure maximal or typical behavior when selecting an appropriate measurement model. Assessments of maximal behavior, such as mental or physical ability, aim to measure a person's maximum capacity. Respondents in such assessments are typically motivated to answer items correctly, and items below a person's location (i.e., relatively easy items) on the latent trait continuum have a higher probability of being answered correctly; conversely, items above the person's location (i.e., relatively difficult items) have a lower probability of being answered correctly. Hence, a dominance response process is most likely to be observed in assessments where an objective or socially correct answer is present.
Conversely, in assessments of typical behavior, such as personality or attitudes, individuals are typically asked to rate the extent to which a statement describes themselves. This is likely to elicit introspection, in which people compare the item with themselves to determine whether its description matches their own perception. Therefore, people are more likely to endorse items that are closer to their location on the latent trait continuum (Drasgow et al., 2010; Stark et al., 2006; Tay et al., 2009). This response process is consistent with the tenets of the unfolding response process.
Misspecification of the underlying response process is undesirable for several reasons. First, the use of incorrect measurement models can lead to model–data misfit and introduce bias into parameter estimates (Reise, 2010). Second, as demonstrated by Chernyshenko et al. (2007), many moderately worded items are unduly removed from item pools because they are deemed to be of low quality by many dominance model statistics (such as weak corrected item–total correlations, small factor loadings, and low IRT discrimination parameters). However, under unfolding (or ideal point) models, these items can be highly discriminating and usefully retained for scale construction to increase reliability (Chernyshenko et al., 2007; Stark et al., 2006). Finally, using an incorrect model for scoring may change examinees’ rank order, especially at extreme trait levels, which can affect the quality of selection decisions, as shown by Carter et al. (2014). 1
Unfolding (Ideal-Point) Models
Over the past few decades, several unfolding models have been developed for rating scale response data. The two most commonly used unfolding models are the graded unfolding model (GUM; Roberts & Laughlin, 1996) and the generalized GUM (GGUM; Roberts et al., 2000). Recent studies have proposed multidimensional extensions of the GGUM (e.g., confirmatory multidimensional GGUM [CMGGUM]; Wang & Wu, 2015). However, only limited applications have appeared in organizational and psychological practice. One reason is that most of the current unfolding models require specialized or standalone software, such as GGUM2004 for the GGUM (Roberts et al., 2000, 2006) and WinBUGS for CMGGUM (Wang & Wu, 2015), which many users may not find easy to use (e.g., Foster et al., 2017).
Importantly, psychologists and organizational scientists are often interested in investigating relationships between latent constructs after the latent variables have been measured. This is commonly achieved via SEM. However, the measurement part of most structural equation models is typically specified as a linear factor analysis model, which is more appropriate for representing dominance response processes. Although many unfolding models have been proposed for measurement, empirical applications of SEM that assess relationships between latent traits and unfolding/nonmonotonic response mechanisms are rare. Assessing such relationships within a unified SEM framework enables organizational researchers to test theories linking latent constructs when responses follow dominance and unfolding processes (e.g.,Cortina et al., 2020; Williams, 2003; Zyphur et al., 2023). Adding our model for unfolding data to the currently available linear models for dominance data now makes it possible to represent both response processes within a single SEM framework that can be readily implemented in Mplus. While trait estimates from specialized software for fitting unfolding models can be saved and later used in regression, as either predictors or outcomes, this two-step approach has been found to produce biased path coefficient estimates (Lu et al., 2005). One notable attempt to address this limitation was made by Usami (2011), who incorporated the GGUM into the SEM framework so that both GGUM parameters and structural coefficients could be estimated simultaneously to avoid parameter bias. His approach, however, was computationally intensive, relied on Markov chain Monte Carlo (MCMC) methods, and could accommodate the latent trait only as an outcome (endogenous) variable, not as an antecedent (exogenous) variable.
To address these challenges, this study proposes modeling the single-peaked (nonmonotonic) relationship between endorsement (observed responses) and the latent trait using a metric unfolding model (Brady, 1989; Davison, 1977; van Schuur & Kiers, 1994). Such a model can be shown to be mathematically equivalent to a quadratic factor analysis model (Maraun & Rossi, 2001), which can be fitted via the latent moderated structural (LMS) approach implemented in Mplus (Muthén & Muthén, 1998–2017). Further details are provided in the next section, where we discuss how to handle dichotomous and polytomous data using the proposed approach. For ease of reference, we refer to our proposed model as the ordered categorical response unfolding model (OCRUM). We report three studies to illustrate the formulation, empirical application, and implementation of the OCRUM via the SEM software Mplus. In Study 1, we compare item and person parameter estimates obtained from the OCRUM with those obtained from the GGUM using two published empirical datasets. In Study 2, we conduct a detailed investigation of OCRUM parameter recovery and model–data fit under various design factors via Monte Carlo simulations. In Study 3, we consider a full structural equation model with both structural and measurement components that involve a mix of unfolding responses (modeled by the OCRUM) and dominance responses (modeled by a linear factor model). In particular, we evaluate the accuracy of estimating structural coefficients in such scenarios via Monte Carlo simulations.
Ordered Categorical Response Data
In social science research, it is common to use rating scales (e.g., Likert-type formats with 4 to 6 points) as questionnaire response formats and to treat the resulting responses as ordinal. Therefore, it is often appropriate to model such data with an ordered categorical measurement model, especially when the multivariate normality assumption for observed responses is not justifiable. The approach for modeling ordered categorical data in SEM is similar to that for continuous data, except that item thresholds (τ) are estimated instead of item intercepts (intercepts are fixed to 0) and error variances are not estimated for identification reasons (Bovaird & Koziol, 2012; Muthén & Asparouhov, 2002).
Following Muthén's (1983, 1984) proposal of the latent response variable formulation, the observed categorical responses
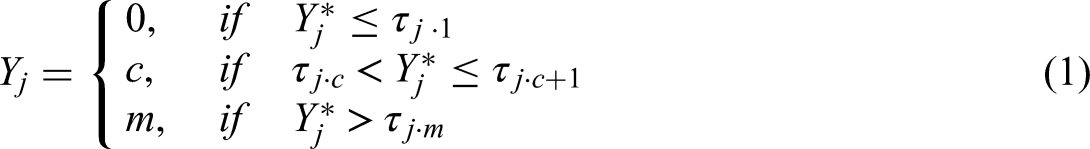
Figure 1 illustrates the relationship between
Relationship between latent response, observed response, and item thresholds.
In Muthén's (1983, 1984) original latent response variable formulation, the latent response was hypothesized to follow a linear factor analysis model, for example, a one-factor model,
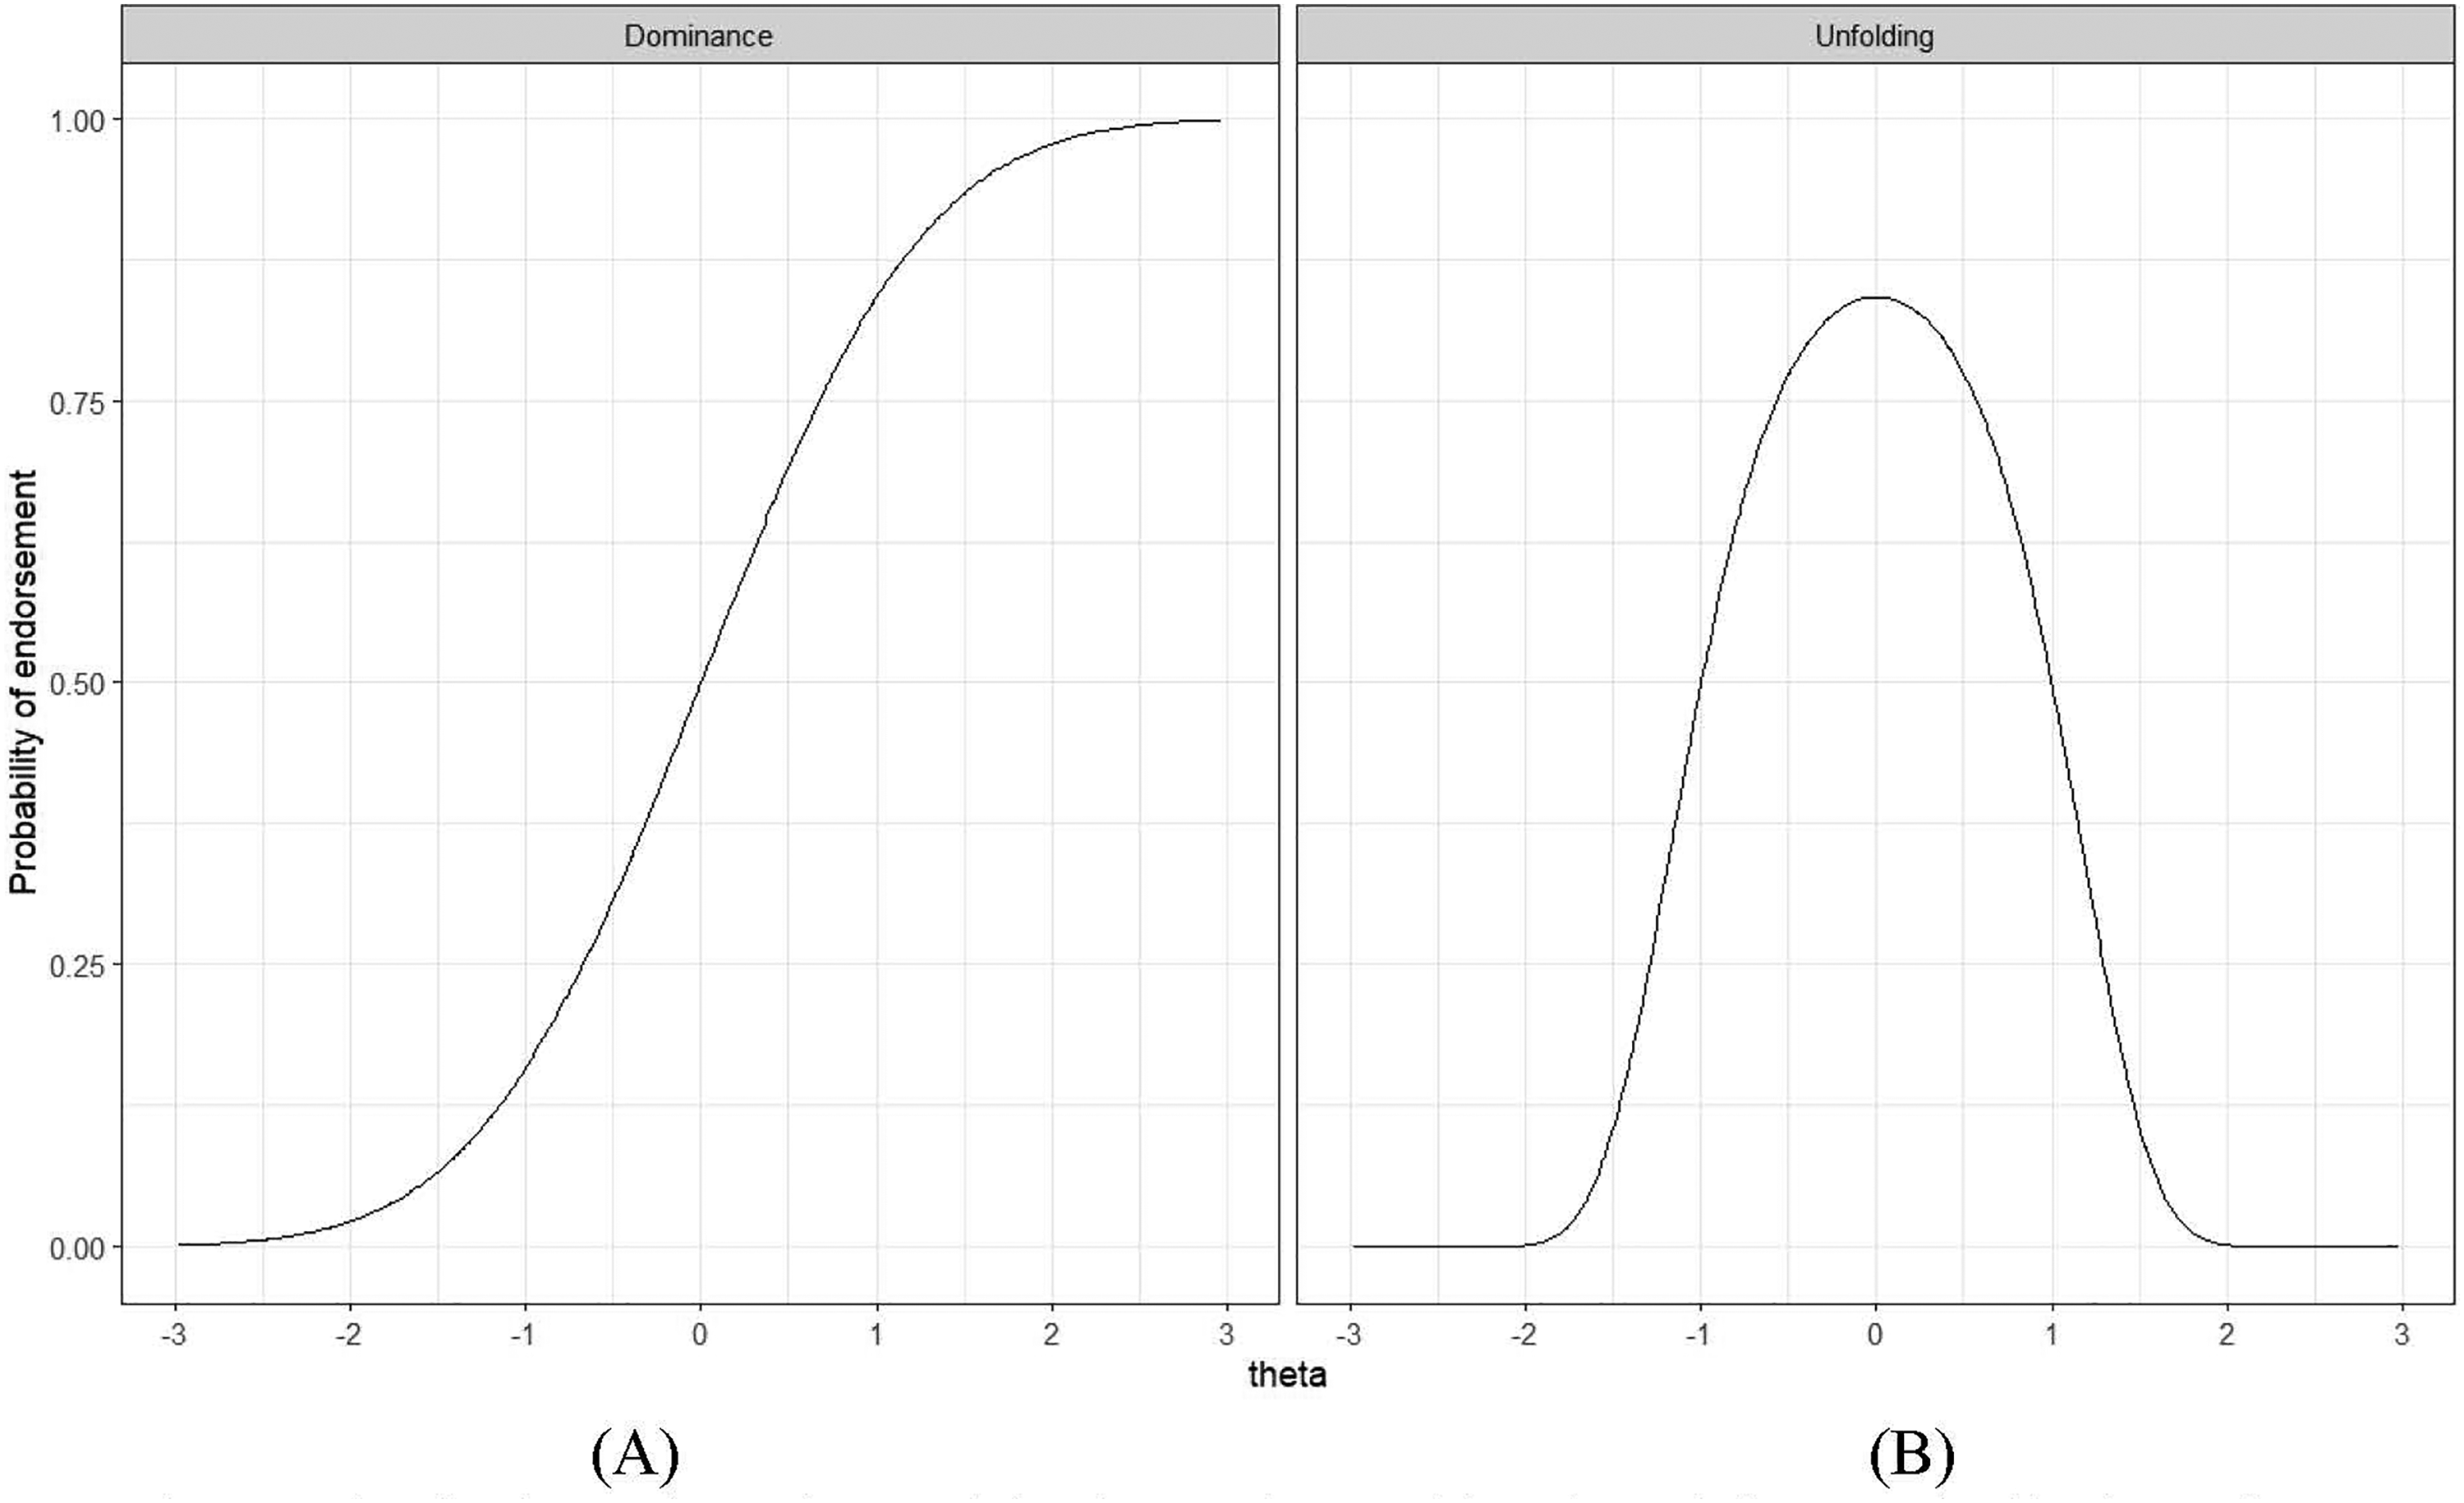
Illustration of the theoretical item response function of dominance and unfolding responses.
Formulation of the OCRUM
This study aims to represent the unfolding response process through a quadratic factor analysis model. The OCRUM is formulated based on two tenets of the unfolding response process on a unidimensional latent psychological continuum. First, items and individuals (latent traits) can be positioned on the same latent continuum that reflects their sentiment or attitude. For example, a neutral item or an individual with a neutral attitude regarding the psychological construct would be in the middle, negative items on the left, and positive items on the right side of the latent continuum.
Second, when individuals are asked to express their agreement with an item that reflects their attitude or another psychological construct, they are more likely to agree with an item located close to them on the continuum. Suppose
Inspired by the metric unidimensional unfolding model (Maraun & Rossi, 2001; van Schuur & Kiers, 1994), the OCRUM defines the latent response as

In a linear factor model with positive factor loadings, larger values of
By expanding equation (2), the OCRUM can be re-expressed as a quadratic factor analysis model (Maraun & Rossi, 2001):

Essentially, the unfolding response mechanism described in equation (2) is characterized by the Euclidean distance between item and person locations, and the single-peakedness property in the responses
Illustration of the item response functions of the ordered categorical response unfolding model for dichotomous items. Top panel: Changing the item location parameters (
LMS Method
The OCRUM (see equation 3) involves a quadratic term
The LMS is a distribution analytic method that analyzes raw data using “an iterative ML estimation procedure tailored for the type of non-normality induced by interaction effects” (Klein & Moosbrugger, 2000, p. 473). This procedure produces maximum likelihood estimates and provides statistical inferences on the parameter estimates. Currently, the LMS method is available in Mplus and the nlsem R package (Umbach et al., 2017).
Study 1
Study 1 aimed to illustrate the application of the proposed OCRUM using two empirical datasets and to compare the performance of the OCRUM with that of the GGUM, specifically with respect to the estimated (relative) locations of items
GGUM
The GGUM was chosen as a comparison model because it is commonly used for modeling unfolding response data in the current literature (e.g., Foster et al., 2017; Polak et al., 2009; Tay, 2011; Tay et al., 2009; Weekers & Meijer, 2008). The GGUM (Roberts et al., 2000) was developed within the IRT probabilistic modeling framework based on Muraki's (1992) generalized partial credit model. The GGUM is defined as
We emphasize that the OCRUM is proposed as an alternative model for unfolding responses (where item responses are guided by the distance between item and person locations on the latent continuum), rather than a replacement for the GGUM. Both the OCRUM and the GGUM share similar model parameters for representing the item response curve—a peak at different locations through the item location parameter in both models, and the “sharpness” of the peak through the discrimination parameter in the GGUM versus the curvature parameter in the OCRUM. Although the mathematical expressions of the quadratic function (OCRUM) and the hyperbolic cosine function (GGUM) differ, they both produce a similar unimodal response curve (and the hyperbolic cosine function can be approximated by a polynomial/quadratic function using the Taylor series expansion). This is analogous to choosing between logistic and probit link functions in IRT models for dominance responses (other sigmoid functions, such as arc or hyperbolic tangent, can also be considered). For a given dataset, researchers can fit both the OCRUM and the GGUM and compare which model provides a better empirical approximation to the data. Roberts & Laughlin (1996) first introduced the GGUM and acknowledged that alternative variations of unfolding models could be adapted or developed.
The OCRUM can be linked to the SEM framework as a measurement model and can be readily fitted in Mplus. This creates new opportunities for researchers to analyze data that include a mix of unfolding and dominance responses, as shown in Study 3. Such flexibility is not currently available when using the GGUM.
Method
Empirical Datasets
We reanalyzed two datasets using both the OCRUM and the GGUM: (1) Thurstone's (1932) 24-item Attitude Toward Capital Punishment Scale, as collected by Roberts (1995) and (2) the Order facet of the Conscientiousness Personality Scale reported by Chernyshenko et al. (2007). These datasets were selected because they measure noncognitive constructs and have previously been shown to follow an unfolding response mechanism.
Dataset 1
Roberts (1995) collected polytomous response data on Thurstone's (1932) 24-item Attitude Toward Capital Punishment Scale from 245 undergraduates at the University of South Carolina. Items were presented in random order, and participants responded using a 6-point Likert type scale (1 = strongly disagree, 2 = disagree, 3 = slightly disagree, 4 = slightly agree, 5 = agree, 6 = strongly agree). This dataset was used in Roberts and Laughlin's (1996) study to introduce the GGUM and demonstrate its empirical application. Accordingly, we selected it as a benchmark for comparison with the OCRUM in Study 1. The dataset was obtained from the GGUM software website. Consistent with Roberts and Laughlin (1996), we used 12 of the 24 items in our analysis. 2
Dataset 2
The Order Scale, developed by Chernyshenko et al. (2007), measures the order facet of the conscientiousness personality domain. Items were generated under the assumption of an unfolding response process. Response data for the 20-item scale were collected from 539 undergraduate students at an American university using a 4-point Likert type scale (1 = strongly disagree, 2 = disagree, 3 = agree, 4 = strongly agree). Because we analyzed only complete cases, approximately 6% of the sample was excluded, resulting in a final sample size of 505. To be consistent with Chernyshenko et al.'s (2007) analytic approach, we dichotomized the polytomous responses prior to analysis due to infrequent endorsement of the two extreme options: strongly disagree and disagree were collapsed and coded as 0, and agree and strongly agree were collapsed and coded as 1.
Procedure
The datasets were analyzed using the proposed OCRUM in Mplus. An example of the Mplus input file for fitting the OCRUM is presented in Appendix A. Full-information maximum likelihood (FIML) with robust standard errors (MLR) was used to estimate model parameters. A probit link was chosen to maintain consistency across all studies reported in this article.
3
User-specified starting values of −1 were provided for the
The GGUM parameters were estimated using the GGUM2004 software (Roberts et al., 2000, 2006). Item parameters were estimated with marginal maximum likelihood (MML; also referred to as FIML in the SEM literature; Forero & Maydeu Olivares, 2009), and person locations were estimated via the EAP procedure (Roberts et al., 2006). We used the GGUM2004 default estimation settings (Roberts, 2004).
Analysis
Because the GGUM and the OCRUM rely on different mathematical formulations to represent the unimodality/single-peakedness of the unfolding process, we did not expect the magnitudes of the item and person location estimates to be identical across models. However, we expected the pattern and ordering of item and person locations to be comparable, such that both models would reach similar conclusions about items located at the extremes versus the middle of the latent continuum. Accordingly, we computed Spearman's rank correlation (
Results
Item Location
Spearman's rank correlations between item locations estimated by the OCRUM and the GGUM were .97 for the 12-item Attitude Toward Capital Punishment Scale and .95 for the 20-item Order Scale. The corresponding Pearson correlations were also high (.91 and .89 for the Attitude Toward Capital Punishment Scale and the Order Scale, respectively). Table 1 presents the estimated item locations
Item Location Estimates of Attitude Toward CP and ORS Items.
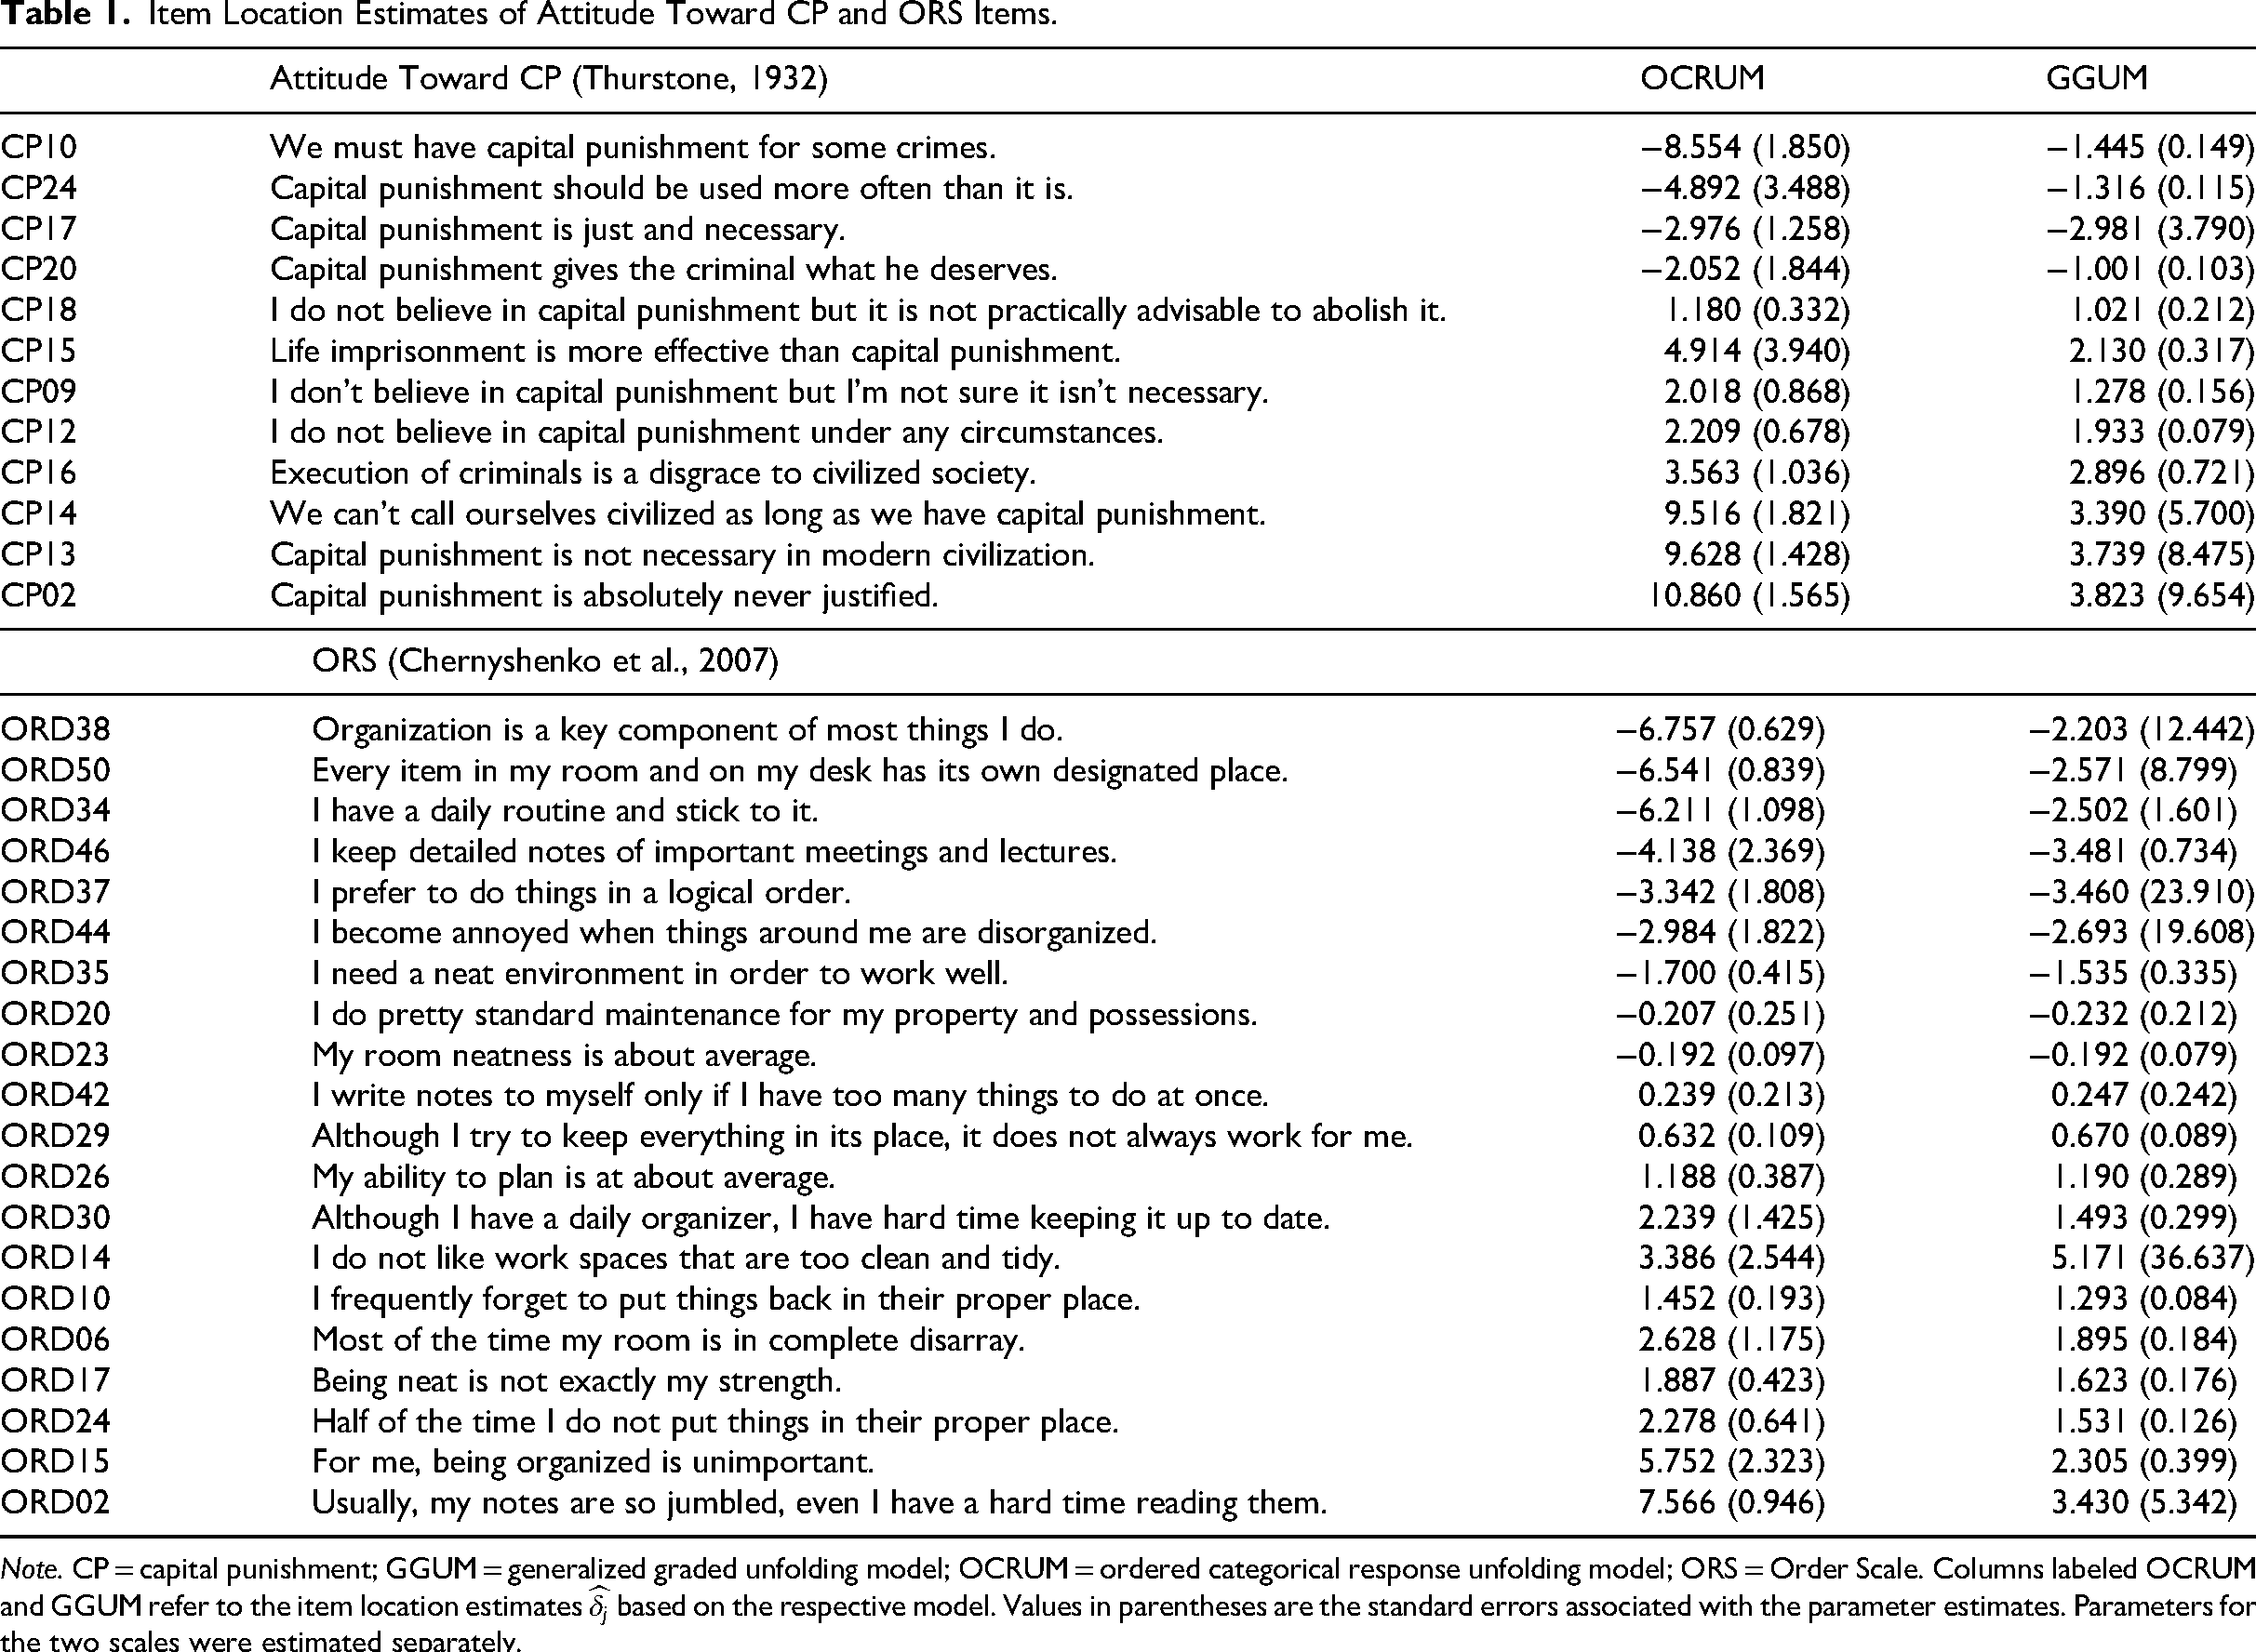
Note. CP = capital punishment; GGUM = generalized graded unfolding model; OCRUM = ordered categorical response unfolding model; ORS = Order Scale. Columns labeled OCRUM and GGUM refer to the item location estimates
Person Location
Similar to the item location analysis, we computed Spearman's rank correlation (
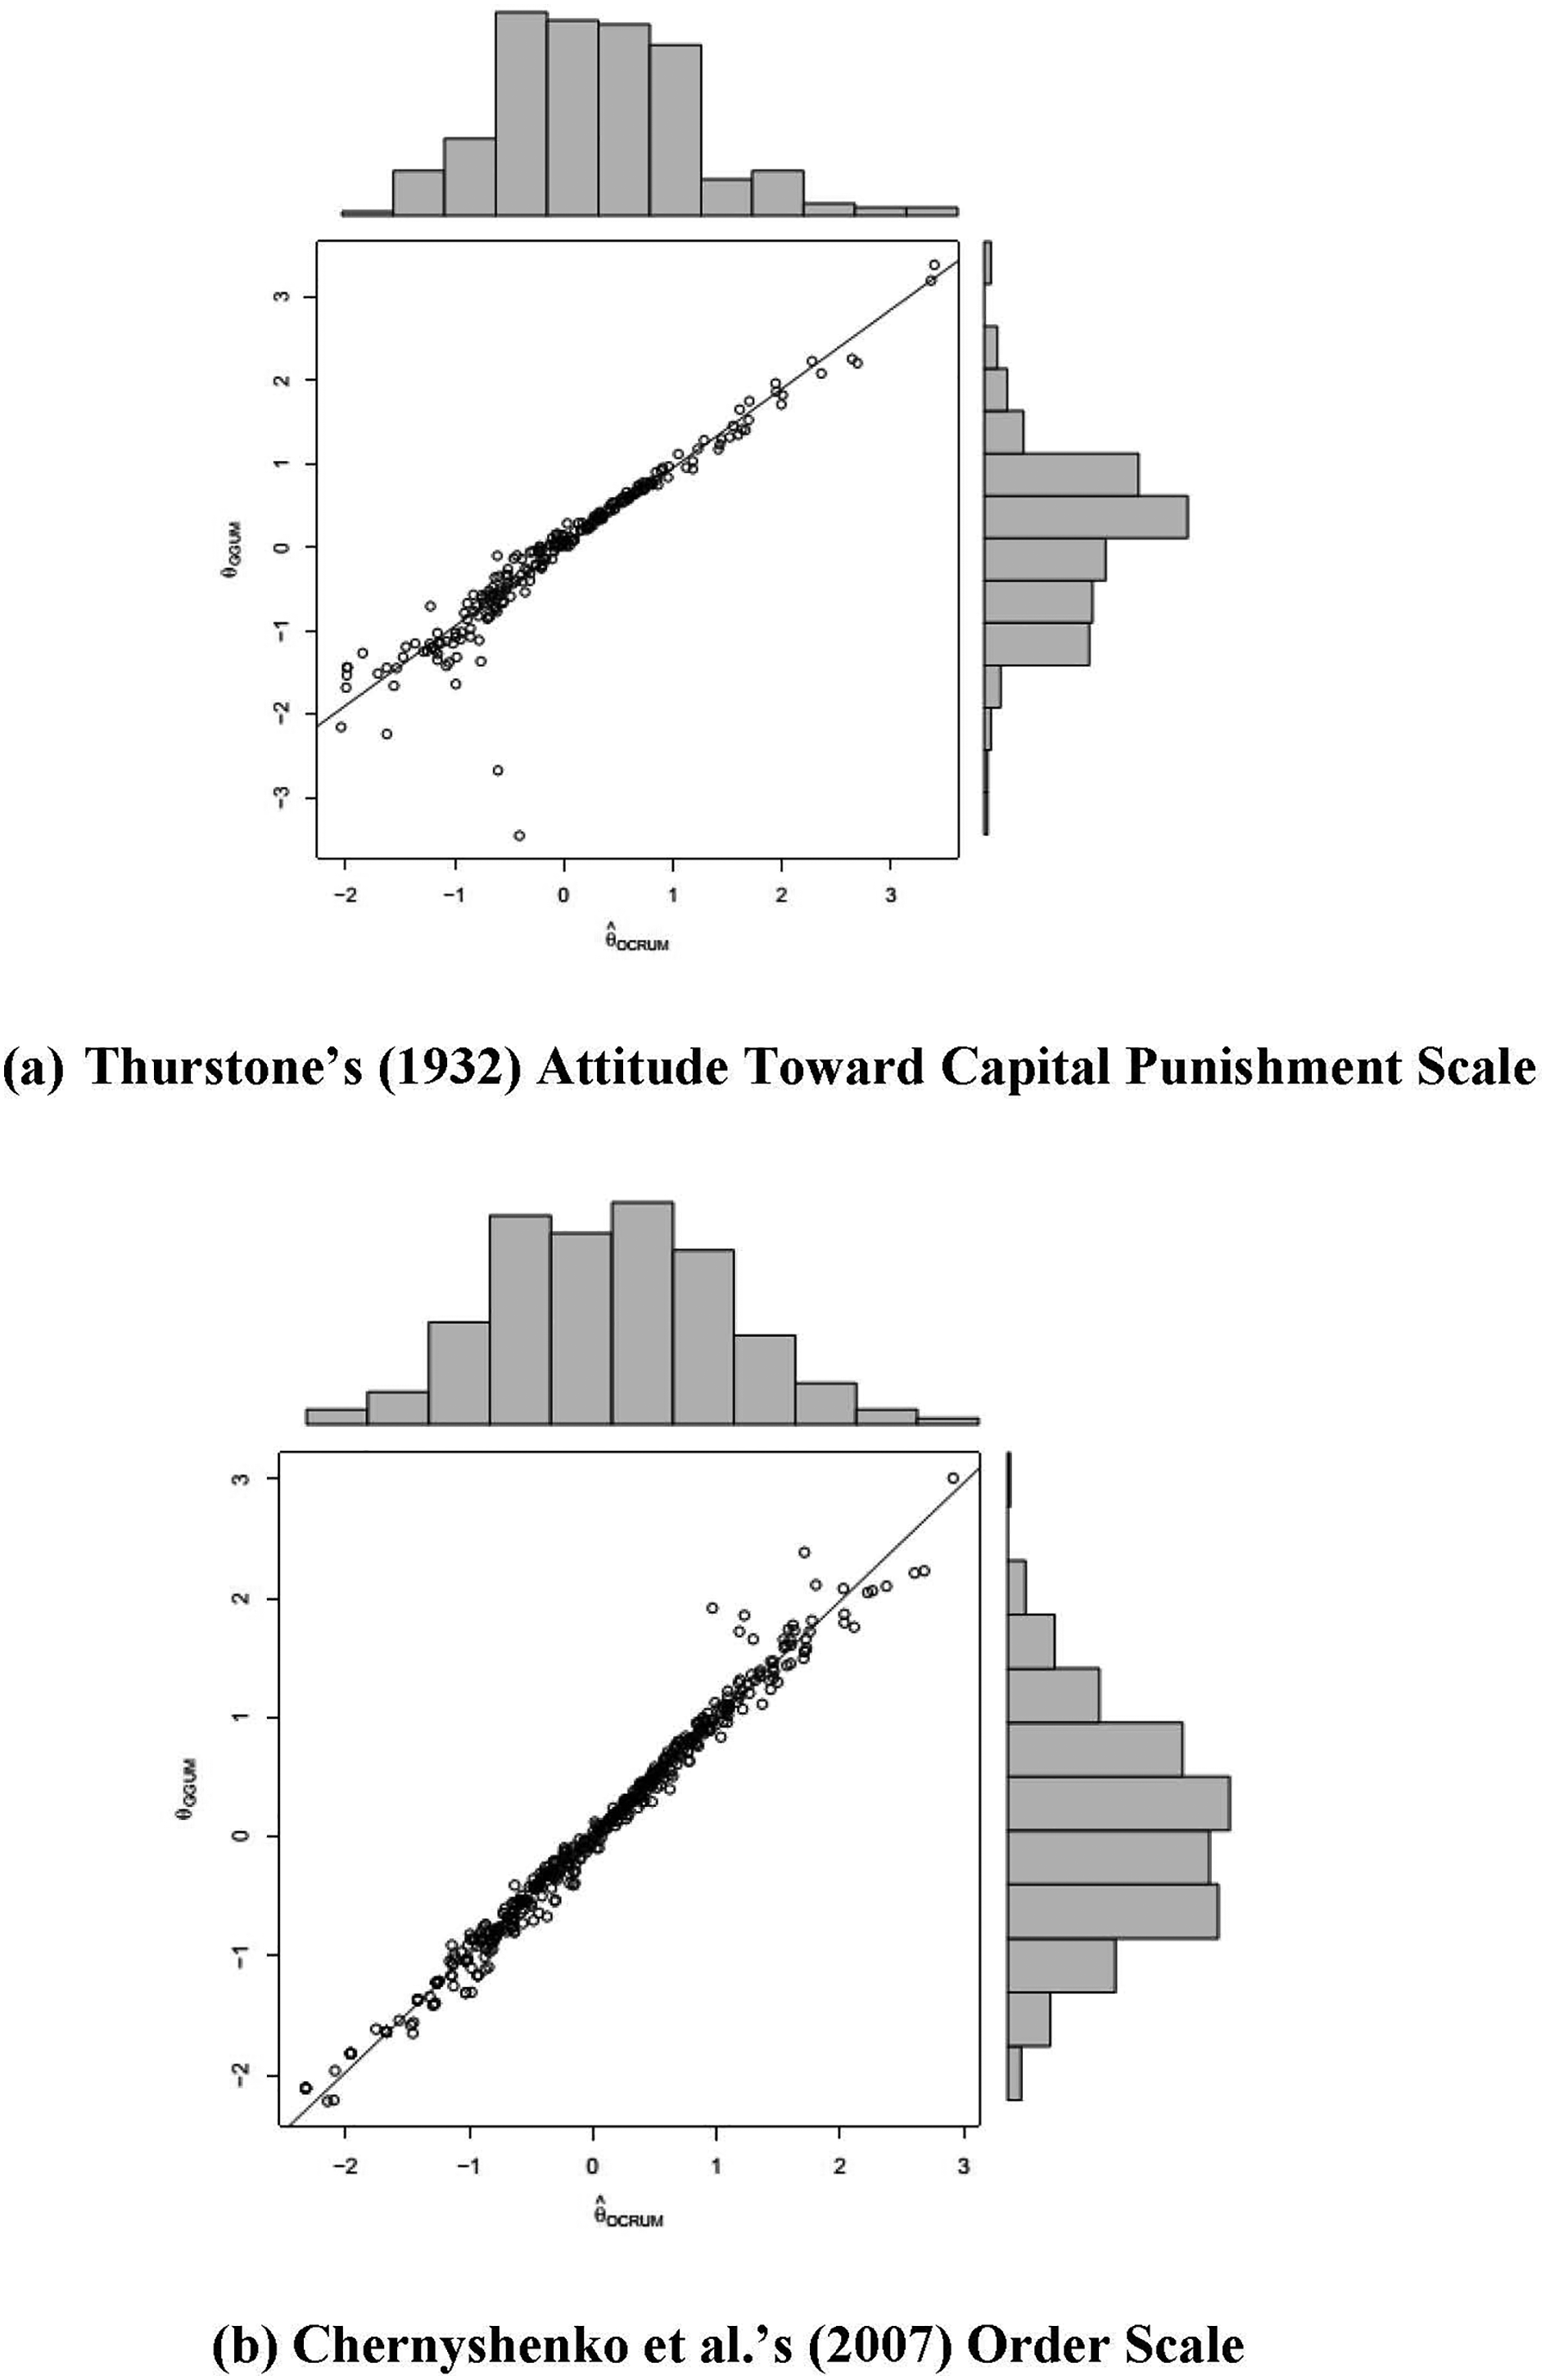
Correlation and distribution of estimated person locations (Study 1). (a) Thurstone's (1932) Attitude Toward Capital Punishment Scale. (b) Chernyshenko et al.'s (2007) Order Scale.
There were some cases with noticeable differences in person locations between the GGUM and the OCRUM. Upon data inspection, we observed aberrant response patterns (e.g., endorsing both items on the positive and negative ends of the latent continuum) that did not conform to expectations under the unfolding response mechanism. Although the GGUM and the OCRUM yielded different
Summary of Study 1
Spearman's rank and Pearson correlations were used to quantify the similarity between item location estimates (
Study 2
The second study aimed to investigate the effects of sample size (N), test length (J), item location range (D), and response options (R) on the recovery of key model parameters—namely, the estimated item locations, estimated person locations, and model–data fit of the OCRUM—via Monte Carlo simulation. The simulation results provide insights into the potential pitfalls of the proposed model and help generate practical guidelines for applied researchers (see the Discussion section).
Method
Simulation Design
This study followed a 3 (sample size: N = 150, 300, 600) × 3 (test length: J = 3, 5, 10) × 2 (item location range: D = ±1.5, ±2.5) × 2 (response option: R = dichotomous; polytomous) design. Replications were performed for all 36 conditions until 200 successful replications were obtained for each condition. The dependent variables of interest were (a) bias in the
Item location (
We chose three sample sizes to reflect a small (N = 150), moderate (N = 300), and larger (N = 600) sample, as often observed in psychological studies. Larger sample sizes generally lead to more precise parameter estimates (i.e., smaller standard errors). We sought to identify the sample size requirements needed to obtain reliable parameter estimates and to offer recommendations for researchers who plan to use the OCRUM in their studies.
We selected three levels of test length, namely, three, five, and 10 items, to reflect a typical short, medium, and relatively long scale, respectively, for measuring a single factor or dimension commonly encountered in psychology; for example, the Revised UCLA Loneliness Scale includes three items (Hughes et al., 2004), the five-item Satisfaction With Life Scale (Diener et al., 1985) and the 10-item Generic Job Satisfaction Scale (Macdonald & MacIntyre, 1997). Conceptually, a longer test should provide greater precision in estimating a person's location on the latent continuum, as each item contributes an additional observation (data point). We therefore examined the effect of test length on the accuracy of person location estimation to provide practical recommendations on minimal test length for OCRUM users.
Following previously reported research designs (e.g., Andrich, 1988; Roberts, 1995), we incorporated two item location ranges: ±1.5 and ±2.5. These ranges reflect differences in the coverage of items that measure a particular attitude or valence on the latent continuum, assuming a normally distributed person location distribution on the same continuum. We categorized items as intermediate or extreme based on their
We examined both dichotomous and polytomous responses, as both formats are common in psychological measures (e.g., Minnesota Multiphasic Personality Inventory [MMPI]-2 with a true–false format; Butcher et al., 1989, 2001; NEO-PI-R with a 5-point rating format; Costa & McCrae, 1992). Polytomous items tend to provide more psychometric information about both items (item parameters) and persons (person locations) than dichotomous items. However, in the IRT literature, polytomous item parameter estimates often require larger sample sizes for accurate estimation (Chernyshenko et al., 2007). We therefore sought to examine sample size requirements for different response formats to obtain reliable parameter estimates and to offer recommendations for OCRUM users.
Data Generation
The procedure used to generate the observed responses for the simulation was adapted from Muthén and Kaplan (1985). The observed response data were simulated in three steps:
Continuous responses Person locations The continuous responses
Item Locations (
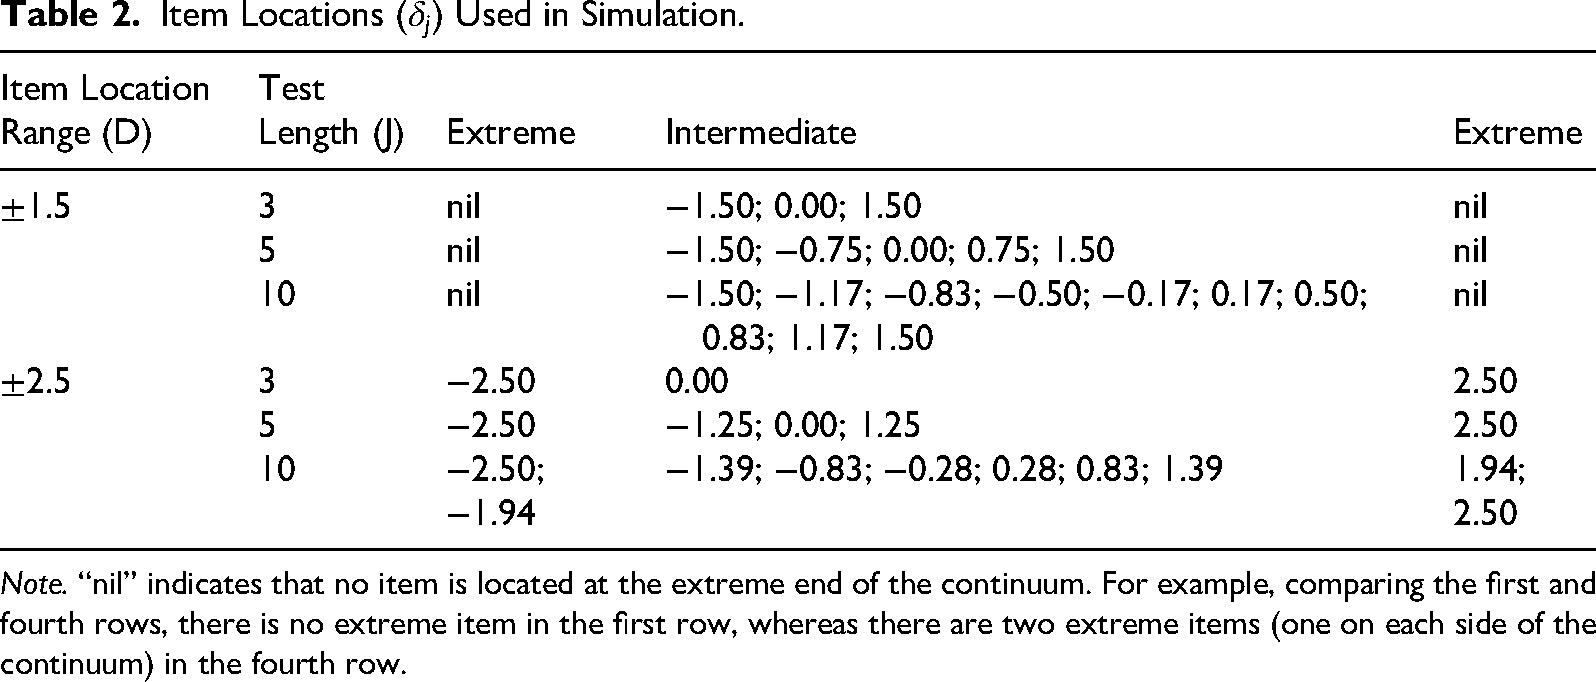
Note. “nil” indicates that no item is located at the extreme end of the continuum. For example, comparing the first and fourth rows, there is no extreme item in the first row, whereas there are two extreme items (one on each side of the continuum) in the fourth row.
The
Analysis
Bias in Parameter Estimation
To evaluate the feasibility of fitting the proposed model using the LMS approach, we computed parameter bias to assess the accuracy of the parameter estimates. Higher bias values indicate greater deviation from the true (population) parameter values.
Mean bias in the parameter estimates was calculated as
Recovery of Person Location (
)
Similar to Study 1, Spearman's rank correlation and Pearson correlation were computed to reflect the similarity in the ranking and pattern of the true and estimated
Model–Data Fit
The FIML method for categorical data was chosen for estimation, which involved numerical integration. Chi-square tests and other conventional global goodness-of-fit statistics (e.g., root mean square error of approximation and standardized root mean square residual) were not available under this estimator (Muthén, 2010). Nevertheless, Mplus provides model comparison indices, including the Akaike information criterion (AIC), Bayesian information criterion (BIC), and sample-size-adjusted BIC (sBIC). Given the same set of observed variables, these indices can be used to select a better-fitting model among a set of competing models (regardless of whether they are nested), after accounting for model complexity; models with smaller values are preferred (West et al., 2012).
A two-factor exploratory factor analysis (EFA) model 5 was chosen as the competing model to assess the relative fit of the OCRUM to the simulated data (recall that the data-generating model was the OCRUM). Previous studies have reported that linear factor analysis of unfoldable unidimensional items (e.g., bipolar constructs such as happy vs. sad and liberalism vs. conservatism) can spuriously produce a two-dimensional solution—often referred to as the “extra factor” phenomenon (Maraun & Rossi, 2001; van Schuur & Kiers, 1994). Therefore, we used a two-factor model as the competing model to evaluate the sensitivity and specificity of the model fit statistics of interest.
For each condition, we computed the proportion of simulated datasets in which each information criterion (AIC, BIC, sBIC) identified the OCRUM as the better-fitting model compared with the two-factor EFA. This proportion is referred to as the hit rate. The three-item test length condition was not included in this comparison because it is not feasible to fit a two-factor EFA model to such data (the model is underidentified).
Procedure
This simulation study investigated the effects of sample size, test length, item location range, and response options on parameter estimates and model–data fit. Data were generated using the procedure described above. The OCRUM (equation 3) was fitted to the simulated data until 200 successful replications were obtained for each condition. Subsequently, a two-factor EFA model (with geomin rotation) was fitted to the same datasets. Both the OCRUM and two-factor EFA models were estimated using the MLR estimator with a probit link in Mplus.
Results
Successful Replications
Table 3 presents, for each condition, the total number of replications attempted (first value in each cell), the number of datasets that converged with estimation errors (second value; at least one parameter fixed and not estimated), and the number of datasets that failed to converge (third value; the OCRUM did not fit). As shown in Table 3, for dichotomous response options (R = 2), Mplus had more difficulty fitting the OCRUM when the sample size was small (N = 150) and the test length was short (J = 3), especially when the item location range was large (±2.5). This difficulty is reflected in the larger number of replications required to obtain 200 successful datasets in these conditions. In contrast, most datasets were fitted without error in the polytomous response option conditions (R = 6) when the sample size was 300 or more, regardless of test length. Although item location range still affected convergence patterns, its impact diminished as sample size increased.
Simulation Replications (True Model = OCRUM, Fitted Model = OCRUM).
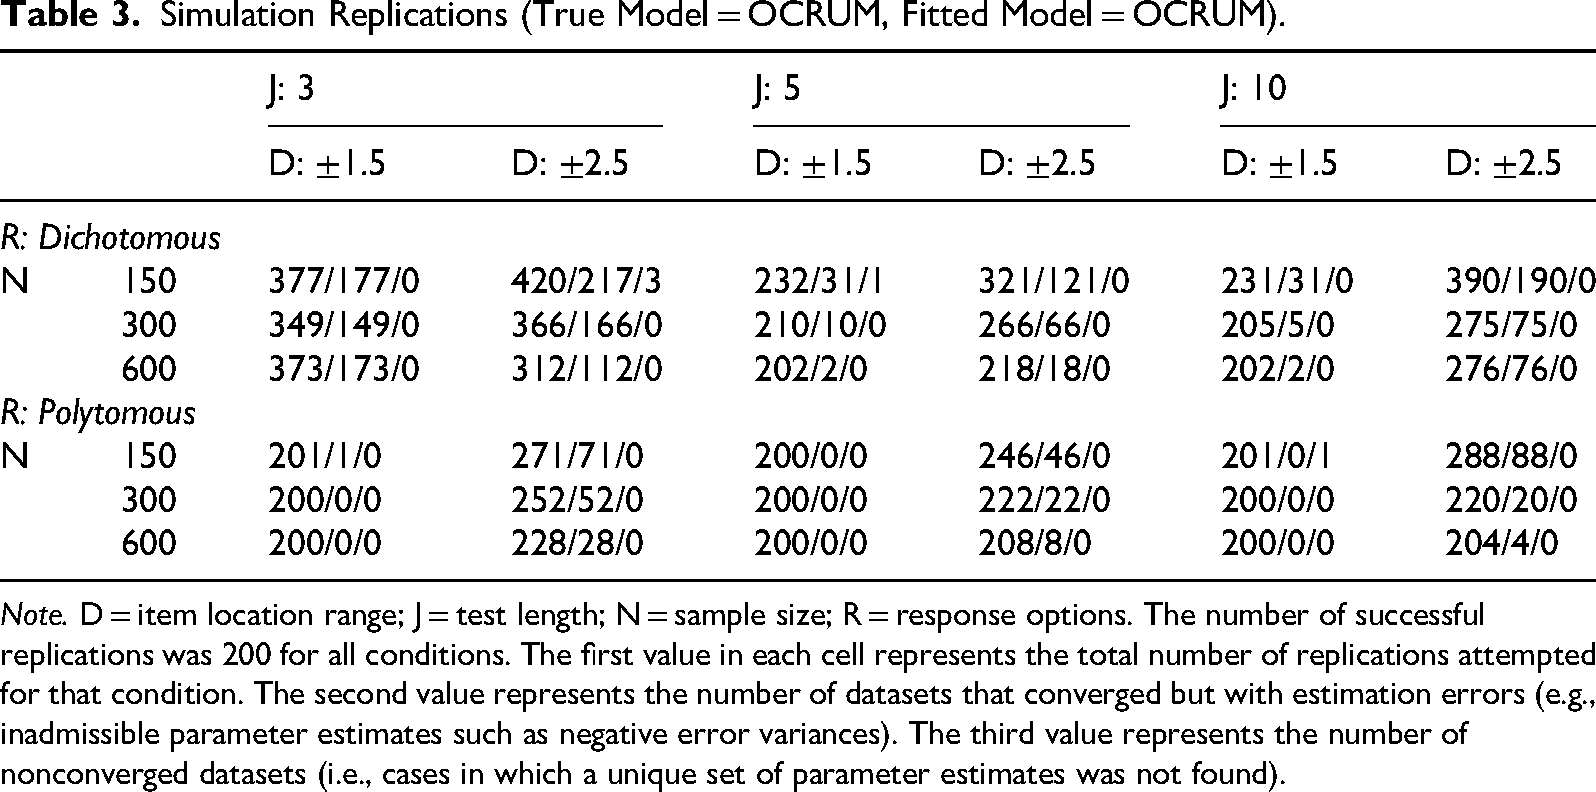
Note. D = item location range; J = test length; N = sample size; R = response options. The number of successful replications was 200 for all conditions. The first value in each cell represents the total number of replications attempted for that condition. The second value represents the number of datasets that converged but with estimation errors (e.g., inadmissible parameter estimates such as negative error variances). The third value represents the number of nonconverged datasets (i.e., cases in which a unique set of parameter estimates was not found).
Bias in Parameter Estimation
Figure 5 illustrates several consistent patterns. As expected, within each response option condition, the more extreme an item was (i.e., items with locations outside the range of ±1.5), the larger the bias in its item location estimate. This parameter bias for extreme items was more pronounced in the dichotomous (R = 2) conditions than in the polytomous (R = 6) conditions. However, these biases decreased as sample size increased, and the bias in the item location estimates tended toward 0 when the sample size increased from N = 150 to N = 600. 6
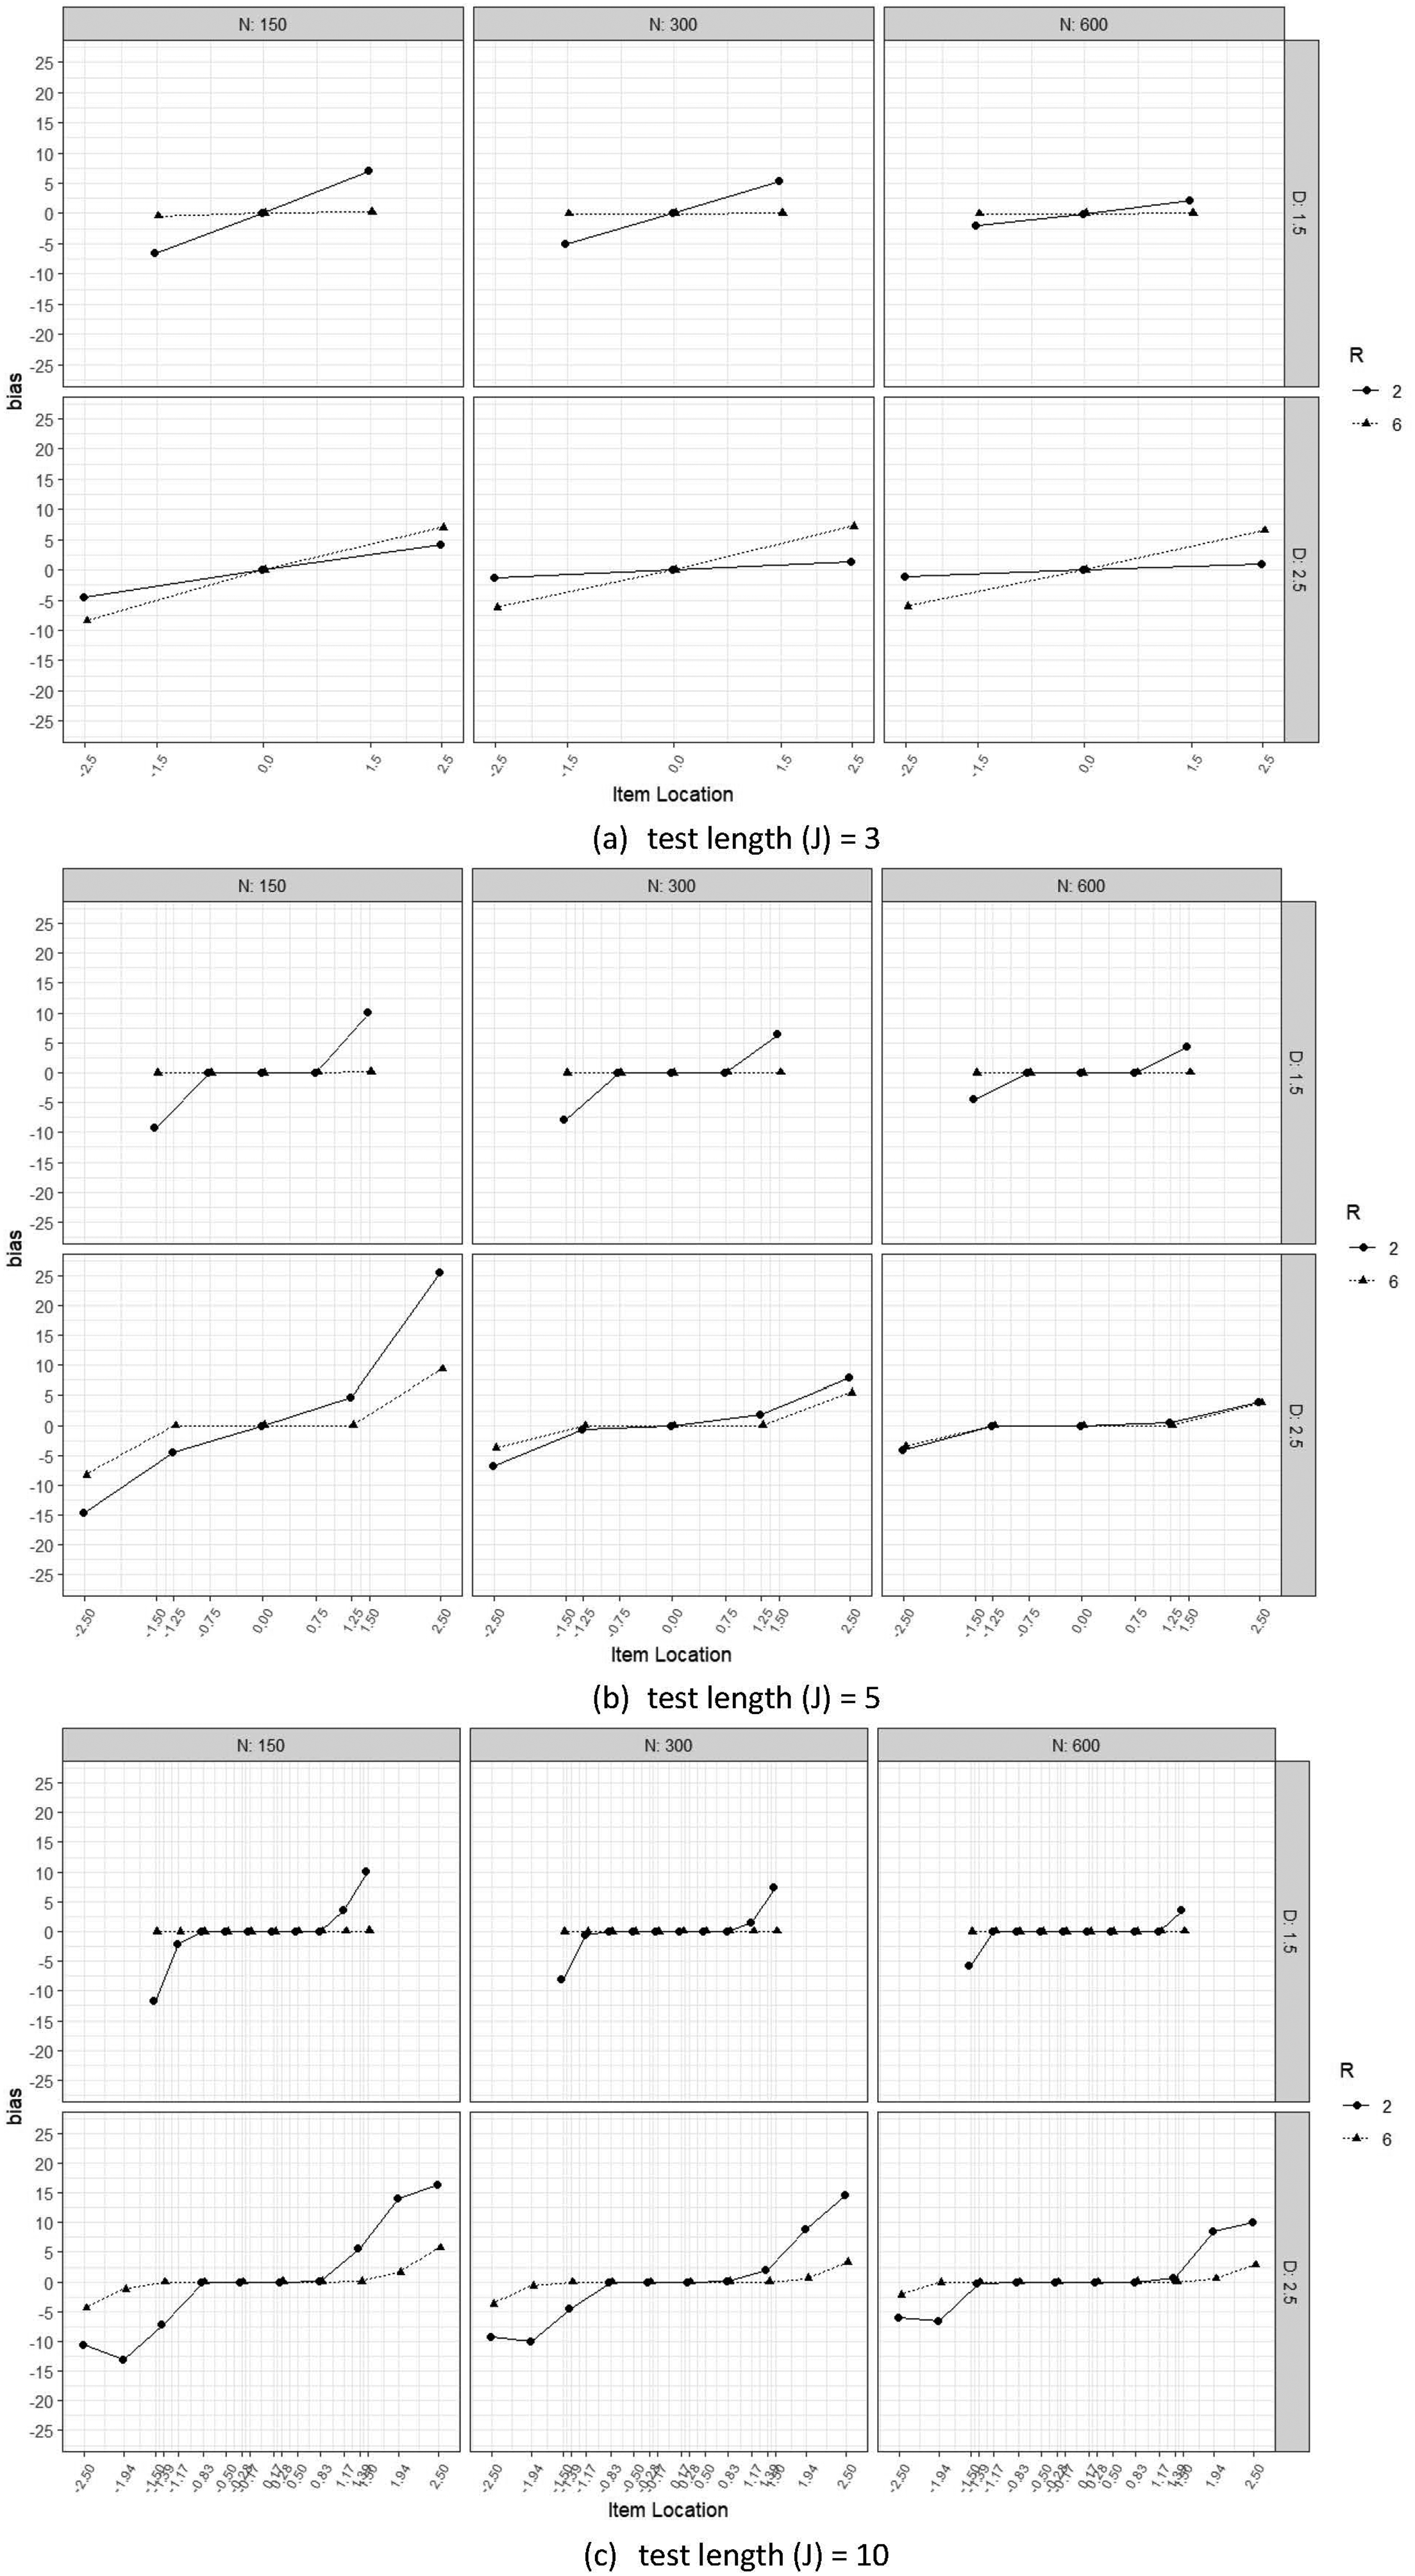
Item location parameter bias (Study 2). (a) Test length (J) = 3, (b) test length (J) = 5, and (c) test length (J) = 10.
Recovery of Person Location (
)
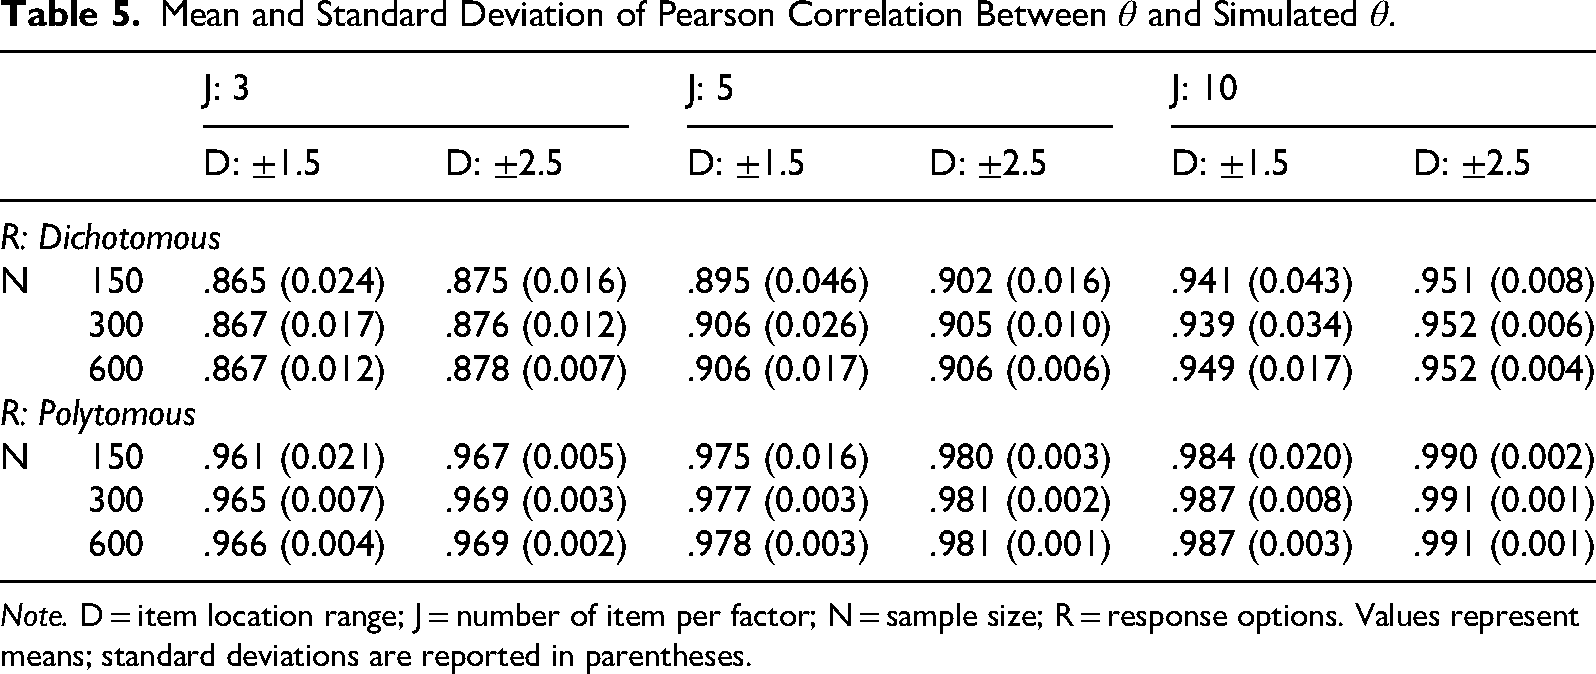
Table 4 presents the mean and standard deviation of Spearman's rank correlations between estimated person locations
Mean and Standard Deviation of Spearman Rank Correlation Between
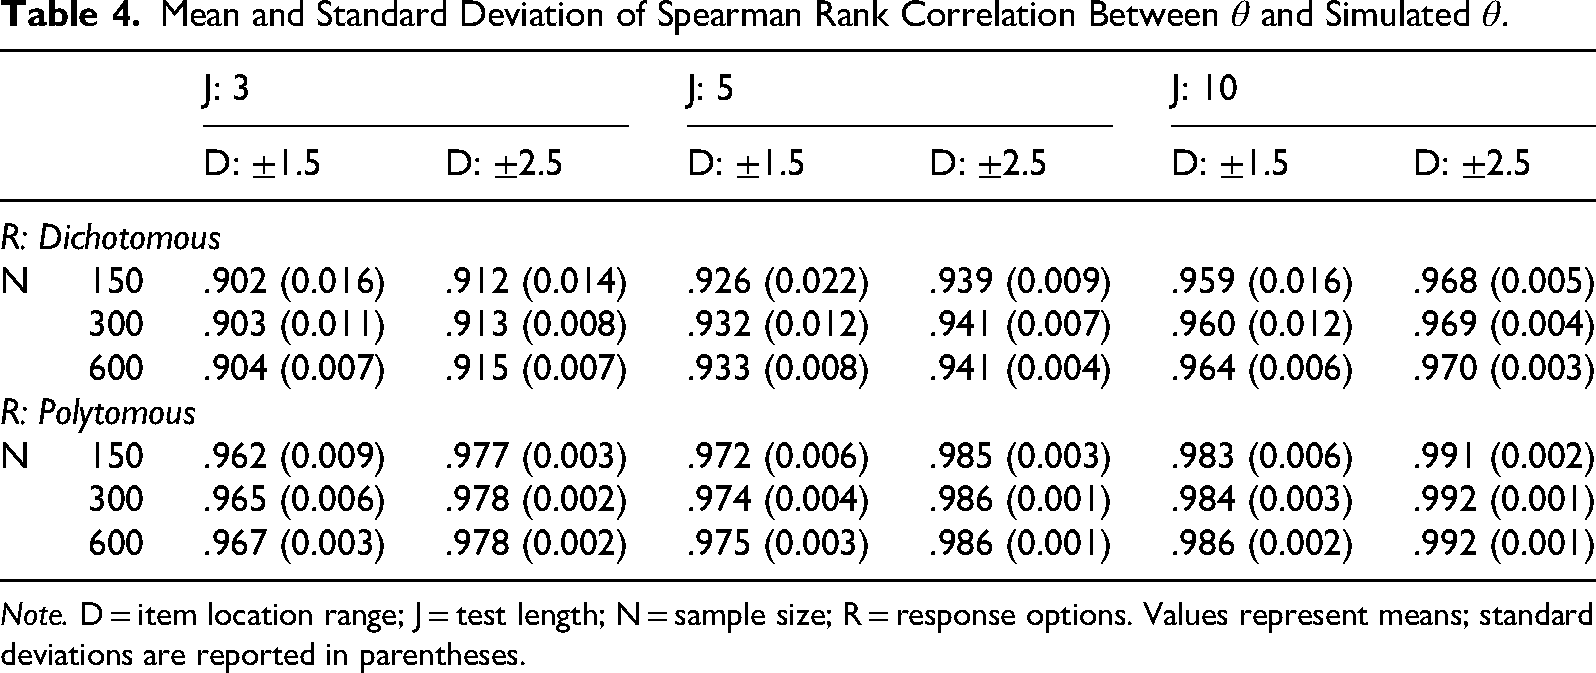
Note. D = item location range; J = test length; N = sample size; R = response options. Values represent means; standard deviations are reported in parentheses.
Mean and Standard Deviation of Pearson Correlation Between
Note. D = item location range; J = number of item per factor; N = sample size; R = response options. Values represent means; standard deviations are reported in parentheses.
Between-subjects analyses of variance (ANOVAs) were conducted to examine the effects of sample size (N), test length (J), item location range (D), response options (R), and their interactions on Spearman's rank correlations (Table 6) and Pearson correlations (Table 7) between estimated and simulated person locations. Each of the 36 conditions had 200 replications, and the number of replications served as the effective “sample size” for the ANOVAs. This large effective sample size implies that even trivial differences between conditions could attain statistical significance (p < .05) due to reduced standard errors. To avoid overinterpreting trivial effects, we report effect sizes for the ANOVAs rather than focusing on p values.
Effects of Various Simulation Design Factors on Spearman Rank Correlation Between
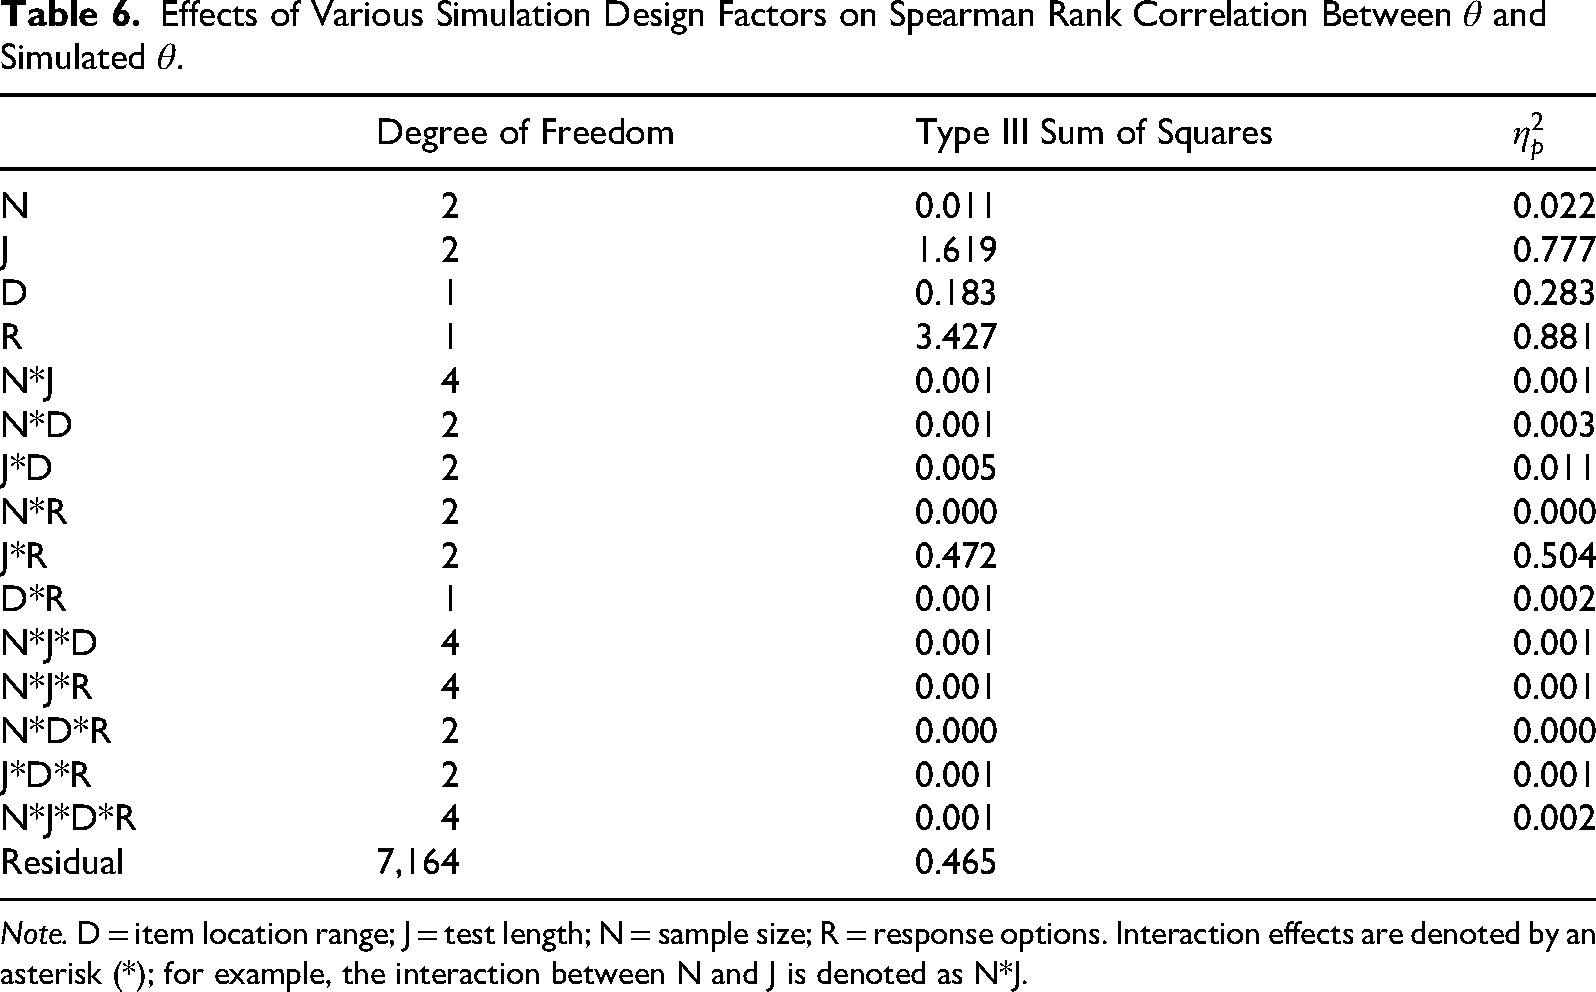
Note. D = item location range; J = test length; N = sample size; R = response options. Interaction effects are denoted by an asterisk (*); for example, the interaction between N and J is denoted as N*J.
Effects of Various Simulation Design Factors on Pearson Correlation Between
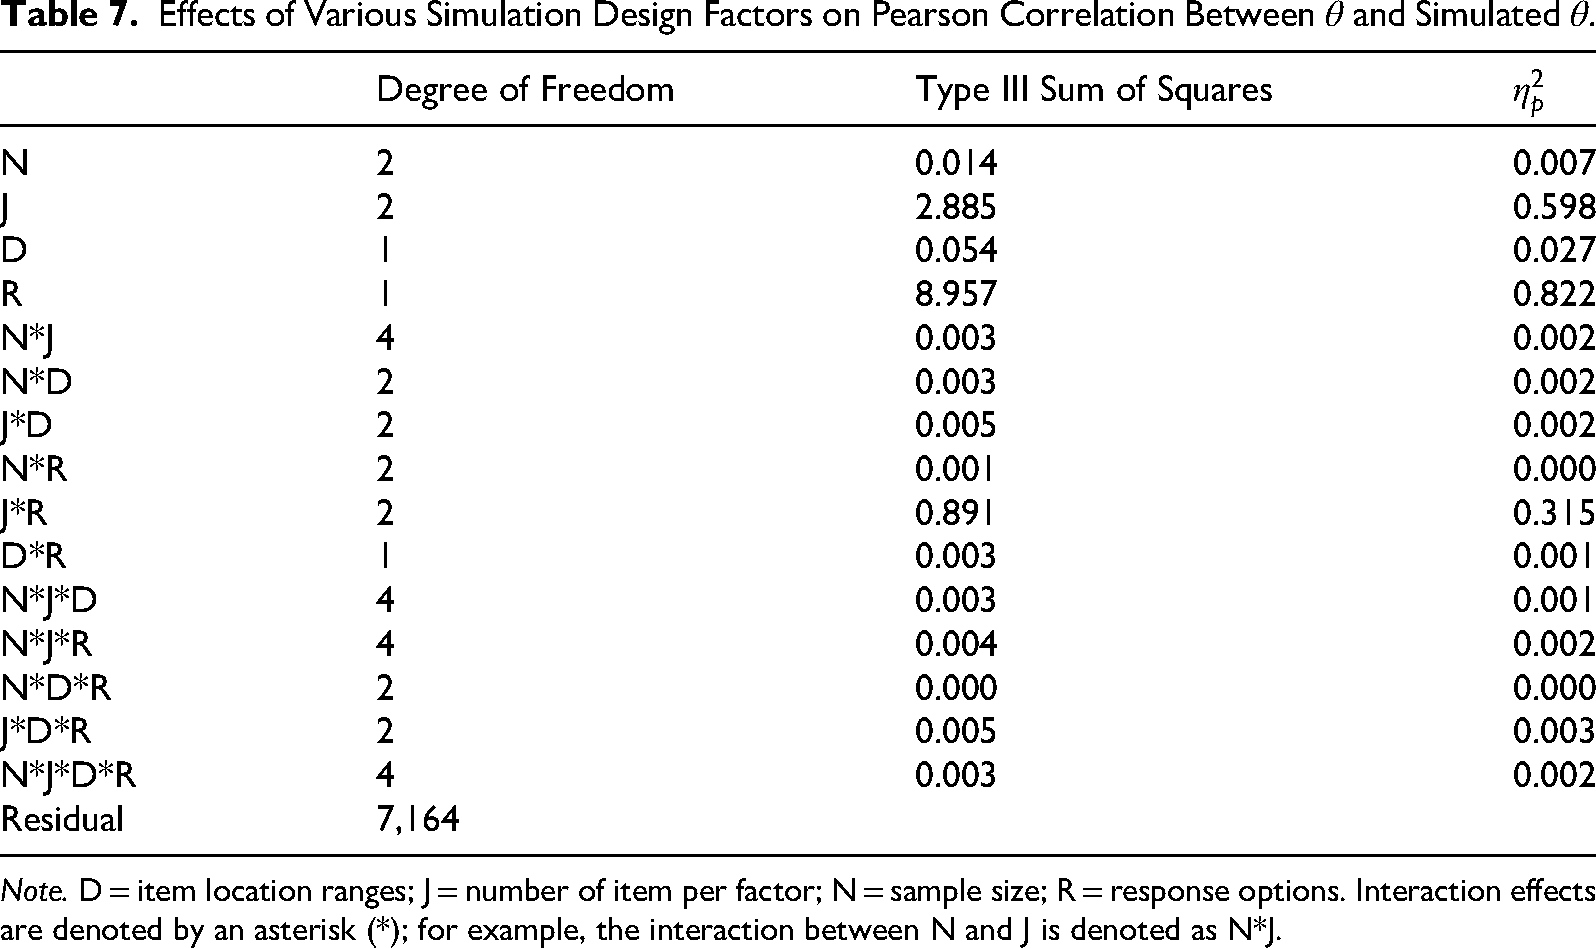
Note. D = item location ranges; J = number of item per factor; N = sample size; R = response options. Interaction effects are denoted by an asterisk (*); for example, the interaction between N and J is denoted as N*J.
Effect sizes were defined as the magnitude of an effect (Kelley & Preacher, 2012). Partial eta squared (
A large interaction effect was observed between test length and response options (J*R). The
Model Comparison
Because the simulated data were generated according to equation (2) (the OCRUM), fitting these data with the OCRUM should yield lower AIC, BIC, and sBIC values than fitting a two-factor EFA model (which is misspecified, given the data-generating process). The hit rate for each statistic was defined as the proportion of simulated datasets in a condition for which that statistic (AIC, BIC, or sBIC) identified the OCRUM as the better-fitting model. Table 8 summarizes these results. A value of 1 indicates that the statistic identified the OCRUM as the better-fitting model in all simulated datasets under that condition, whereas a value of 0 indicates that it never did so.
Model Comparison Hit Rate Using AIC, BIC, and sBIC (True Model = OCRUM).
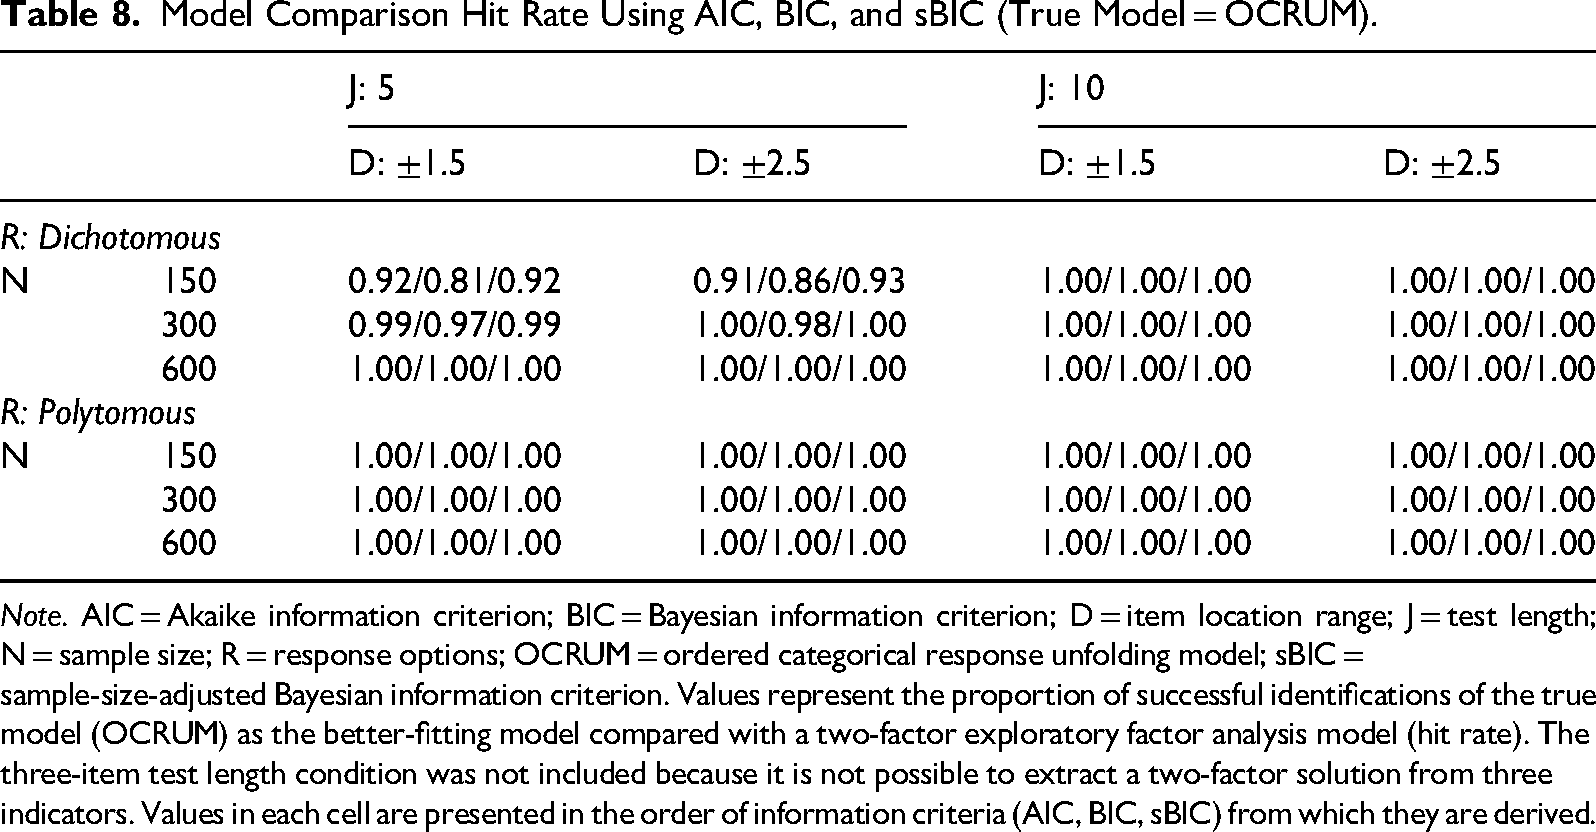
Note. AIC = Akaike information criterion; BIC = Bayesian information criterion; D = item location range; J = test length; N = sample size; R = response options; OCRUM = ordered categorical response unfolding model; sBIC = sample-size-adjusted Bayesian information criterion. Values represent the proportion of successful identifications of the true model (OCRUM) as the better-fitting model compared with a two-factor exploratory factor analysis model (hit rate). The three-item test length condition was not included because it is not possible to extract a two-factor solution from three indicators. Values in each cell are presented in the order of information criteria (AIC, BIC, sBIC) from which they are derived.
The AIC and sBIC generally indicated that the OCRUM was the correct model across most combinations of sample size (N), test length (J), item location range (D), and response options (R). In contrast, the BIC appeared less reliable under some conditions—for example, when responses were dichotomous, sample size was small (N = 150), test length was short (J = 5), and item location range was narrow (D = ±1.5); in this case, BIC identified the OCRUM as the better-fitting model in only 81% of the datasets.
Summary of Study 2
Study 2 examined the ability of the OCRUM approach to recover model parameters across a range of conditions that varied sample size (N), test length (J), item location range (D), and response options (R). Taken together, the findings suggest that the OCRUM may not perform well when analyzing dichotomous response data with a small sample size (N = 150) paired with a short test (J = 3) that includes extreme items. In general, the OCRUM performed better with polytomous response data, and item location bias decreased as a function of sample size and test length; that is, as sample size and test length increased, bias decreased. For dichotomous response data, the GGUM has similarly been found to produce relatively large parameter and standard error bias for extreme items (Roberts, 2004).
Spearman's and Pearson correlations between estimated and simulated θ also indicated better performance of the OCRUM with polytomous data. Both correlations were consistently above .96 in all conditions when responses were polytomous, whereas correlations were slightly lower for dichotomous data when the test was shorter (J = 3).
A second goal of Study 2 was to investigate the use of AIC, BIC, and sBIC in model comparison procedures. Based on our analyses, AIC and sBIC performed well across different levels of sample size, test length, response format, and item location range. In contrast, BIC showed reduced accuracy only under the smallest-sample, shorter-test condition for dichotomous data (N = 150, J = 5; hit rates = 0.81–0.86) but identified the OCRUM in essentially all other conditions.
Study 3
Past analyses of unfolding response data have typically focused on scoring participants on the latent construct of interest. However, many psychological and organizational studies also aim to test associations or directional (“causal”) relationships among latent constructs. Usami (2011), for example, attempted to estimate structural parameters and unfolding measurement model parameters simultaneously using a Bayesian approach. Although effective, this approach was computationally intensive and difficult to generalize to more complex models. In contrast, our proposed OCRUM approach can be readily implemented in existing SEM software (e.g., Mplus). This enables new modeling opportunities involving unfolding responses that have remained largely unexplored in previous work. In Study 3, we examined the feasibility of incorporating the OCRUM as part of the measurement model in a structural equation model and evaluated the accuracy of estimating structural parameters when a mix of unfolding and dominance responses is present, using Monte Carlo simulations.
Method
Simulation Design
We considered three levels of sample size (N = 150, 300, 600), following the rationale described in Study 2. In addition to sample size, we manipulated two effect sizes for the standardized structural coefficients, namely,
The dependent variables of interest were (a) parameter bias in the structural path coefficients (
Data Generation
A full structural equation model comprises both measurement and structural parts. In this study, the structural part included one latent trait (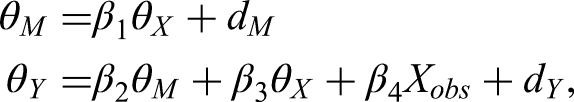
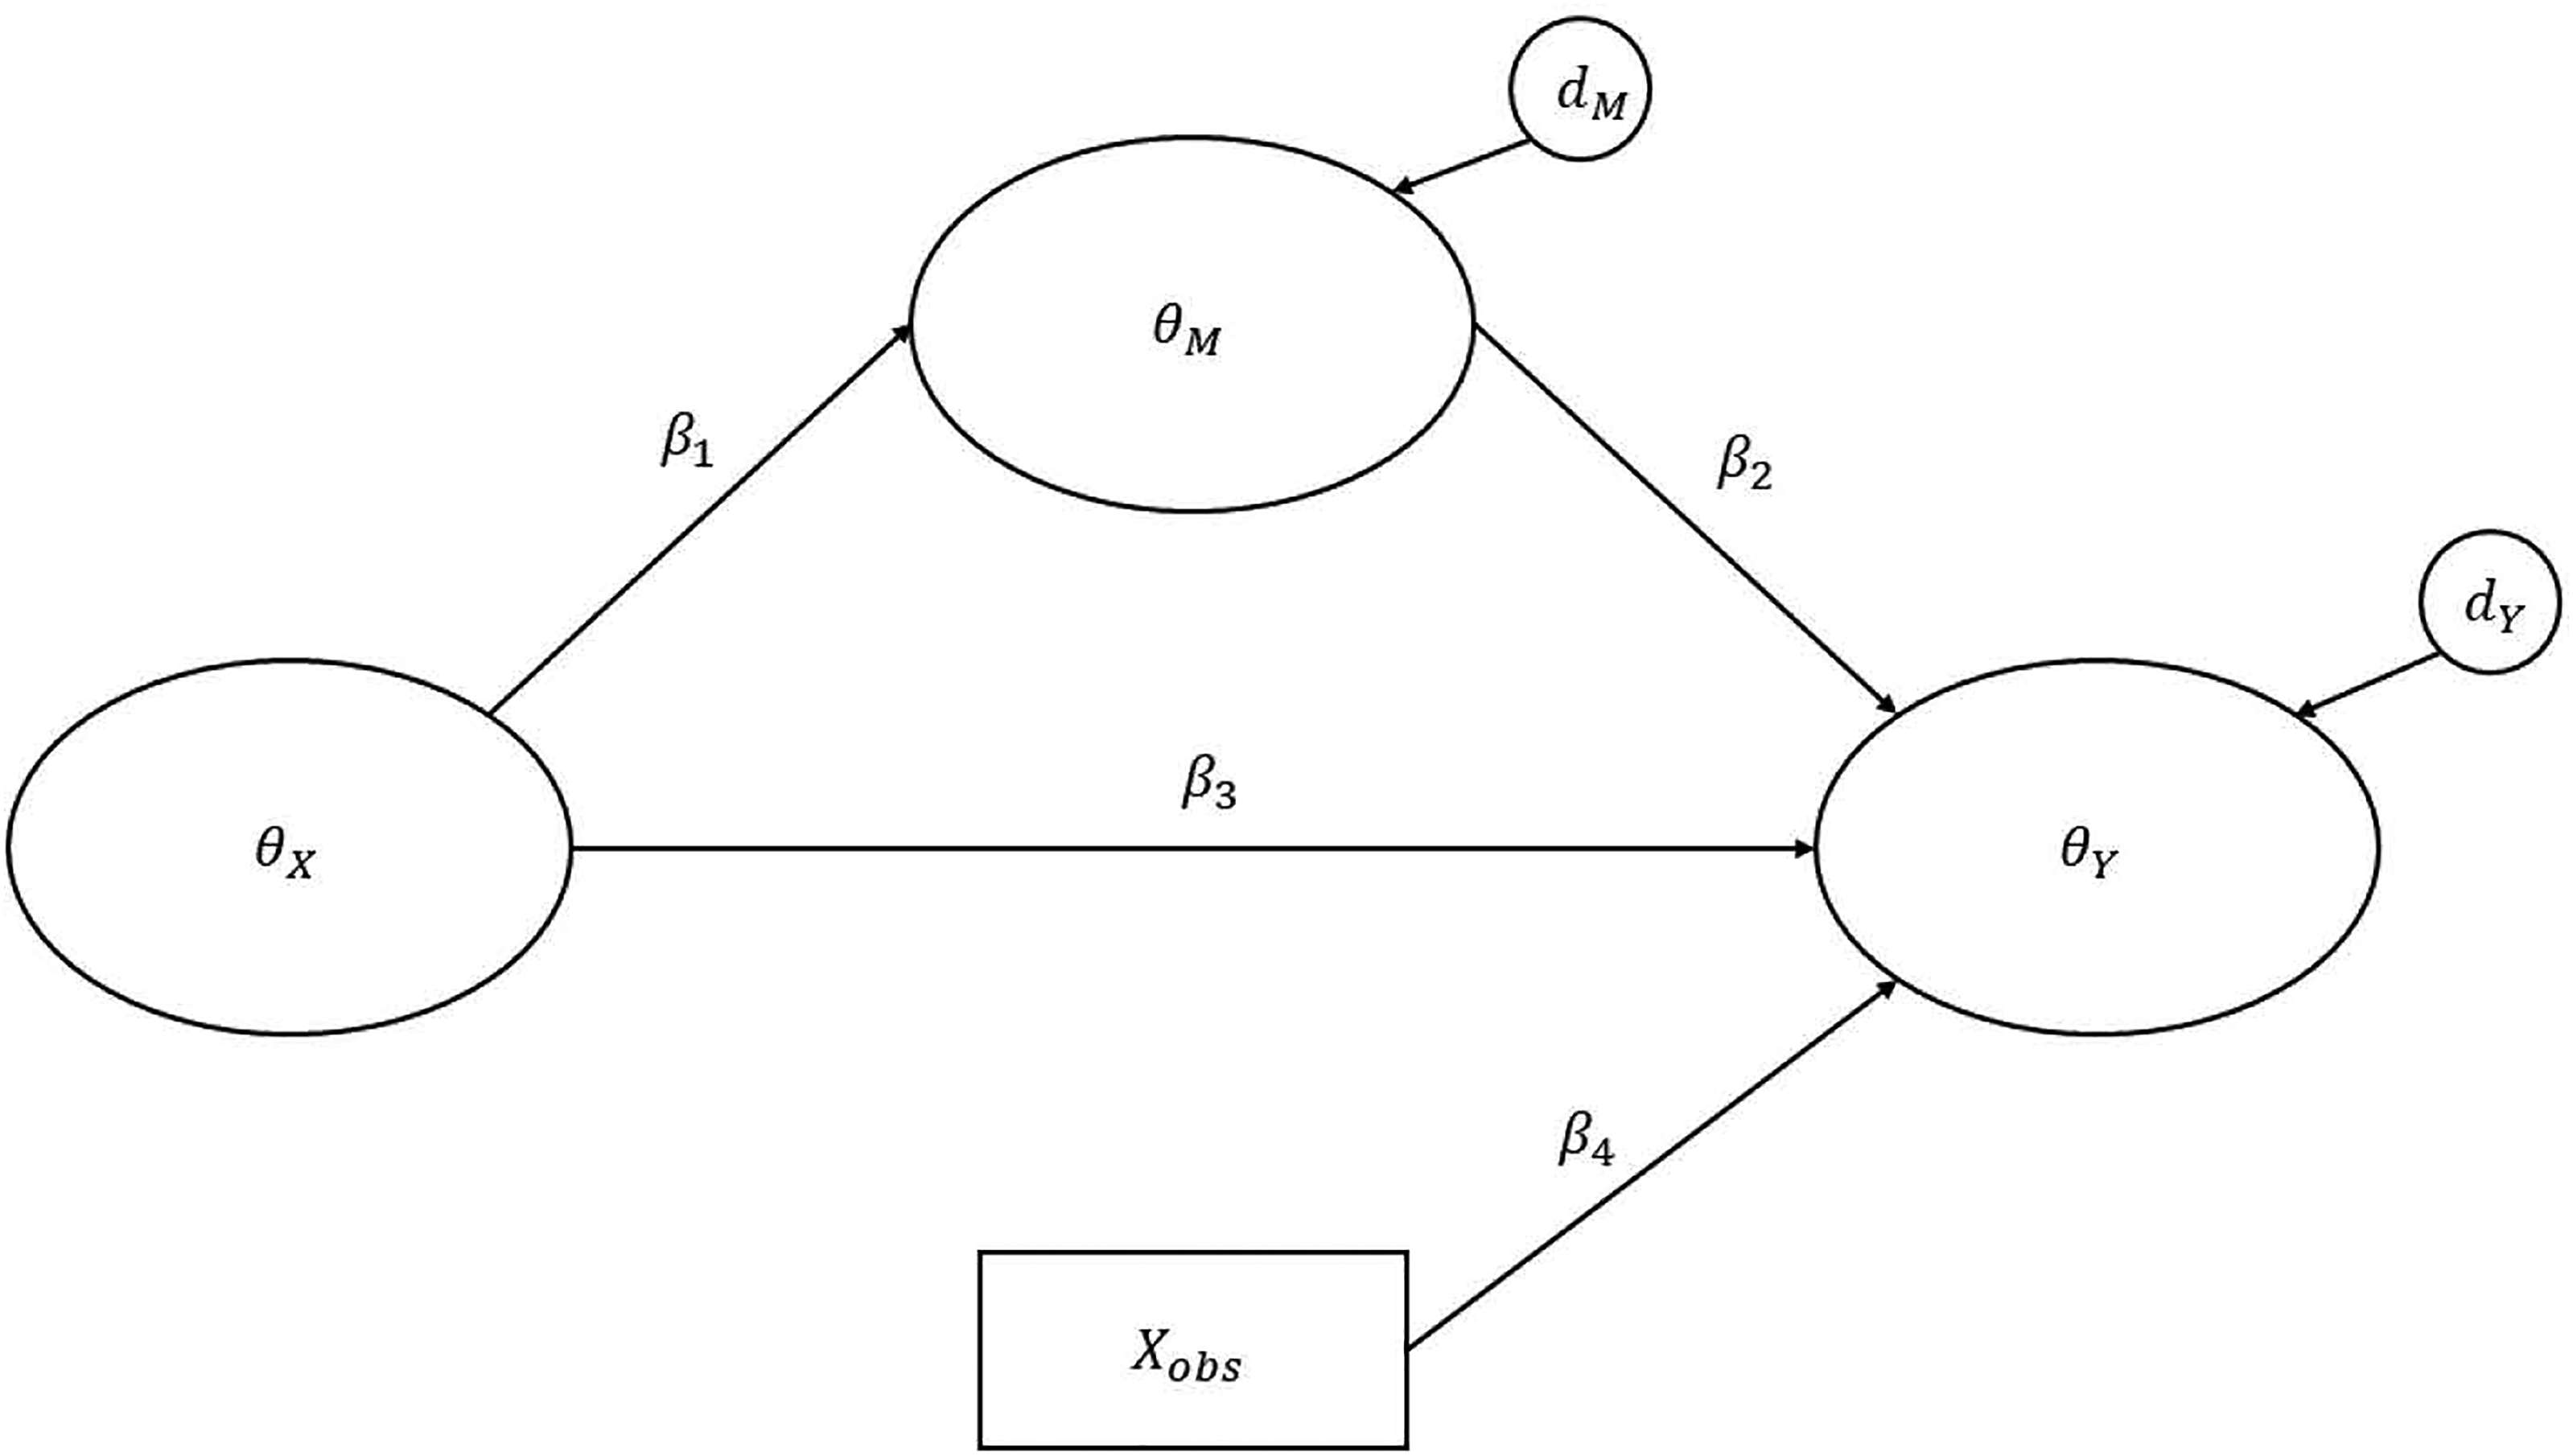
A graphical representation of the structural equation model used in Study 3. Note. The measurement models are omitted from this figure for brevity; only the structural part of the model is shown. Ovals represent latent variables, and rectangles represent observed variables. xobs represents an observed covariate (e.g., years of work experience) that is controlled in the model. Three different models (Models 3a–3c) with varying specifications of the latent variables, as listed in Table 9, were simulated. In Model 3a,
Response Mechanism Measurement Model of the Structural Equation Model in Figure 3 (Study 3).
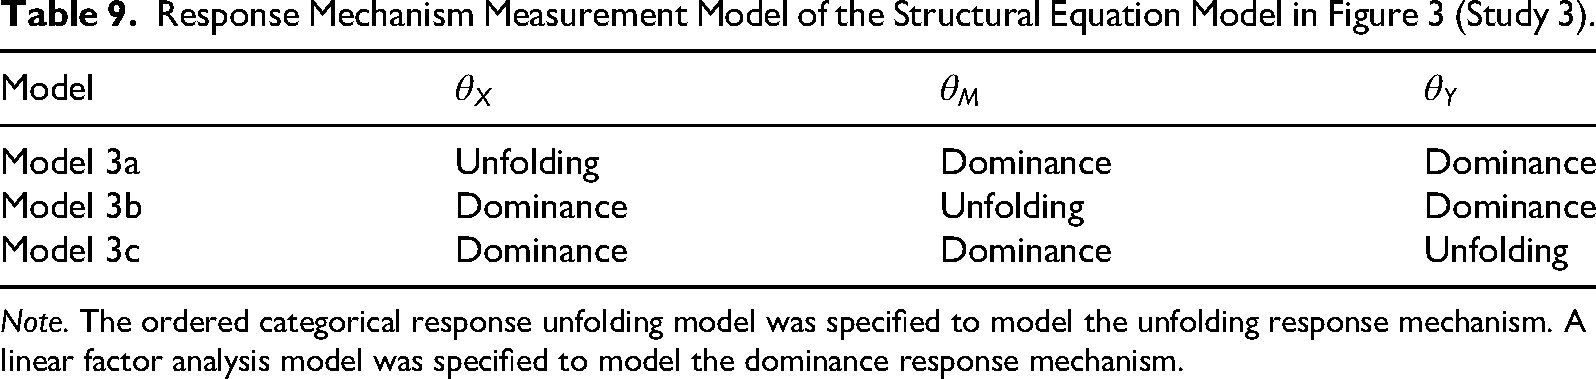
Note. The ordered categorical response unfolding model was specified to model the unfolding response mechanism. A linear factor analysis model was specified to model the dominance response mechanism.
Mean Absolute Bias for Structural Coefficients of the Models in Study 3.
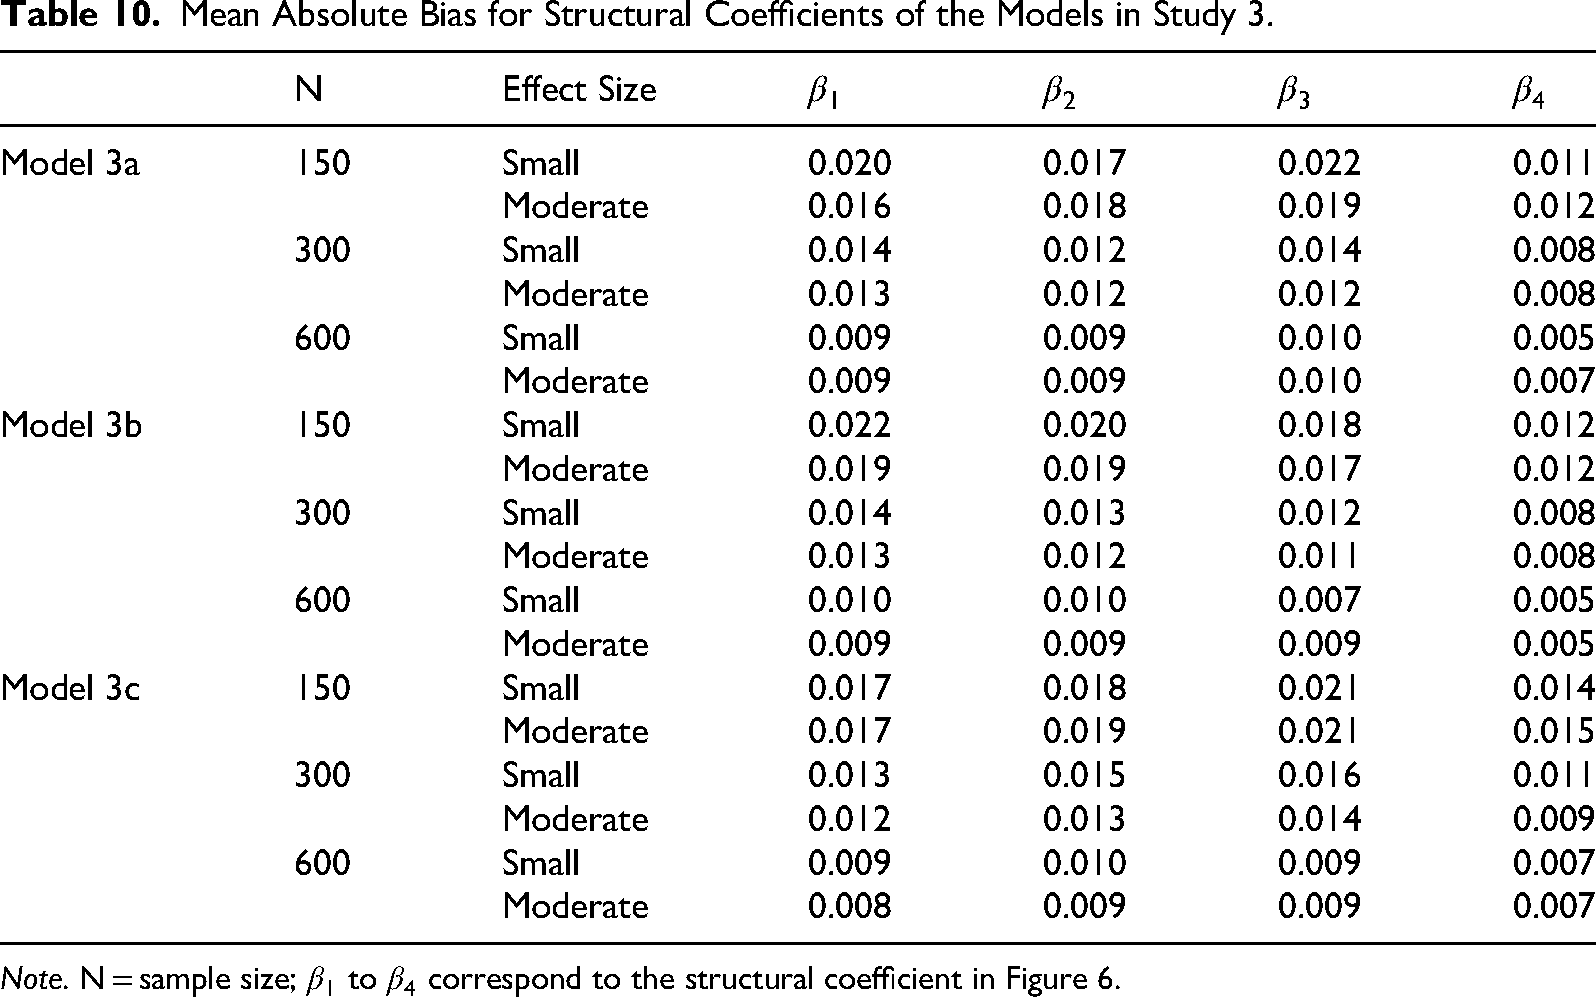
Note. N = sample size;
We considered three variations of the measurement model (see Table 9). In Model 3a,
Similar to Study 2, the observed unfolding response data were simulated in two steps:
Latent continuous responses ( The latent continuous responses were then transformed into 6-category ordered responses using the same threshold values as in Study 2. Five indicators (items) were generated following these steps.
Conversely, the observed dominance response data were simulated in two analogous steps:
Latent continuous responses The latent continuous responses were then transformed into 6-category ordered responses using the following threshold values: [−1.60, −0.83, 0.00, 0.83, and 1.60].
Results
All 200 replications were successful in every condition, and no estimation or convergence errors were encountered.
Bias in Parameter Estimation
Parameter bias in the standardized structural path coefficients (β) was minimal. The maximum mean absolute bias (MAB) across the 18 conditions was 0.022, with bias decreasing as sample size increased (Table 10). The mean parameter bias of the factor loadings (λ) for the linear factor models was also negligible, ranging from −0.004 to 0.005 across model types, sample size levels, and structural path effect size conditions.
The pattern of mean parameter bias for item locations (
Statistical Power
As expected, structural paths with smaller effect sizes had lower statistical power than those with larger effect sizes at a fixed sample size, and power increased as sample size increased (Table 11). In the smaller effect size conditions, the statistical power for structural coefficients involving latent variables measured with an unfolding response mechanism (i.e.,
Statistical Power of Structural Parameters in the Mediation Model (Study 3).
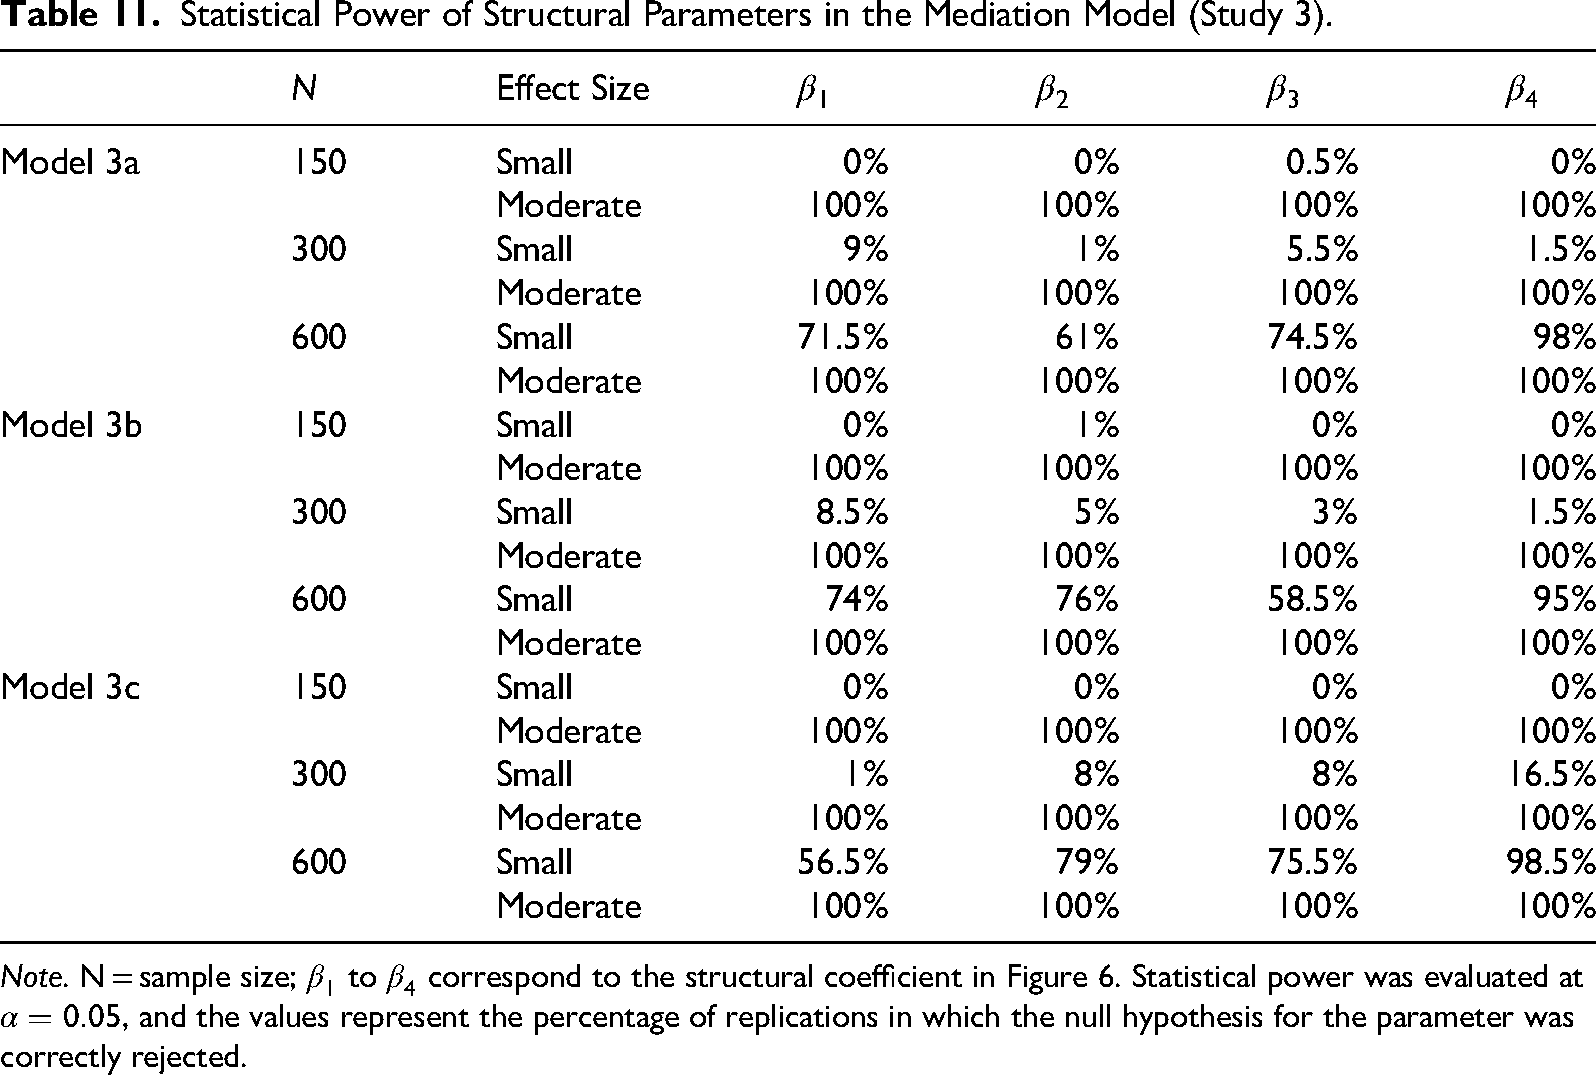
Note. N = sample size;
Summary of Study 3
Study 3 examined the incorporation of the OCRUM into a structural equation model as a measurement model. All Monte Carlo replications were successfully fitted without convergence problems. Structural path parameters were recovered with minimal bias. Sample size and effect size had a joint effect on statistical power, such that smaller sample sizes paired with smaller effect sizes yielded lower power.
Furthermore, in the smaller effect size conditions, structural path coefficients associated with OCRUM based latent variables showed higher statistical power than other structural paths, regardless of whether the OCRUM based latent variable was exogenous or endogenous. Inspection of several randomly selected replications of Model 3a suggested that this may be due to the choice of population parameters in the simulation design, which resulted in slightly higher empirical reliability for the OCRUM latent factor (
We also investigated the effect of measurement model misspecification on the estimation of structural path parameters. Specifically, we deliberately misspecified the OCRUM measurement model (in Models 3a, 3b, and 3c) as a conventional linear factor model and fitted this misspecified model to the same datasets. Results suggested that measurement model misspecification led to higher parameter bias compared with conditions in which the measurement models were correctly specified (see Appendix B for details).
Overall, Study 3 demonstrates the potential and practicality of integrating the OCRUM into the SEM framework and expands modeling possibilities when latent constructs follow dominance, unfolding, or mixed response mechanisms. The negative impact of measurement model misspecification on structural path estimates underscores the importance of considering the underlying response process and choosing an appropriate measurement model in statistical analyses.
Discussion
Dominance and unfolding response processes describe two ways in which individuals may respond to rating-scale items. The dominance response process is commonly represented by a linear common factor model and is widely used as a measurement model in SEM. Measurement models proposed for the unfolding response process, however, often require specialized software that is not compatible with SEM, which has limited their use in organizational research (Foster et al., 2017).
This study proposed the OCRUM as an alternative approach for modeling unfolding response mechanisms. The OCRUM can be incorporated into the SEM framework in a relatively straightforward manner and readily implemented in existing SEM software. Our approach is conceptually simple and straightforward to apply and extend. We evaluated the performance of the OCRUM using two empirical datasets and two simulation studies. Analyses of the empirical datasets (Study 1) illustrated the application of the OCRUM and demonstrated that it performed comparably to the GGUM in determining the ordering of item locations (δ) and person locations (θ) on the latent continuum. The simulation in Study 2 examined the effects of sample size, test length, item-location range, and response options on parameter recovery and model–data fit. We found that item and person locations in the unidimensional OCRUM could be estimated from polytomous response data on tests with 5–10 items with minimal bias at a sample size of 300. Further increasing the sample size to 600 yielded only modest additional reductions in bias. As in prior work, items located at the extreme ends of the continuum tended to have larger bias, and parameters estimated from dichotomous data tended to exhibit more bias than those estimated from polytomous data. Study 3 demonstrated that relationships among constructs that generate unfolding and dominance responses can be modeled simultaneously within a single SEM framework using the OCRUM.
What is the Nature of the Construct That Makes a Dominance vs. Unfolding Model Appropriate?
When considering whether to apply dominance models or unfolding (ideal-point) models, it is important to attend to the nature of the assessment context. Measures designed to capture maximum performance (e.g., many cognitive ability tests) typically present items that vary in difficulty, and individuals are motivated to answer as many items correctly as they can. In such contexts, higher levels of the latent trait are associated with a monotonically increasing probability of a correct or endorsed response, which aligns well with dominance response models (Coombs, 1964; Drasgow et al., 2010). In contrast, measures of typical behavior (e.g., many personality or vocational interest inventories) ask respondents to indicate how well statements describe them. Here, responses are often best conceptualized as reflecting positions along a continuum, with individuals most likely to endorse items located near their own standing on the trait, which is consistent with unfolding response models (Coombs, 1964; Roberts et al., 2000; Tay & Ng, 2018; Thurstone,1928).
The choice between dominance and unfolding models may also depend on the polarity of the construct. Unfolding models may be particularly suitable for bipolar constructs with two opposing ends (e.g., satisfaction vs. dissatisfaction). Previous studies have shown that applying conventional dominance-based linear factor models to such constructs can yield spurious extra factors rather than a single bipolar continuum (Davison, 1977; Tay & Drasgow, 2012; van Schuur & Kiers, 1994). Moreover, as demonstrated in additional analyses (Appendix B), misspecifying the measurement model can introduce parameter bias.
The testing context may also influence the response-generation process. For example, the pressure of high-stakes testing can shift respondents toward a performance-oriented mindset, potentially attenuating ideal-point responding and producing more dominance-like response patterns (O’Brien & LaHuis, 2011). Likewise, participants who carefully follow assessment directions may respond differently from those who engage in impression management. In such cases, it is useful to evaluate the data empirically using a model-comparison approach—for example, fitting both a dominance model (e.g., a linear factor model) and an unfolding model (e.g., a quadratic factor model) and comparing their fit, or even considering models that allow mixtures of response mechanisms. Our simulations indicate that information criteria such as AIC and sample-size adjusted BIC (sBIC) can correctly identify the data-generating model under a wide range of conditions (i.e., sample size, test length, response options, and item-location range).
Discussing item and scale construction under unfolding (ideal-point) assumptions is beyond the scope of this article. Interested readers are referred to Chernyshenko et al. (2007), Cao et al. (2015), and DeNunzio et al. (2024), which provide guidance on ideal-point item writing and scale development for constructs such as personality and engagement. 7
To date, research on modeling unfolding responses has largely focused on model development and scoring. Much less attention has been given to examining relationships among constructs that follow a single-peaked response process. Yet, assessing relationships among latent constructs (e.g., mediation, moderation) plays a key role in many organizational and psychological investigations, particularly when structural models are estimated. SEM has become one of the most widely used analytical techniques in organizational research because it allows researchers to test complex theoretical models involving multiple latent constructs and their interrelationships (Williams, 2003; Zyphur et al., 2023). Mediation and moderation analyses with latent variables are central tools for understanding the mechanisms and boundary conditions through which organizational phenomena operate, and they are essential for theory testing and development in the organizational sciences (Cortina et al., 2020; Edwards & Lambert, 2007). Our study addresses this gap by introducing the OCRUM approach, which can be used to model unfolding responses and to test, estimate, and evaluate constructs that follow both unfolding and dominance response mechanisms within the same model. Because the method is implemented within an existing SEM framework—a mainstream multivariate method familiar to many researchers in the behavioral and social sciences—it opens new modeling opportunities for unfolding data (e.g., longitudinal analysis, multilevel analysis, tests of moderation/mediation, detection of unobserved heterogeneity).
Limitations and Future Directions
In addition to evidence that the OCRUM may not perform well with small samples and very short, dichotomously scored tests, another limitation concerns the estimation method used for person locations (θ), which assumes a normal distribution. This assumption may not always hold at the population level. Future studies should examine the impact of violations of the normality assumption on the estimation of θ.
Similar to commonly used confirmatory factor analysis, the OCRUM requires users to decide the number of factors a priori. Researchers can, however, adopt a model comparison approach by specifying alternative numbers of underlying factors and selecting the best fitting model using information criteria (e.g., AIC and sBIC). Extending the OCRUM to incorporate multiple latent factors underlying unfolding responses is conceptually straightforward within the SEM framework, but it raises computational challenges. Estimating the OCRUM in Mplus involves numerical integration, and the computational burden increases roughly linearly with the number of observations and exponentially with the number of dimensions of integration (i.e., the number of latent variables or latent-variable interactions that require integration; Muthén & Muthén, 1998–2017). In our applications, models with a single latent factor (Studies 1 and 2) were estimated quickly (e.g., datasets with N = 600, J = 10, and polytomous responses took less than 10 s), whereas the three-factor model in Study 3 required noticeably longer run times (e.g., N = 600 and J = 10 required several minutes to estimate on a standard desktop computer). Future research should further evaluate and optimize computational approaches for fitting OCRUM-based models, particularly in higher-dimensional applications.
A design feature of our simulation study was the use of evenly spaced item locations. This represents an idealized situation in which a scale comprises items that are evenly spaced along the latent continuum. We acknowledge that, in practice, items are unlikely to be perfectly evenly spaced. We did not examine conditions with unevenly spaced items in this simulation. Future investigations should explore how uneven spacing affects the recovery of item locations and person locations. Finally, future work should investigate cases in which scales and items are multidimensional, rather than unidimensional or characterized by independent clusters of item parameters. We hope that this study will motivate further analyses and applications involving unfolding response mechanisms within SEM.
Footnotes
Author Contributions
Ringo Moon-ho Ho: conceptualization and writing—original draft and editing. Jie Xin Lim: software and writing—review and editing. Olexander Chernyshenko: writing—review and editing.
Funding
The authors received no financial support for the research, authorship, and/or publication of this article.
Declaration of Conflicting Interests
The authors declared no potential conflicts of interest with respect to the research, authorship, and/or publication of this article.