
Abstract
In graded paired comparisons (GPCs), two items are compared using a multipoint rating scale. GPCs are expected to reduce faking compared with Likert-type scales and to produce more reliable, less ipsative trait scores than traditional binary forced-choice formats. To investigate the statistical properties of GPCs, we simulated 960 conditions in which we varied six independent factors and additionally implemented conditions with algorithmically optimized item combinations. Using Thurstonian IRT models, good reliabilities and low ipsativity of trait score estimates were achieved for questionnaires with 50% unequally keyed item pairs or equally keyed item pairs with an optimized combination of loadings. However, in conditions with 20% unequally keyed item pairs and equally keyed conditions without optimization, reliabilities were lower with evidence of ipsativity. Overall, more response categories led to higher reliabilities and nearly fully normative trait scores. In an empirical example, we demonstrate the identified mechanisms under both honest and faking conditions and study the effects of social desirability matching on reliability. In sum, our studies inform about the psychometric properties of GPCs under different conditions and make specific recommendations for improving these properties.
Personality questionnaires are a valid instrument for personnel selection (Barrick et al., 2001; Berry et al., 2012; Chiaburu et al., 2011; Sackett et al., 2022). They can be an especially useful tool for predicting motivational aspects of work such as counterproductive work behavior and organizational citizenship behavior (Gonzalez-Mulé et al., 2014). However, personality questionnaires are relatively easy to distort (Viswesvaran & Ones, 1999). Furthermore, respondents in high-stakes situations such as personnel selection are motivated to artificially increase their scores on the constructs in question to appear more favorable (e.g., Birkeland et al., 2006; Hu & Connelly, 2021), a process that can be referred to as faking or socially desirable responding (SDR; Tracey, 2016). Given that the tendency to distort answers varies across individuals so that their rank order also varies (König et al., 2012; Rosse et al., 1998; Zickar et al., 2004), we can never know for sure, whether our selection decision was appropriate.
Traditional binary forced-choice (binary FC) questionnaires are an attempt to limit SDR by design. Here, respondents have to choose between items that are equally (or at least similarly) desirable (Hontangas et al., 2015; Travers, 1951; Wetzel et al., 2016). This has been shown to reduce SDR compared to rating scales (Cao & Drasgow, 2019; Speer et al., 2023). However, binary FC scales generally produce scores with low reliabilities compared to their Likert counterparts with identical statements (Brown & Maydeu-Olivares, 2018; Zhang et al., 2020). Furthermore, this is even true when the former are analyzed with advanced methods such as Thurstonian item response theory (TIRT; Brown & Maydeu-Olivares, 2011).
Graded paired comparisons (GPCs) are an attempt to simultaneously limit SDR and increase the reliability of the resulting scores. In GPCs, two items are directly compared with one another using a verbally anchored, graded rating scale that is placed between them. Respondents have to indicate which item describes them better (Brown & Maydeu-Olivares, 2018), so that they have to make a comparative judgment (Thurstone, 1927). Fully endorsing one item also means withdrawing endorsement of the other item (Brown & Maydeu-Olivares, 2018). Just as in binary FC scales, if the items in a comparison are equally desirable to respondents, the influence of SDR cancels out (Cao & Drasgow, 2019). Furthermore, the rating scale element in GPCs should increase the amount of quantitative information within a comparison in contrast to binary FC scales (Brown & Maydeu-Olivares, 2018; Bürkner, 2022). In this respect, GPCs are a promising alternative to binary FC formats because the graded preference rating should contain more information on trait standing and therefore result in higher reliabilities. However, prior research suggests that trait scores can remain (partially) ipsative even within GPCs (Schulte et al., 2021), that is, scores are dependent within individuals so that comparisons between individuals are invalid (Clemans, 1966; Hicks, 1970). It is not yet clear under which conditions ipsativity is particularly high or low.
To inform researchers and practitioners about the ability of GPCs to measure latent personality traits and provide guidance for questionnaire construction, we conducted an extensive simulation study, in which we varied the number of response categories between items, the absolute value and sign of factor loadings, the strength of intertrait correlations, the number of respondents in a sample, and the number of traits in a questionnaire. On this basis, the advantages of GPCs over binary FC formats will be quantified. Furthermore, we investigated questionnaire properties that can improve the reliability and normativity of FC formats. As a method that has the potential to substantially improve the psychometric properties of FC scales, we examined the optimized matching of items in pairs based on their factor loadings. In an empirical example, we then demonstrated the identified mechanisms and also studied the effects of social desirability matching on reliability.
Origins of GPCs
Currently, the most common response format for personality questionnaires are Likert-type rating scales. In Likert-type items, participants indicate their agreement or disagreement on verbally anchored, multipoint rating scales, from I strongly disagree to I strongly agree (Likert et al., 1934). While Likert-type scales are relatively easy to construct and often achieve good reliabilities, it is not possible to prevent respondents from endorsing all attractive items (Paulhus & Vazire, 2007; Viswesvaran & Ones, 1999). If respondents chose to do so, they could present themselves, for example, as the most extraverted, conscientious, and emotionally stable person, independent of what was true (see, e.g., Schmit & Ryan, 1993, for an example where the factor structure of a personality instrument changed as a consequence of SDR).
In line with evidence for SDR in other selection procedures, such as interviews (Melchers et al., 2020) or situational judgment tests (Hooper et al., 2006), meta-analytic evidence suggests that respondents in personnel selection contexts (i.e., in high-stakes situations), do in fact report higher trait scores than they do in low-stakes scenarios (Hu & Connelly, 2021). This effect is especially pronounced in personality traits that are viewed as job relevant (Birkeland et al., 2006). Likert-type scales therefore cannot effectively limit SDR (Paulhus & Vazire, 2007; Tracey, 2016; Viswesvaran & Ones, 1999; Wetzel et al., 2016). Because the tendency for SDR varies across individuals (König et al., 2012; Rosse et al., 1998; Zickar et al., 2004), between-person comparisons based on Likert-type scales in high-stakes diagnostic decisions can be invalid because of changes in respondents rank order (Birkeland et al., 2006; Holden, 2007; Paunonen & LeBel, 2012).
One possible approach to prevent these issues evoked by SDR is to use response formats other than Likert-type scales, for example, FC-type questionnaires. In binary FC scales, respondents compare multiple items with each other, either by picking the item that describes them best (and/or worst) or by ranking all presented items in order of preference (Hontangas et al., 2015; Travers, 1951; Wetzel et al., 2016). Irrespective of the specific questionnaire design, all of the possible answer patterns can be expressed by a set of binary decisions, hence the name binary FC. If all items in one comparison are equally desirable, the influence of social desirability will cancel out and reduce SDR compared to Likert-type scales, even in high-stakes situations such as personnel selection (Cao & Drasgow, 2019; Speer et al., 2023). Additionally, by design, binary FC scales prevent response styles associated with rating scales such as the tendency toward middle categories (Jackson et al., 2000; Wetzel et al., 2016).
However, binary FC scales also come with problems that are inherent to their design. First, forcing a choice between multiple statements that are possibly perceived as equally descriptive can lead to more negative test takers’ perceptions of the questionnaire in applied contexts such as personnel selection (Borman et al., 2024; Brown & Maydeu-Olivares, 2018; Cox, 1980; Dalal et al., 2021; Zhang et al., 2024a). This, in turn, could have a negative effect on perceived fairness and may thus prevent organizations from using these questionnaires, for example, in recruiting (for further details on this mechanism, see Harold et al., 2016). Second, scores derived from binary choices generally contain less information than their Likert-type counterparts (e.g., Schulte et al., 2024) and therefore have lower reliabilities than rating scales (Brown & Maydeu-Olivares, 2018; Zhang et al., 2020). For example, when comparing A and B with a binary choice, one can either prefer A over B or B over A, resulting in one ordinal piece of information: either A > B or B > A. In contrast, when using a 5-point Likert-type scale, one can pick one of five response options that indicate the relative degree of preference of one option over the other: Not only will a response result in the ordinal information whether A or B is preferred, but (if respondents actually understand the scale in this way) it will also result in interval scaled information on how much—if at all—one option is preferred over the other (for more details on the scaling of Likert-type items, see Joshi et al., 2015).
GPCs are an attempt to preserve the advantages of the forced nature of FC questionnaires while also increasing the amount of quantitative information on the relative preference between the given options (Brown & Maydeu-Olivares, 2018). In GPCs, two items are compared with one another on a verbally anchored multipoint rating scale. The response categories typically range from much more [A than B] to much more [B than A], sometimes having a midpoint about the same and any number of additional categories in between (Brown & Maydeu-Olivares, 2018). Figure 1 shows an example GPC with five response categories.

Example of a graded paired comparison.
The currently available research on GPCs has focused on three aspects: applicant reactions, comparisons with Likert-type scales, and comparisons with binary FC scales. Concerning the first of these three aspects, graded response designs have been shown to elicit more positive reactions than binary FC scales in selection and assessment contexts (Dalal et al., 2021), likely owing to the greater bandwidth of possible answers. Respondents felt they were better able to show relevant qualifications and deemed the graded response format to be more appropriate (Dalal et al., 2021). These results are mirrored in a meta-analytic comparison of Likert-type scales and FC scales with the same number of response categories (Zhang et al., 2024a): binary FC scales and GPCs with four answer categories produced slightly less positive affect than their Likert counterparts. However, there was no such difference between GPCs and Likert-type scales with five response categories (Zhang et al., 2024a).
Second, as for comparisons between graded designs with Likert-type scales, empirical studies suggest that good reliabilities can be achieved for the former (Brown, 2016b; Schulte et al., 2024). Reliabilities of the Likert-type scales were only slightly better than of the graded designs in within-group low-stakes comparisons (Brown, 2016b; Brown & Maydeu-Olivares, 2018). For a recent lab-based between-group comparison that used a simulated selection context, good to high reliabilities were achieved for GPCs across conditions (Schulte et al., 2024).
Studies comparing graded response designs and binary FC scales suggest that the former can achieve higher reliabilities than the latter (Brown & Maydeu-Olivares, 2018; Bürkner, 2022). Specifically, Bürkner (2022) mathematically derived upper bounds regarding which reliabilities can be achieved with GPCs and binary FC scales, respectively. These upper bounds suggest that GPCs can achieve higher reliabilities. However, the degree to which these upper bounds can be achieved under more realistic conditions remains unclear. Furthermore, Brown and Maydeu-Olivares (2018) allow for a first comparison of GPCs and binary FC scales using empirical data. However, they only collected graded preference data and imitated forced-choice decisions by collapsing the first three and last two graded preference categories. Thus, they were able to obtain the first estimates of the difference in empirical reliabilities of graded preference data and binary FC decisions. They found a loss of reliabilities for binary data ranging from .07 to .10.
Taken together, the lack of comprehensive studies comparing GPCs and binary FC scales suggests that we have yet to gather knowledge on the mechanisms governing GPCs.
Scoring Procedure and Estimation Model for GPCs
The scoring methods for GPCs are generalizations of the respective models for binary FC methods. While there are simple scoring methods available (e.g., creating a sort of sum score for each of the different traits), these methods produce trait scores that can be (partially) ipsative. Consequently, differences in trait scores can only be validly interpreted within one person. In contrast, interindividual comparisons must not be made because they require normative (i.e., absolute) trait scores, while ipsative scores provide only relative information on trait scores (Brown & Maydeu-Olivares, 2011, 2013, 2018; Bürkner, 2022; Clemans, 1966; Frick et al., 2023).
The TIRT model (Brown & Maydeu-Olivares, 2011) has been proposed to solve these problems. It is based on the Law of Comparative Judgement (Thurstone, 1927), which relates item choices to latent traits (Brown & Maydeu-Olivares, 2011). According to the Law of Comparative Judgement, every item has a utility that can be interpreted as the desirableness or psychological value assigned to a specific item by a particular person (Brown & Maydeu-Olivares, 2011). In TIRT, the utility


In accordance with Bürkner (2022), the following model specifications are assumed: the intercepts

As it is described in Equation (3), the TIRT model does not only cover GPCs but can also describe comparative judgments with a binary response (
Influences on Parameter Estimation
Along with the scoring method, there are multiple factors that have been shown to influence scale reliability as well as the normativity of trait estimates for GPCs. While there is limited literature on GPCs themselves, it is likely that factors influencing the reliability and normativity of binary FC scales will also influence GPCs in similar ways. This is due to the fact that GPCs and binary FC scales share a common framework: When GPCs have two response categories and binary FC scales are paired in sets of two (i.e., when they have a so-called block size of two), both formats are equivalent. In the following sections, we will therefore discuss findings that were gathered in two prior simulation studies on GPCs (either using TIRT, Brown, 2016b; or a scoring mechanism based on an ideal-point model, Zhang et al., 2024b), but also in simulation studies of FC formats in general (Brown & Maydeu-Olivares, 2011; Bürkner et al., 2019; Frick et al., 2023; Schulte et al., 2021; Sun et al., 2024). Furthermore, we will consider three empirical studies on GPCs (Brown & Maydeu-Olivares, 2018; Schulte et al., 2024; Zhang et al., 2024a) as well as a study on the information that is theoretically obtainable from GPCs (Bürkner, 2022). On the basis of this, we will derive a set of hypotheses and research questions that will be tested subsequently. All following hypotheses were preregistered (https://osf.io/pszby/), with research questions 1 inserted after preregistration.
Number of Response Categories
The most important difference between GPCs and binary FC scales is the number of response categories in a comparison of two items: In GPCs, there can be more than two. It is therefore pivotal for research on GPCs to examine the influence of the number of response categories in GPCs on reliability and normativity.
Mathematically, a higher number of response categories means greater differentiation of answers and therefore, a higher amount of information (Bürkner, 2022). A first empirical examination of the number of response categories further supports this claim, showing that five response categories achieve smaller standard errors for person score estimates than two or four categories (Zhang et al., 2024a). Furthermore, first findings comparing two and five response categories using an ideal-point model (i.e., a model that assumes a different response mechanism than TIRT) also suggest that five response categories lead to higher reliabilities (Zhang et al., 2024b). We thus derive the following hypothesis:
Hypothesis 1. The reliability and normativity of the estimated trait scores increase with the number of response categories.
Loading Differences and Keying of Items
In order to obtain normative trait scores, TIRT uses a mechanism called “differential weighting of responses” (Brown, 2016a; Bürkner, 2022). This allows the within-person score means to vary across individuals, which makes comparisons between individuals possible—as long as the weighting itself is valid (Bürkner, 2022). To achieve sufficiently differential weights, the differences between item factor loadings within a comparison have to be sufficiently large (Brown, 2016a; Bürkner, 2022) because the loading differences contain information on the absolute (as opposed to relative) trait scores (Brown, 2016a).
In terms of factor loading differences, we have to differentiate two types of item pairs: equally keyed and unequally keyed pairs. In the former, both items have the same loading signs (i.e., both have positive or both have negative factor loadings). In contrast to this, the latter item pairs include items that have different loading signs (i.e., one item describes a high and the other describes a low trait level; thus—given that high trait levels are socially desirable—items with positive loadings describe the desired and items with negative loadings describe the undesired end of their respective scale; Bürkner et al., 2019). One approach to create large loading differences in both types of items is to mathematically optimize the matching of existing items according to their factor loadings. Prior research that included factor loading differences as an independent variable suggests that better reliabilities can be achieved with larger loading differences of items presented within a GPC (Bürkner, 2022) or a binary FC item (Sun et al., 2024). However, we cannot yet quantify the degree to which merely optimizing the matching of existing factor loadings will influence parameter estimation in GPCs. Therefore, we ask the following question:
Research Question 1: Can the reliability and normativity of the estimated trait scores be improved by maximizing factor loading differences within item pairs?
Large loading differences are inherent to designs including both equally and unequally keyed item pairs (mixed keyed designs), compared to designs that only include equally keyed item pairs: Having one positive and one negative factor loading creates strong loading differences without requiring further action. Results from prior studies on binary FC scales showed that equally keyed questionnaire designs have lower reliabilities than mixed keyed designs (Brown & Maydeu-Olivares, 2011; Schulte et al., 2021; Sun et al., 2024). Furthermore, evidence suggests that equally keyed designs result in less normative scores than mixed keyed designs (Frick et al., 2023; Schulte et al., 2021). In a study examining GPCs using an ideal-point approach, these results were mirrored (Zhang et al., 2024b). We therefore derive the following hypothesis:
Hypothesis 2. The reliability and normativity of the estimated trait scores will be lower for equally keyed as opposed to mixed keyed questionnaires.
Factor Loadings
In addition to the differences of factor loadings within pairs, high factor loading sums also provide valuable information for the estimation of trait scores because they help to estimate intraindividual trait score differences (Brown & Maydeu-Olivares, 2018). In previous research on binary FC scales, the effect of the absolute value of factor loadings was investigated and higher loadings were associated with higher reliabilities and lower root mean square errors (RMSEs) of the person parameters (Schulte et al., 2021). On the basis of the evidence gathered from binary FC scales, we therefore propose:
Hypothesis 3. The reliability and normativity of the estimated trait scores will be lower for lower factor loadings than for higher factor loadings of the items.
Number of Traits
In prior studies, a higher number of traits was associated with higher reliabilities in the binary FC format (Brown & Maydeu-Olivares, 2011; Schulte et al., 2021) and in GPCs (cf. Online Supplement D of Bürkner, 2022). Furthermore, evidence from the corresponding studies (Bürkner, 2022; Schulte et al., 2021) showed that the increase in reliability was not only owing to an increased scale length (cf. Revelle, 2009; Equation 7.14 for this effect). Instead, even when the number of items per trait was held constant, a higher number of traits still resulted in higher reliabilities (Bürkner, 2022; Schulte et al., 2021). The effect was particularly prominent for equally keyed questionnaires for both GPCs (Bürkner, 2022) and binary FC scales (Schulte et al., 2021).
A first study that investigated which reliabilities can be expected for a questionnaire with a fixed number of 90 GPCs and with a varying number of traits showed that a larger number of traits (and fewer items per trait) was in fact associated with slightly declining reliabilities (Bürkner, 2022). Importantly, while a higher number of traits was beneficial for reliability, at the same time the declining number of items per trait was so detrimental to the reliability that the overall reliability of the questionnaire declined slightly with an increasing number of traits. To our knowledge, this compensatory effect has not yet been investigated in relation to a varying number of response categories in a graded questionnaire design. We therefore propose the following research question:
Research Question 2: In what way are the reliability and normativity of the estimated trait scores influenced by the number of estimated traits in questionnaires of fixed length?
Intertrait Correlation
Previous studies also found that the correlations of the latent traits influenced trait estimation in the binary FC format but evidence regarding the direction of this influence is heterogeneous and results showed different patterns for equally and mixed keyed questionnaires. For equally keyed conditions, reliabilities were highest for mixed (i.e., positive and negative) intertrait correlations, smaller for uncorrelated traits, and yet again smaller for increasing only positive intertrait correlations (Bürkner et al., 2019; Frick et al., 2023; Schulte et al., 2021; Sun et al., 2024). In contrast, in mixed keyed conditions, the intertrait correlations did not seem to influence reliability in most studies (Bürkner et al., 2019; Frick et al., 2023; Sun et al., 2024). In one study, however, the same pattern of results emerged in mixed keyed conditions as it did in equally keyed conditions, albeit to a much smaller degree: Reliability estimates were higher for traits with correlations taken from the (mixed) NEO-PI-R (Ostendorf & Angleitner, 2004) compared with uncorrelated traits (Schulte et al., 2021). The same pattern of effects was also apparent for indicators of normativity (Bürkner et al., 2019; Schulte et al., 2021). In a first simulation study on GPCs, reliabilities were also higher for intertrait correlations taken from the NEO-PI-R (Ostendorf & Angleitner, 2004) compared with uncorrelated traits (Bürkner, 2022). However, in this simulation, the difference between the mixed and the positive correlation matrix was very small. Therefore, we propose the following hypothesis:
Hypothesis 4. The reliability and normativity of the estimated trait scores will be higher for intertrait correlations that are different from zero than for uncorrelated traits.
The Present Research: Simulation Study
As a first step to test our proposed hypotheses and research questions, we conducted an extensive simulation study that will be described in the following paragraphs. Following this, we will elaborate on an empirical example in which we tested our key findings from the simulation study using real-world data.
Method
Implementation in R
To conduct this simulation study, we used R Version 3.6.3 (R Core Team, 2020). For simulation of data and trait estimation, we used Version 0.12.1 of the thurstonianIRT package (Bürkner, 2021). Within the thurstonianIRT package, we chose Stan (Carpenter et al., 2017) as the underlying engine for model fitting. Stan fits Bayesian models using Markov chain Monte Carlo sampling (for more details see Carpenter et al., 2017). Although frequentist software implementations are available, they are known to regularly result in convergence issues (Bürkner et al., 2019). We ran Stan using one chain with 2500 sampling iterations, 1000 of which were used as warmup and disregarded. To obtain individual trait scores, thurstonianIRT uses expected a posteriori estimation (Bürkner et al., 2019). In the respective conditions (see below), we used the autoFC package (Version 0.1.2; Li et al., 2022) to optimize the matching of items (for details, see below). We used the high performance computing capacities of the state of Baden-Württemberg. To parallelize our computations, we used the R packages doParallel (Version 1.0.16; Microsoft Corporation & Weston, 2020) and foreach (Version 1.5.1; Folashade et al., 2020) for our simulations. The R code for the simulations, analysis, and documentation can be accessed via the Open Science Framework (https://osf.io/pjmvq/) along with any Online Supplements.
Conditions
In our simulations, we varied the following factors that will be explained in detail in the subsequent paragraphs: (1) the type of intertrait correlation, (2) the sample size
First, we varied the intertrait correlations. These were either simulated as independent traits or (as one of the objectives of this study was to draw conclusions for applied purposes) we used real-world correlations from the German version (Ostendorf & Angleitner, 2004) of the NEO-PI-R (Costa & McCrae, 1992). The correlation matrix included the following dimensions: Openness, Conscientiousness, Extraversion, Agreeableness, and Neuroticism. Due to the fact that each of these five factors comprises six facets, this correlation matrix has a size of
To keep the number of replications constant across all intertrait correlation conditions, we decided to use a multiple of six and chose 12 replications for all conditions (each of the six submatrices was used for two computational runs in each condition). We chose this relatively low number of replications compared to other simulation studies because estimating the models required an immense amount of computational resources, such as time (i.e., several hours to weeks per model), working memory capacity, and processing capacity. Additionally, previous research suggests that this number of replications is sufficient to achieve precise estimates of the target parameters (Schulte et al., 2021). However, we want to point out that the three sample size conditions (see below) triple the number of replications per questionnaire design. Similarly, within each replication, the aggregation over traits and persons further increased the precision of our estimates. We will report confidence intervals to quantify this precision. Nevertheless, we replicated selected conditions 600 times (see Online Supplement B) to support the claimed level of precision and found only small changes in the second or third decimal places of our dependent variables.
The second factor that varied between conditions was the sample size N. We included samples with
Third, we varied the absolute value of factor loadings of the items in two levels. First, loadings were drawn from a uniform distribution between .65 and .95. This was to ensure comparability to previous simulation studies (e.g., Brown & Maydeu-Olivares, 2011; Bürkner et al., 2019; Schulte et al., 2021; Sun et al., 2024) and to investigate the effects of particularly high factor loadings. Second, we included slightly smaller loadings to better represent real-world conditions. These loadings were drawn from a truncated normal distribution with M = .50 and SD = .16. These values correspond to the factor loadings of the norming sample of the German version of the NEO-PI-R (Costa & McCrae, 1992; German version: Ostendorf & Angleitner, 2004). The distribution was truncated at .10 and .90 to exclude extreme and therefore unlikely factor loadings.
The fourth factor was the number of simulated traits (
Fifth, we varied the number of graded response categories between items. Mathematically, more response categories provide a more accurate estimation. While there is no theoretical limit to this assumption, in reality, there is likely an upper limit defined by the ability of individuals to differentiate very fine-grained categories. For example, in Likert-type scales no more than nine or ten response categories seem to be advantageous (Cox, 1980; Preston & Colman, 2000). For this reason, one rather high number of response categories (nine) was chosen. That way, we wanted to identify the upper bound for the information that can be generated by GPCs in applied contexts. As more realistic conditions for commonly applied contexts, we also simulated three*, four*, and five response categories. To compare GPCs with the responses of binary FC questionnaires, two response categories were simulated as well. In all conditions, the inner thresholds were sampled from a uniform distribution between −2 and 2 and subsequently ordered to adhere to the requirements of TIRT models for graded responses.
Sixth, we varied the share of item pairs with unequal factor loadings that are included in the simulated questionnaires. For one, only positive factor loadings were used to create the equally keyed conditions. Secondly, some factor loadings were randomly reversed to negative to create the mixed keyed conditions. We implemented one condition in which half of the items randomly received a negative factor loading. This had the effect that both (a) item pairs with the same sign of factor loadings, either both positive or both negative and (b) item pairs with different signs were included in the questionnaires. Thirdly, we added a mixed keyed condition that included 20% unequally keyed item pairs*. This was done to test whether a smaller number of unequally keyed item pairs might also be sufficient to achieve good reliabilities as suggested by Lee et al. (2022).
Finally, we implemented an optimized matching condition*. Given that the mixed keyed conditions performed well even without optimal matching (for similar results, see Brown & Maydeu-Olivares, 2011; Schulte et al., 2021), we only optimized the matching for equally keyed questionnaires. We took item pairs initially generated by thurstonianIRT and used the Simulated Annealing (Kirkpatrick et al., 1983) algorithm of the autoFC package (Li et al., 2022) to optimize the matching. We defined two optimization criteria. First, factor loadings were to be optimized so that the differences within one pair would be maximized. Second, traits were to be optimized so that there always would be two different traits within one item pair. We ensured that the second criterion was always met by defining the cost function accordingly (i.e., by including a much larger penalty for violations of the trait matching than for factor loading differences).
We held the analysis method (TIRT, Brown & Maydeu-Olivares, 2018) as well as the total number of questionnaire-items constant. To maintain a test duration that does not exceed common limits for real-world purposes, we decided to fix the test length to 90 GPCs. Thus, in the main simulations, the simulated questionnaires comprised a total of
To demonstrate the effects of additional traits when the number of items per trait is fixed, we simulated selected conditions with 10 items per trait and varying questionnaire length*. For instance, a questionnaire measuring five traits would thus consist of 50 items (25 GPCs) and a questionnaire measuring 10 traits would consist of 100 items (50 GPCs). For this subset of simulations, we used intertrait correlations from the NEO-PI-R, sample sizes of
Measures of Parameter Recovery
In this study, we used three measures of parameter recovery: (1) the reliability of score estimates, (2) the intertrait correlation bias, and (3) the correlation of true and estimated person means. Furthermore, additional results on the RMSE of score estimates can be found in Online Supplement C.
Reliability is defined as the proportion of the true variation relative to the total variation and is estimated as the squared correlation between the true (

Finally, we calculated the correlation between true (

By definition, the sum (and consequently also the mean) of ipsative trait scores is fixed to a constant for all individuals and therefore it cannot correlate with the true person mean. Thus, high correlations of true and estimated person means show that the ipsativity constraint does not affect the underlying trait scores.
Primarily, we conducted graphical evaluations of the results. The numerical values of our results can be found in Online Supplement D. In order to better specify the uncertainty of the estimation of each of our indicators, we calculated 95%-confidence intervals across the different replications of each condition based on normality assumptions. As an example, we calculated the confidence interval of the reliability with the following equation:

Results
In the following, we will present the results for each of the three indicators (reliability, bias in intertrait correlations, and correlation of true and estimated person means) separately. Beforehand, however, we would like to mention that the variation in sample sizes did not affect our results in a meaningful way (see Figures 2 to 4). In some instances, the larger sample size produced results closer to the desired end of our indicators; however, the deviations in patterns were negligible. Therefore, we will not differentiate between the sample size conditions in the presentation of the results unless there are meaningful differences.
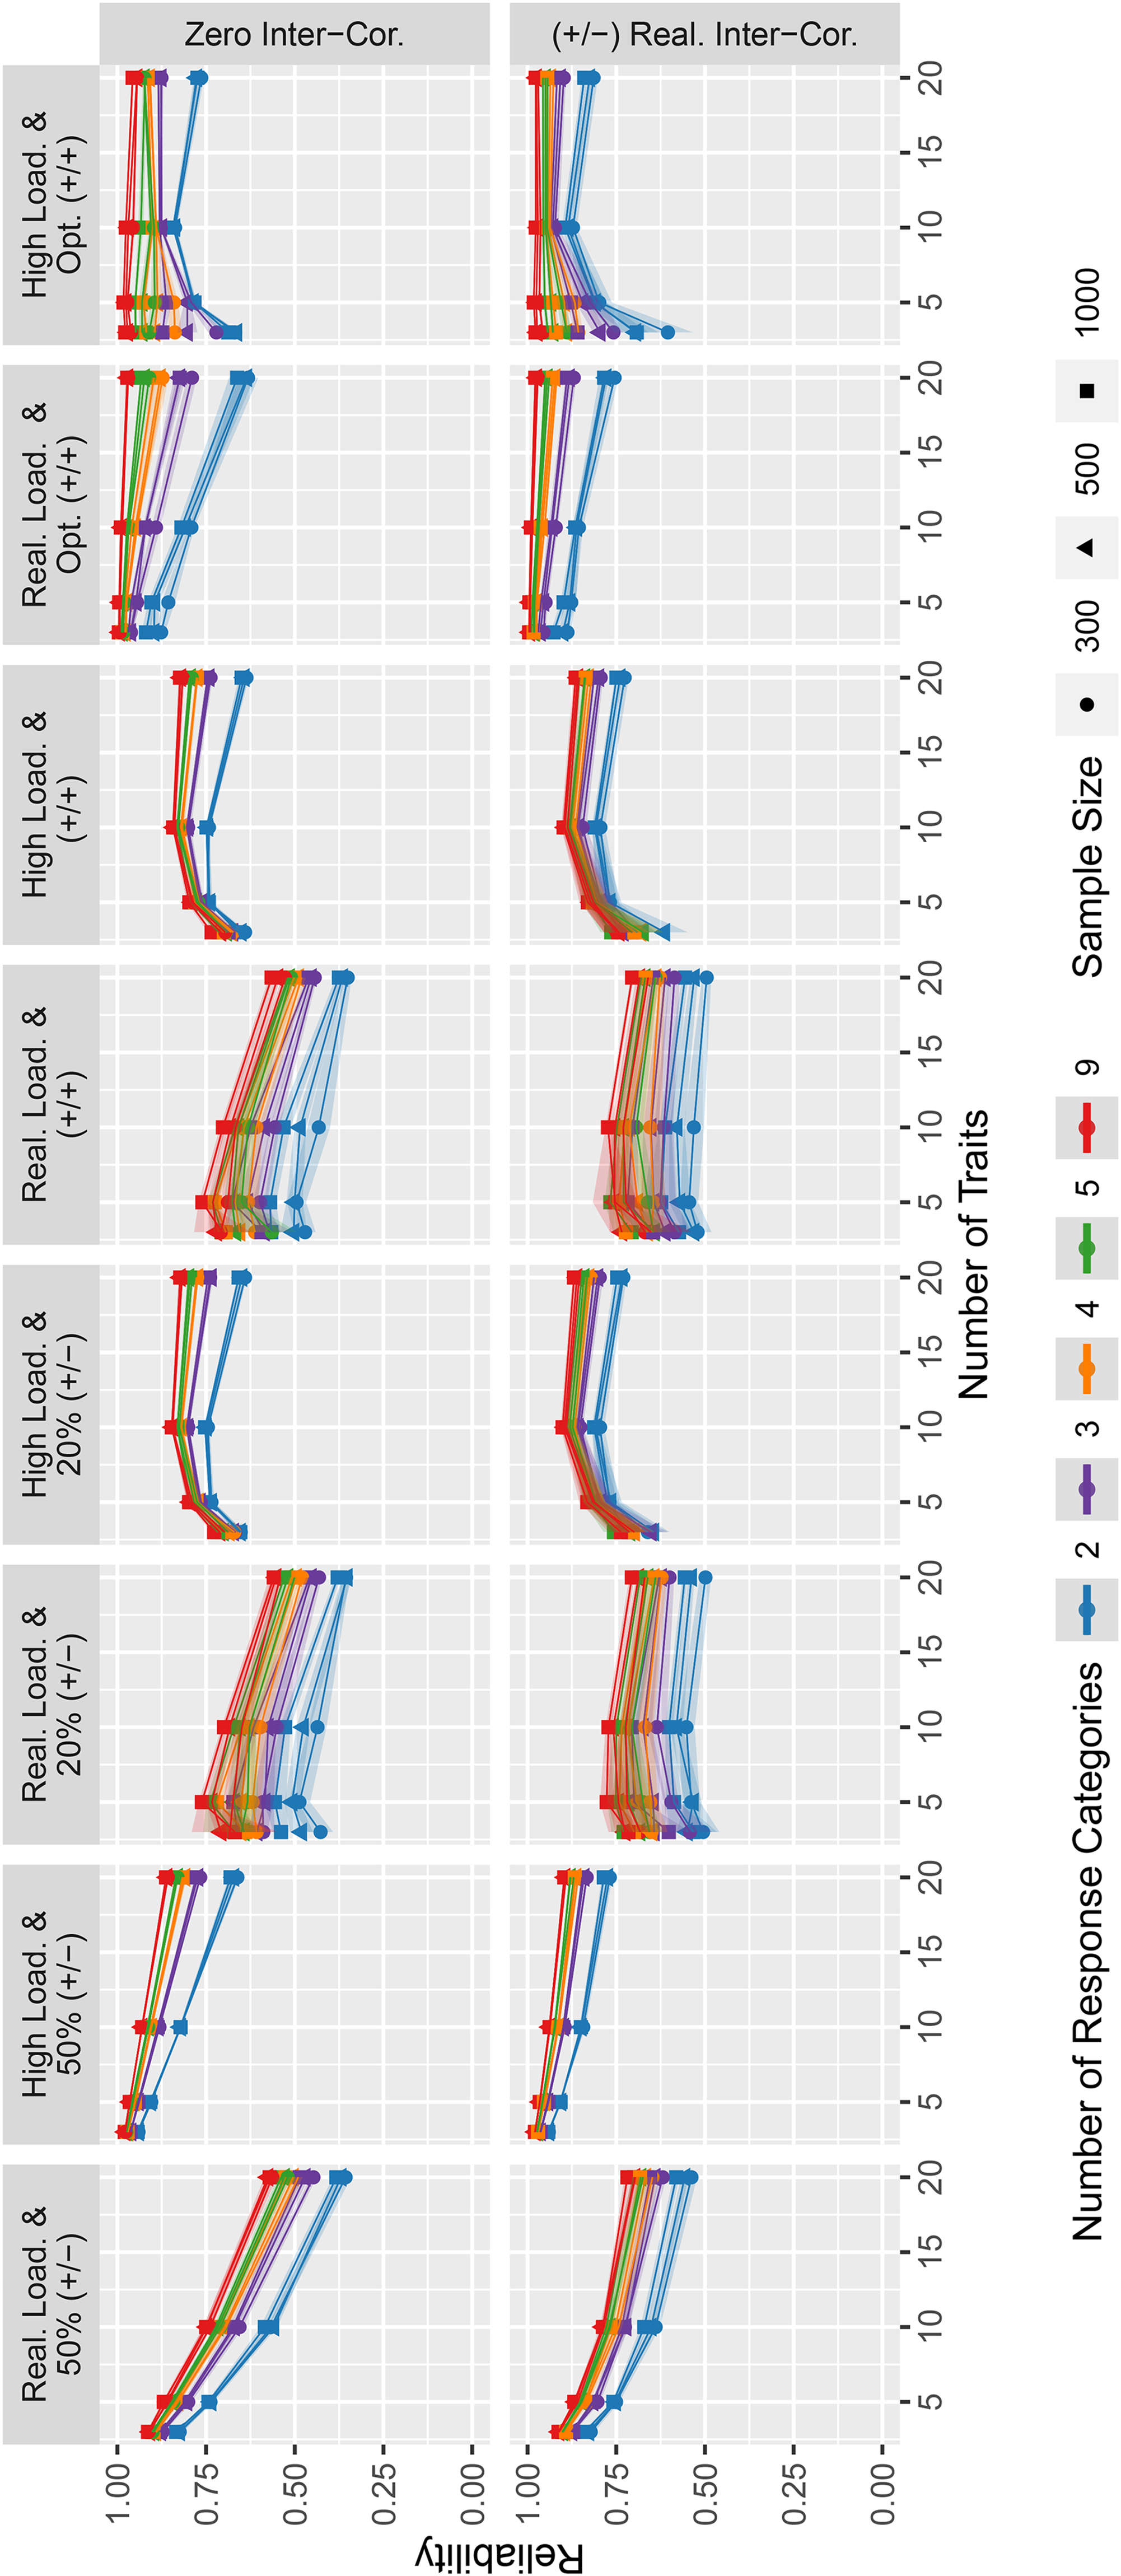
Reliability estimates for the simulated data.
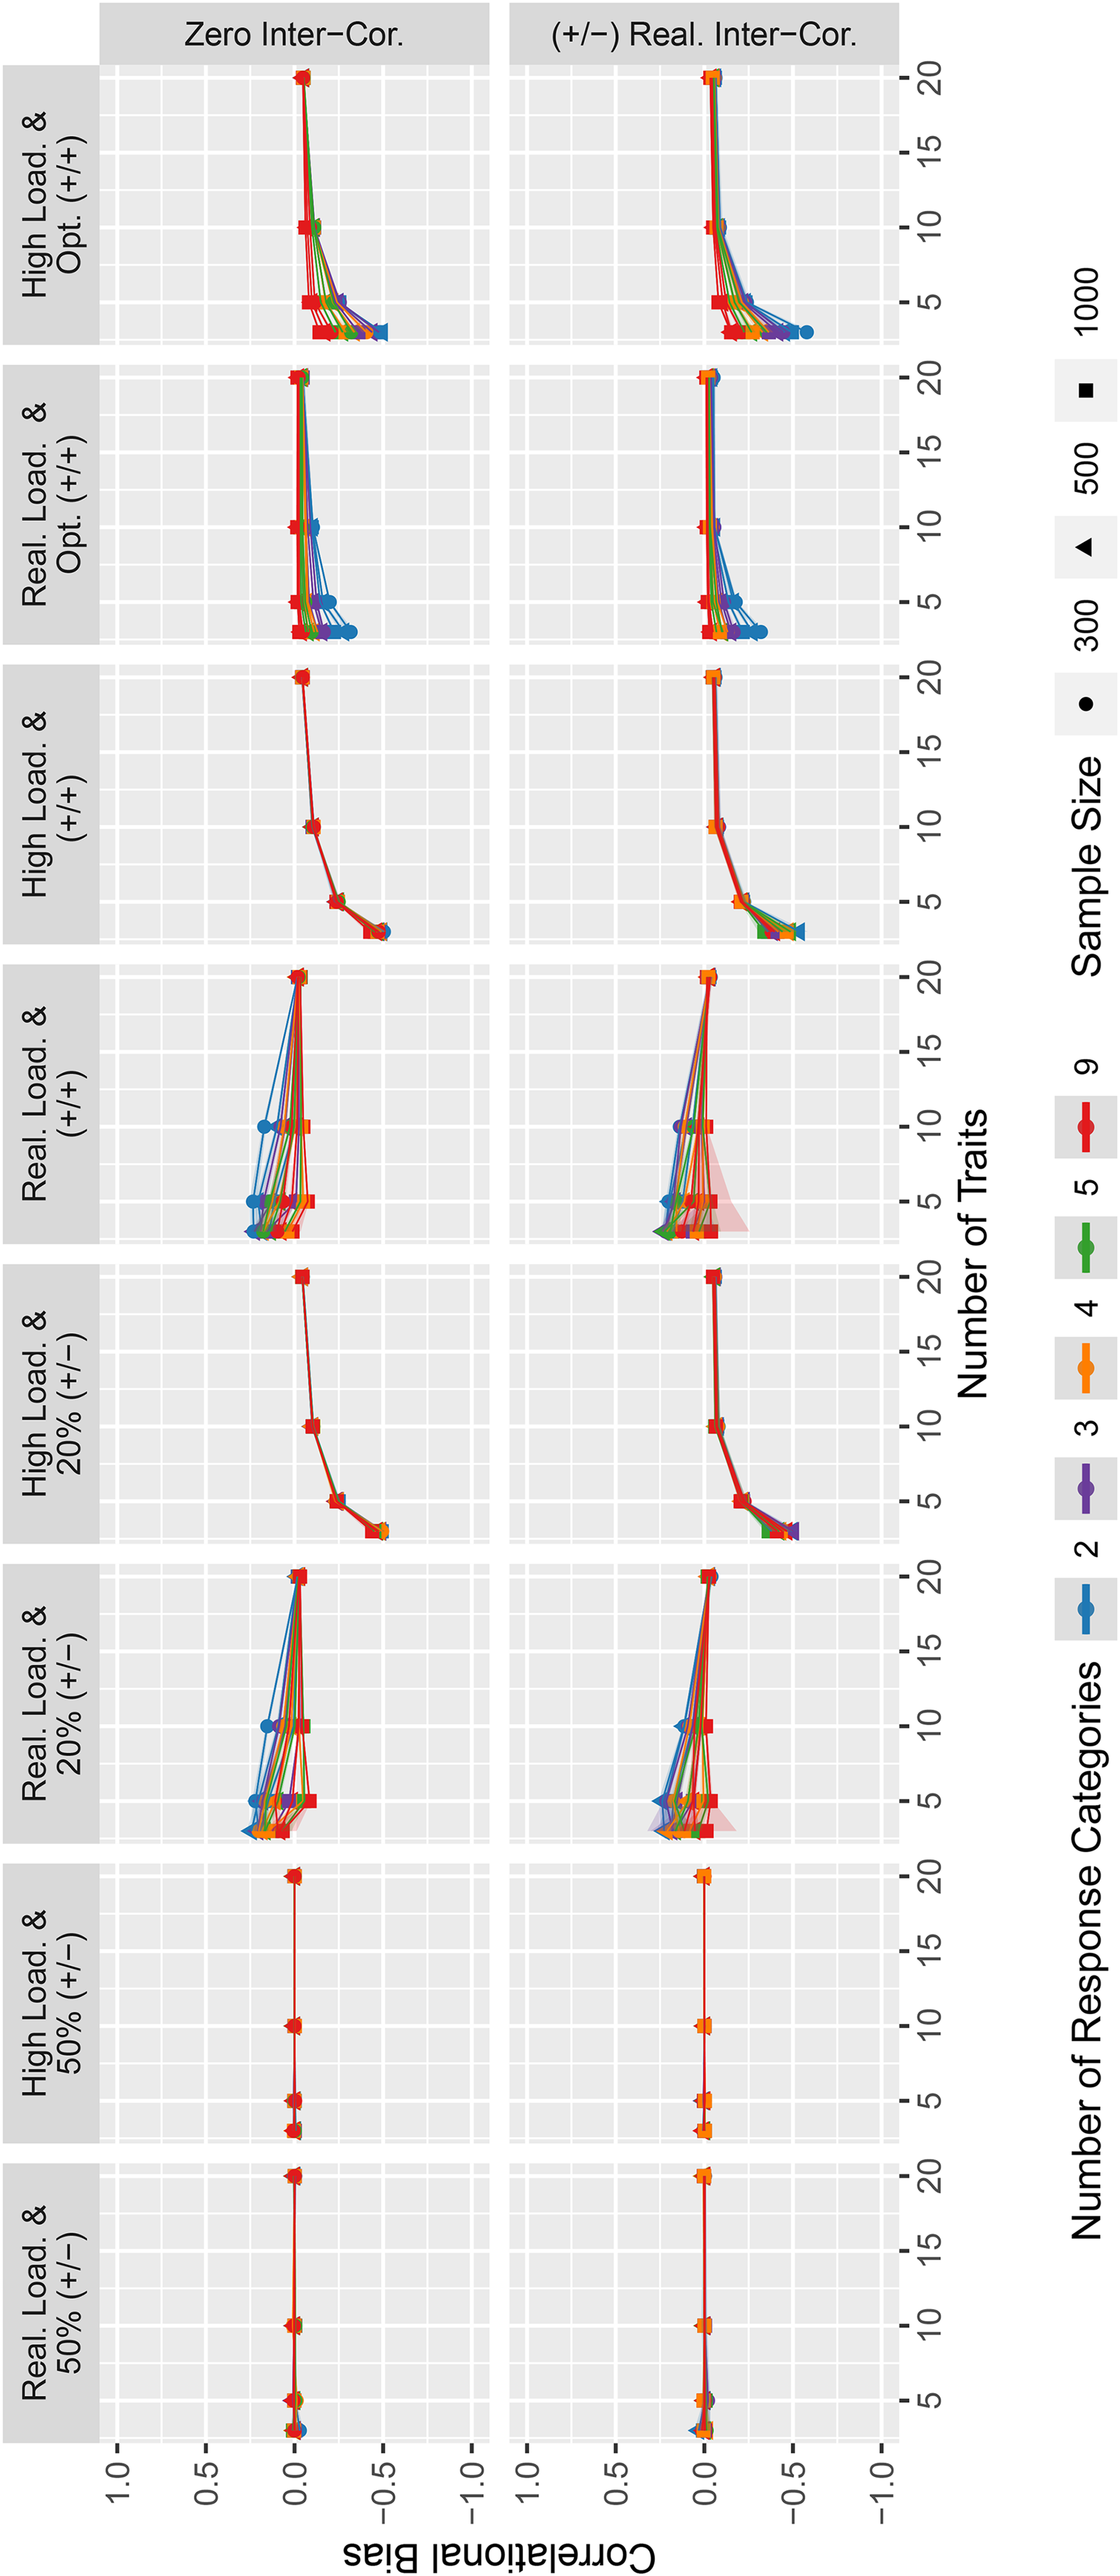
Estimates for intertrait correlation biases for the simulated data.
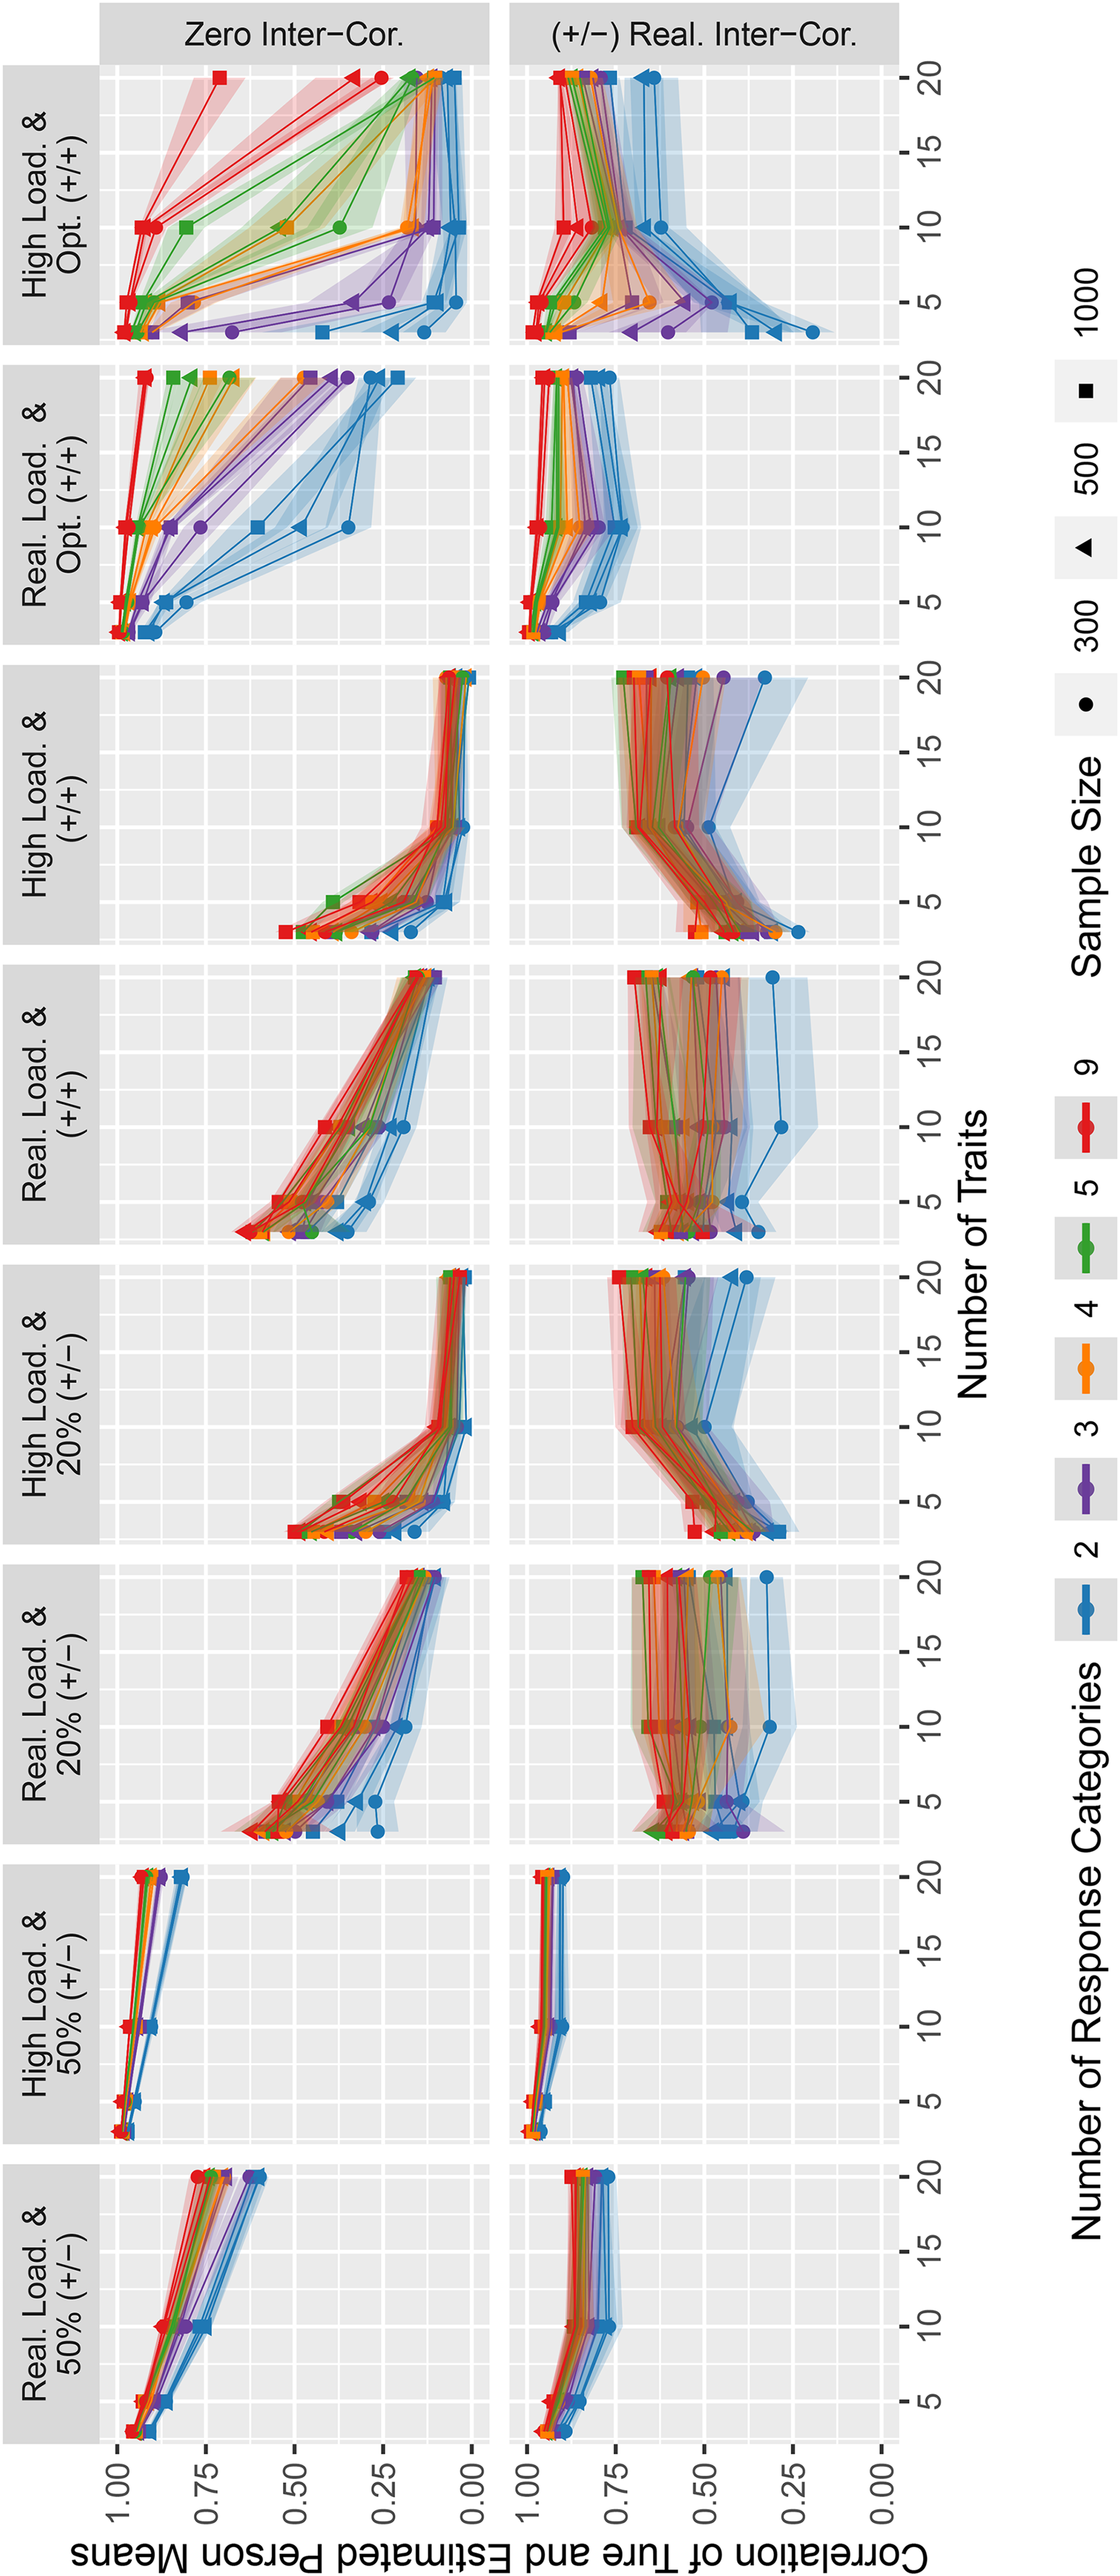
Correlation of true and estimated person means for the simulated data.
To quantify the measurement error of trait scores, we determined the reliability of the simulated conditions (see Figure 2). Overall, the reliabilities show mixed results ranging from poor to excellent reliabilities across conditions.
Clearly, a higher number of response categories was related to higher reliabilities. Furthermore, there was an additional benefit of more response categories, but it decreased for higher numbers of response categories.
Furthermore, on average, with an increasing number of traits, reliabilities declined when the total number of GPCs was fixed to 90 (as is the case for the questionnaires analyzed in Figure 2). Importantly, however, there were a few exceptions to this general pattern: For conditions with high factor loadings and (a) equally keyed item pairs without optimized matching, (b) 20% unequally keyed item pairs, or (c) equally keyed item pairs with optimized matching of (high) factor loadings and few response categories, reliabilities tended to increase up to a number of five to ten traits.
With regard to the influence of intertrait correlations, effects were small but reliabilities were slightly higher with realistic intertrait correlations than with intertrait correlations of zero. In contrast, the absolute value of factor loadings had a considerable effect on reliabilities. Higher factor loadings were generally associated with higher reliabilities, independent of the other variables. One exception to this general pattern were the optimized matching conditions with five or fewer traits and two response categories: Here, reliabilities were considerably higher for realistic loadings in some conditions.
The combination of factor loadings had a relevant effect. Randomly combined equally keyed loadings and designs with 20% unequally keyed item pairs yielded lower reliabilities than conditions in which 50% of the factor loadings were negative or in which the pairing of equally keyed item pairs was optimized. Among the latter two conditions, optimized pairing led to the highest reliabilities, especially when the number of traits was high.
The absolute reliability values in the conditions that are most relevant for applied purposes (realistic loadings, randomly combined equally keyed item pairs, and realistic intertrait correlations) were below conventional standards of good measurement quality (
Regarding the normativity of trait scores, we calculated the bias in the intertrait correlations and the correlation of true and estimated person means. Overall, the intertrait correlation bias in Figure 3 tended to be smaller for higher numbers of response categories. Furthermore, the use of questionnaires with 50% unequally keyed item pairs produced very accurate estimations of intertrait correlations. For conditions with 20% unequally keyed item pairs, equally keyed item pairs, as well as for designs with optimized matching, the bias was smaller for a higher number of traits. The type of intertrait correlations did not seem to affect the estimation bias considerably, whereas the factor loadings did for all conditions in which a bias existed. In general, the absolute bias tended to be slightly smaller when item pairing was optimized than when items were randomly combined. Within the optimized matching designs, biases were slightly larger for higher loadings. When items were equally keyed without optimized matching or when 20% of item pairs were unequally keyed, higher factor loadings mostly led to negative biases—especially when few traits were measured—while realistic factor loadings seemed to produce slightly positive biases. In terms of absolute values, the correlation biases were very small in many conditions.
Finally, Figure 4 shows the correlations between true and estimated person means. This measure is an indicator of how well differences in the overall levels of persons’ trait profiles are recovered, that is, how weak the ipsativity constraint is.
Overall, higher numbers of response categories were associated with a higher correlation of true and estimated person means. Furthermore, the correlations were reasonably high for the mixed keyed conditions with 50% unequally keyed item pairs. In contrast, this was not the case for the conditions with 20% unequally keyed item pairs, equally keyed conditions with randomly combined items, and some of the optimized matching conditions. Besides the conditions with 50% unequally keyed item pairs, only conditions with an optimized pairing of equally keyed item pairs, realistic factor loadings, and realistic intertrait correlations (preferably with higher numbers of response categories) led to consistently high correlations of true and estimated person means.
Constant Test Length Versus Constant Number of Items per Trait
The results presented so far were based on a design with a fixed questionnaire length of
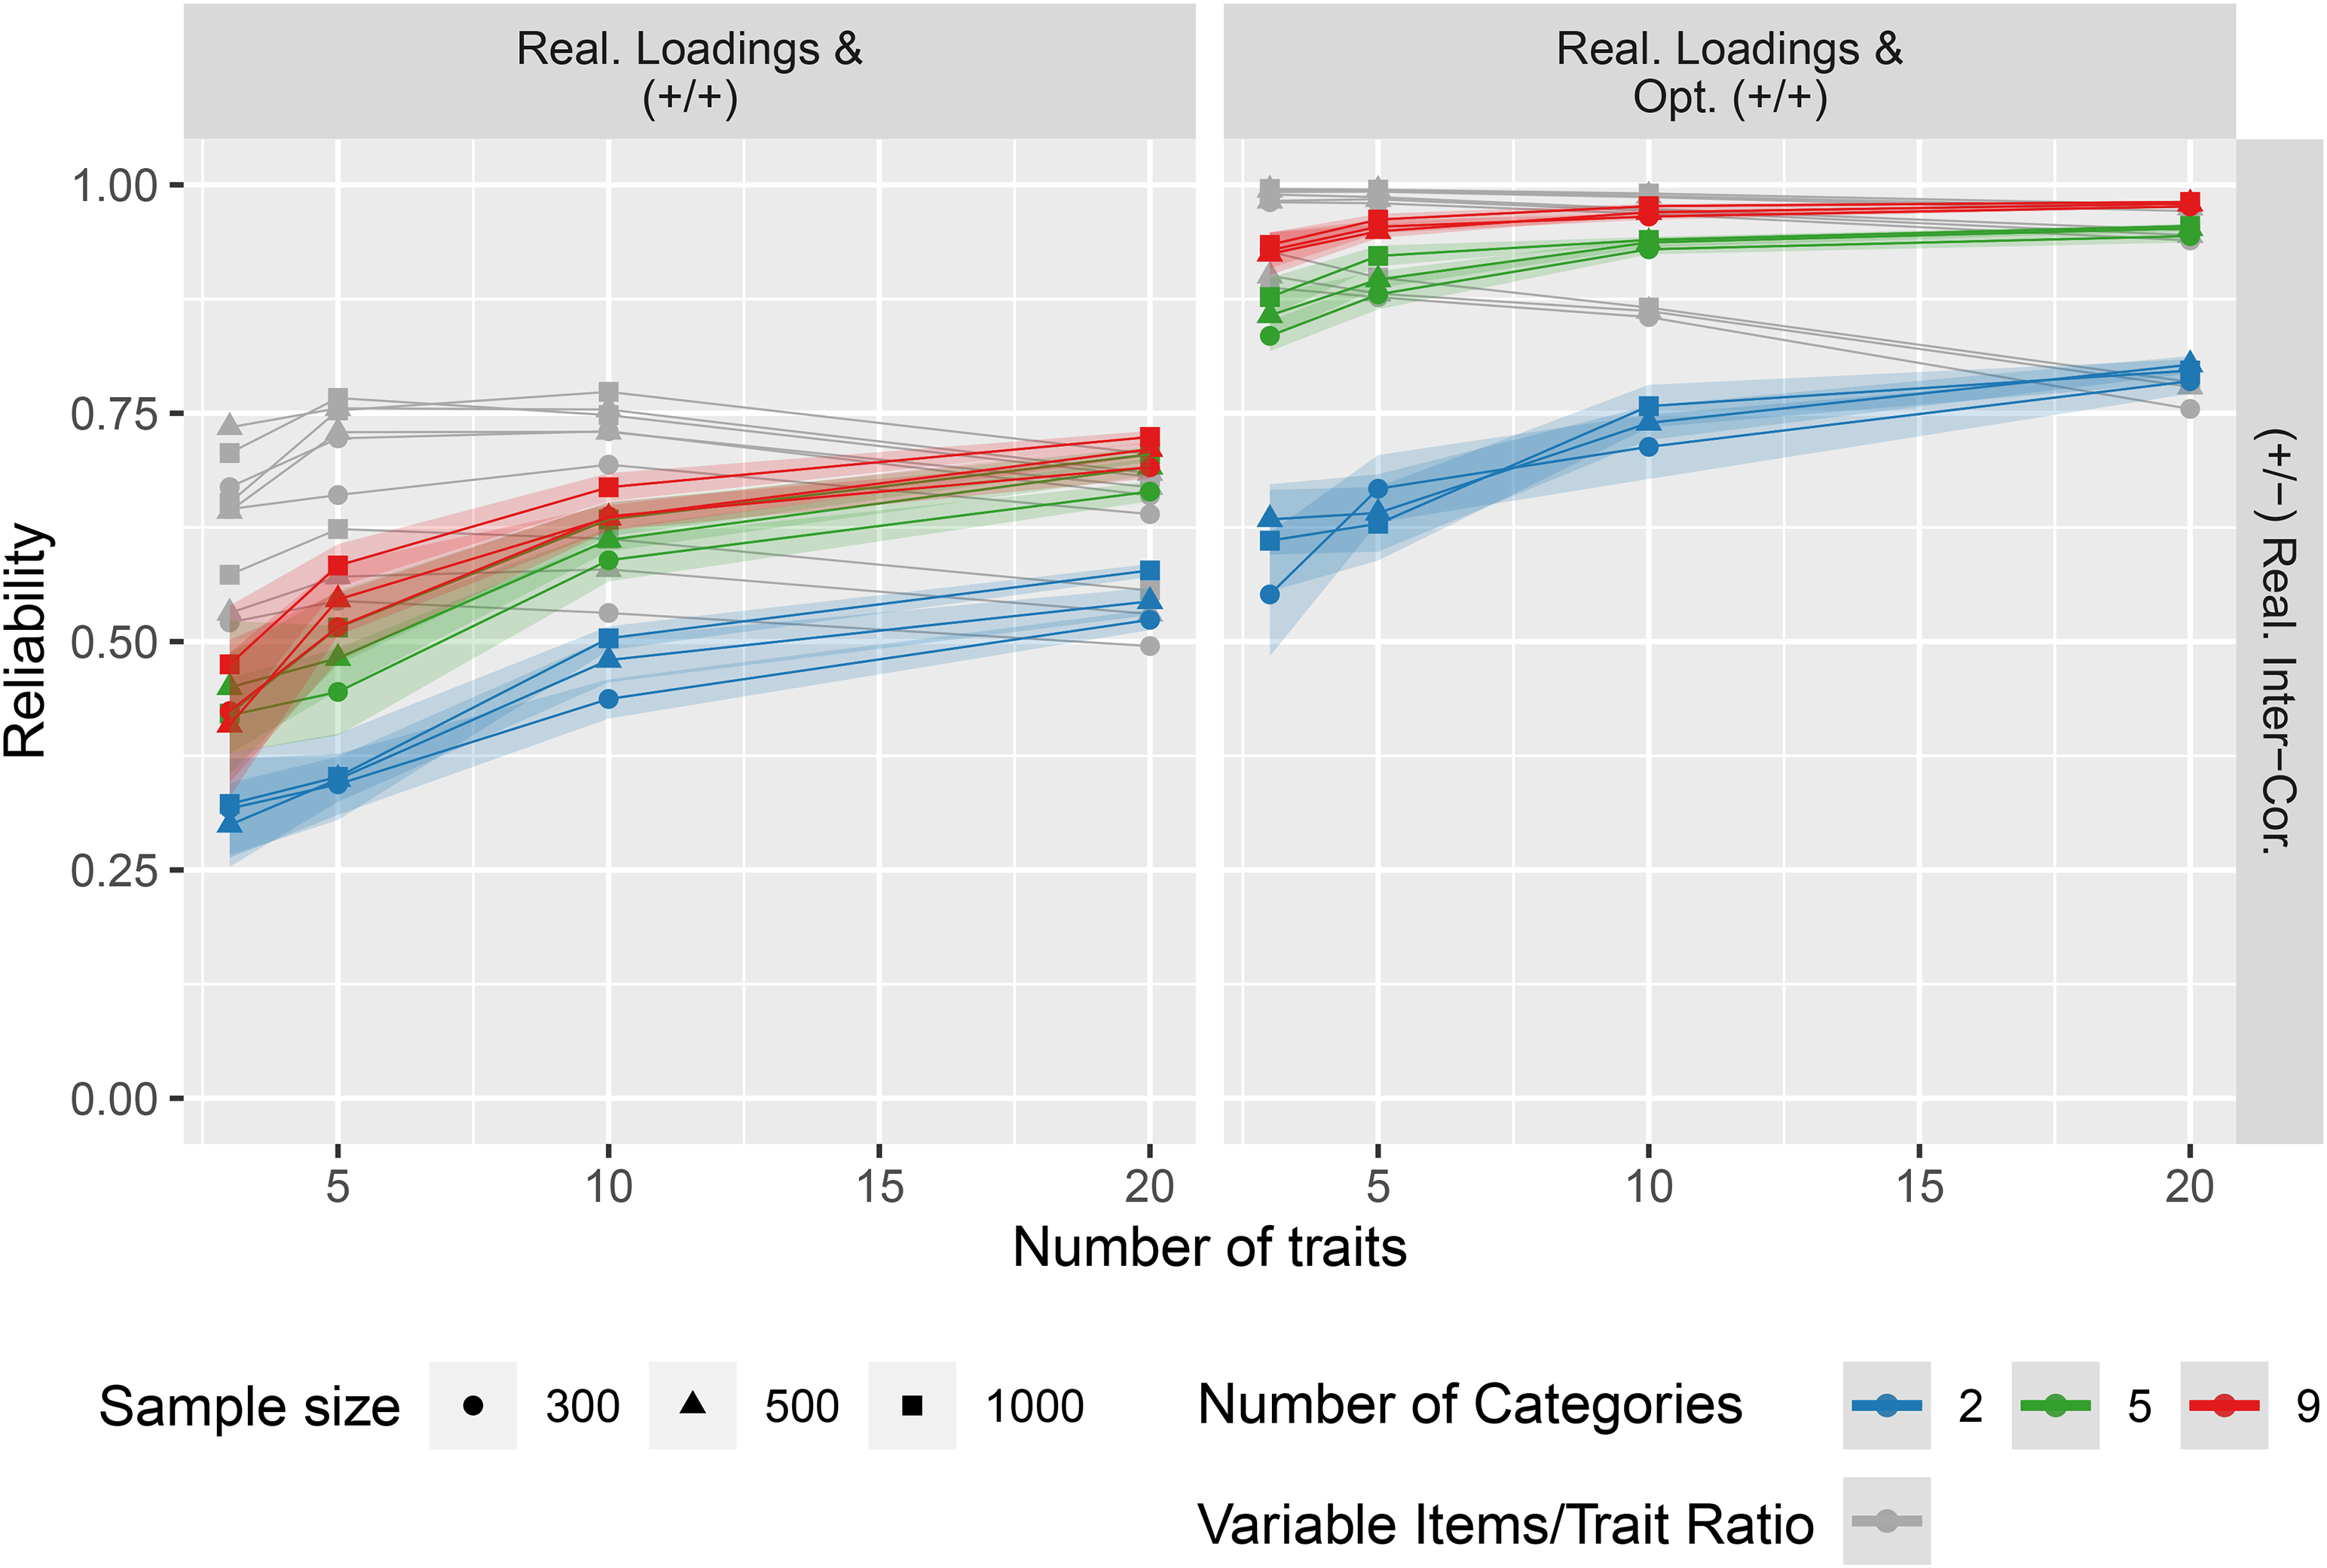
Comparison of a constant items/trait ratio versus variable items/trait ratio for the simulated data.
When the number of items per trait was fixed, more traits were accompanied by a monotonic growth in reliabilities. A reliability decrease as in the simulations with a fixed total questionnaire length was not observed in this case.
Empirical Example
In the following empirical example, we will demonstrate the effects of our simulations with synthetic data in data from human participants. Furthermore, we analyze the effect of faking on empirical reliabilities.
Data
For this study, we used the open data provided by Schulte et al. (2024). The dataset consists of responses from
The questionnaire measured four personality traits (neuroticism, conscientiousness, extraversion, and agreeableness). Of the 119 GPCs, 71 items were equally keyed and 48 items were unequally keyed. Each GPC was answered on a nine-point scale.
Furthermore, the dataset comprises ratings of each item’s social desirability for the application context in which the data were collected. Matching items for social desirability is an effective method to reduce faking in FC questionnaires (Cao & Drasgow, 2019; Pavlov et al., 2021). We investigated the effects of this questionnaire construction strategy on factor score reliability.
Procedure
We based our empirical example on 24 conditions by fully crossing the following factors which will be explained below: (1) response instructions (honest vs. faking), (2) gradedness of item pairs (GPCs vs. binary FC scales), (3) keying of item pairs (equally vs. mixed), and (4) matching algorithms (random vs. optimized factor loadings vs. social desirability matching). Each of these conditions was examined with five (equally keyed) or eight (mixed keyed) different questionnaire lengths.
Regarding our first and second factors (response instruction and gradedness), we created binary choice answers from the original dataset for both the honest and the faking data. In doing so, we took a similar approach as described by Brown and Maydeu-Olivares (2018): Response options 1–4 were recoded to Category 1, Response options 6–9 were recoded to Category 2, and Response option 5 was randomly assigned to either Category 1 or 2. This allowed for comparisons between GPCs and binary FC scales.
Regarding our third factor of item keying, we took each of the four resulting datasets (honest dichotomized, honest graded, faked dichotomized, and faked graded) and created subsets that only included equally keyed GPCs. Comparing these equally keyed questionnaires to mixed keyed questionnaires allowed us to draw conclusions on how keying affects the reliability of real-world data.
As for our fourth factor (matching algorithm), we used three different algorithms (see below) to create shorter questionnaires from the 119 available GPCs. We created questionnaires with the length of 15 to 119 GPCs in increments of 15 GPCs. As only 71 equally keyed item pairs were available, we ended our equally keyed estimations at 71 GPCs.
As a baseline, our first algorithm was a random combination of GPCs. We took 15 random item pairs and continued to add further random item pairs, 15 at a time. For each condition, this process was replicated 100 times.
Our second algorithm was based on factor loadings. As the autoFC package (Li et al., 2022) that we had used in our simulations with synthetic data essentially maximizes factor loading differences, we wanted to closely replicate this mechanism. Thus, we picked item pairs with the highest factor loading difference to contribute to our shorter questionnaire versions first. However, we also needed to ensure high factor loading sums for reasonable trait estimation. Therefore, we alternated between picking the item pair with the highest factor loading difference and the item pair with the highest factor loading sum from the remaining item pool.
The third algorithm was based on the difference between the social desirability of each item in a pair. We added item pairs to our questionnaire in order of lowest to highest difference in desirability. For the mixed keyed questionnaires, we constrained the share of unequally keyed item pairs to about 40% (as is the case in the full dataset from Schulte et al., 2024) over all conditions of questionnaire lengths. This avoids that the first item pairs that are included are almost exclusively equally keyed (as they have low desirability differences) and that the last item pairs added are almost exclusively unequally keyed (as they have high desirability differences). For results without this constraint see Online Supplement F.
In all three algorithms, we ensured that every trait was measured with at least 21% of the total number of items. If this was not the case after the first pick of GPCs, single item pairs were exchanged until this criterion was met in accordance with the respective algorithm.
Just like in our simulations, we used Version 0.12.1 of the thurstonianIRT package (Bürkner, 2021) to fit our models. To estimate empirical reliability, we used Version 1.38.1 of the mirt package (Chalmers, 2012). Because we were interested in the overall pattern of results and not in the measurement properties of a specific personality scale, we aggregated across the reliability estimates of the four individual traits.
Empirical Results
Figure 6 shows the results for questionnaires that are assembled based on the optimized combination of factor loadings. Overall, the reliability increased when the questionnaires became longer (more specifically, the more items per trait were included). In line with our simulations based on synthetic data, the graded version with nine response options was more reliable than the dichotomized version of the same questionnaire. Results confirmed a second central conclusion from the simulations with synthetic data: Reliability is higher when item combination is optimized compared to a random combination. This effect became smaller in our data when the questionnaires were longer. However, it should be noted that with an increasing questionnaire length, the pool from which the algorithm could select additional items became smaller, and thus, increasingly suboptimal item pairs needed to be selected. Overall, the mixed keyed questionnaires were more reliable than the equally keyed questionnaires and, all else being constant, honest responses led to more reliable trait scores than faked responses.
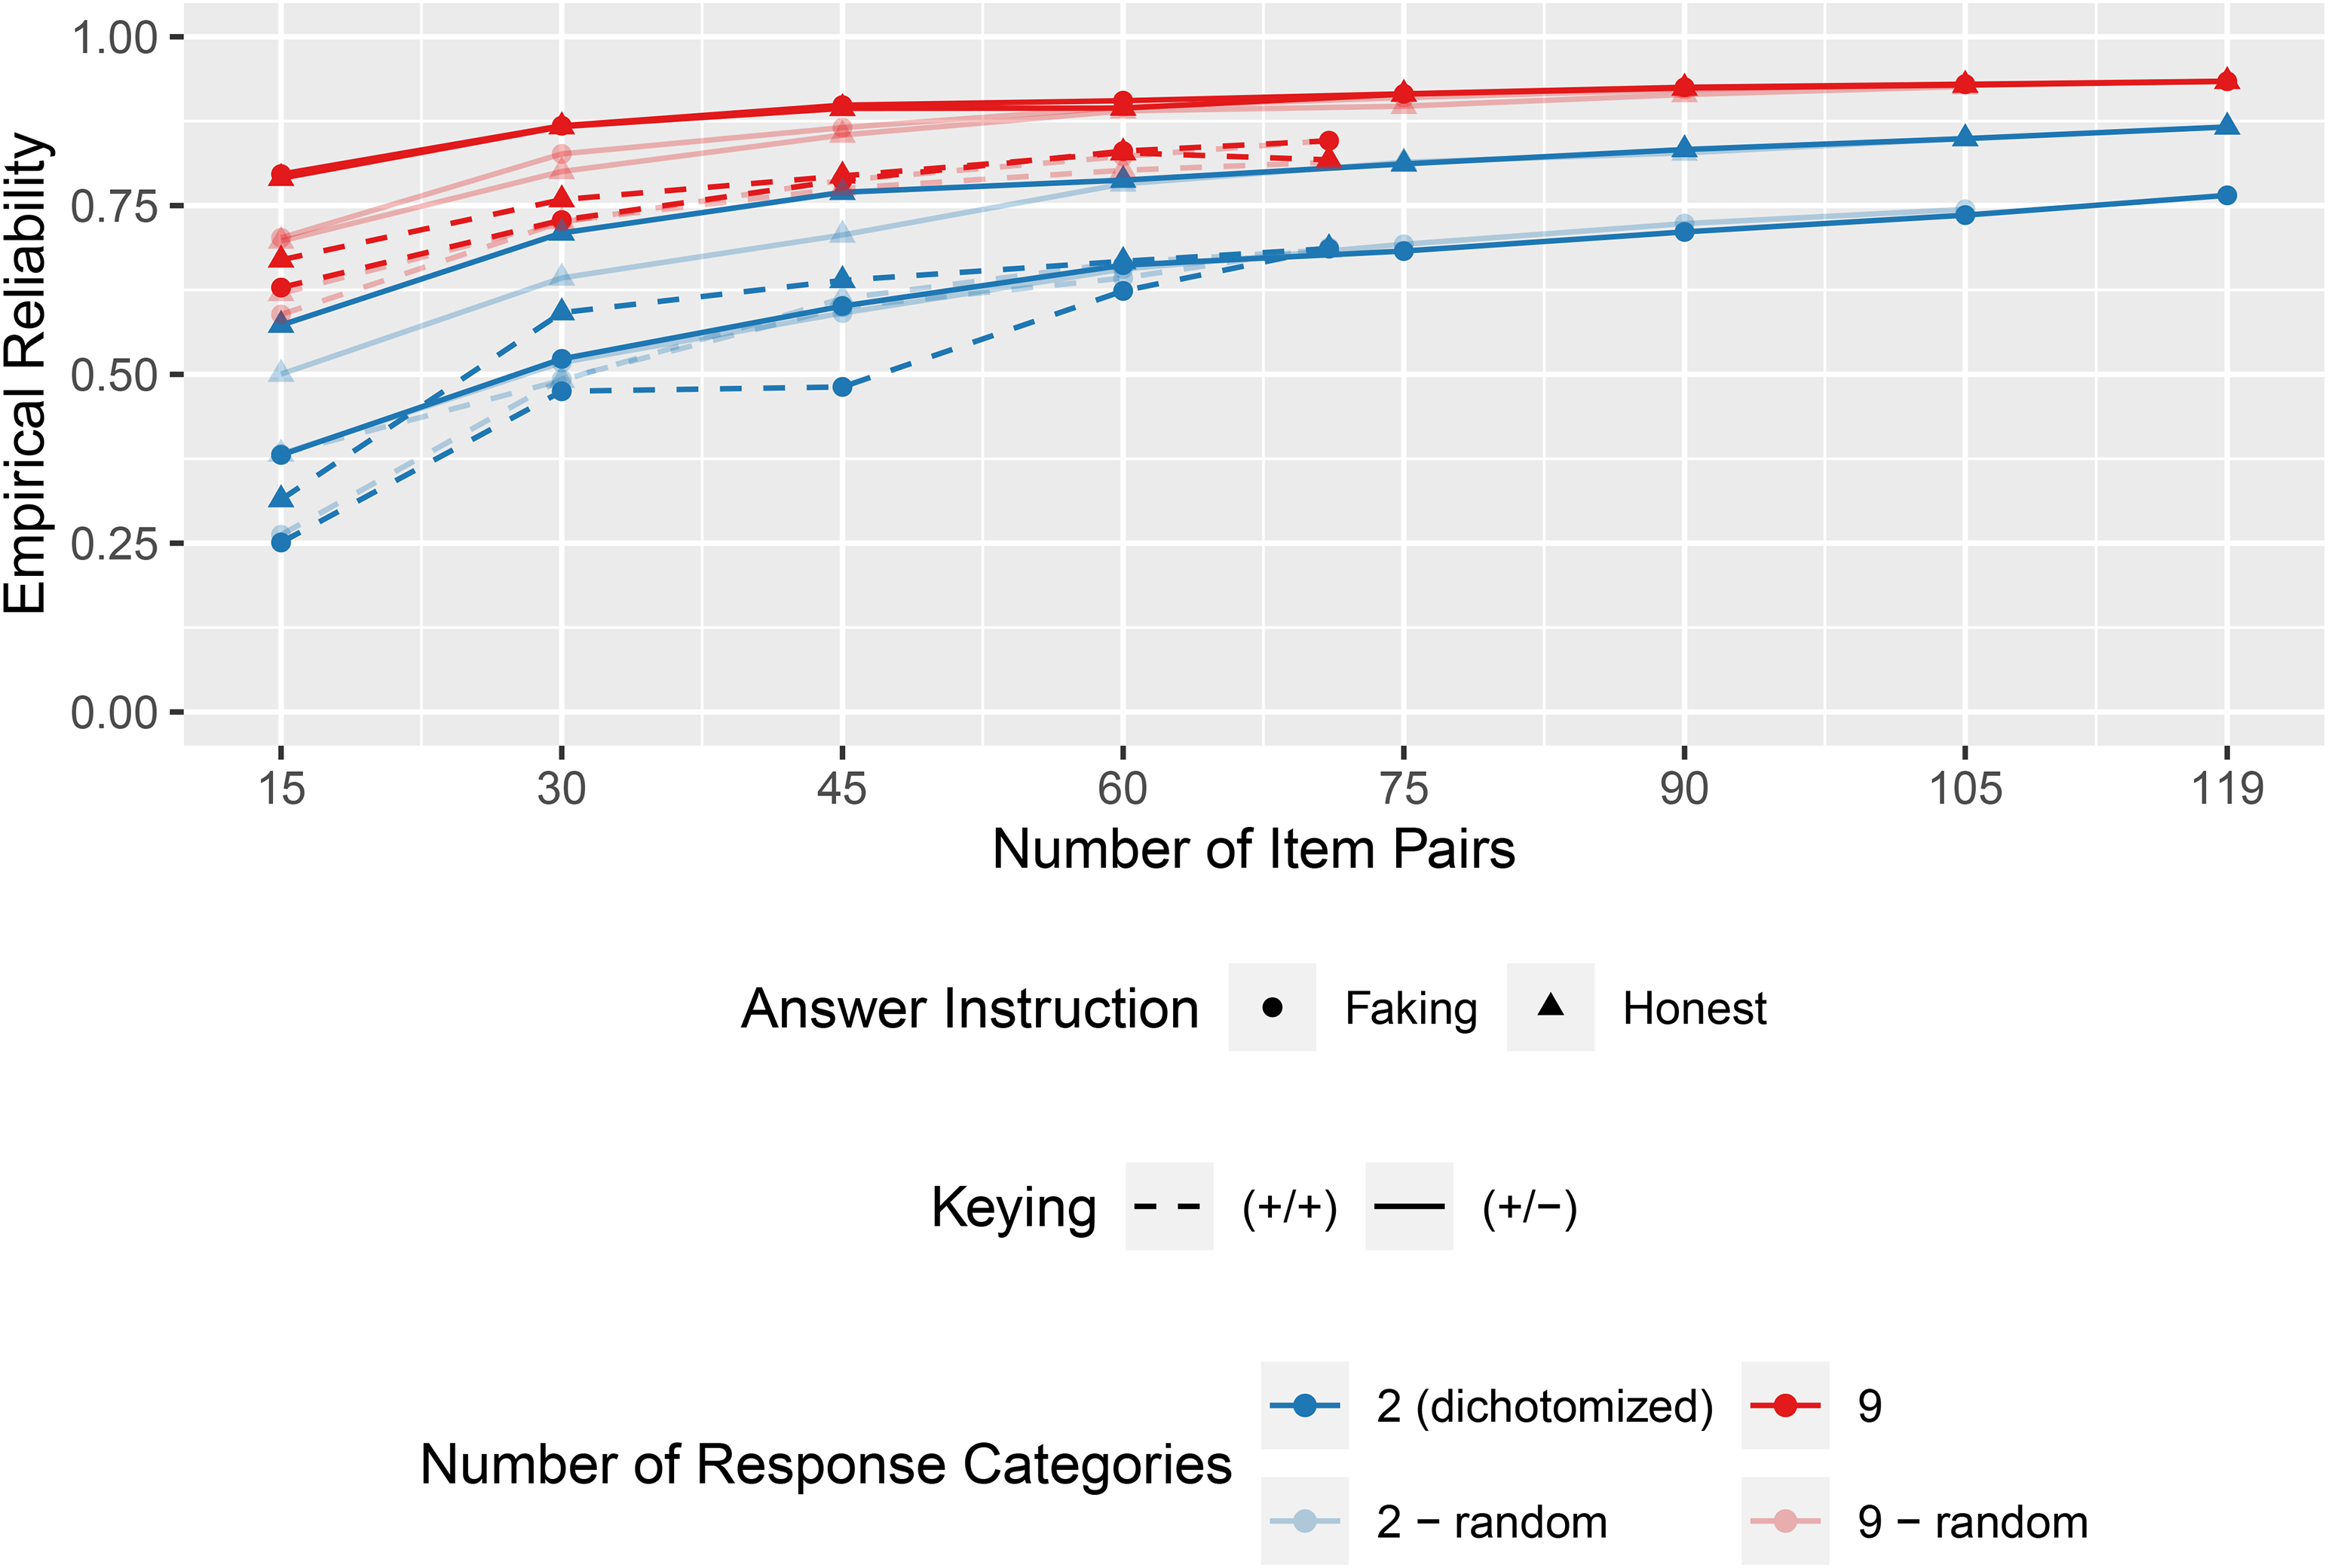
Empirical reliability estimates of questionnaires optimized by factor loading differences/sums in the empirical example.
Finally, Figure 7 shows the results for questionnaires that are assembled based on the minimal social desirability difference within each GPC. Again, longer questionnaires showed higher reliabilities, the graded versions were more reliable than the corresponding dichotomized questionnaire versions, and in the faking condition, reliabilities were mostly lower than in the honest condition. However, compared with a random selection from the item pool, the inclusion based on minimal social desirability differences tended to result in lower reliabilities.
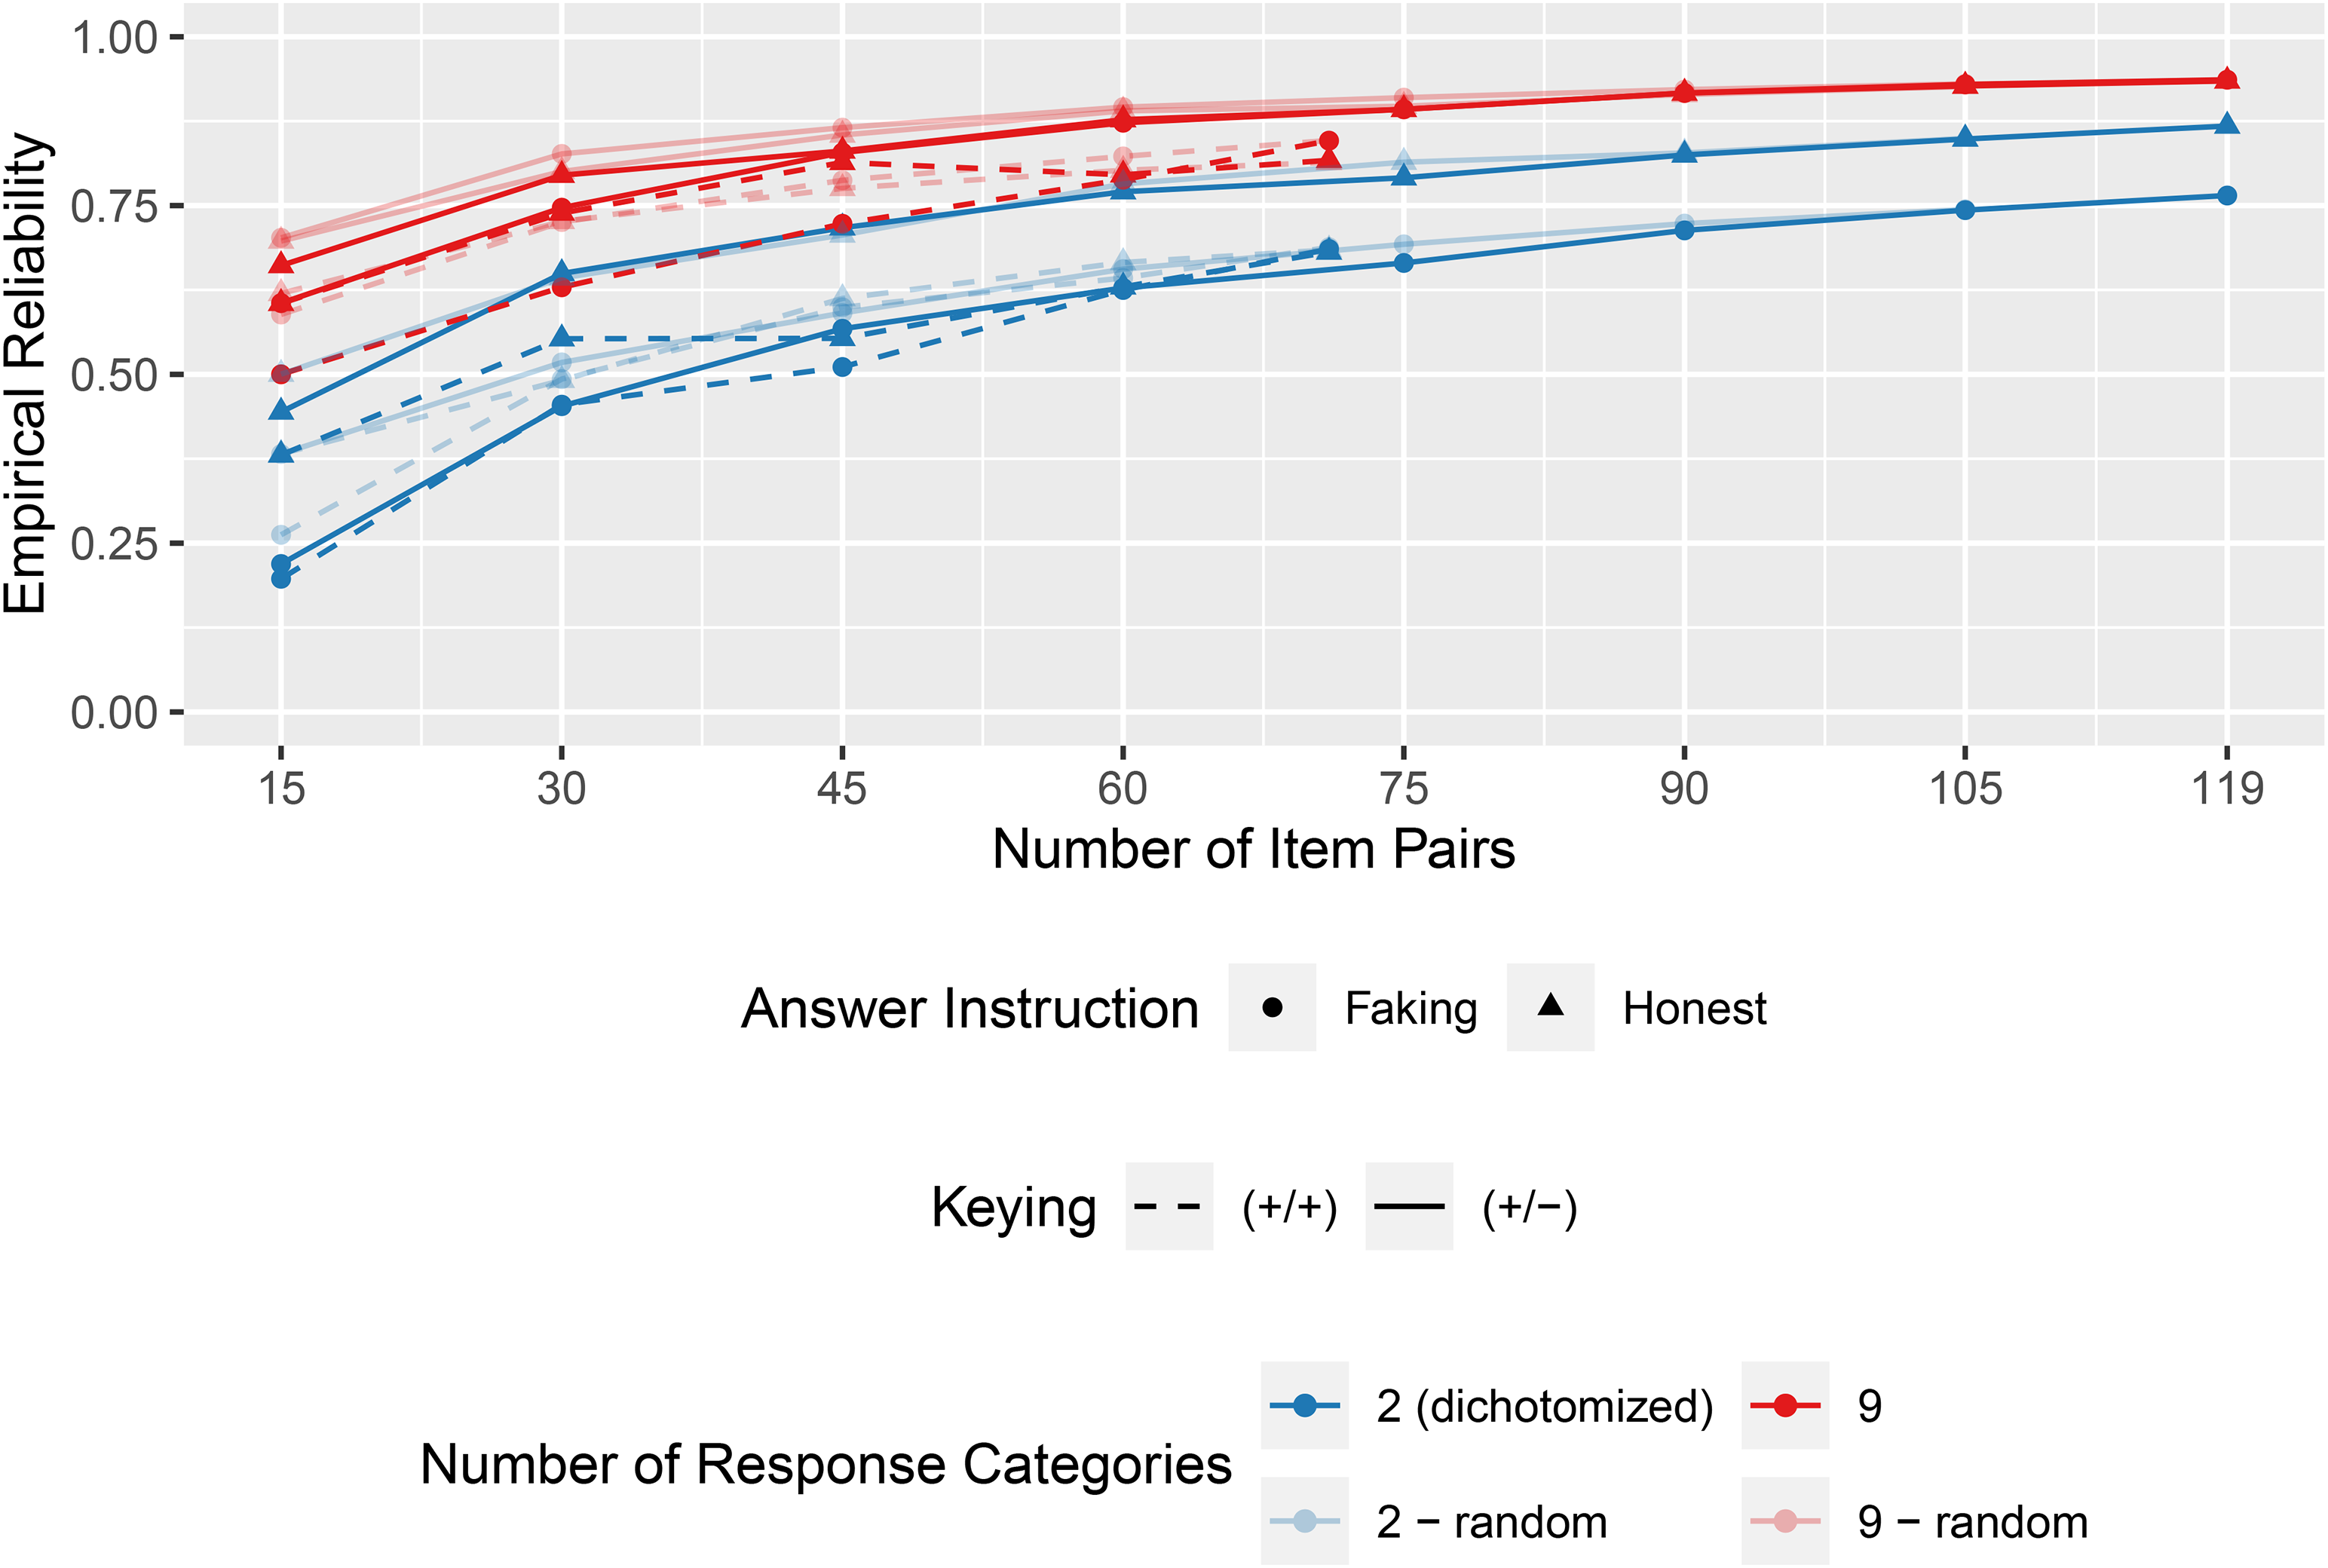
Empirical reliability estimates of questionnaires optimized by social desirability (quota mixed keyed) in the empirical example.
Discussion
In the literature, GPCs are discussed as a more faking resistant alternative to Likert scales (Cao & Drasgow, 2019; Speer et al., 2023), which at the same time have the potential to enable more reliable and less ipsative measurements than traditional binary FC formats (Brown & Maydeu-Olivares, 2018; Schulte et al., 2021). In our study, we investigated the size of these potential reliability gains of GPCs in both synthetic and real-world data and identified several questionnaire attributes that influence psychometric properties of trait estimates in applied settings.
Questionnaire Attributes Influencing the Reliability and Normativity of GPC Trait Scores
While faking-resistance is usually considered to be the biggest strength of FC scales (Cao & Drasgow, 2019), our study focused on the improvements of their weaknesses, which are potentially low reliability and potential ipsativity (i.e., not full normativity). The characteristics of GPC questionnaires that proved to be relevant in our studies can be categorized on three different levels: (a) the rating scale of the GPCs, (b) the item factor loadings and their combination within single GPCs, and (c) the questionnaire structure at the trait level.
The Rating Scale: Number of Response Categories
In our first hypothesis, we predicted that an increased number of response categories would be associated with higher reliability and normativity of trait estimates. Graded response options can significantly increase the reliability of FC formats. This result from the simulations with synthetic data is also reflected in our analysis of empirical data. In our simulations, the normativity indicators (i.e., the correlation bias and the correlation of true and estimated person means) also provided evidence that the normative interpretation of scores is more reasonable with a higher number of response categories. Therefore, our first hypothesis is supported. The conditions with two response categories allow a direct comparison with the binary FC scale. We can therefore expand upon and further quantify the effects from the preliminary comparisons by Brown and Maydeu-Olivares (2018), who found that GPCs have higher reliabilities than binary FC scales: In our simulated conditions, GPCs had higher reliabilities than binary FC scales that ranged from approximately zero to .36, depending on the specific levels of other design factors. However, the incremental benefit of additional response categories decreased for higher numbers of categories. Specifically, the mean increase from two to three response categories was larger than the mean increase from five to nine categories.
When looking at the response process of test takers, prior research suggests that there likely is an upper bound to how many response categories respondents can meaningfully discriminate (e.g., Preston & Colman, 2000). While respondents seem to be able to easily discriminate around five response categories (Lee & Paek, 2014; Preston & Colman, 2000), nine might already be too many. A recent study comparing two, four, and five response categories in GPCs also found GPCs with five response categories to be overall superior to the other questionnaire formats when looking at reliability, respondent reactions, and response styles (Zhang et al., 2024a). In practice, therefore, around five response categories could be a good choice, taking into account the limited human ability to distinguish between response categories and at the same time giving away little potential informational gain through additional response categories.
Factor Loadings and Their Combination Within GPCs
We investigated three aspects of factor loadings: their optimized matching within a questionnaire, their keying within an item pair (equally vs. unequally), and their absolute values in individual items. All three exhibited a relevant influence on reliability and normativity of trait scores.
Our first research question asked whether the reliability and normativity of estimated trait scores can be improved by optimizing the matching of individual items to item pairs. With respect to the reliabilities, this is clearly the case. The conditions with optimized matching were more reliable than the corresponding conditions without optimized matching. Especially the combination of optimized item matching and a graded response format yielded excellent reliabilities. As for the normativity, most conditions also seemed to benefit from optimized matching: The intertrait correlation bias was smaller compared with the corresponding equally keyed conditions without optimized matching. Furthermore, the correlation of true and estimated person means was generally higher in the optimized matching conditions. However, the conditions with two response categories and high factor loadings were an exception from this pattern given that they seemed to benefit less from optimized matching of items. Nevertheless, overall, our results indicate that optimizing the matching of items not only improves reliability but also helps to identify the absolute differences in respondents’ trait profiles. Furthermore, in our analysis of empirical data, we were able to replicate the finding on reliability in both the honest and the faking conditions.
Our second hypothesis concerned the influence of equally keyed versus mixed keyed questionnaire designs on the reliability and normativity of estimated trait scores. We expected mixed keyed questionnaires to outperform questionnaires with only equally keyed item pairs. When comparing the equally keyed conditions without optimized matching and the mixed keyed conditions with 50% unequally keyed item pairs, this hypothesis was supported for reliability. This result is in accordance with prior research on any type of FC scale (Brown & Maydeu-Olivares, 2011; Bürkner et al., 2019; Bürkner, 2022; Frick et al., 2023; Schulte et al., 2021). The effect of a smaller number of unequally keyed item pairs (i.e., 20%) is less clear. The idea that the inclusion of only a few unequally keyed item pairs can increase the reliability sufficiently with a small risk for high levels of faking in the majority of the (equally keyed) item pairs does not seem to be promising based on these results. This is somewhat in contrast to previous results in which questionnaires with 20% (Lee et al., 2022) and 17% (Sun et al., 2024) unequally keyed item combinations noticeably improved reliability estimates beyond those of equally keyed questionnaires. However, this difference in results might be due to the particular questionnaire specifications of each of these studies: Both Lee et al. (2022) and Sun et al. (2024) focused on binary formats, while our study focuses on graded questionnaire designs. Additionally, the absolute value of the factor loadings used in the present study is different from both Lee et al. (2022) and Sun et al. (2024). While Lee et al. (2022) used larger factor loadings (from .80 to 1.30), Sun et al. (2024) used a wider factor loading distribution (from .45 to .95). Both of these methods lead to larger loading differences within one unequally keyed item triplet (or pair, respectively) compared to in our study. This, in turn, allows a better recovery of absolute trait standing. Thus, this difference in study designs might be responsible for the different patterns of results.
With respect to normativity, conditions with 50% unequally keyed item pairs outperformed their corresponding equally keyed conditions without optimized matching both in regard to their intertrait correlation bias and in regard to their correlation of true and estimated person means. Thus, for them, the second part of our hypothesis was supported as well. Again, results were less positive for questionnaires with 20% unequally keyed item pairs. Nevertheless, if the percentage of unequally keyed item pairs is high enough, such designs can better recover the absolute differences in the trait profiles of respondents. We also see this effect in our empirical data, in which we compared equally keyed questionnaires and questionnaires with 40% unequally keyed item pairs.
Unfortunately, the higher reliabilities of mixed keyed questionnaires might not necessarily translate into higher validities. This is because, for mixed keyed designs to work, respondents have to honestly indicate when a socially undesirable item in an item pair describes them better than the other, socially more desirable item. This might work in low-stakes scenarios. However, in high-stakes situations, some degree of response distortion must be expected (e.g., Birkeland et al., 2006; Hu & Connelly, 2021; Li et al., 2025).
Regarding the influence of factor loadings, we proposed that higher factor loadings would result in higher reliabilities and more normative trait scores (Hypothesis 3). Based on the reliability estimates, the first part of this hypothesis was supported. There was, however, one exception: In questionnaires with optimized matching, two response categories, and five or fewer traits, realistic loadings produced higher reliabilities. This can be explained as follows: In our realistic factor loadings scenario, the variation between loadings was higher than in the high loadings scenario (
The second part of Hypothesis 3 regarding the normativity of trait scores was partially supported. On the one hand, for mixed keyed conditions with 50% unequally keyed item pairs, evidence from the correlation of true and estimated person means supported our hypothesis. Specifically, evidence from the intertrait correlation bias suggests that there was no difference between the loading conditions because the bias was nearly zero for these conditions. On the other hand, when looking at the conditions with 20% unequally keyed item pairs and the equally keyed conditions with and without optimized matching, evidence was contradictory to our prediction. It seems that in these simulated conditions, the absolute differences in trait profiles could be better recovered with realistic factor loadings. The explanation for these results very likely relates to the absolute loading difference between items. To accurately estimate the absolute trait scores, bigger loading differences are necessary. While for unequally keyed item pairs, high loadings also mean high loading differences, this is not the case for equally keyed designs. Here, high loadings are more homogeneous than realistic loadings, leading to a weaker correlation between true and estimated person means. Optimizing the loading of equally keyed designs again increases this correlation because loading differences are increased, where possible. Thus, in our study design, factor loading differences and factor loading sums were confounded, leading to the obtained results.
Questionnaire Structure: Number of Traits and Intertrait Correlations
On the questionnaire level, we tested the effects of the number of traits (Research Question 2) and of the intertrait correlations (Hypothesis 4) on the reliability and normativity of trait score estimates. In our simulations with synthetic data, reliability decreased with higher numbers of traits for questionnaires with 50% unequally keyed item pairs. This is in contrast to earlier research that found increases in reliability with increasing numbers of traits (Bartram, 1996; Saville & Willson, 1991; Schulte et al., 2021). It has to be remembered, though, that, unlike many former studies that fixed the number of items per trait, the main simulations of the present study fixed the number of items in the questionnaire resulting in fewer items per trait for higher numbers of traits. Thus, lower reliabilities in questionnaires with higher numbers of traits can be attributed to a shorter scale length per trait. This becomes evident in our comparison of questionnaires with a constant items-per-trait ratio and questionnaires with a constant test length: If the same number of items are used to measure all traits, each additional trait contributes to a higher overall reliability of the questionnaire. In the equally keyed questionnaires and the questionnaires with 20% unequally keyed item pairs (i.e., those questionnaires that are less saturated with information on between-person differences), we mostly observed an inverted U-shaped pattern: Reliability increased from three to ten traits but again decreased for 20 traits. We assume that this inverted U-shaped pattern is caused by several partly opposing underlying processes. On the one hand, highly skewed trait profiles (i.e., profiles with all high or all low true trait values within a person) are less likely when more traits are measured, making normative and ipsative scores more similar (Baron, 1996). Furthermore, trait scores from different traits inform on each other through the intertrait correlation matrix. Thus, more traits provide more information (Bürkner, 2022). On the other hand, the positive effects of higher trait numbers seem to be superimposed in questionnaires with a high number of traits if the test length is fixed and very few items measure each trait. For a more detailed discussion of the underlying processes, see Bürkner (2022).
The assumption that intertrait correlations can facilitate trait score estimation was explicitly tested in Hypothesis 4. We proposed that realistic intertrait correlations would result in higher reliability and normativity of trait score estimates. For reliability, this hypothesis was supported across all simulated conditions. Regarding normativity, our hypothesis was also supported (with small effects) for the intertrait correlation bias. Furthermore, the correlation of true and estimated person means showed a considerably different pattern of results between questionnaires with realistic intertrait correlations and with uncorrelated traits. While for uncorrelated traits the correlation of true and estimated person means decreased when more items were measured, we again noticed an inverted U-shape pattern in conditions with realistic intertrait correlations. This underscores the process described above: An increasing number of correlated traits inform on each other by means of correlation. Of course, this process is only in effect for correlated traits.
Effects of Faking on Reliability
The focus of our studies has been on the reliability and normativity of trait scores. It is important to emphasize that other psychometric quality criteria, such as validity and faking resistance, are also relevant for test construction. In FC formats such as GPCs, faking effects are reduced (e.g., Cao & Drasgow, 2019; Speer et al., 2023), but not necessarily completely eliminated. Therefore, it is possible that faking may affect reliability and therefore also recommendations for questionnaire construction, as we will discuss next.
The results of our empirical example show that faking can affect the psychometric properties of GPCs. Overall, honest responses lead to higher empirical reliabilities than faked responses (even though there are unsystematic exceptions where reliabilities are approximately equal in honest and faked responses). This is true for all tested item combination algorithms (random, factor loadings, and social desirability).
Beyond that, the empirical example replicates a number of effects from the simulations not only for honest but also for faking conditions. In particular, graded response formats (vs. dichotomized item pairs), optimized factor loading combinations, and unequally keyed item pairs led to higher reliability estimates. Note, however, that the operationalization of reliability necessarily differs between our simulation study and our empirical example. In our simulations, reliabilities represent the (squared) correlation between true and estimated trait scores. Since the true scores are unknown in empirical data, we rely on the standard error of measurement, which is calculated based on Fisher information matrices. These, in turn, are mainly determined by the factor loadings and are sensitive to the factor loading signs (Brown & Maydeu-Olivares, 2018; Bürkner, 2022). Thus, reliability estimates are negatively affected by faking only to the extent that it reduces the factor loading estimates in the TIRT model that the trait scores are based on. In other words, reliability coefficients for empirical data are based on the assumption that each item generates the trait-relevant information that the item parameters (e.g., factor loadings) suggest. If the response process of some individuals (i.e., those who fake) differs from the response process described by the statistical model, empirical reliabilities may overestimate or underestimate the measurement precision of a questionnaire for those individuals. Therefore, in some cases, scores can yield high-reliability estimates and still be faked at the same time.
The process described above is particularly evident in the comparison of mixed keyed questionnaires and equally keyed questionnaires in our empirical example. We assume that if answers to item pairs are faked, the Fisher information matrices of TIRT models would suggest high reliabilities based on factor loadings but that these item pairs would generate little trait-relevant information for respondents who answer socially desirable and therefore very uniformly (for a detailed discussion of this problem, see Bürkner et al., 2019; for empirical evidence, see Schulte et al., 2024).
It is also possible that faking reduces the advantages of optimized item matching based on factor loadings of items in high-stakes contexts. This undesired effect would be evident if GPCs with large factor loading differences would result in more strongly faked responses. This would lead to higher reliability estimates at the expense of faking resistance.
The opposite may be the case when items are matched based on their similarity in social desirability: It is possible that using this algorithm leads to lower reliability estimates but at the same time higher validities. In line with this line of reasoning, our results suggest that this algorithm reduces reliability. However, matching based on social desirability is known to have positive effects on the faking resistance of FC questionnaires (Cao & Drasgow, 2019; Speer et al., 2023). Based on the data of the present study, it is not possible to conclude whether the resulting validity gains can compensate for the reliability losses we have demonstrated for this method. However, evidence from binary FC questionnaires seems to be in favor of this notion. A recent study compared the reliability and validity of four different binary FC questionnaires (using triplets) and a Likert-type rating scale (Li et al., 2025). The four FC questionnaires were constructed by varying the number of unequally keyed triplets and the degree to which triples were similar in their social desirability. Similar to what we expect for GPCs, results showed that although reliabilities for the four tested FC questionnaires were lower than in the Likert-type scale, rank order stability was higher across all FC questionnaires, with the FC questionnaire with the highest degree of social desirability matching showing the best performance (Li et al., 2025).
Limitations and Future Research
First, we want to discuss limitations regarding the design of the present study. Each condition in our simulations was replicated 12 times. We chose this comparatively low number of replications to account for the high computational resources and duration that each replication required. Especially the larger models took several days to weeks to be estimated. As in previous studies (e.g., Schulte et al., 2021), we expected a low dispersion of results and therefore suggested that 12 replications would suffice. In line with this suggestion, the bulk of indicators and conditions had confidence intervals close to zero. Even though there were some exceptions, the occasional larger confidence intervals do not change the drawn conclusions meaningfully. Furthermore, our sample size conditions replicated results for each questionnaire design three times and usually did not result in any relevant differences. Likewise, even 600 replications of selected conditions (see Online Supplement B) did not lead to relevant changes in our results.
As a second limitation, we want to mention the comparability of the different factor loading conditions in our simulations. To ensure comparability with previous studies (e.g., Brown & Maydeu-Olivares, 2011; Schulte et al., 2021) factor loadings were drawn from different distribution forms and thus differ in more regards than just their mean factor loadings. The factor loadings in the realistic conditions were normally distributed with
Third, our empirical example used data from a single questionnaire study to generate several hypothetical questionnaires. However, we cannot rule out that the actual response behavior in the questionnaire designs under investigation would be different if the participants completed exactly this generated questionnaire. This applies in particular to the ex post dichotomization of responses on the graded response scale. In practice, response processes for dichotomous formats might structurally differ from those for graded response scales.
Even though the simulations in this study provide evidence in favor of graded response formats that are also supported by our empirical example, open questions remain that cannot be answered within the scope of the present research. For example, introducing the multipoint scale element into the FC format makes GPCs susceptible to response styles. While some response styles can be controlled in GPCs (e.g., acquiescence), others cannot (e.g., the tendency to middle or extreme response categories). However, evidence from a recent study investigating response styles in GPCs found that the tendency toward middle response categories was generally weak in both GPCs and Likert scales (Zhang et al., 2024a). Furthermore, when using five response categories, the tendency toward extreme response categories was weaker in GPCs than in Likert scales (Zhang et al., 2024a). Nevertheless, when looking at how these response styles influence trait score estimation, open questions remain: while researchers have a clear understanding of how response styles influence trait score estimation in Likert scales (e.g., maximum responses lead to maximum trait score estimates), this relationship is much less clear in GPCs. Thus, we suggest further examinations of specific response styles and their effects on trait scores in both high- and low-stakes settings.
Furthermore, it is still unclear how the results regarding the reliability of this study would translate into validity estimates. Considering the potential reliability–validity tradeoff detailed above, insights into the (criterion) validity of GPCs would be of great practical relevance. Though a first empirical study provides a comprehensive look into this line of research, systematic simulations of different GPC questionnaires are necessary to fully answer this question.
Finally, we would welcome further investigation of the psychological processes governing faking within GPCs. Though there are models that consider the faking process (e.g., Brown & Böckenholt, 2022), to the best of our knowledge, there is not yet a comprehensive model that considers the faking process with all its many aspects (i.e., intra- and interindividual differences regarding, if at all, to what degree, and which traits are faked). Thus, in the present study, we were unable to adequately address faking in our simulated data. However, when trying to understand GPCs in the context of high-stakes settings, faking is bound to happen. In addition to further real-world faking studies, future simulations should therefore also incorporate this aspect.
Practical Implications
Considering our results, we can cautiously recommend the use of GPCs for real-world applied contexts. Our simulations and empirical examples show that GPCs can lead to good reliabilities and normative trait scores if certain recommendations are considered. Our results suggest that both mixed keyed designs and equally keyed designs with optimized matching of items (considering both factor loading sums and factor loading differences within the pairs) can provide accurate trait estimates. However, especially in the case of mixed keyed designs, this advantage might be outweighed by a higher susceptibility to faking.
Our results suggest that test developers should choose graded response formats over binary FC formats. However, even graded FC formats (i.e., GPCs) did not reach acceptable levels of reliability and normativity in equally keyed designs with randomly combined items within the range of conditions simulated here. Thus, even for graded formats, questionnaire design is not trivial and factor loadings and their combinations have to be considered carefully. When measuring a large enough number of traits, this type of questionnaire might be able to reduce SDR while producing reliable and nearly fully normative scores and at the same time reduce some response styles compared to Likert-type scales.
Overall, before using GPCs with optimized matching for real-life purposes, we strongly recommend investigating how respondents interact with equally keyed GPCs with and without optimized matching. Furthermore, we recommend taking a closer look at the psychological processes of faking within the GPC context.
Taken together, for developing graded preference questionnaires, we can make the following general recommendations: First, we suggest using five graded response categories. This relatively low number allows for good reliabilities and reduced ipsativity. Second, we recommend optimizing the matching of items based on maximizing factor loading differences as well as factor loading sums. This will reduce the effects of faking on trait estimation and allow for good reliabilities. Third, we recommend a sufficiently large number of traits (e.g., 15 traits) with a sufficiently large number of items per trait (e.g., 10 items/trait). However, test developers have to consider the individual tradeoff between testing time and reliability, just as with any other type of questionnaire. If testing time is limited, our simulations suggest optimal results for measuring a moderate number of traits (e.g., 10) and splitting the testing time between them. Finally, our results showed that even smaller sample sizes (
Conclusion
In summary, our results showed that under the right conditions, GPCs in combination with TIRT modeling can allow for reliable and normative trait estimation. Furthermore, we identified two mechanisms that drive this result: first, the graded scale format of GPCs, and second, the optimization of item matching based on factor loadings. Both improve trait estimation immensely, independent of other design aspects. However, future research should test different optimization algorithms in applied contexts and compare faking mechanisms in GPCs and directly measured binary FC scales.
Supplemental Material
sj-dtx-1-orm-10.1177_10944281241279790 - Supplemental material for Measuring Personality When Stakes Are High: Are Graded Paired Comparisons a More Reliable Alternative to Traditional Forced-Choice Methods?
Supplemental material, sj-dtx-1-orm-10.1177_10944281241279790 for Measuring Personality When Stakes Are High: Are Graded Paired Comparisons a More Reliable Alternative to Traditional Forced-Choice Methods? by Harriet Lingel, Paul-Christian Bürkner, Klaus G. Melchers and Niklas Schulte in Organizational Research Methods
Supplemental Material
sj-png-2-orm-10.1177_10944281241279790 - Supplemental material for Measuring Personality When Stakes Are High: Are Graded Paired Comparisons a More Reliable Alternative to Traditional Forced-Choice Methods?
Supplemental material, sj-png-2-orm-10.1177_10944281241279790 for Measuring Personality When Stakes Are High: Are Graded Paired Comparisons a More Reliable Alternative to Traditional Forced-Choice Methods? by Harriet Lingel, Paul-Christian Bürkner, Klaus G. Melchers and Niklas Schulte in Organizational Research Methods
Supplemental Material
sj-pdf-3-orm-10.1177_10944281241279790 - Supplemental material for Measuring Personality When Stakes Are High: Are Graded Paired Comparisons a More Reliable Alternative to Traditional Forced-Choice Methods?
Supplemental material, sj-pdf-3-orm-10.1177_10944281241279790 for Measuring Personality When Stakes Are High: Are Graded Paired Comparisons a More Reliable Alternative to Traditional Forced-Choice Methods? by Harriet Lingel, Paul-Christian Bürkner, Klaus G. Melchers and Niklas Schulte in Organizational Research Methods
Supplemental Material
sj-pdf-4-orm-10.1177_10944281241279790 - Supplemental material for Measuring Personality When Stakes Are High: Are Graded Paired Comparisons a More Reliable Alternative to Traditional Forced-Choice Methods?
Supplemental material, sj-pdf-4-orm-10.1177_10944281241279790 for Measuring Personality When Stakes Are High: Are Graded Paired Comparisons a More Reliable Alternative to Traditional Forced-Choice Methods? by Harriet Lingel, Paul-Christian Bürkner, Klaus G. Melchers and Niklas Schulte in Organizational Research Methods
Supplemental Material
sj-pdf-5-orm-10.1177_10944281241279790 - Supplemental material for Measuring Personality When Stakes Are High: Are Graded Paired Comparisons a More Reliable Alternative to Traditional Forced-Choice Methods?
Supplemental material, sj-pdf-5-orm-10.1177_10944281241279790 for Measuring Personality When Stakes Are High: Are Graded Paired Comparisons a More Reliable Alternative to Traditional Forced-Choice Methods? by Harriet Lingel, Paul-Christian Bürkner, Klaus G. Melchers and Niklas Schulte in Organizational Research Methods
Supplemental Material
sj-pdf-6-orm-10.1177_10944281241279790 - Supplemental material for Measuring Personality When Stakes Are High: Are Graded Paired Comparisons a More Reliable Alternative to Traditional Forced-Choice Methods?
Supplemental material, sj-pdf-6-orm-10.1177_10944281241279790 for Measuring Personality When Stakes Are High: Are Graded Paired Comparisons a More Reliable Alternative to Traditional Forced-Choice Methods? by Harriet Lingel, Paul-Christian Bürkner, Klaus G. Melchers and Niklas Schulte in Organizational Research Methods
Supplemental Material
sj-pdf-7-orm-10.1177_10944281241279790 - Supplemental material for Measuring Personality When Stakes Are High: Are Graded Paired Comparisons a More Reliable Alternative to Traditional Forced-Choice Methods?
Supplemental material, sj-pdf-7-orm-10.1177_10944281241279790 for Measuring Personality When Stakes Are High: Are Graded Paired Comparisons a More Reliable Alternative to Traditional Forced-Choice Methods? by Harriet Lingel, Paul-Christian Bürkner, Klaus G. Melchers and Niklas Schulte in Organizational Research Methods
Supplemental Material
sj-pdf-8-orm-10.1177_10944281241279790 - Supplemental material for Measuring Personality When Stakes Are High: Are Graded Paired Comparisons a More Reliable Alternative to Traditional Forced-Choice Methods?
Supplemental material, sj-pdf-8-orm-10.1177_10944281241279790 for Measuring Personality When Stakes Are High: Are Graded Paired Comparisons a More Reliable Alternative to Traditional Forced-Choice Methods? by Harriet Lingel, Paul-Christian Bürkner, Klaus G. Melchers and Niklas Schulte in Organizational Research Methods
Supplemental Material
sj-pdf-9-orm-10.1177_10944281241279790 - Supplemental material for Measuring Personality When Stakes Are High: Are Graded Paired Comparisons a More Reliable Alternative to Traditional Forced-Choice Methods?
Supplemental material, sj-pdf-9-orm-10.1177_10944281241279790 for Measuring Personality When Stakes Are High: Are Graded Paired Comparisons a More Reliable Alternative to Traditional Forced-Choice Methods? by Harriet Lingel, Paul-Christian Bürkner, Klaus G. Melchers and Niklas Schulte in Organizational Research Methods
Supplemental Material
sj-pdf-10-orm-10.1177_10944281241279790 - Supplemental material for Measuring Personality When Stakes Are High: Are Graded Paired Comparisons a More Reliable Alternative to Traditional Forced-Choice Methods?
Supplemental material, sj-pdf-10-orm-10.1177_10944281241279790 for Measuring Personality When Stakes Are High: Are Graded Paired Comparisons a More Reliable Alternative to Traditional Forced-Choice Methods? by Harriet Lingel, Paul-Christian Bürkner, Klaus G. Melchers and Niklas Schulte in Organizational Research Methods
Footnotes
Acknowledgment
The authors acknowledge support by the state of Baden-Württemberg through bwHPC.
Author contributions
The authors made the following contributions. Harriet Lingel: writing—original draft and investigation; Paul-Christian Bürkner: software and writing—review and editing; Klaus G. Melchers: writing—review and editing; Niklas Schulte: conceptualization and writing—review and editing.
Declaration of Conflicting Interests
The authors declared no potential conflicts of interest with respect to the research, authorship, and/or publication of this article.
Funding
The authors received no financial support for the research, authorship, and/or publication of this article.
Notes
Author Biographies
References
Supplementary Material
Please find the following supplemental material available below.
For Open Access articles published under a Creative Commons License, all supplemental material carries the same license as the article it is associated with.
For non-Open Access articles published, all supplemental material carries a non-exclusive license, and permission requests for re-use of supplemental material or any part of supplemental material shall be sent directly to the copyright owner as specified in the copyright notice associated with the article.