
Abstract
We know very little about the performance measures executives use to make decisions. To fill this void, we investigate the performance variables that executives reference in corporate filings with the SEC. Our analyses suggest that executives refer to monetary variables (i.e., revenue, profit, and cash flow) in over 98% of filings. In contrast, executives refer to the unitless performance measures scaled by size (i.e., return on assets, return on equity), which are favored by organizational scholars, in less than 15% of filings. We find that this preference for unscaled measures remains across market capitalization and actual firm performance. In other words, even observations with the highest levels of ROA and ROE are more likely to include monetary measures as opposed to ratios. In fact, we find that almost every observation that references ratios also includes monetary measures of firm performance. Stated differently, our findings suggest executives use ratios in addition to—and not instead of—monetary measures. We discuss research opportunities for scholars to further align with the practitioner perspective and to revisit conceptualizations of firm performance.
The field of strategic management is defined not by any particular theoretical paradigm, but rather by its focus on a particular dependent variable—overall organizational performance. Makadok et al. (2018, p. 1530).
Firm performance is perhaps the key conceptual element of scholarly definitions of strategic management (e.g., Nag et al., 2007). Despite an array of reviews of how scholars measure firm performance (e.g., Hamann et al., 2013; Richard et al., 2009), we have scant knowledge regarding how executives conceive of or communicate about firm performance (Obloj & Sengul, 2020). This lack of understanding is surprising, because as Bromiley and Harris (2014, p. 338) suggest, “paradigms that attempt to explain strategic behavior must make some assumptions about how managers evaluate firm performance.” Simply stated, how can researchers deliver practically relevant findings without knowing which performance measures drive executive decision making?
The objective of this paper is to investigate how executives operationalize firm performance. Specifically, we examine how executives reference financial performance when communicating with investors. To be sure, measuring the cognitions of top executives represents an enormous challenge for researchers (Cho & Hambrick, 2006; Surroca et al., 2016). To overcome this challenge, although imperfectly, researchers have examined publicly available regulatory documents such as annual reports and proxy statements (Guo et al., 2017; Nadkarni et al., 2016). Following this tradition, we conducted content analysis, based on an updated list of performance measures developed by Wade et al. (1997), to calculate references to firm performance across three different sources: annual reports (10-Ks), proxy statements, and earnings calls with financial analysts.
We first examined the Management Discussion and Analysis (MD&A) sections of annual reports, which are regulated by the SEC and ask executives to “include a discussion of key variables and financial measures management is utilizing in managing the business” (SEC, 2008). While researchers have examined various characteristics of MD&A sections (readability, sentiment, etc.), we believe this is the first attempt to categorize the performance measures referenced by executives. Relying on a sample of 11,989 10-Ks for the years 2010 through 2019 for firms in the S&P 1500, we found that executives referenced a variety of performance measures that are not often used by researchers in their empirical tests of organizational theories.
Our primary finding is that executives most often referenced unscaled (monetary) variables when discussing firm performance. This differs dramatically from findings that researchers largely use ratios (ROA, ROI, etc.) when operationalizing firm performance (Wibbens & Siggelkow, 2020). Specifically, we found that the three most popular measures used by executives were: revenue, cash flow, and profits. In contrast, ROA—the most popular ratio used by researchers to operationalize firm performance (Bromiley & Harris, 2014; Wibbens & Siggelkow, 2020)—was mentioned in only 14% of 10-Ks. Moreover, nearly every reference to ratios occurred in 10-Ks that also referenced unscaled variables such as profits and revenues. This suggests that, when discussing performance, executives use ratios in addition to and not instead of monetary measures.
This preference for unscaled performance measures remained across a variety of subgroups. We found, for instance, that executives preferred unscaled measures regardless of whether firms were members of the S&P 500, S&P MidCap 400, or the S&P SmallCap 600. We also found that this preference for unscaled measures remained regardless of how firms performed across different performance measures. For example, observations in the highest performing quintile as measured by ROA referenced unscaled measures in approximately 99% of 10-Ks while mentioning ROA in only approximately 11% of 10-Ks. Additionally, our cross-industry comparison suggests that the frequent use of the unscaled measures is consistent across industries, though we describe some instances where ratios appear more frequently (e.g., banking, transportation, gas and sanitary service industries).
To examine the extent to which the use of unscaled measures extends beyond 10-Ks, we also analyzed proxy statements and earnings calls with financial analysts. We examined the portions of proxy statements discussing executive compensation, as the SEC requires companies to disclose the relationship between executive compensation and corporate performance (SEC, 2007); these sections provide some insight regarding the incentives that drive executive decision making. The earnings calls allow us to investigate the extent to which executives reference performance measures when responding to questions from analysts. In both contexts, the results support our finding that unscaled measures of performance are more prominent than scaled measures.
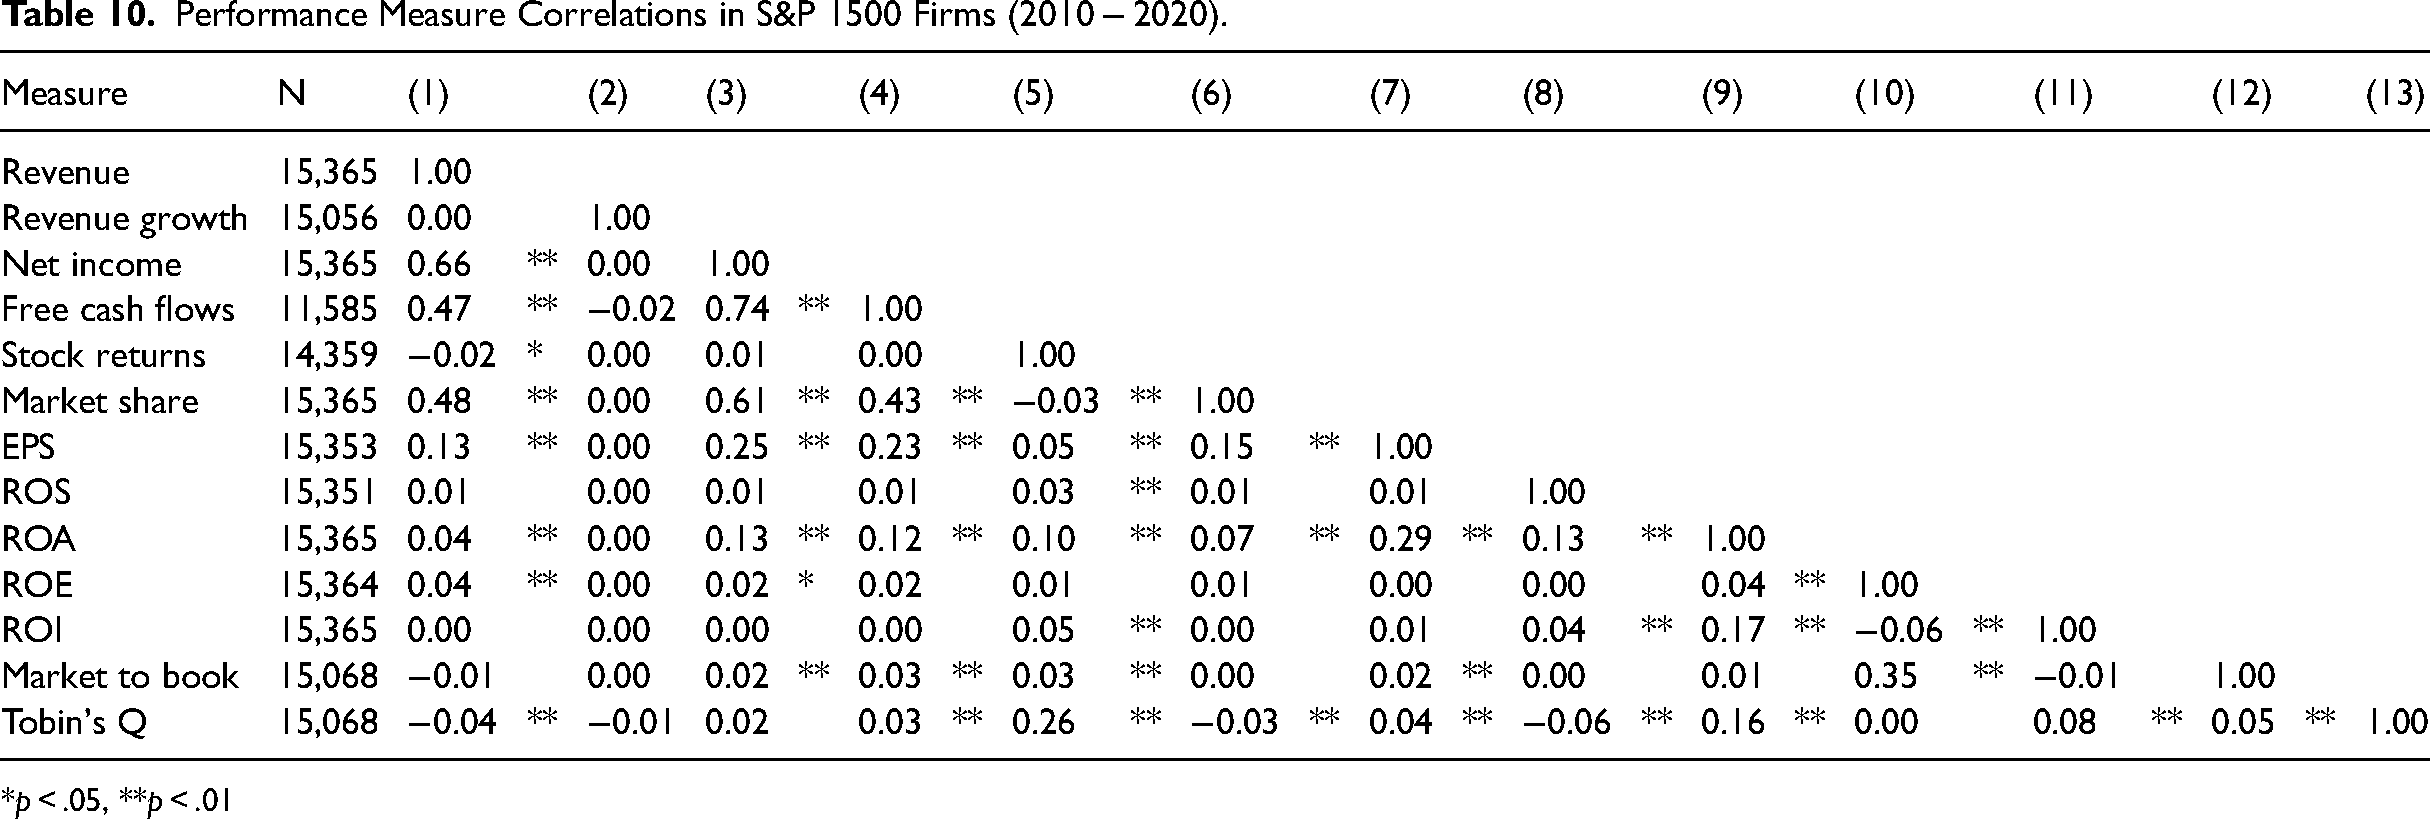
Our findings build on prior research examining firm performance measures by showing not only which performance measures are frequently referenced by executives but also how they differ from the performance measures most commonly employed by strategy researchers (e.g., Hamann et al., 2013; Miller et al., 2013; Wibbens & Siggelkow, 2020). In Table 10, we report only negligible correlations between financial ratios and their unscaled counterparts. For instance, the correlation between ROA and net income in our sample was 0.13 (p < .01). We also used mixed models to compare the ranked random intercepts of firms using ROA versus net income as dependent variables. This analysis resulted in two dramatically different lists of top performing firms.
Our results highlight potential content validity issues regarding the firm performance construct. Content validity exists when measures reflect underlying theoretical constructs (Cortina et al., 2020). According to Schwab (2005, p. 31), “a measure is content valid when its items are judged to accurately reflect the domain of the construct as defined conceptually.” While there are multiple approaches to assessing content validity, the key is to identify whether (or the extent to which) multiple items reflect a theoretical construct. For example, Colquitt et al. (2019) review two different approaches to assess the content validity of new scales, both of which use judges to assess whether (or the extent to which) multiple items reflect theoretical constructs.
Broadly speaking, our study involves using existing documents to assess how two different sets of judges—executives and academics—utilize different measures to reference firm performance. From a measurement perspective, what makes our findings problematic is that the items in these two sets are largely uncorrelated. A key tenet of measurement theory is that items measuring a construct should be highly correlated (Cortina et al., 2020). Colquitt et al. (2019, p. 1259) suggest that “constructs obviously lay at the core of theorizing…items that tap those constructs, in turn, lays at the core of measurement.” These minimal correlations, then, suggest that executives and academics use measures that may assess different theoretical constructs.
The lack of substantive relationships among these variables is particularly problematic in strategy research, which often relies on single items to measure constructs (Boyd et al., 2013). While previous research has suggested that regressions using ratios as variables report inconsistent parameter estimates that differ greatly from those using unscaled measures (Certo et al., 2020), we highlight the additional potential for theoretical inconsistencies regarding the firm performance construct posed by the use of these measures. Stated differently, our findings raise questions regarding whether the variables favored by academics accurately reflect the domain of the firm performance construct as defined by the executives who are charged with making decisions to influence firm performance (e.g., Schwab, 2005).
If firm performance is perhaps the defining characteristic of strategic management research, it is critical to determine whether researchers think of performance in the same way as executives. In one of the earliest strategic management publications, Lenz (1980, p. 214) suggested that ROA “is a relatively comprehensive measure that is widely used as a performance objective by industry executives.” While this may have been true 40 years ago, our findings suggest this has not been true over the last decade. Our evidence suggests that strategy scholars may benefit from revisiting the first stage of the firm performance construct to define what firm performance is and what it is not (Cortina et al., 2020). In fact, Hamman et al.'s (2013) study of the construct validity of firm performance identified multiple dimensions of firm performance, but their study included only ratios and stock market measures—and not any of the monetary variables that, as identified in this study, are favored by executives. By pivoting to examine the other performance measures more widely used by executives, we can work to ensure that scholars and executives are speaking the same language.
Firm Performance
Background
Researchers in strategic management have long recognized the prominence of firm performance in the field's development. In their seminal article written over 30 years ago, Venkatraman and Ramanujam (1986, p. 801) suggested that “performance improvement is at the heart of strategic management.” More recently, Wibbens and Siggelkow (2020, p. 870) stated that “explaining organizational performance is at the heart of the strategy literature.”
Due to its prominence, strategy scholars have examined the drivers of performance differentials for decades. While early research focused on how industry factors influenced firm performance (e.g., Porter, 1980), later research advanced to incorporate internal factors such as resources (e.g., Barney, 1991) and dynamic capabilities (e.g., Teece et al., 1997). At the same time, research suggests a feedback effect of performance, whereby past performance and peer performance may influence subsequent executive decision making (Cyert & March, 1963). Taken together, these perspectives and others have driven hundreds of studies using firm performance as dependent, independent, and control variables to test theoretical relationships.
Types of Performance Measures
Despite the importance of firm performance in strategy research, researchers have long recognized a wide array of issues regarding its measurement. Although researchers have relied on subjective and abstract conceptualizations of firm performance in their theory building, the majority of research uses one or two specific measures of accounting and/or stock market performance (Miller et al., 2013; Richard et al., 2009). Nevertheless, “there is no singular measure of performance that is without limitations” (Richard et al., 2009: 738).
To this end, researchers have argued that performance is a latent construct with a variety of operationalizations (Miller et al., 2013). For the most part, these performance measures include ratios where researchers scale measures of profitability by proxies for firm size such as assets or sales (Hamann et al., 2013). At the same time, though, scholars have also used measures of firm growth or stock market appreciation to operationalize firm performance (Miller et al., 2013). Nevertheless, studies indicate that correlations among these different measures are often negligible, suggesting the importance of considering the measures that are most consistent with and appropriate for the theoretical conceptualizations at hand (Miller et al., 2013).
In addition to the lack of relatedness among these different performance measures, some operationalizations are prone to statistical problems. Certo et al. (2020) used simulations and found that using ratios to operationalize firm performance may lead to inconsistent parameter estimates. In particular, the authors found that simply altering the distribution of the denominator of a ratio influences parameter estimates—even when the underlying correlations of the unscaled variables remained constant. These inconsistencies were most pronounced when using ratios as dependent variables, which is the exact situation that occurs when researchers create statistical models to explain variation in ROA.
Executive Perceptions and Firm Performance
In addition to the statistical issues involved with measuring firm performance, there is little evidence regarding which measures top executives actually use to make decisions. Top executives are responsible for the overall performance of their firms (Hambrick & Mason, 1984). Since the introduction of the upper echelons theory, researchers have examined how a variety of executive choices involving innovation (Barker & Mueller, 2002), mergers and acquisitions (Gamache et al., 2015; Kim et al., 2015), and capital expenditures (Cho & Hambrick, 2006) influence firm performance. The number of such studies and the overall impact of Hambrick and Mason's (1984) original work support Pitcher and Smith's (2001, p. 1) contention that “[t]here are few more important subjects to strategy scholars, or for that matter to practitioners, than the link between the people at the strategic apex of the organization and that organization's performance.”
The implicit assumption in research on firm performance is that researchers both understand and use in empirical tests the performance measures that executives consider when making decisions. Although prior research indicates that scholars typically rely on ratios (e.g., ROA, ROE, etc.) to operationalize firm performance (Wibbens & Siggelkow, 2020), knowledge about the performance measures used by executives is largely unknown. If executives are not using the same measures when making decisions, it will make it more difficult for researchers to understand the drivers or implications of firm performance.
An example may help to explain the intuition of this potential problem. Suppose that a team of researchers conducted a study to investigate the predictors of scholarly performance, which they operationalized as the number of publications in Harvard Business Review (HBR). If the authors in the hypothetical sample agree that publications in HBR represents the primary performance goal when allocating their resources (e.g., time, effort, etc.), then this test will be appropriate. If the authors instead allocate their resources toward publishing in other outlets, however, the results will be misleading. Just as our hypothetical researchers must understand which journals authors aspire to publish in, we must understand the performance metrics that executives use when making decisions about resource allocation.
Measuring Executive Cognition Through Public Documents
Research on managerial cognition (Walsh, 1995) highlights how executives might process information about firm performance. Organizational researchers have used the context of publicly traded firms to assess executive cognition (Flammer, 2015; Park & Westphal, 2013). For such firms, communicating with outsiders about firm performance represents a key responsibility of executives. Although the firm has many stakeholders, there is perhaps no stakeholder group that is more concerned with information about firm performance than shareholders, as changes in firm performance influence perceptions of shareholder value (Anthony & Ramesh, 1992; Daniel & Titman, 2006). Accordingly, scholars in a variety of disciplines have studied how executives communicate with shareholders (e.g., Brown & Tucker, 2011; Price et al., 2012).
Analyzing the content of corporate public filings and communications, such as annual reports, proxy statements, and earnings calls transcripts, provides researchers with an avenue to assess managerial cognition. Annual 10-K reports play an especially prominent role in communicating information about firm performance to a wider range of outsiders (e.g., shareholders, bondholders, and financial analysts) as the reports provide “a comprehensive overview of the company's business and financial condition” (SEC, 2009). In particular, the MD&A is one of the most read and most important components of an annual report (Tavcar, 1998). MD&A disclosures allow “investors to see the company through the eyes of management” (SEC, 2003). The SEC provides information to companies regarding MD&As (SEC, 2008). The SEC includes several “General Requirements” for firms to address. The first two items are perhaps the most important: (1) Liquidity and Capital Resources and (2) Results of Operations. Nevertheless, managers have a great deal of discretion with respect to the language, format, and content of the disclosures, and prior studies have discovered heterogeneity in these MD&A disclosures (Brown & Tucker, 2011; Davis & Tama-Sweet, 2012).
Because of their importance, MD&As are widely used in academic research. Accounting and finance scholars often use MD&As to understand how managerial narratives of firm performance and financials affect investors and analysts (Brown & Tucker, 2011; Clarkson et al., 1994; Cohen et al., 2020; Li, 2008). For instance, scholars have examined the characteristics of the corporate filings themselves, including the sentiment (Tetlock et al., 2008), readability, structure, and discourse employed (Mayew & Venkatachalam, 2012; Qian, 2020). More recently, organizational scholars have used MD&A disclosures to assess top executives’ attention and cognitive focus (Flammer, 2015; Nadkarni et al., 2016) as well as their perceptions of firm operations and performance (Guo et al., 2017; Nadkarni et al., 2016).
Identifying Firm Performance Measures in MD&As
Despite the research on MD&As across various disciplines, there is surprisingly little research that we know of that examines how executives describe or operationalize firm performance when communicating with investors. A primary component of the MD&A section involves a discussion of the “Results of Operations.” In fact, the SEC provides specific guidance to executives when writing this section (SEC, 2008): In providing this analysis, registrants may find it helpful to include a discussion of key variables and financial measures management is utilizing in managing the business. These variables may be non-financial in nature or may represent industry specific metrics.
Stated differently, the SEC allows executives some latitude in selecting and reporting the measures of performance they deem most important. This section, then, provides an opportunity for us to pursue the following research question: Research Question: Which measures are most widely used by executives when communicating firm performance through publicly filed annual reports?
Methodology
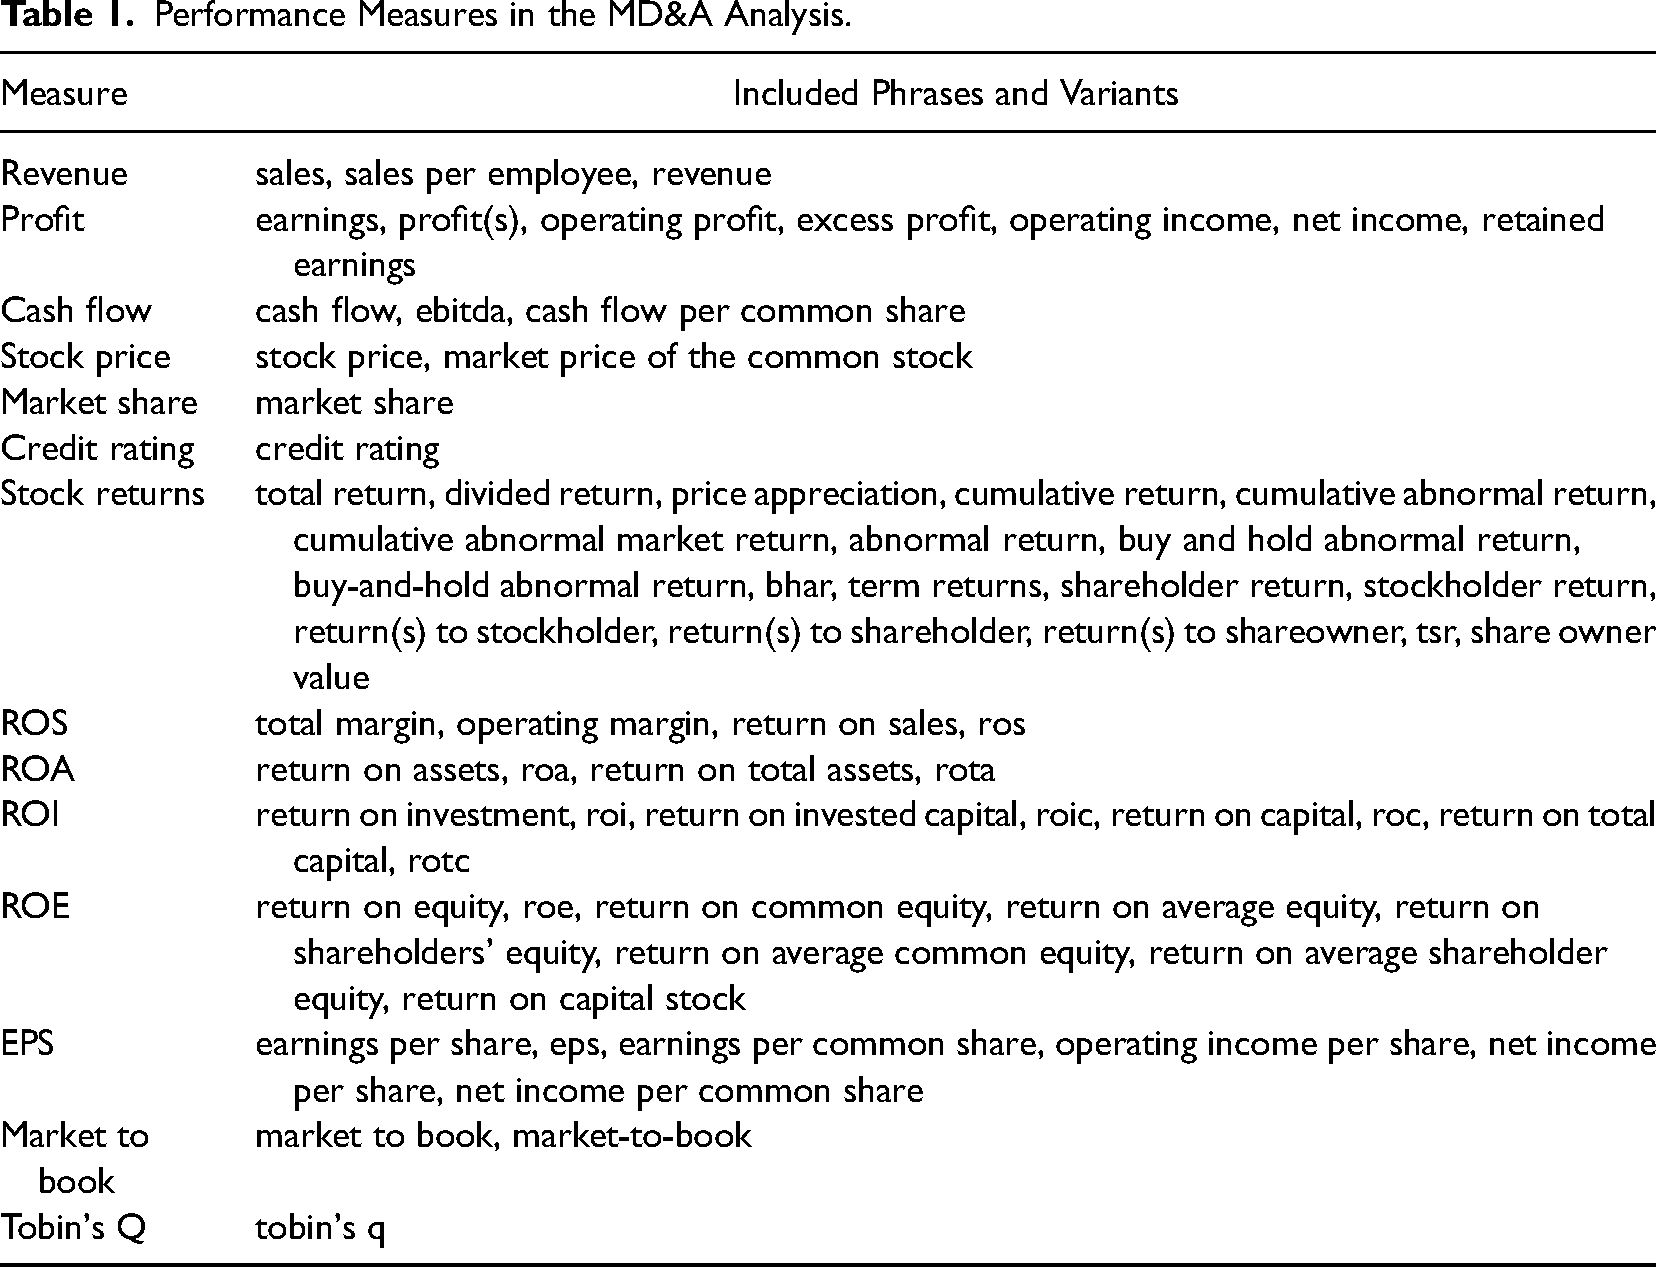
Our primary sample consists of annual reports from S&P 1500 firms for the years 2010 through 2019. We first downloaded all 10-K filings from SEC (EDGAR database) in our sample period and parsed the MD&A sections (i.e., Item 7) using the -edgar- package in R. For each firm-year observation in our sample, we assessed whether each performance measure was referenced in the MD&A section. To construct a comprehensive list of performance measures, we started with the performance measures identified in the proxy statement analysis by Wade et al. (1997). To this we added a number of measures that are widely used by practitioners and scholars (e.g., Market to book, Tobin's Q). Table 1 presents the performance measures and categorization system used in our analyses. We excluded those MD&A observations with fewer than 100 words, because those MD&A sections typically referred readers to other filing items (e.g., financial statements, and supplementary documents) without any description of firm performance (1,082 observations). Then, we collected financial information for the S&P 1500 firms in the sample period from Compustat database and merged it with the 10-K data from the SEC. This resulted in a total sample size of 11,989 observations.
Performance Measures in the MD&A Analysis.
Results
Performance Measures by S&P Classification
Table 2 presents the percentage of the observations (i.e., 10-K filings) mentioning each performance measure. The first column presents the overall percentage of the 10-K filings of the S&P 1500 firms referencing each performance measure, and the second to fourth columns report the percentage of the 10-K filings by the S&P classifications: S&P 500, S&P MidCap 400, and S&P SmallCap 600. The last two columns report the results of chi-squared tests to see whether the subgroups are statistically different from each other in referencing each performance measure.
Percent of the MD&A Sections Referencing Performance Measures by S&P Classification.
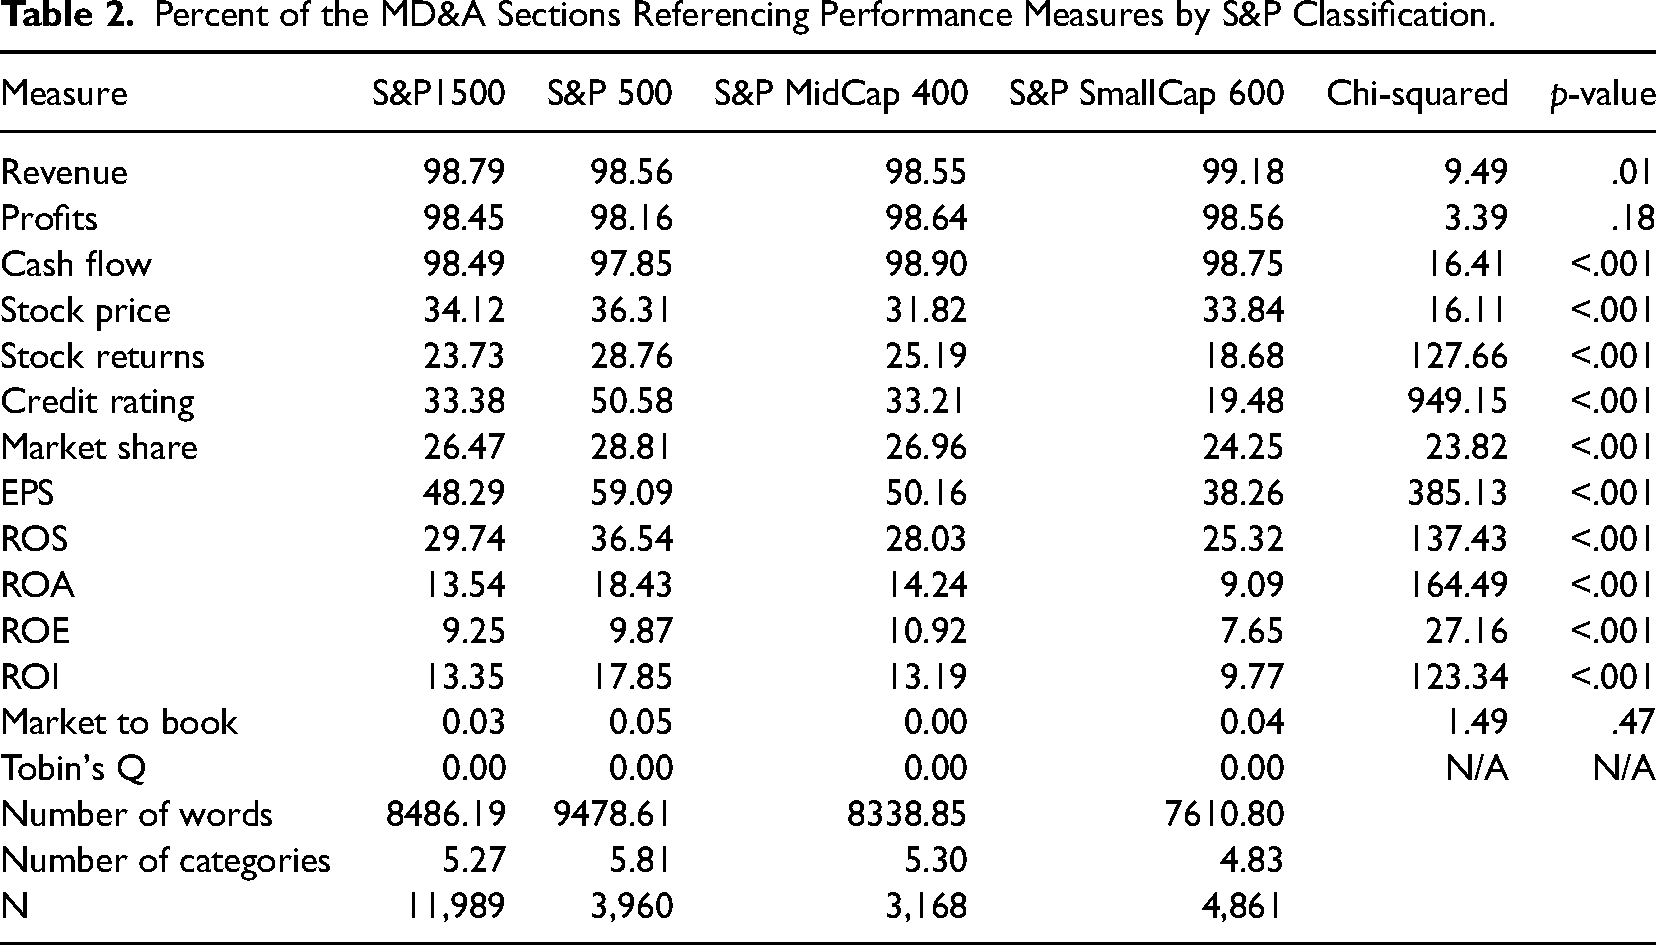
As shown in Table 2, revenue, profits, and cash flow are referenced in nearly all 10-K filings in the sample (98.79%, 98.45%, and 98.49%, respectively). Other measures are referenced in fewer than half of the observations. After revenue, profits, and cash flow, the next most popular measure, earnings per share (EPS), is referenced in 48.29% of the observations. Table 2 also demonstrates that the differences in references to unscaled measures (i.e., revenue, profits, and cash flow) across the S&P categories are less significant than for the other measures. For instance, profits are referenced in 98.16% of the observations of the S&P 500 firms, 98.64% of the observations of the S&P MidCap 400 firms, and 98.56% of the observations of the S&P SmallCap 600 firms. Thus, the chi-squared value comparing the reference of the measure is small and statistically less significant, despite the large sample size (3.39; p = .18).
It is particularly notable that some of the ratio measures most widely used by strategy scholars are among the least referenced measures by executives. For instance, ROA (ROE) is referenced in only 13.54% (9.25%) of the observations. We also found that some of the less popular measures are more preferred by S&P 500 firms. For instance, 50.58% of the observations of the S&P 500 firms referenced credit rating in their MD&A section, compared to only 19.48% of the observations of the S&P SmallCap 600 firms. Except for ROE, nearly all of the less popular measures are more frequently mentioned in the MD&A sections of the S&P 500 firms as compared to other subgroups.
However, this trend appears to be consistent with the length and coverage of the MD&A sections, reported in Table 2 (number of words and categories). The MD&A sections of the S&P500 firms, on average, have 1,399.77 more words than those of the S&P MidCap 400 firms (t = 9.92, p < .001), and the MD&A sections of the S&P MidCap 400 firms have 728.05 more words than those of the S&P SmallCap 600 firms (t = 7.42, p < .001). Also, the MD&A sections of the S&P 500 firms generally reference a greater number of performance measures (5.81 measures) than those of the S&P 400 (5.31; t = 12.84, p < .001) and S&P 600 firms (4.83; t = 13.50, p < .001) in their MD&A sections. Overall, the unscaled measures are used regardless of market capitalization, and larger firms tend to include more measures, including ratio measures.
Performance Measures Over Time
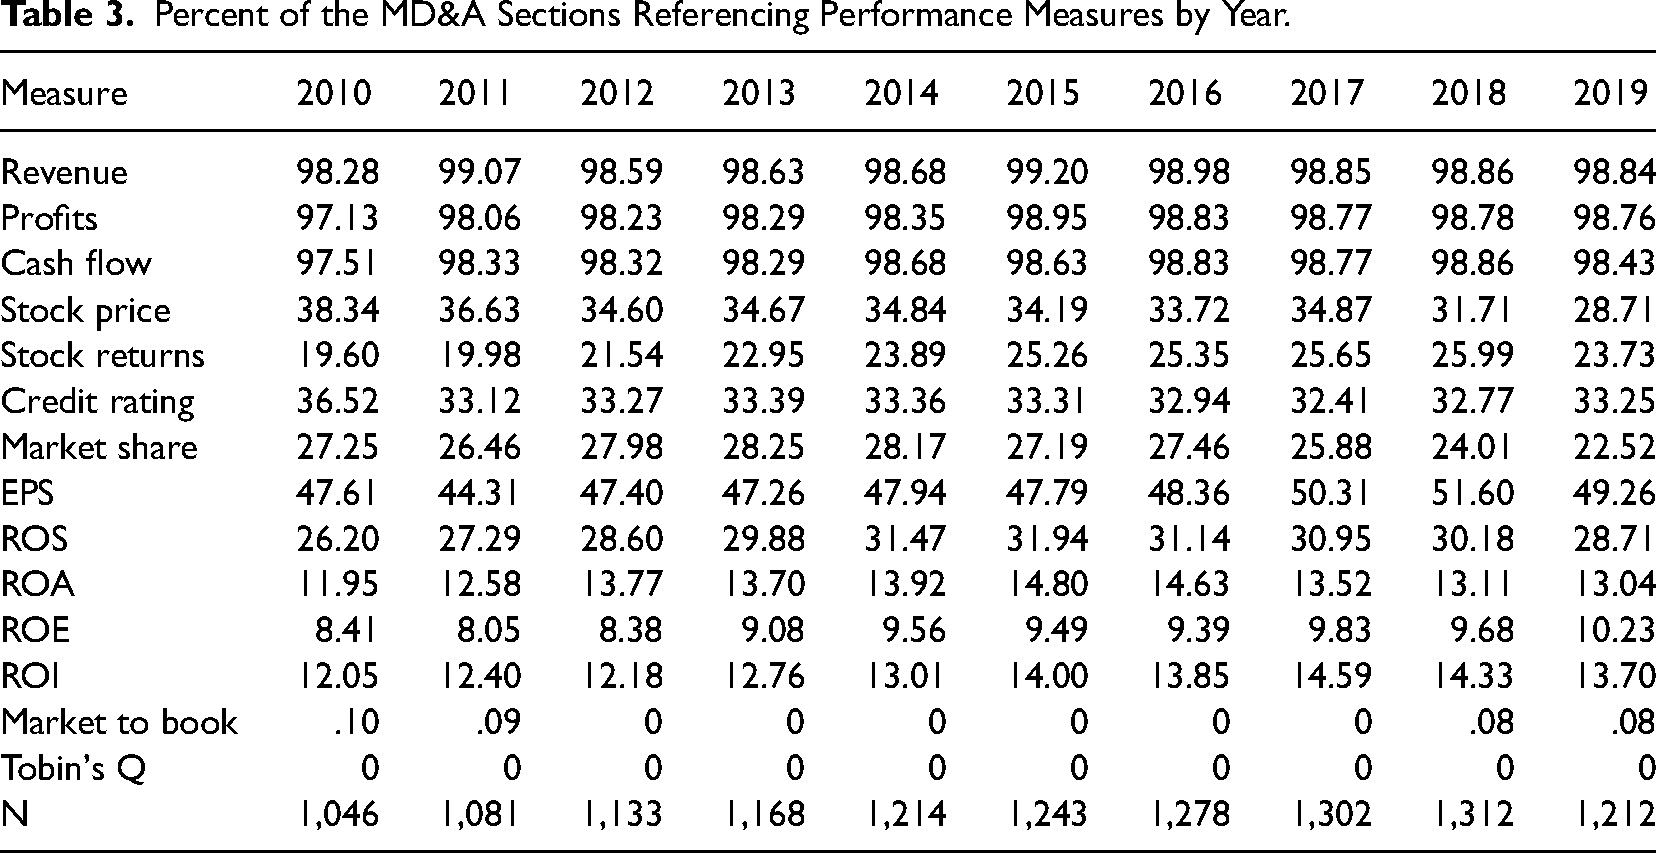
To understand the extent to which references to performance measures change over time, we compared the frequencies by year. As shown in Table 3, the frequencies are remarkably stable over time, which suggests that there is no significant temporal change in how executives interpret and disclose firm performance. The top three measures (revenue, profits, and cash flow) consistently appeared in approximately 98% of observations over time. In addition, the rank order of the performance measures in each year remains stable over time.
Percent of the MD&A Sections Referencing Performance Measures by Year.
Joint Mentions of Performance Measures
We also examined the extent to which 10-Ks include scaled measures (e.g., EPS, ROA, ROS, and ROI) instead of unscaled measures (e.g., net income). To do this, we created a joint appearance matrix of the performance measures, as reported in Table 4. The cells in the diagonal of this table represent the total references to each measure, and the remaining cells represent the number of times that an observation included both performance measures. For example, of 11,846 observations mentioning revenues, 1,623 observations also mentioned ROA.
Joint Appearance Matrix.
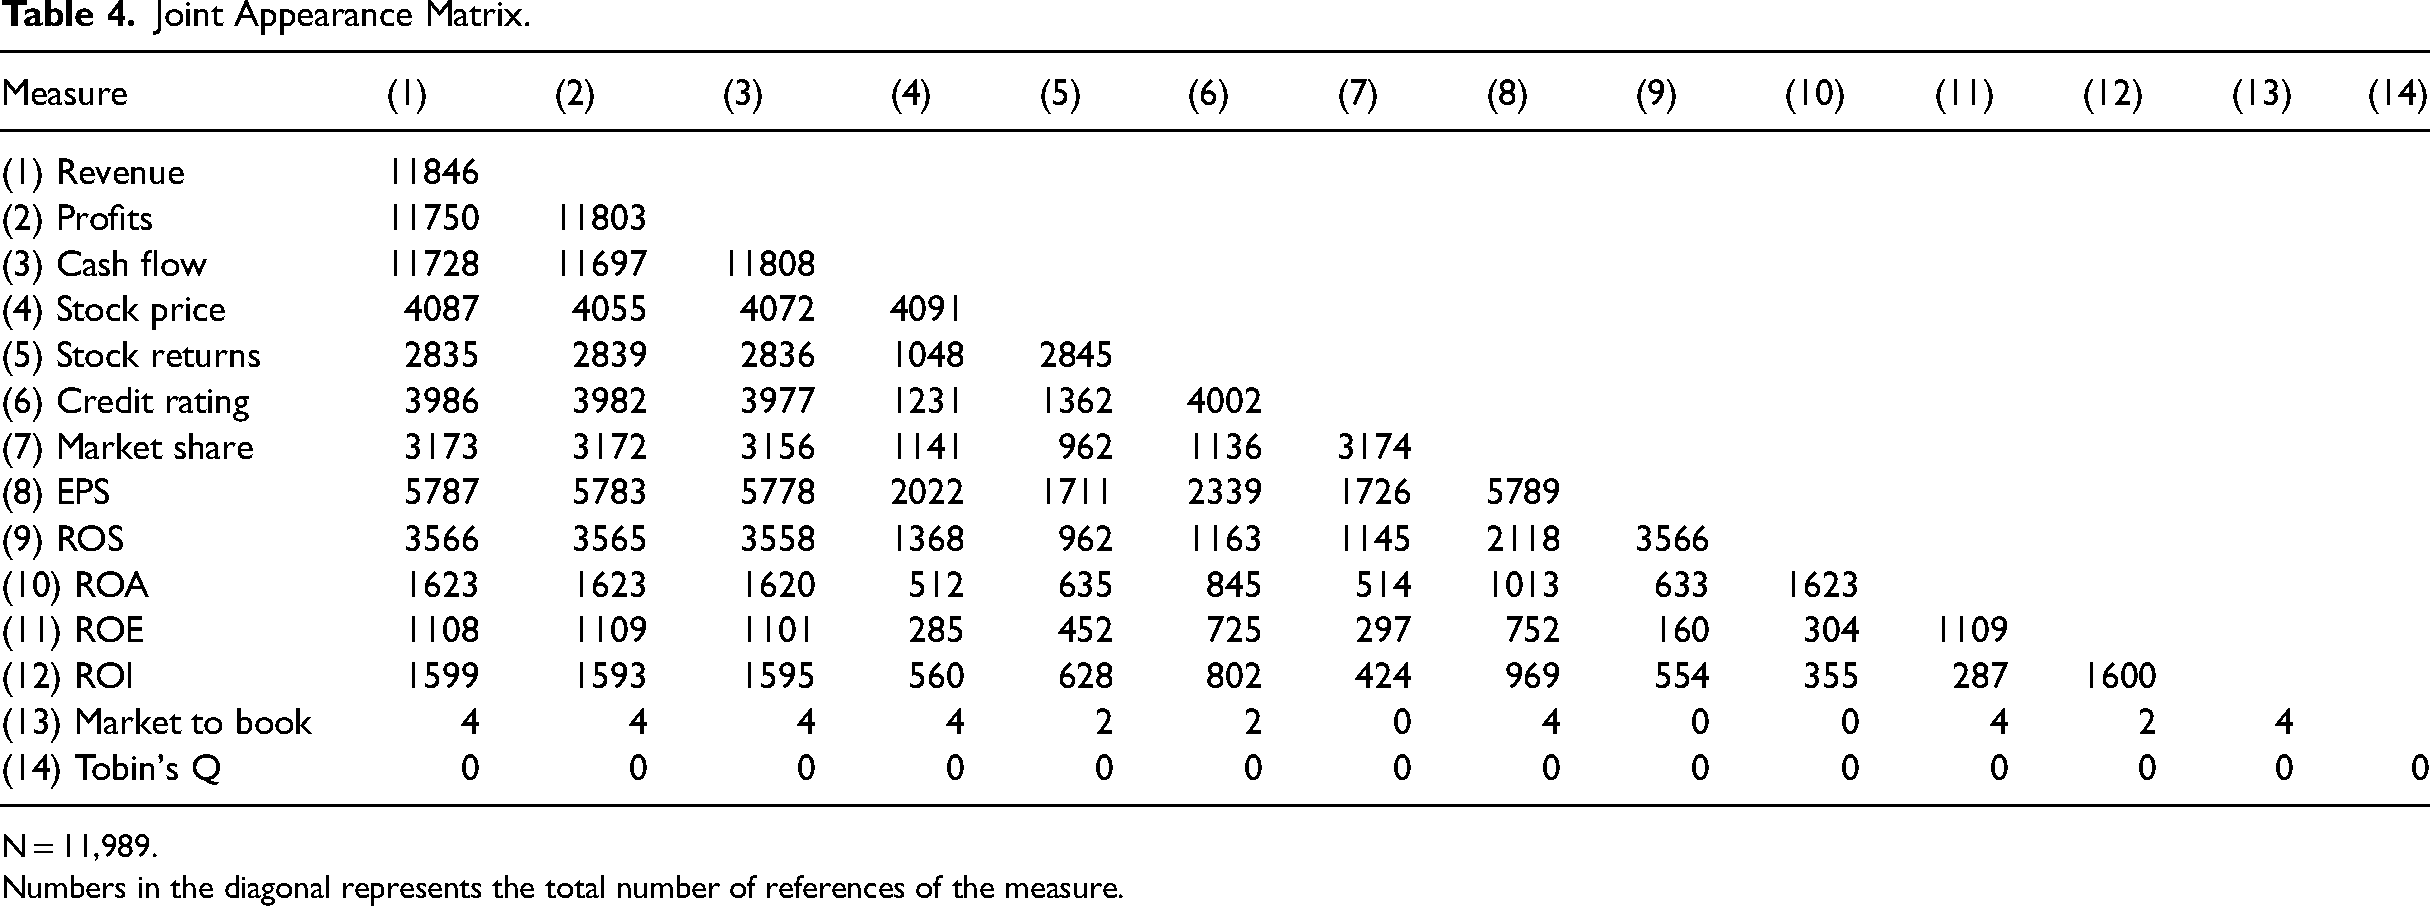
N = 11,989.
Numbers in the diagonal represents the total number of references of the measure.
According to Table 4, 100% of the MD&As referencing ROA and ROE also referenced profits. Also, 99.90%, 99.97%, and 99.56% of the MD&As referencing EPS, ROS, and ROI, respectively, referenced profits as well. In sum, this table illustrates that those observations including scaled (i.e., ratio) measures (EPS, ROA, ROS, and ROI) reference them in addition to—and not instead of—unscaled measure (profits).
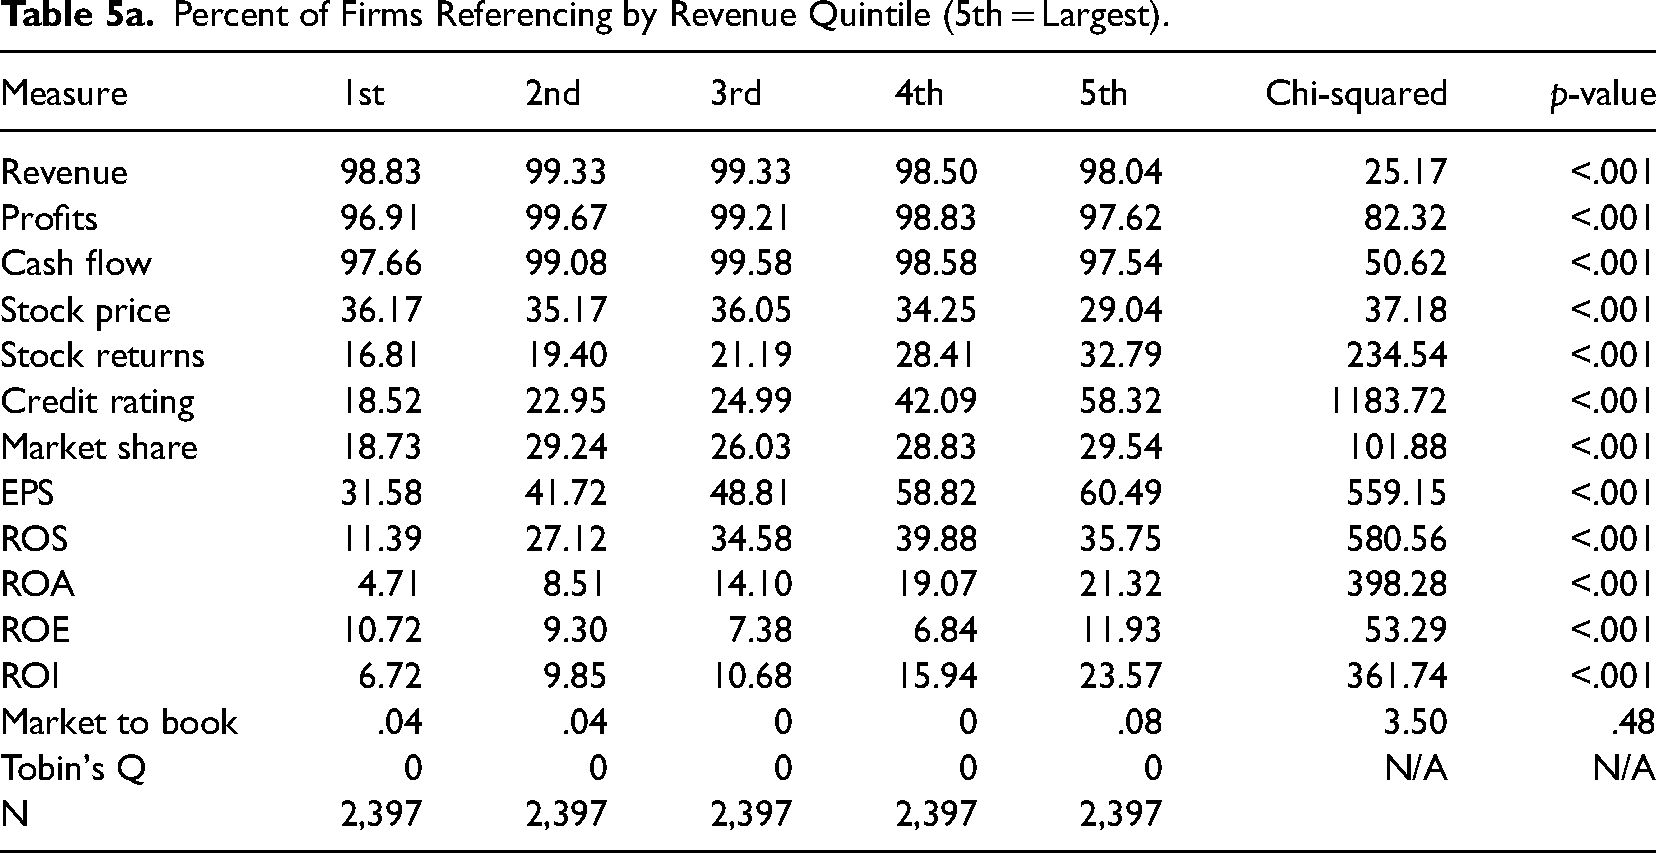
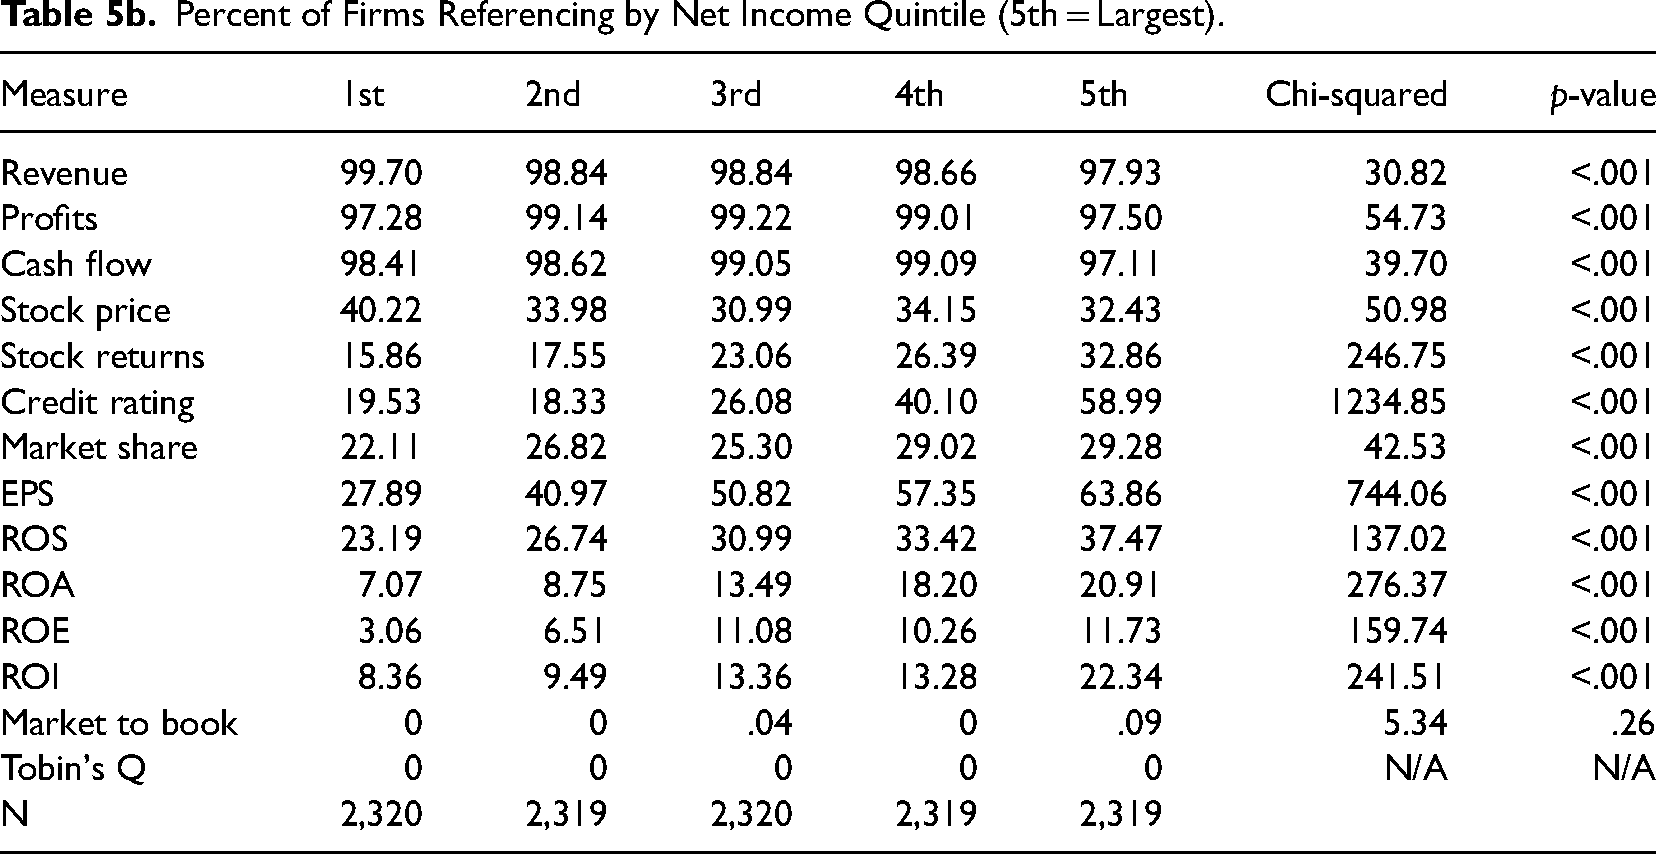
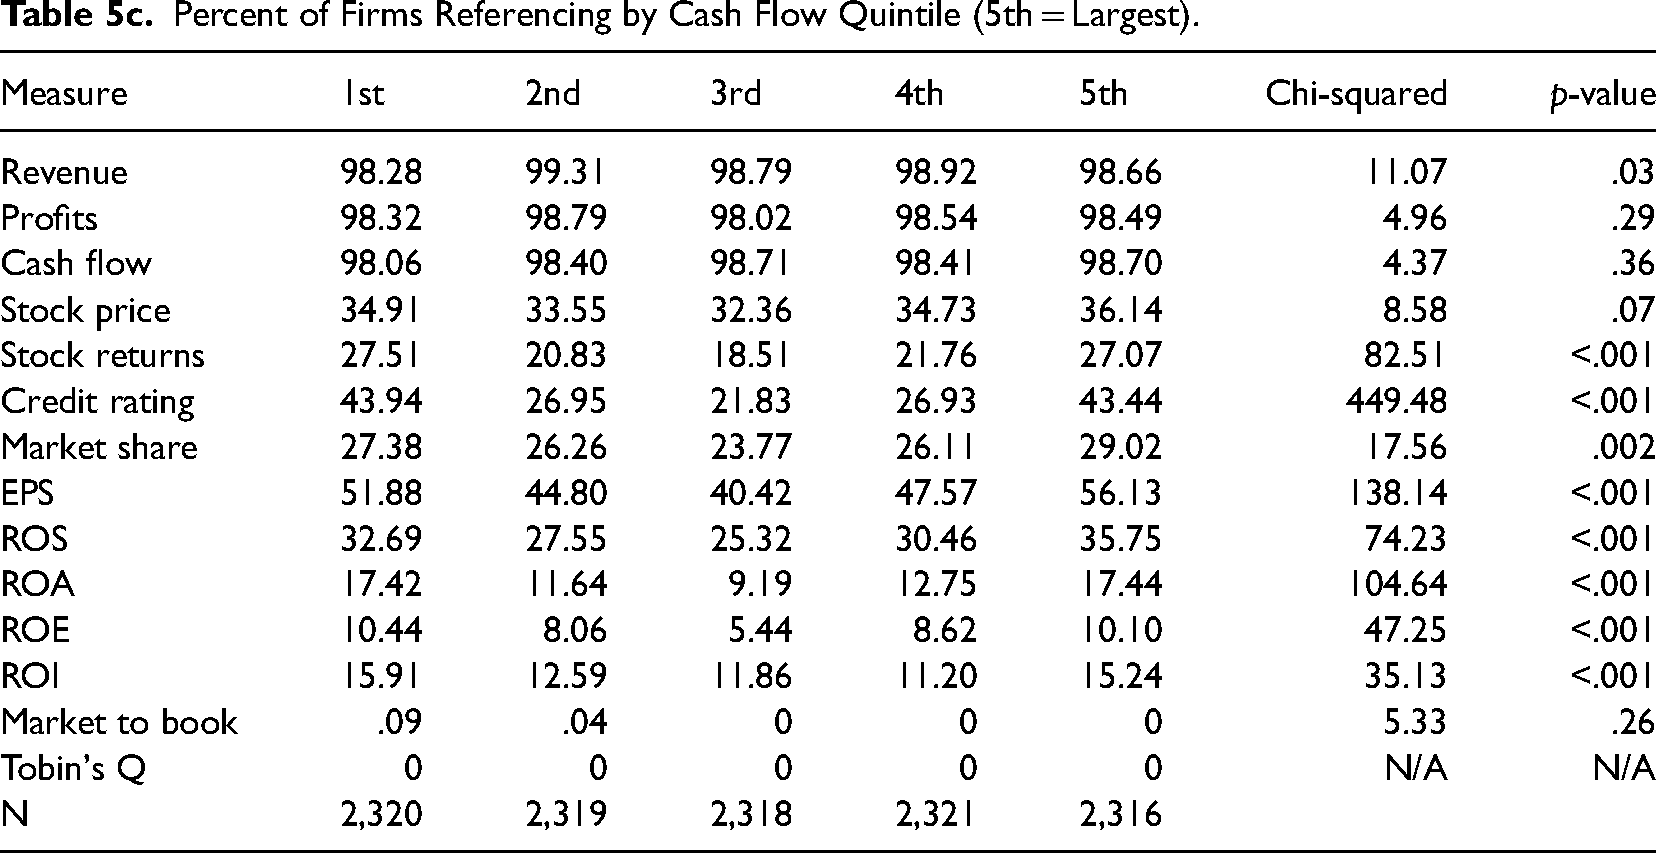
Performance Measures Based on Past Performance
Although prior studies have shown that the unscaled measures in the MD&A sections (e.g., revenue, net income) are not correlated with the less popular, scaled measures (e.g., ROA, ROS), actual performance as captured by each measure may increase the likelihood of using that measure for impression management purposes (Wade et al., 1997). Thus, we conducted subgroup analyses based on actual performance to assess whether higher performance according to a particular performance measure determines the use of that measure in the MD&A section. Tables 5a to f present quintile analyses based on revenue, net income, cash flow, EPS, ROS, and ROA. Tables 5a to c show results consistent with our prior analyses: all firms tend to favor unscaled measures such as revenue, net income, and cash flow, regardless of actual performance on any measure. Even the lowest performing firms (e.g., observations in the lowest quintiles of these tables for unscaled measures) included the unscaled measures in over 96% of the cases.
Percent of Firms Referencing by Revenue Quintile (5th = Largest).
Percent of Firms Referencing by Net Income Quintile (5th = Largest).
Percent of Firms Referencing by Cash Flow Quintile (5th = Largest).
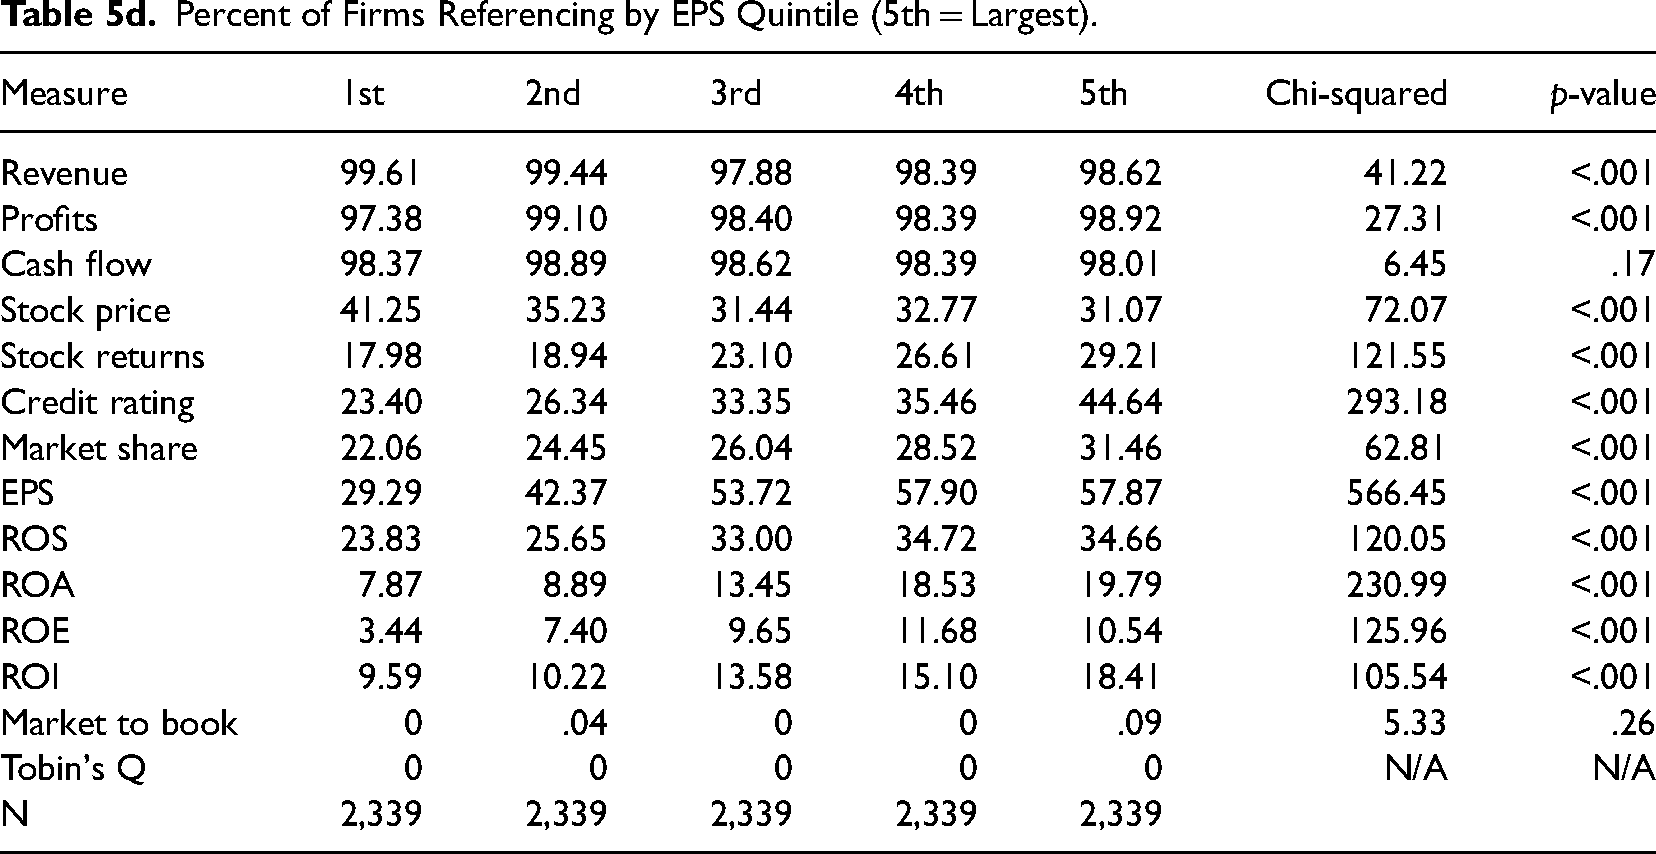
A similar pattern remains across the ratio measures. That is, firms that performed better according to ratio-based measures still favored unscaled measures and were not more likely to reference ratios in their MD&As. The one exception to this trend is EPS, which is not typically used in strategy research. As shown in Table 5d, there is an almost linear relationship whereby references to EPS increase as performance—as measured by EPS—increases.
Percent of Firms Referencing by EPS Quintile (5th = Largest).
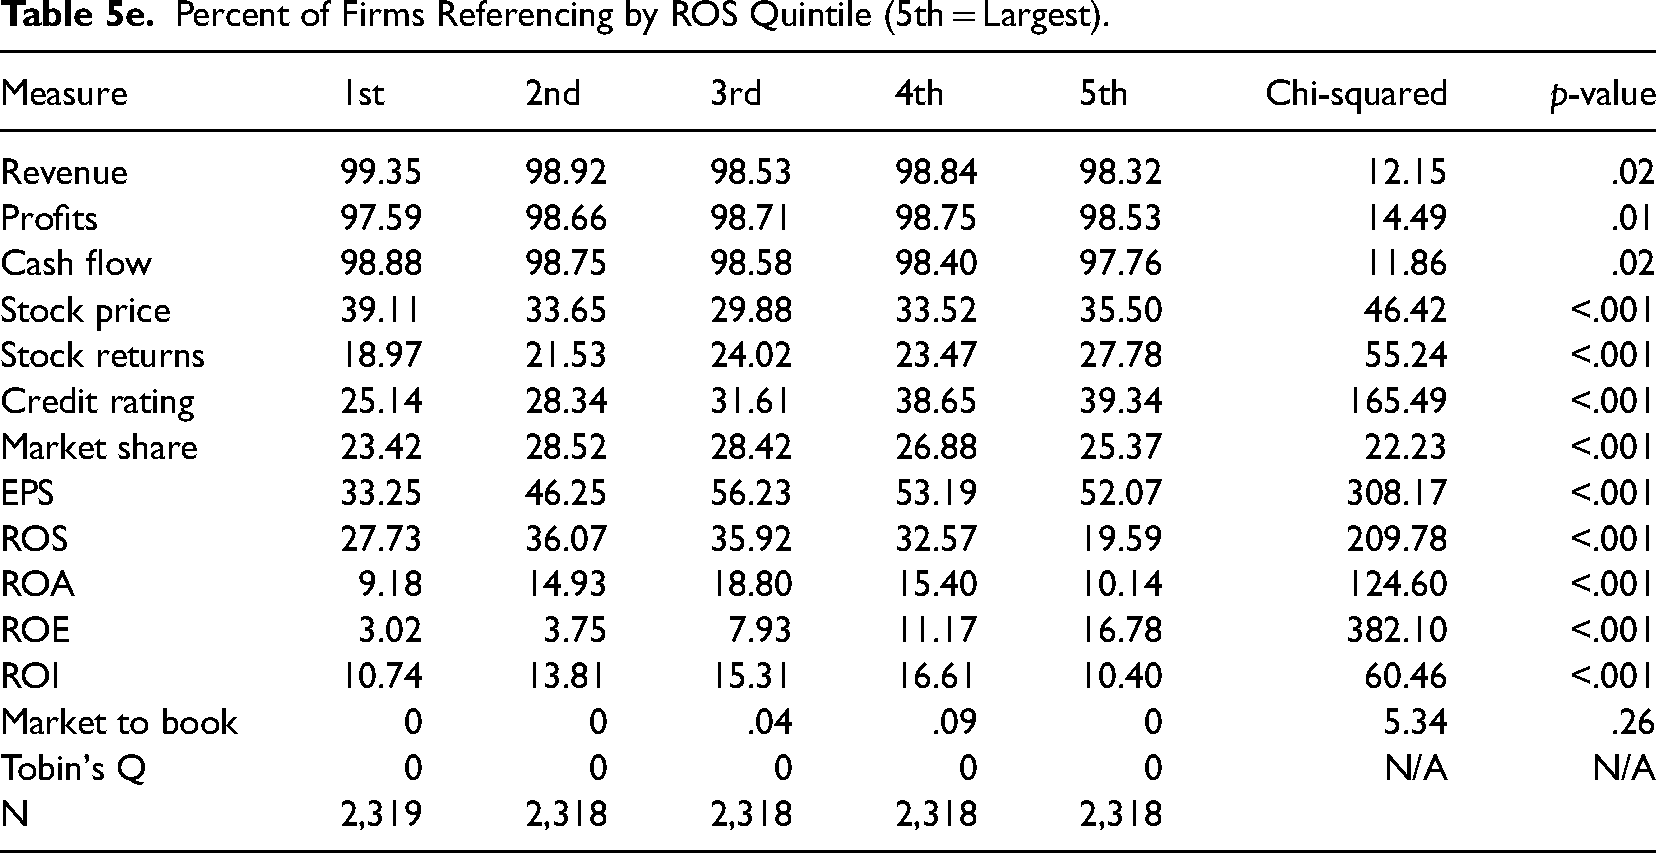
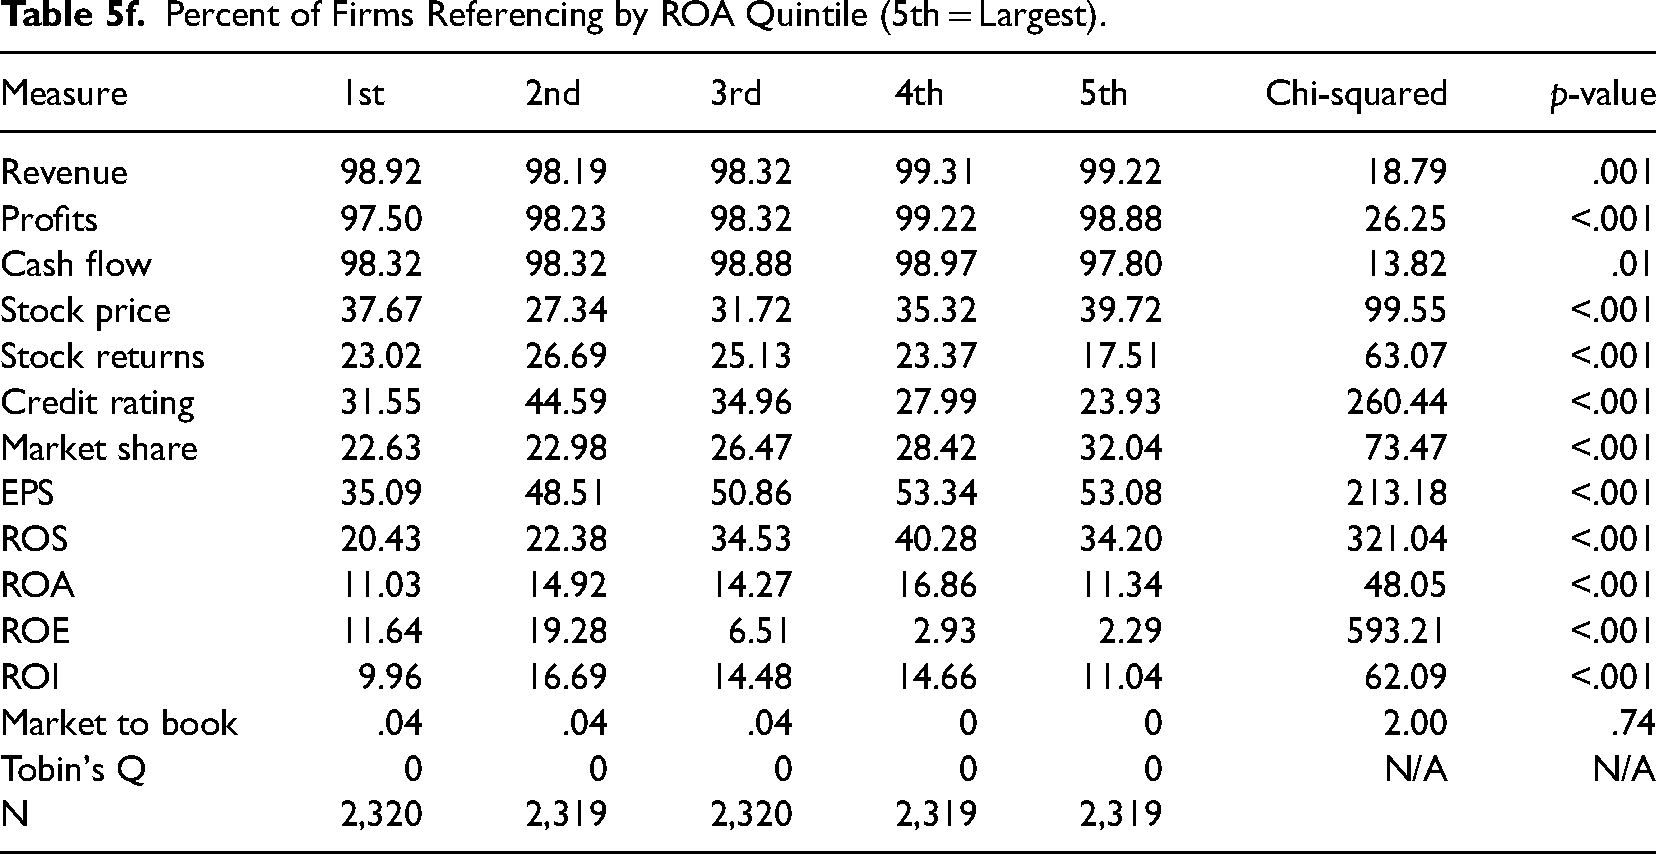
In contrast, Tables 5e and f illustrate that high performers as measured by ROA and ROS were not more likely to reference these terms as compared to lower performers. As shown in Table 5e, 27.73% of observations in the lowest quintile of ROS referenced ROS in the MD&A, while only 19.59% of the observations in the highest quintile referenced ROS. Similarly, Table 5f shows that ROA is referenced more commonly in the middle three quintiles of ROA (ranging between 14.27% and 16.86%) than in the highest quintile (11.34%).
Percent of Firms Referencing by ROS Quintile (5th = Largest).
Percent of Firms Referencing by ROA Quintile (5th = Largest).
Taken together, these results suggest that executives prefer using unscaled measures of firm performance, and we found little evidence to support the impression management perspective. That is, we found little evidence suggesting that executives switch between performance measures depending on which measure makes firm performance look best.
Performance Measures by Industry Classification
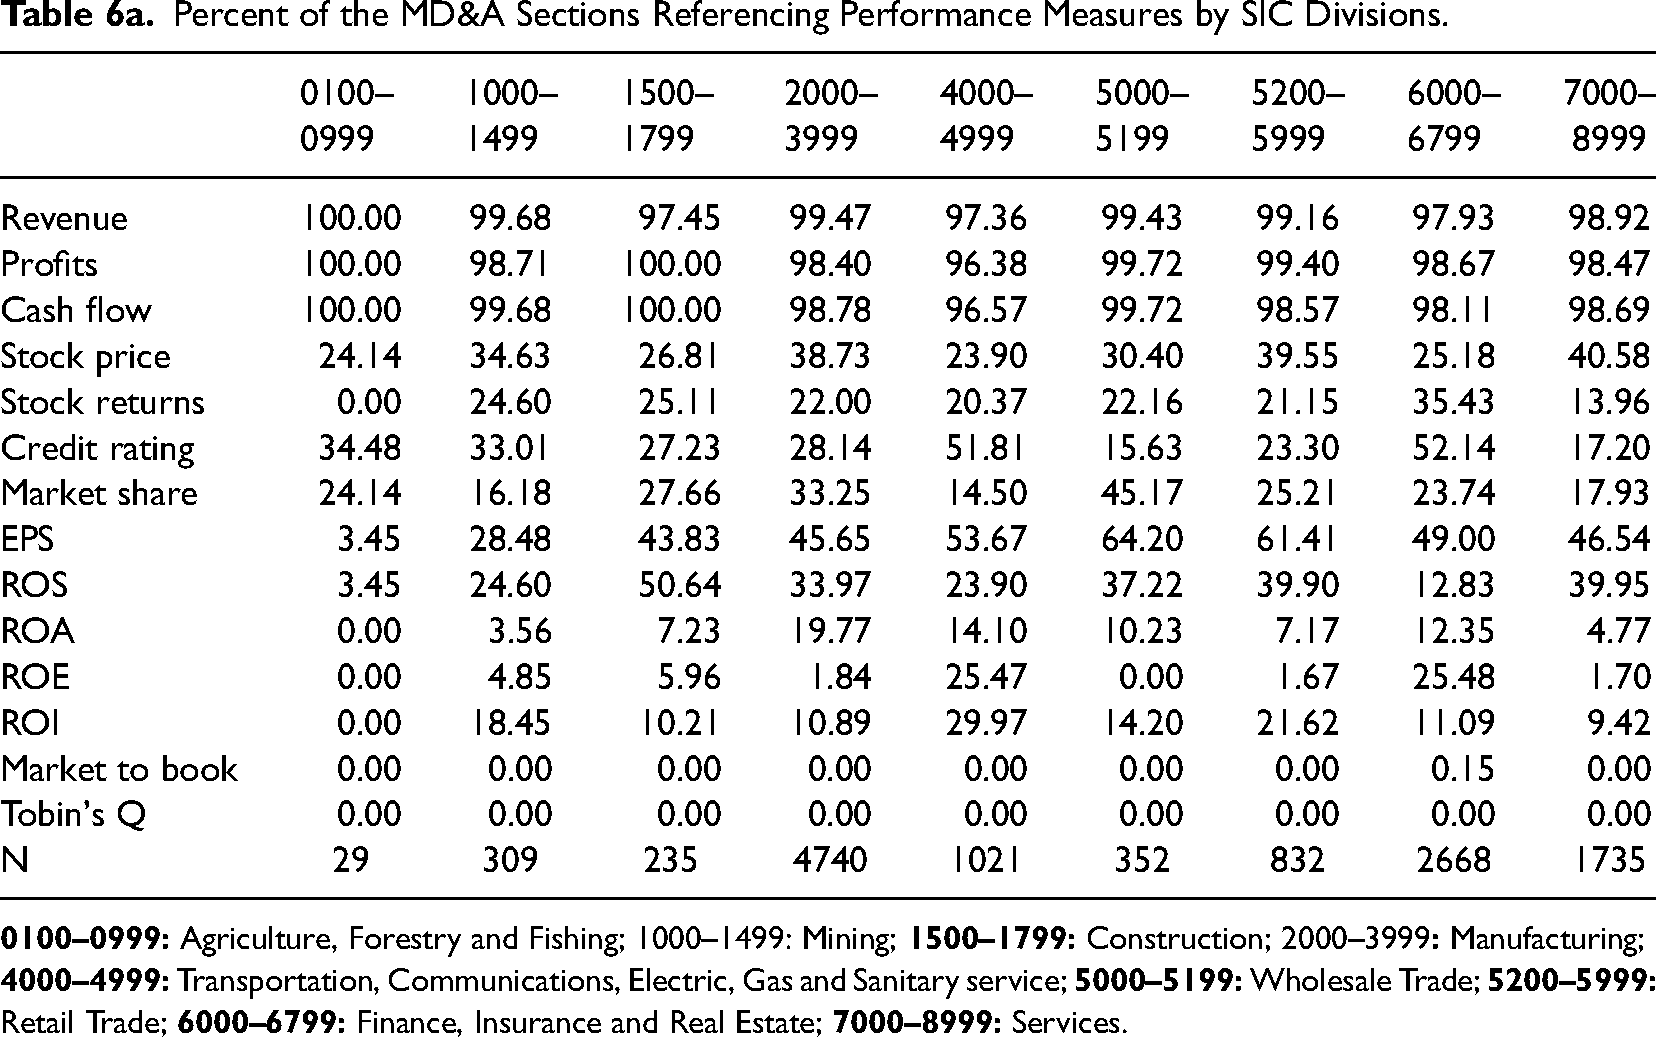
We also examined whether the firm's industry influences how executives operationalize performance. We used the broadest classification of the SIC codes, divisions based on groups of 2-digit SIC codes, to analyze the industry differences. Table 6a presents present the percentages of performance references in the MD&A sections by the nine SIC divisions. Table 6a shows that the most frequently used unscaled measures (revenue, profits, and cash flow) show no substantial differences across the industries. Some of the other measures, including the ratio measures, vary more substantially across industries. For instance, ROI appears more often in the transportation, communications, electric, gas, and sanitary service industries (23.90%). ROA appears more often in the manufacturing segment (19.77%).
Percent of the MD&A Sections Referencing Performance Measures by SIC Divisions.
Percent of the MD&A Sections Referencing Performance Measures by High-Tech and Banking Industries.
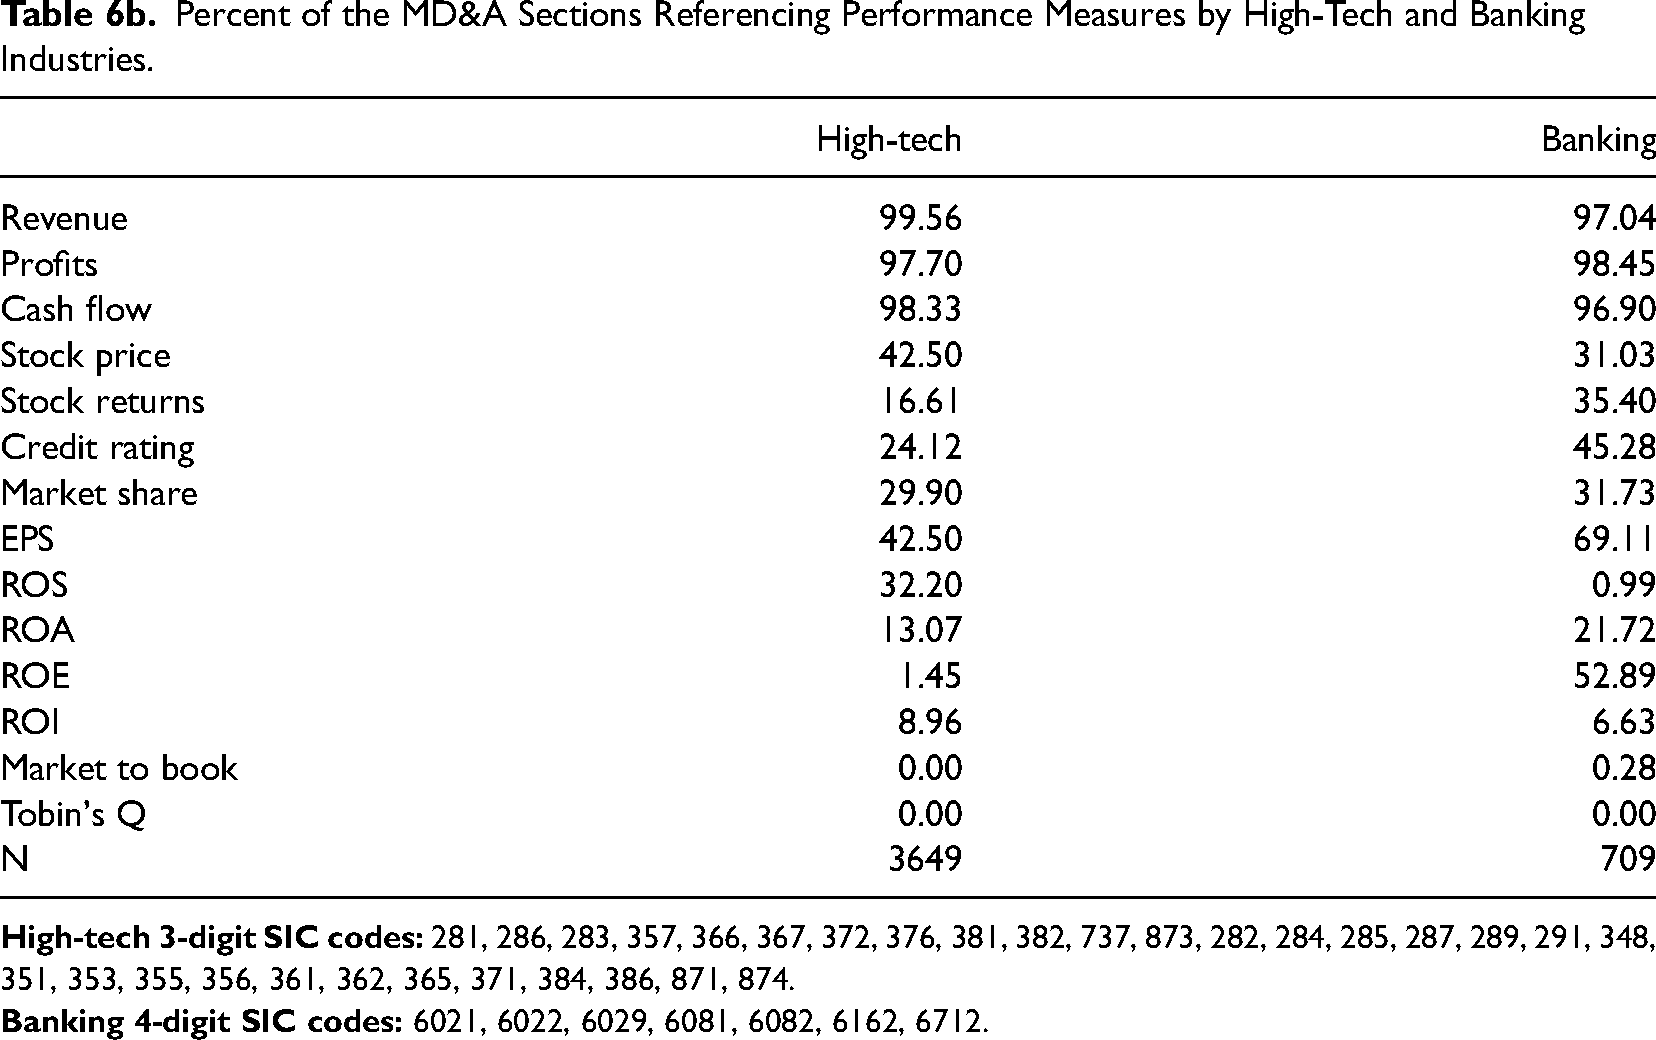
We further investigated two industries that are not squarely classified by a single SIC grouping: the high-tech and banking industries. To identify the high-tech firms, we used the list of 3-digit SIC codes that has been used in the prior studies (Hecker, 1999; Yu et al., 2019). To identify the banking industry, we used seven 4-digit SIC codes designating commercial, mortgage, investment banks, and holding companies of banks. As shown in Table 6b, we did not find substantial industry differences with respect to referencing revenue, profits, and cash flow. Generally, the MD&A sections filed by the high-tech firms used the ratio measures less often, with the only exception of the slightly more frequent references to ROS (32.20%). The MD&A sections filed by the banks reference ROE, EPS, and ROA more often than others (52.89%, 69.11%, and 21.72%, respectively). Overall, this suggests that the attention to (and use of) the ratio measures could be limited to certain industries such as the banking industry.
Robustness Checks
In order to understand the generalizability of using MD&As to explore executive references to firm performance, we extended our analysis to examine both alternative filings and communication to an alternative audience. First, we analyzed executive compensation discussion sections in proxy statements of U.S. listed, publicly traded firms to understand whether our findings are robust across different corporate filings. Then, we analyzed earnings call transcripts to examine whether our findings extended to executives’ conversations with a different audience—financial analysts.
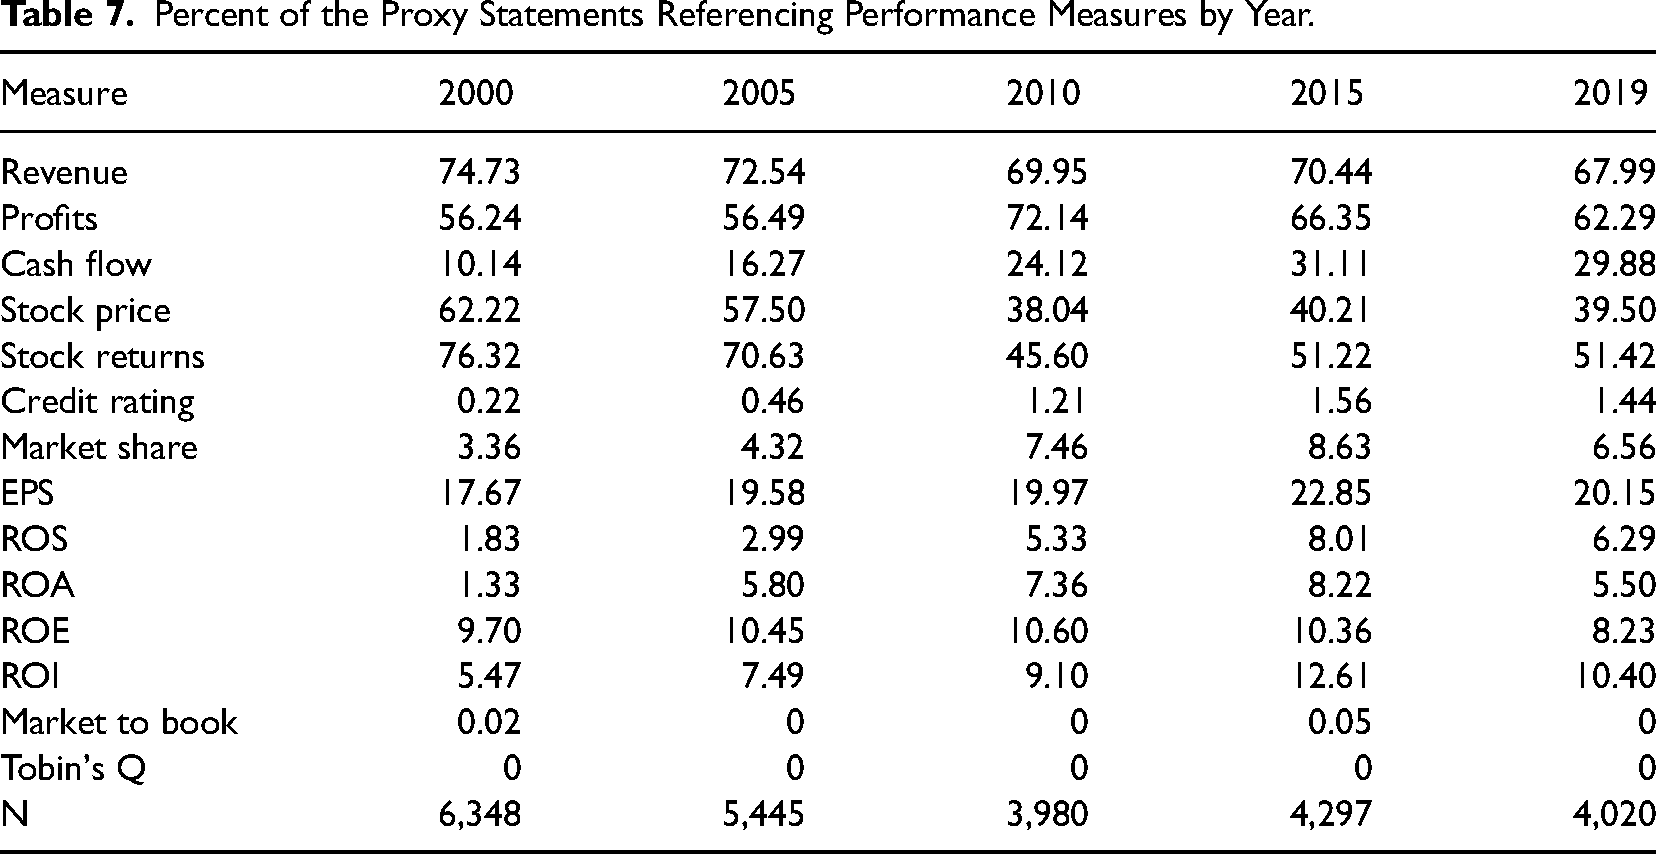
We used the same data collection procedures used in our primary analysis of MD&A sections in 10-K filings, but we do not limit this sample to the S&P 1500. This results in 24,090 total observations. Table 7 presents the percentage of observations mentioning each performance measure. The results are largely consistent with the results from the MD&A sections of 10-K filings. However, we observed three major differences. First, stock-based measures (stock returns and stock price) are more frequently used in the proxy statements than in the 10-K filings. This is perhaps expected given most U.S. firms incorporate stock-based compensation. Second, cash flow and credit rating are less frequently mentioned in the proxy statements than in the MD&A sections. This is likely due to different reporting requirements (e.g., liquidity) across the different documents. Finally, ratio measures, except ROE, are less frequently mentioned in the proxy statements than in MD&As. Overall, the examination of the proxy statements supports our previous findings that unscaled measures including revenue, profit, stock price, and cash flow are the performance measures most often referenced in public documents.
Percent of the Proxy Statements Referencing Performance Measures by Year.
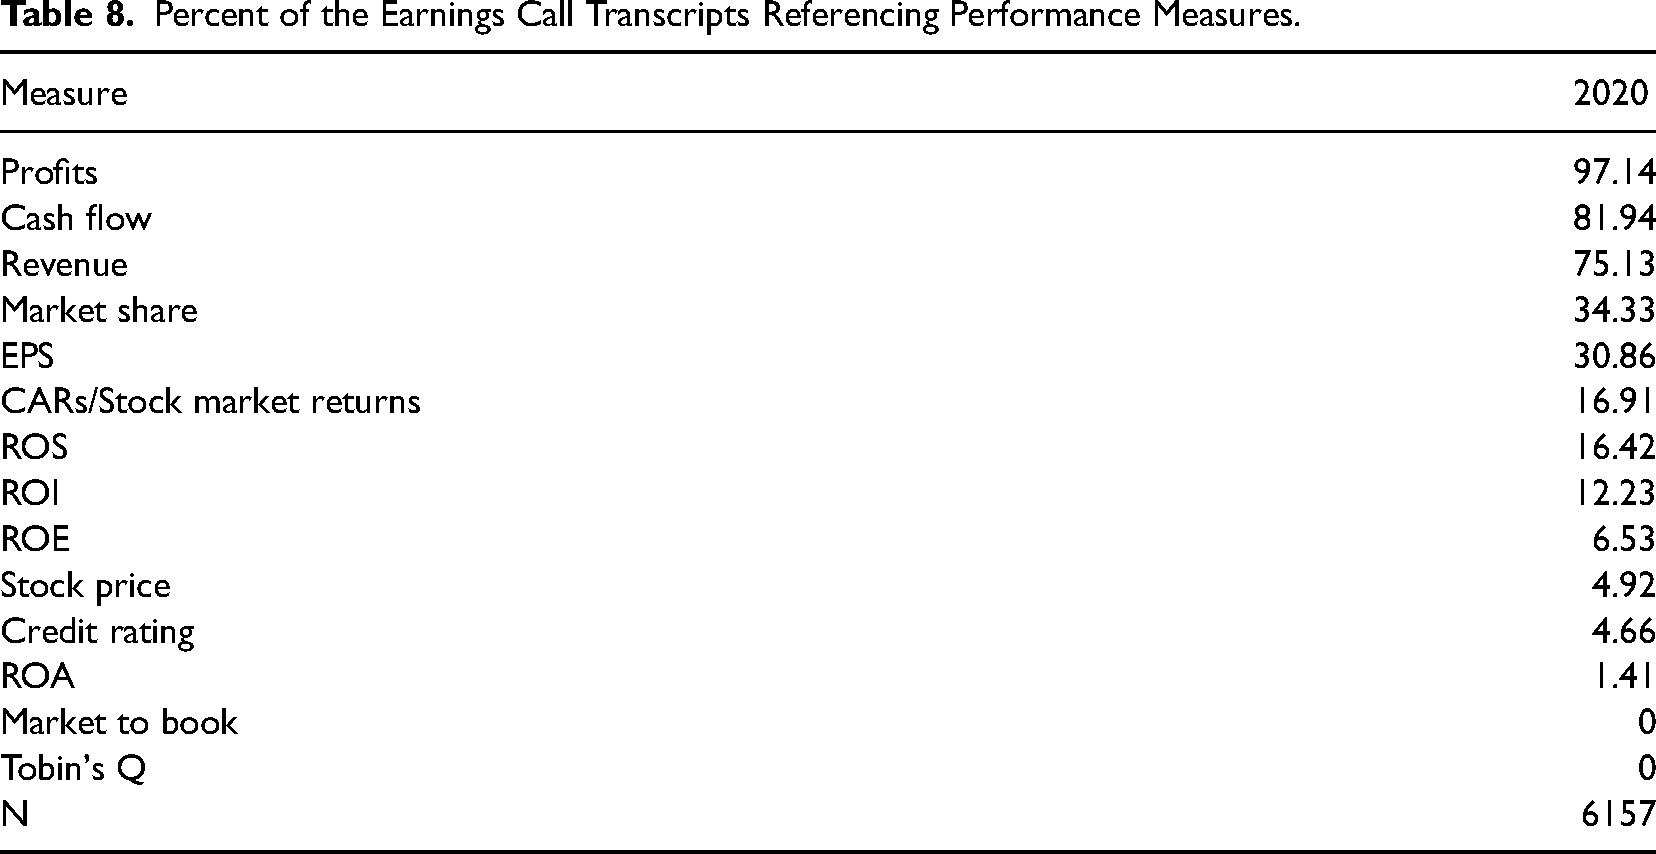
From LexisNexis, we gathered all transcripts of earnings calls that occurred in the third quarter of 2020. We focused on one quarter instead of the entire year to prevent companies who hold multiple quarterly earnings calls from being overrepresented in the sample. Our final sample of 6,157 transcripts included approximately 52,700,000 alphanumeric words. Using the same set of keywords we used in our primary analysis, we counted the number of times that each performance measure was mentioned in the transcript sample.
As shown in Table 8, the results were consistent with our primary analysis. Measures that were most frequently referenced in the executives’ communication with security analysts were unscaled measures in the order of profits (97.14%), cash flow (81.94%), and revenue (75.13%). EPS (30.86%) was the most popular ratio followed by ROS (16.42%) and ROI (12.23%). ROA was rarely referenced in the earnings call transcripts (1.41%). This finding further supports that executives primarily refer to unscaled variables when describing performance.
Percent of the Earnings Call Transcripts Referencing Performance Measures.
Discussion
The objective of this study was to better understand how the performance measures used by executives align with those used by empirical researchers in strategic management. We found that the measure most often used by strategy researchers to operationalize firm performance, ROA, is rarely used by top executives when communicating with investors through the MD&A sections of 10-K reports. Other ratio variables, which are also among those most frequently used in scholarship, are also rarely used by executives. Instead, executives are far more likely to refer to revenue, profit, cash flow, and EPS. Moreover, we found no evidence that firm performance across various measures influenced whether or not executives referenced specific performance measures. For instance, we found that the observations in the highest quintile of ROA were associated with fewer references to ROA than firms in lower quintiles.
To supplement our findings, we also examined communication patterns in proxy statements and earnings calls with financial analysts. Our primary finding that executives are far more likely to reference unscaled measure instead of ratios remained remarkably consistent across the different sources. We found subtle differences across our three sources of information, but these were likely due to different SEC requirements (e.g., the requirement to discuss liquidity in 10-Ks vs. the requirement to discuss stock-based executive compensation in proxy statements).
Based on our findings, we reviewed the literature to confirm that academics continue to rely largely on scaled measures. We reviewed the dependent, independent, and control variables used in Strategic Management Journal for the years 2000, 2005, 2010, 2015, and 2019, which we display in Table 9. The sample resulted in 210 papers that examine performance measures, of which 67% examined performance measures as a dependent variable, 16% as an independent variable, and 45% as a control variable.
Strategic Management Journal Performance Measure Occurrences (% of Articles).
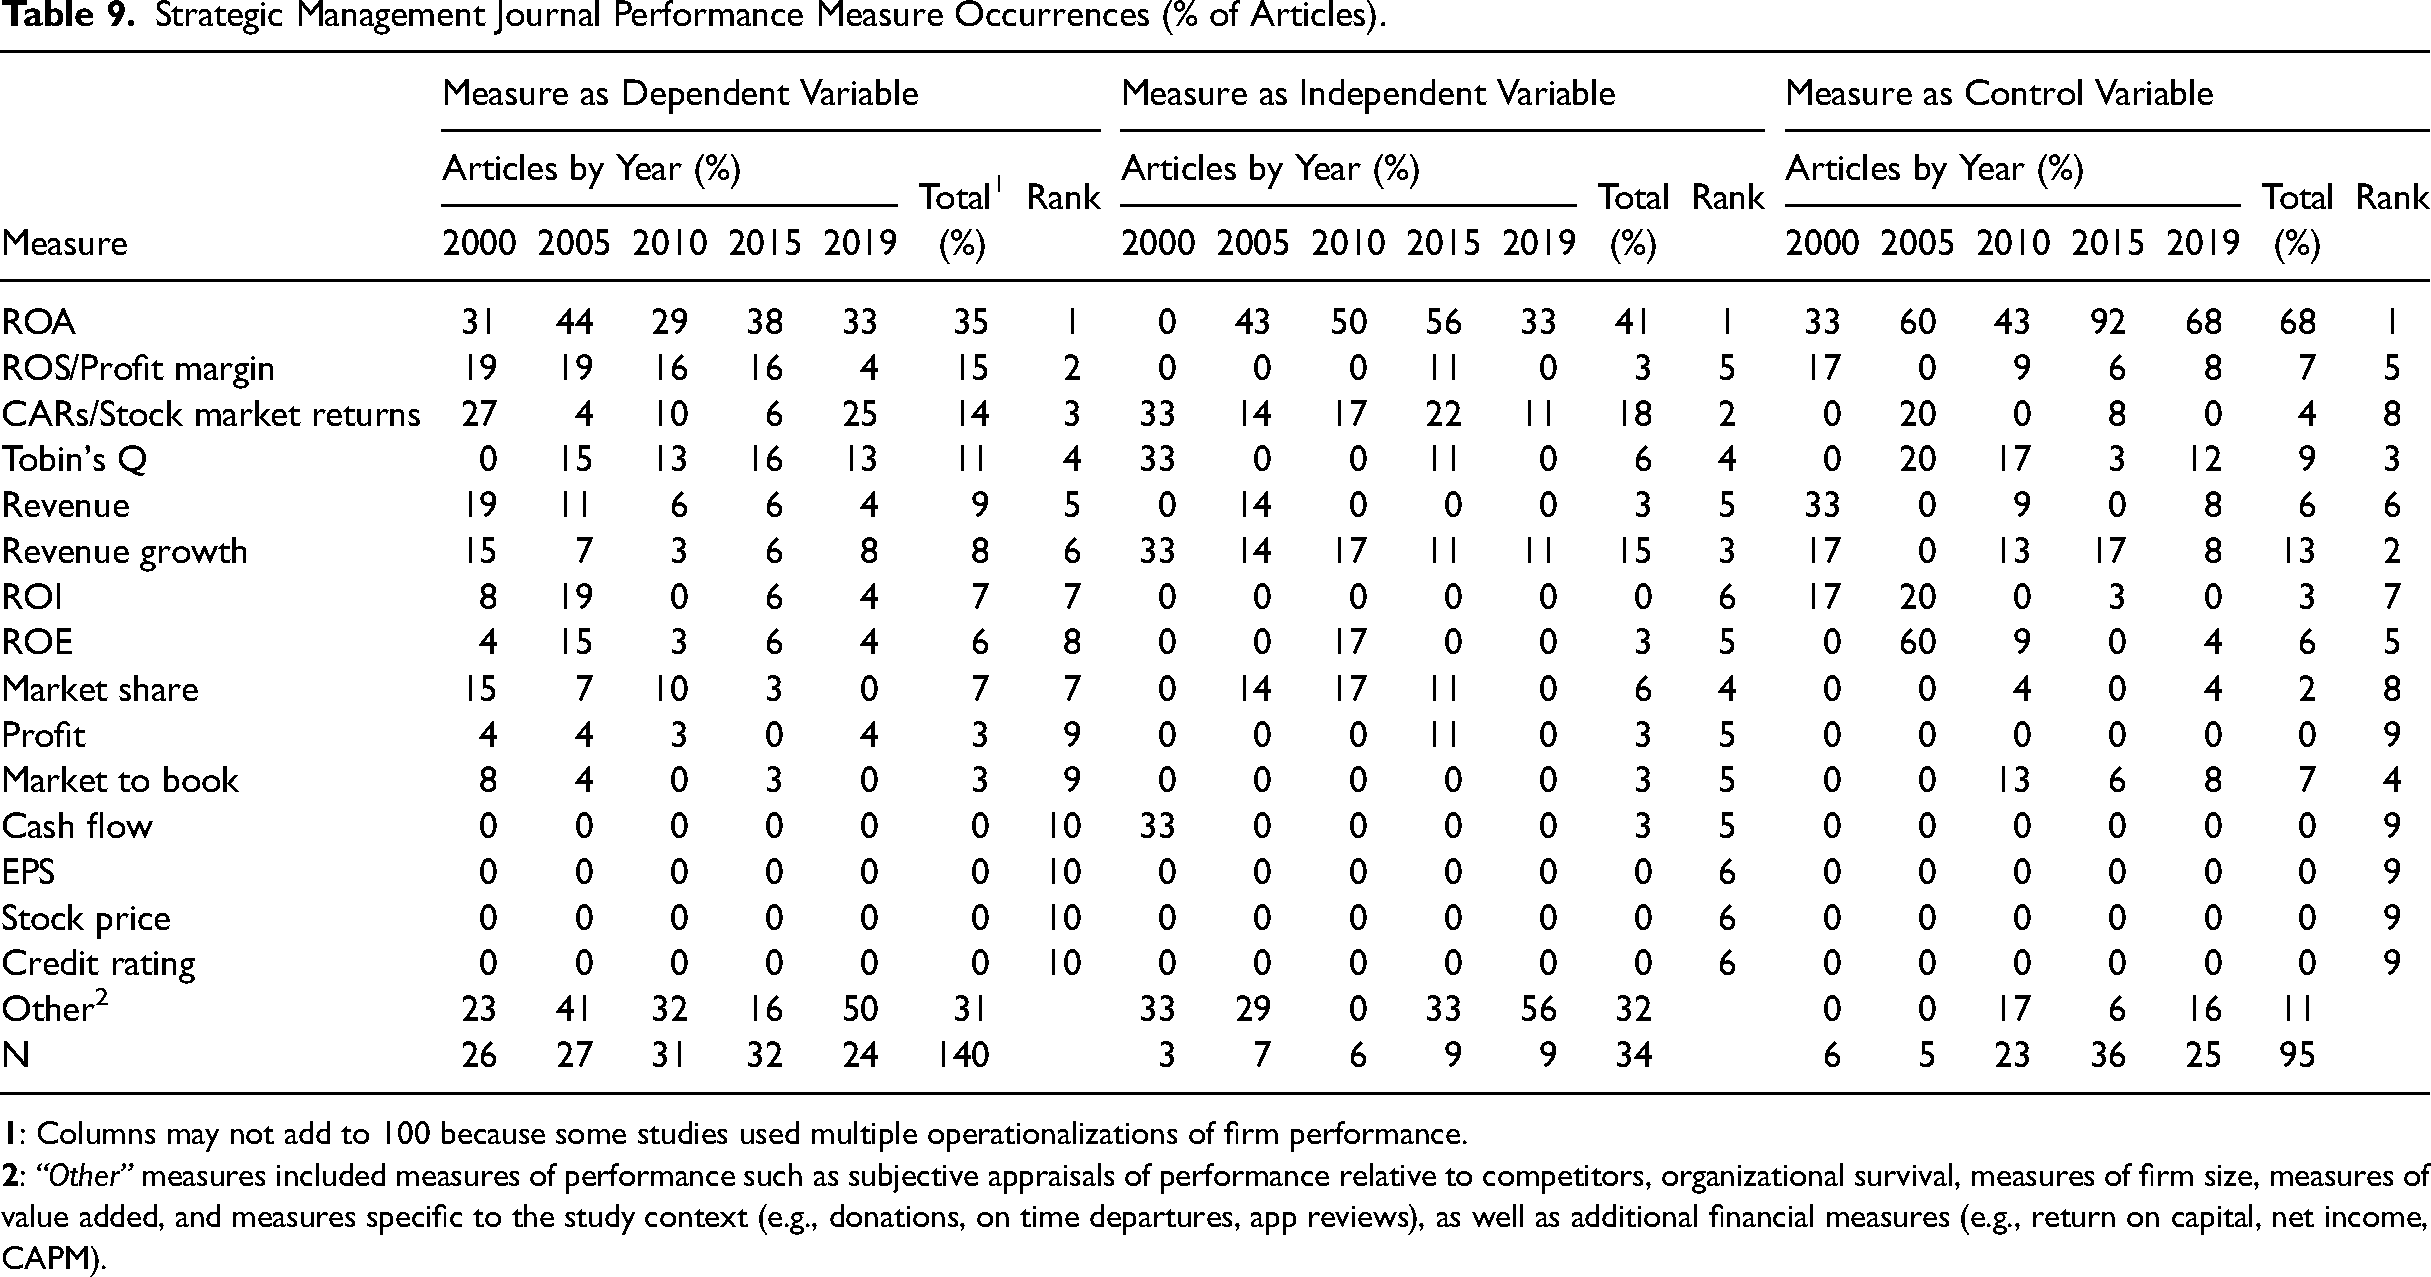
According to our results, ROA was by far the most commonly used measure, comprising 35%, 41%, and 68% of dependent, independent, and control variables, respectively. These percentages substantively exceeded the second-most prominent measure for dependent (ROS, 15%), independent (CARs/stock returns, 18%), and control (Revenue growth, 13%) variables. We also examined the co-occurrences of performance measures in the strategy studies. We found that more than half of the papers only included one measure of performance. Moreover, 50% of the papers that examined ROA as the dependent variable did not include another measure of performance. Of those that did include another measure, other ratio variables such as ROS, ROI, and ROE were the most likely to co-occur with ROA. Taken together, our results suggest that executives and researchers seem to speak two different languages regarding firm performance.
Relationships Between Academic and Executive Measures of Performance
To better understand the implications of our findings, we also examined potential theoretical issues associated with the firm performance construct. Specifically, the use of performance measures by researchers that do not align with those used by executives might suggest potential content validity issues. To further examine this issue, we examined correlations among the different measures. Then, we used mixed models to examine how the top performers using the measure favored by academics (ROA) compared to those using one of the measures favored by executives (net income).
Performance Measure Correlations in S&P 1500 Firms (2010 − 2020).
*p < .05, **p < .01

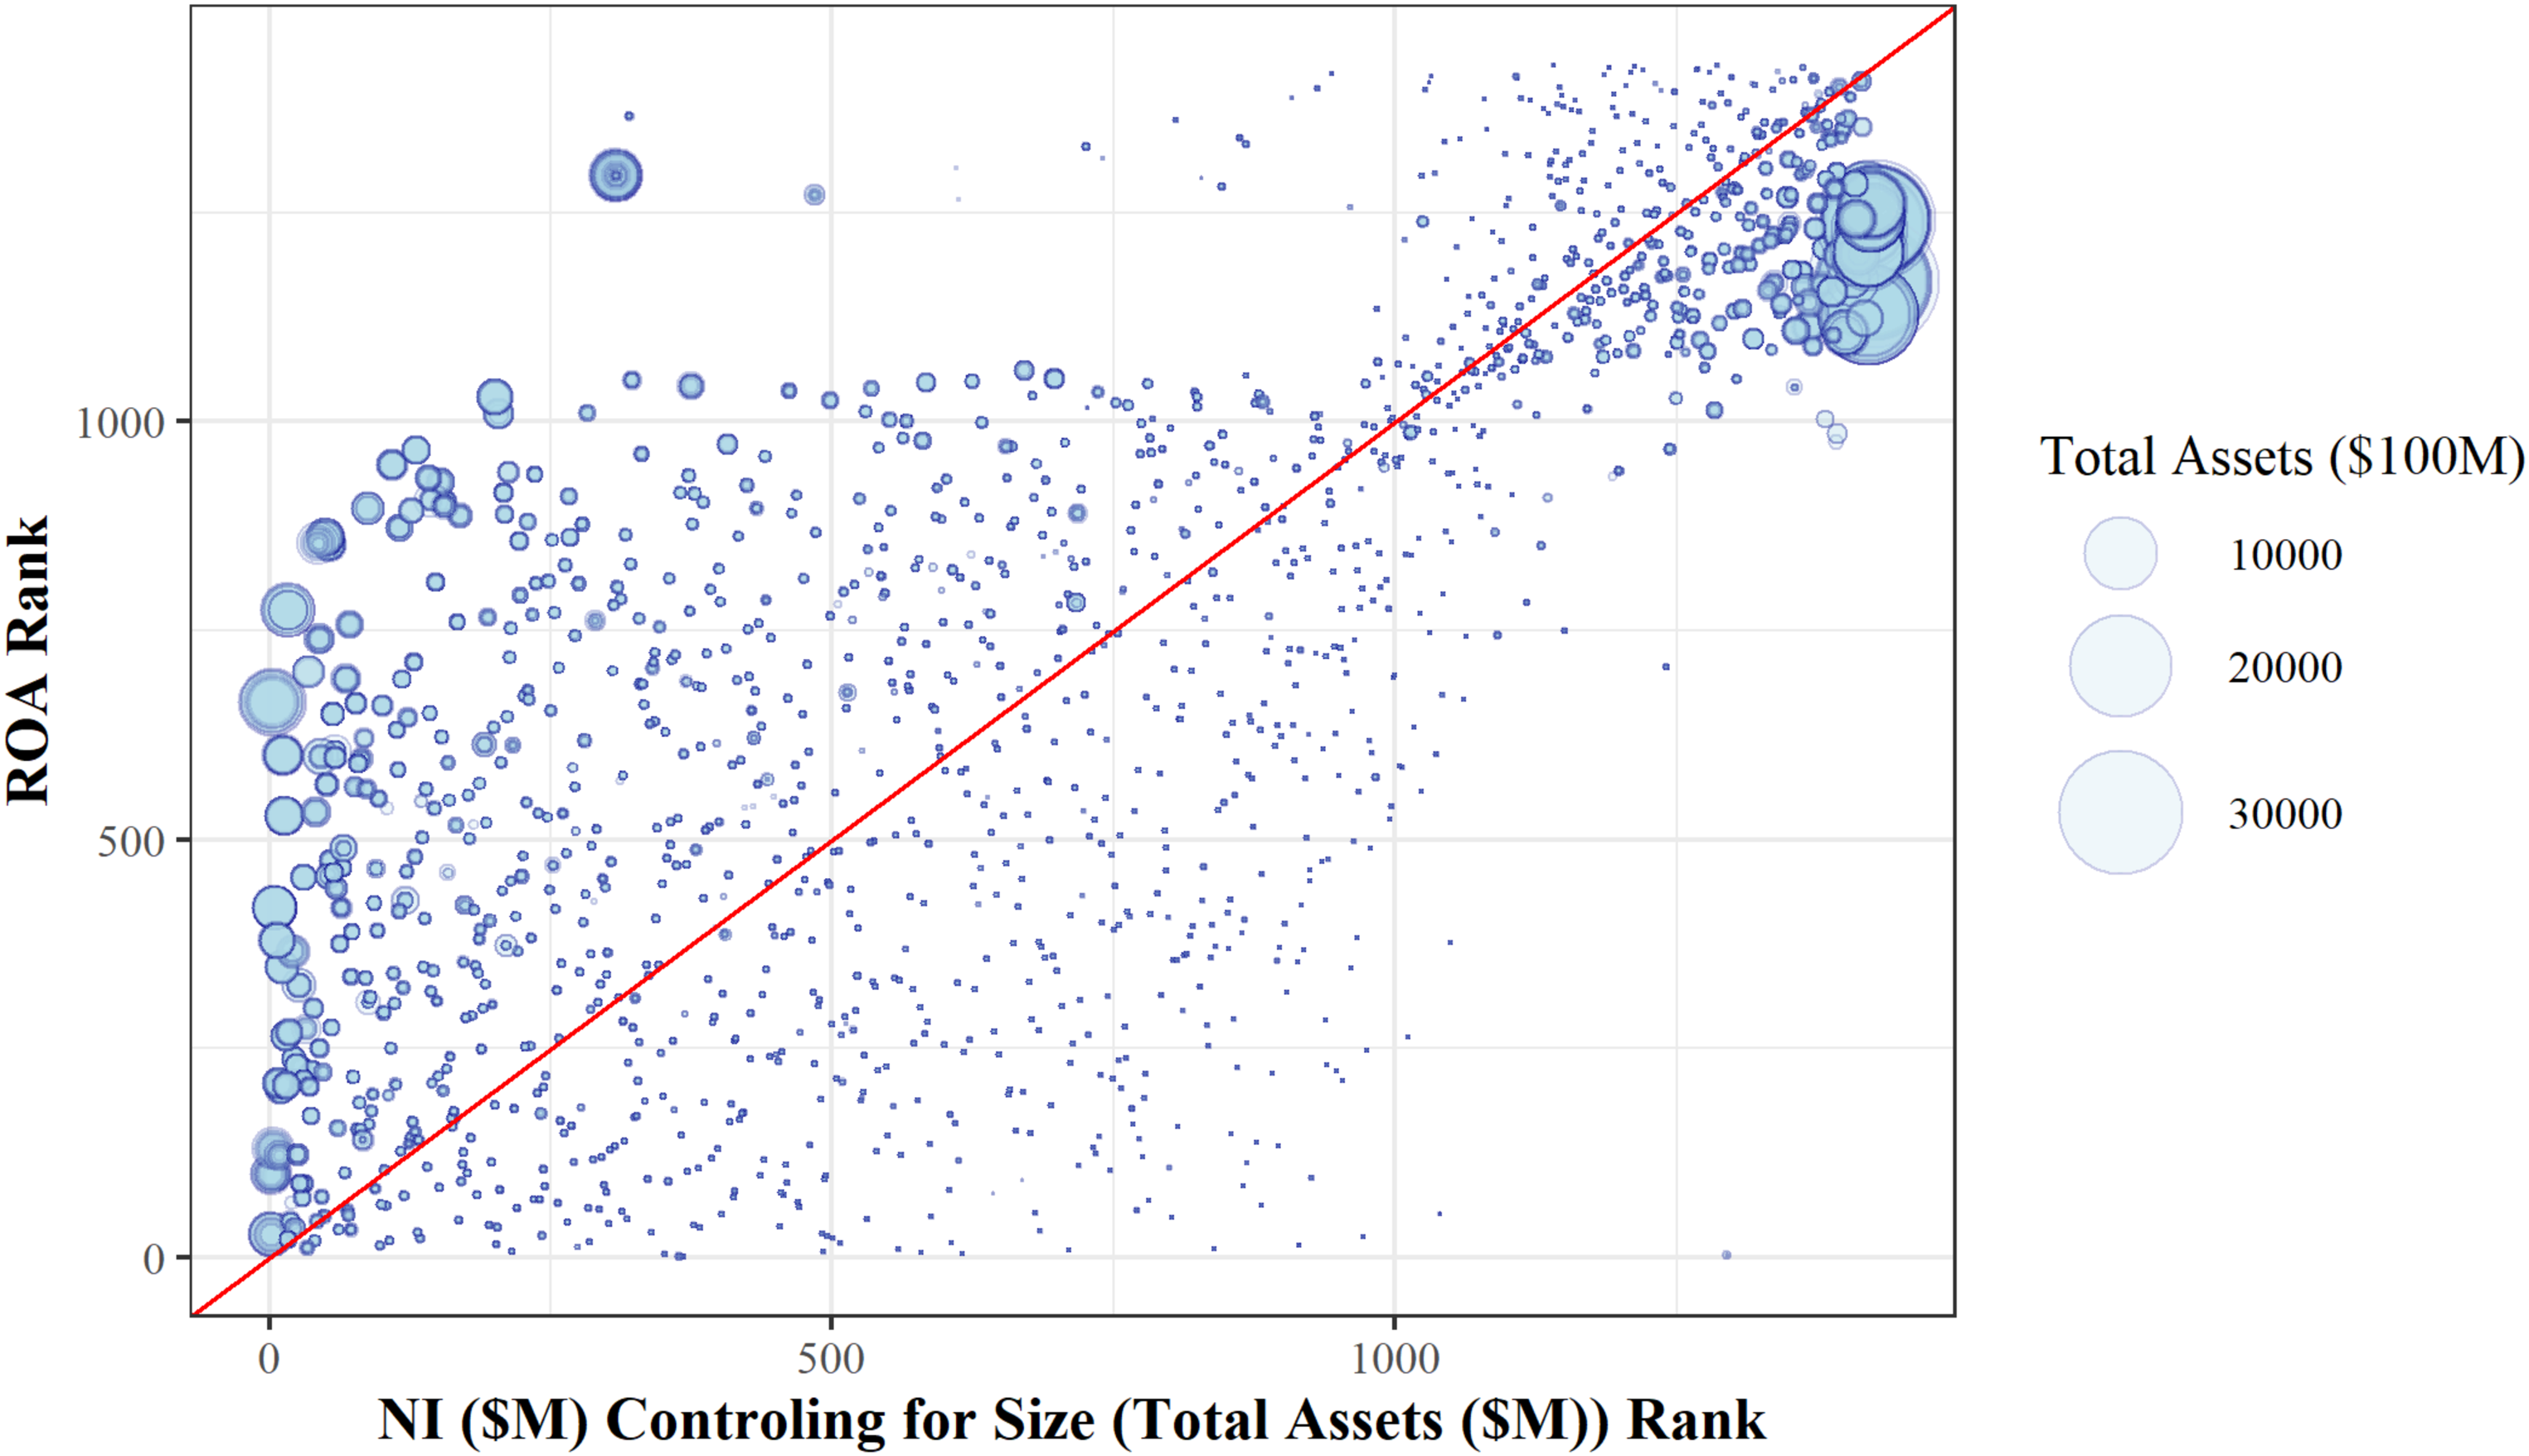
Comparing top performers in S&P 1500 by relative rank—full sample.
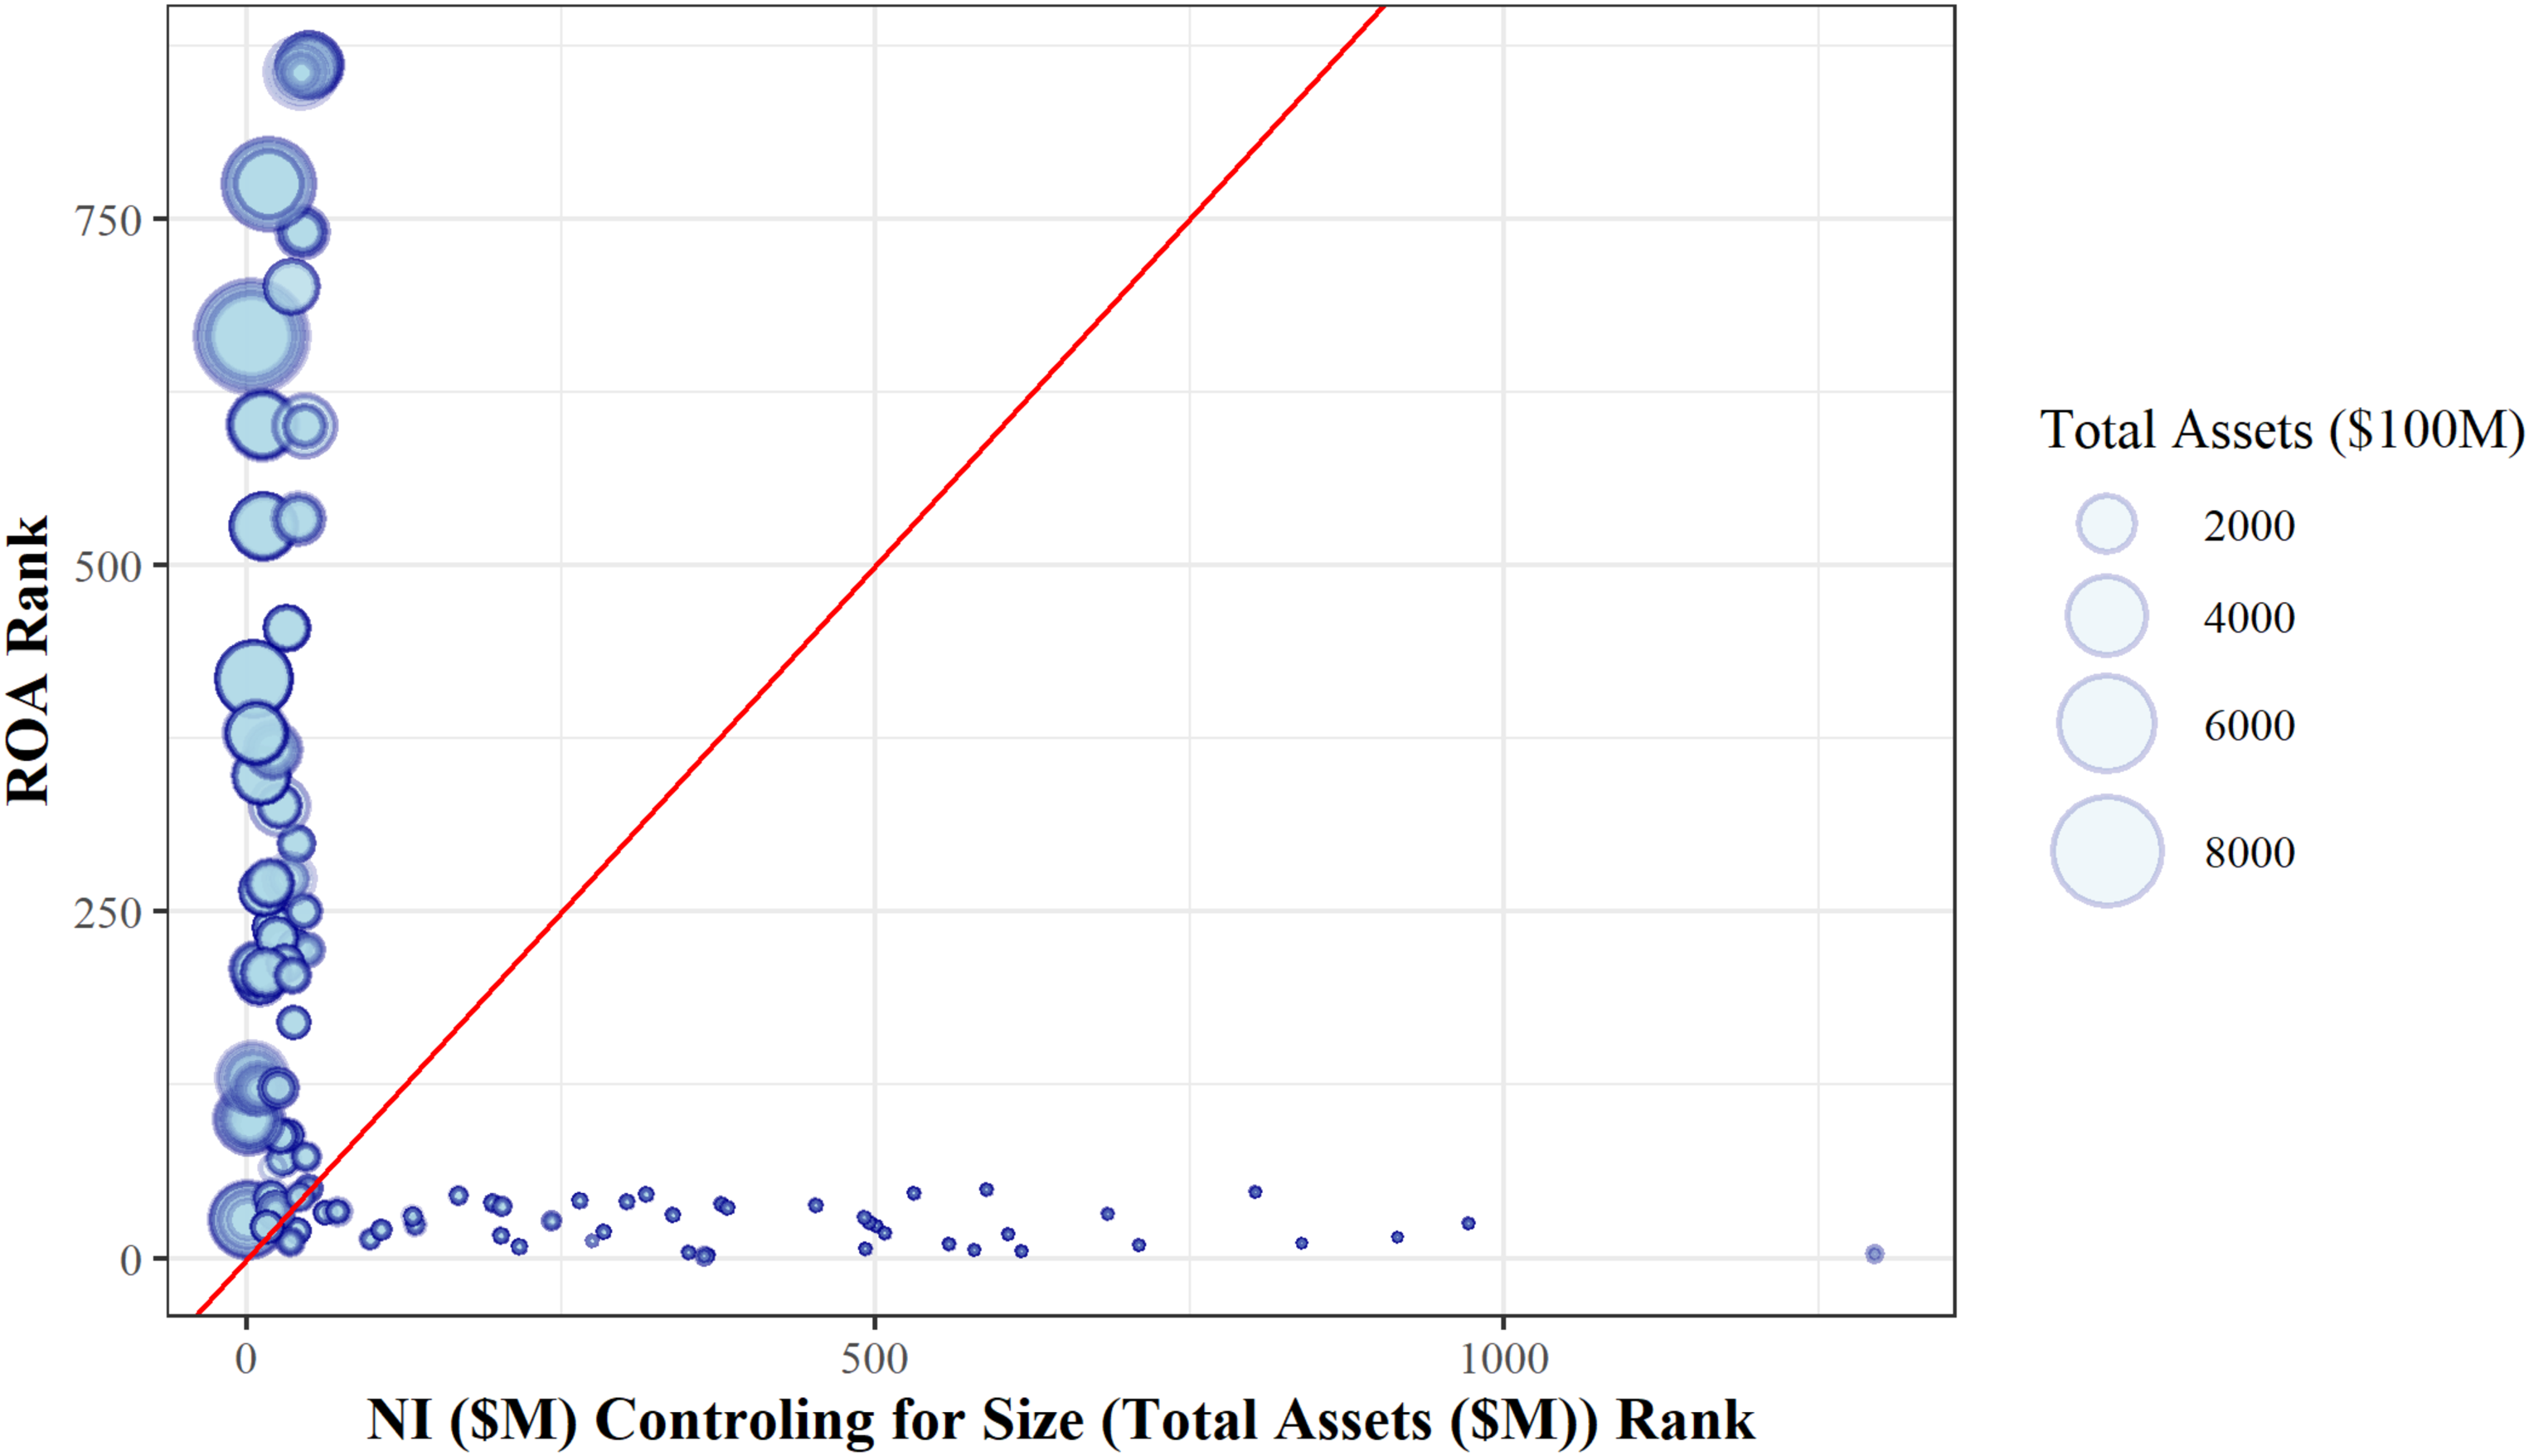
Comparing top performers in S&P 1500 by relative rank—top 50 performers.
Figure 1 represents all of the firms in our S&P 1500 sample. Apparent in this figure is that firms identified as “high performers” when ranked according to ROA as a measure of performance do not mirror those identified as high performers when measuring performance using net income. Rather, the relative rankings of firm performance according to these two different measures are often drastically different. Figure 2 focuses on only those firms that have the highest performance—those ranked in the top 50 according to either ROA and/or net income. Here the differences become even more dramatic. If these measures were similar, we should expect the firms to be clustered along or near the 45-degree line. However, we find that the firms among the highest performers according to one measure would not necessarily qualify for the same distinction according to an alternative measure. For example, the ten highest performers according to net income represent high-profile companies such as Apple, Microsoft, Berkshire Hathaway, Alphabet, and Exxon. In contrast, the top ten firms identified according to ROA include companies such as Cboe Global Markets, Domino's, Antero Midstream, and Factset. Out of the top 50 companies from the ROA model, only six firms also appeared on the top 50 list from the net income model.
Implications
Our findings have important theoretical implications for strategy research. From a content validity perspective, there would be perhaps minor concerns if academics and researchers used different variables that were highly related. This would suggest that the variables used by academics and executives—although different—aligned with the same theoretical construct. The fact that ROA and net income (and scaled vs. unscaled measures in general) are uncorrelated, however, suggests that scholars may need to revisit the conceptual definition of the performance construct.
Hamann et al. (2013) examined the construct validity issues associated with firm performance, but their factor analyses primarily included ratios and did not include many of the monetary variables most referenced by executives. Accordingly, future research could use our results to extend Hamann et al.'s construct validity study. Specifically, researchers might examine convergent validity when incorporating the measures used by executives to better understand relationships among the multiple dimensions of firm performance. Given our findings, it is possible that academics and executives may be referencing separate performance dimensions. Future work, then, might also consider whether there exist additional dimensions of firm performance.
We believe that a focus on monetary variables and theory can help scholars revisit the intuition underlying common research practices. For instance, scholars typically use ratios in an effort to account for differences in firm size (Wiseman, 2009). However, many statistical models in strategic management use measures of firm size to normalize both performance and independent variables such as R&D expenditures (i.e., to create R&D intensity)—all while also controlling for assets. A focus on monetary variables, however, helps scholars to think in terms of theoretical relationships in dollar terms as opposed to how percentages of R&D intensity influence percentages of ROA (see also Certo et al., 2020).
Recommendations
We believe that our findings lead to a number of straightforward recommendations for strategy researchers. First, our findings reinforce the need for future researchers to examine both market and accounting based measures of firm performance, as executives refer to both when communicating with outsiders. Moreover, the low correlations between stock market and accounting measures we provide buttress the notion that each might be associated with different drivers; it is only natural, then, to expect mixed findings across these two broad categories.
When dealing with accounting based measures of firm performance, our findings lead us to one specific recommendation: researchers should include monetary variables as primary measures of firm performance. According to our results, executives spend little time referring to ROA when communicating with external audiences through public documents. As our cross-industry comparison suggests, this may be in part due to the fact that many of the most successful companies today (e.g., Alphabet, Amazon, Microsoft, etc.) are less asset-intensive than the manufacturing firms that were more prominent when the field formed in 1980. Instead, using combinations of performance measures (e.g., revenues, profits, and cash flows) that are mentioned by executives can both aid in our understanding of performance and increase the relevance of our research.
We caution against the potential response that profit (or net income or earnings) is equivalent to ROA because of its appearance in the numerator of the ratio. Simply stated, they are not equivalent. Even if researchers were able to somehow overcome the statistical problems associated with using ratios such as ROA in statistical models (Certo et al., 2020), our results suggest that the ratio measures used by academics and the monetary measures used by executives might not even represent the same theoretical construct. Consequently, when investigating the determinants of firm performance we recommend analyzing one or more monetary variables (e.g., net income, cash flow, operating profits, etc.) while using a measure of firm size (e.g., assets, revenue, etc.) as a control variable.
Due to both overall economic impact and data availability, a substantive amount of empirical strategy research involves samples of publicly traded companies. Executives of these publicly traded companies face enormous pressures to satisfy shareholders, who continuously search for information to resolve information asymmetry (Busenbark et al., 2017). Stock prices represent the expected value of discounted future cash flows (Wibbens & Siggelkow, 2020), and variables such as revenues, net income, and cash flows may provide investors with better signals than ratios such as ROA and ROE. In contrast, academic researchers tend to favor ratios that may serve as more effective indicators of efficiency than of future cash flows.
For these reasons, it is difficult to justify the consistent reliance on ratios such as ROA that are not widely used in practice. If researchers must use ratios, we suggest that they include EPS or ROS, as these are more widely used by executives. Nevertheless, it is important to recognize the low correlations between EPS and most every other performance measure. This may result in part from the fact that the number of company shares outstanding can change rather easily through equity offerings and share buybacks.
Limitations and Future Research
Despite the potential importance of our findings, our work is not without its limitations. Perhaps the most important limitation is that we relied primarily on publicly traded documents to assess executive cognition. It may be, for instance, that executives rely on other types of performance measures in internal dashboards and private discussions but highlight the measures such as revenues and net income in public discussions. It is important to note, however, that our results were substantively consistent across multiple reporting mechanisms, each with its own associated regulatory documents: 10Ks, proxy statements, and earnings calls with financial analysts. If our consistent results are somehow not representative of executive thinking, it calls into question countless empirical studies across management, finance, accounting, and marketing that utilize 10-Ks, proxy statements, and earnings calls to somehow approximate executive cognition.
Nevertheless, our results could motivate future research to utilize other data sources to better understand the theoretical underpinnings of firm performance. Although we reviewed research highlighting the benefits of utilizing public documents, future studies could employ alternative methodologies (e.g., surveys, interviews) to verify and expand our results. In fact, a qualitative study of executives, analysts, and investors could help further distinguish the various facets and domains of firm performance (e.g., Gioia et al., 2013).
In addition, future research could investigate nomological validity by examining the antecedents and consequences of firm performance. For instance, future research could examine how strategic decision making influences the measures of firm performance utilized by executives. Are results consistent with prior studies in strategic management that rely almost exclusively on ratios? In addition, future research might examine how different measures of firm performance influence strategic decision making as well as corporate governance. For instance, are the performance measures used in the executive compensation sections of proxy statements more predictive of CEO compensation than other measures? Finally, in addition to antecedents and consequences, it might prove fruitful to understand how different operationalizations influence the extent to which firm performance acts as a moderator (Busenbark et al., 2022).
Conclusion
Taken together, our findings highlight the benefit of occasionally reconsidering common research practices and assumptions. Atinc et al. (2012), for instance, highlight the role of isomorphism among researchers when using control variables in strategy research, and our findings raise the possibility of a similar phenomenon regarding firm performance. Consistent with Dimaggio and Powell (1983), has ROA reached the point in strategy research when its use becomes almost normative based on reviewer expectations? This would support March and Sutton's (1997, p. 703) contention that “Many organizational researchers are linked to academic institutions and professions, systems that are less immediately concerned with improving performance and more concerned with attention to standards of research and inference that mark research institutions of distinction.”
In summary, our findings suggest a divergence between strategy researchers and executives when referencing performance measures. While strategy researchers are interested primarily in ROA, our evidence suggests that executives are far more interested in revenues, revenue growth, profits, and earnings per share. We are hopeful that our findings help researchers to revisit common practices and assumptions regarding firm performance measures. By doing so, we also hope that our results help to develop more complete understandings of the drivers and implications of firm performance as well as to improve the relevance of research in strategic management.
Footnotes
Acknowledgements
We gratefully thank Jon Bundy, Jeff Lepine and Wei Shen for their helpful comments on earlier versions of this manuscript. We would also like to thank Associate Editor Michael Withers and the two anonymous reviewers for their helpful comments and suggestions throughout the review process.
Declaration of Conflicting Interests
The author(s) declared no potential conflicts of interest with respect to the research, authorship, and/or publication of this article.
Funding
The author(s) received no financial support for the research, authorship, and/or publication of this article
Supplemental Material
Supplemental material for this article is available online.
Notes
Author Biographies
References
Supplementary Material
Please find the following supplemental material available below.
For Open Access articles published under a Creative Commons License, all supplemental material carries the same license as the article it is associated with.
For non-Open Access articles published, all supplemental material carries a non-exclusive license, and permission requests for re-use of supplemental material or any part of supplemental material shall be sent directly to the copyright owner as specified in the copyright notice associated with the article.