
Abstract
As part of the US Department of Energy’s Exascale Computing Project (ECP), Rice University has been refining its HPCToolkit performance tools to better support measurement and analysis of applications executing on exascale supercomputers. To efficiently collect performance measurements of GPU-accelerated applications, HPCToolkit employs novel non-blocking data structures to communicate performance measurements between tool threads and application threads. To attribute performance information in detail to source lines, loop nests, and inlined call chains, HPCToolkit performs parallel analysis of large CPU and GPU binaries involved in the execution of an exascale application to rapidly recover mappings between machine instructions and source code. To analyze terabytes of performance measurements gathered during executions at exascale, HPCToolkit employs distributed-memory parallelism, multithreading, sparse data structures, and out-of-core streaming analysis algorithms. To support interactive exploration of profiles up to terabytes in size, HPCToolkit’s hpcviewer graphical user interface uses out-of-core methods to visualize performance data. The result of these efforts is that HPCToolkit now supports collection, analysis, and presentation of profiles and traces of GPU-accelerated applications at exascale. These improvements have enabled HPCToolkit to efficiently measure, analyze and explore terabytes of performance data for executions using as many as 64K MPI ranks and 64K GPU tiles on ORNL’s Frontier supercomputer. HPCToolkit’s support for measurement and analysis of GPU-accelerated applications has been employed to study a collection of open-science applications developed as part of ECP. This paper reports on these experiences, which provided insight into opportunities for tuning applications, strengths and weaknesses of HPCToolkit itself, as well as unexpected behaviors in executions at exascale.
1. Introduction
A key goal of the US Department of Energy’s Exascale Computing Project (ECP) was to build a software ecosystem for a trio of exascale supercomputers whose compute nodes are accelerated with Graphics Processing Units (GPUs). Two installed systems, Frontier (Oak Ridge Leadership Computing Facilty, 2023) and Aurora (Argonne Leadership Computing Facility, 2024b), employ discrete GPUs; the emerging El Capitan system (Lawrence Livermore National Laboratory, 2024) is based on AMD’s MI300A Accelerated Processing Units (Advanced Micro Devices, 2024), which include both CPU and GPU cores.
As part of the ECP, Rice University extended its HPCToolkit performance tools (Adhianto et al., 2010) to support profiling and tracing of GPU-accelerated HPC and machine learning applications on these emerging exascale systems (Zhou et al., 2021a). One of HPCToolkit’s distinctive features is its support for collecting fine-grained, instruction-level measurements of both CPU and GPU code to gain insight into the performance of GPU-accelerated applications.
In this paper, we reflect on our experiences using HPCToolkit’s performance measurement and analysis capabilities, developed as part of the ECP, to analyze sophisticated GPU-accelerated applications at scales ranging from a single node to 8K of the 9.4K nodes on the Frontier exascale supercomputer.
The next section provides an overview of HPCToolkit’s workflow for the measurement and analysis of GPU-accelerated applications. Section 3 describes challenges associated with launching and measuring dynamically-linked applications executing at a large scale. Section 4 describes changes to HPCToolkit’s measurement framework based on our experiences on GPU-accelerated platforms. Section 5 describes enhancements to accelerate the analysis of load modules associated with GPU-accelerated applications. Section 6 presents challenges in scalable postmortem analysis and our solutions to address them. Section 7 describes enhancements to HPCToolkit’s tools for understanding information in an application’s profiles and traces. Section 8 describes an I/O abstraction layer that enables HPCToolkit to readily exploit a range of I/O systems on supercomputers. Section 9 describes some of our experiences using HPCToolkit to analyze application codes developed as part of the ECP. Section 10 reviews related work. Finally, Section 11 reflects on our experiences and describes the next steps for improving tools for the DOE’s exascale platforms.
2. HPCToolkit overview
Figure 1 shows an overview of HPCToolkit’s workflow, which consists of four main steps: measurement, binary analysis, postmortem analysis, and presentation. Overview of HPCToolkit’s new workflow for measurement and analysis of GPU-accelerated applications.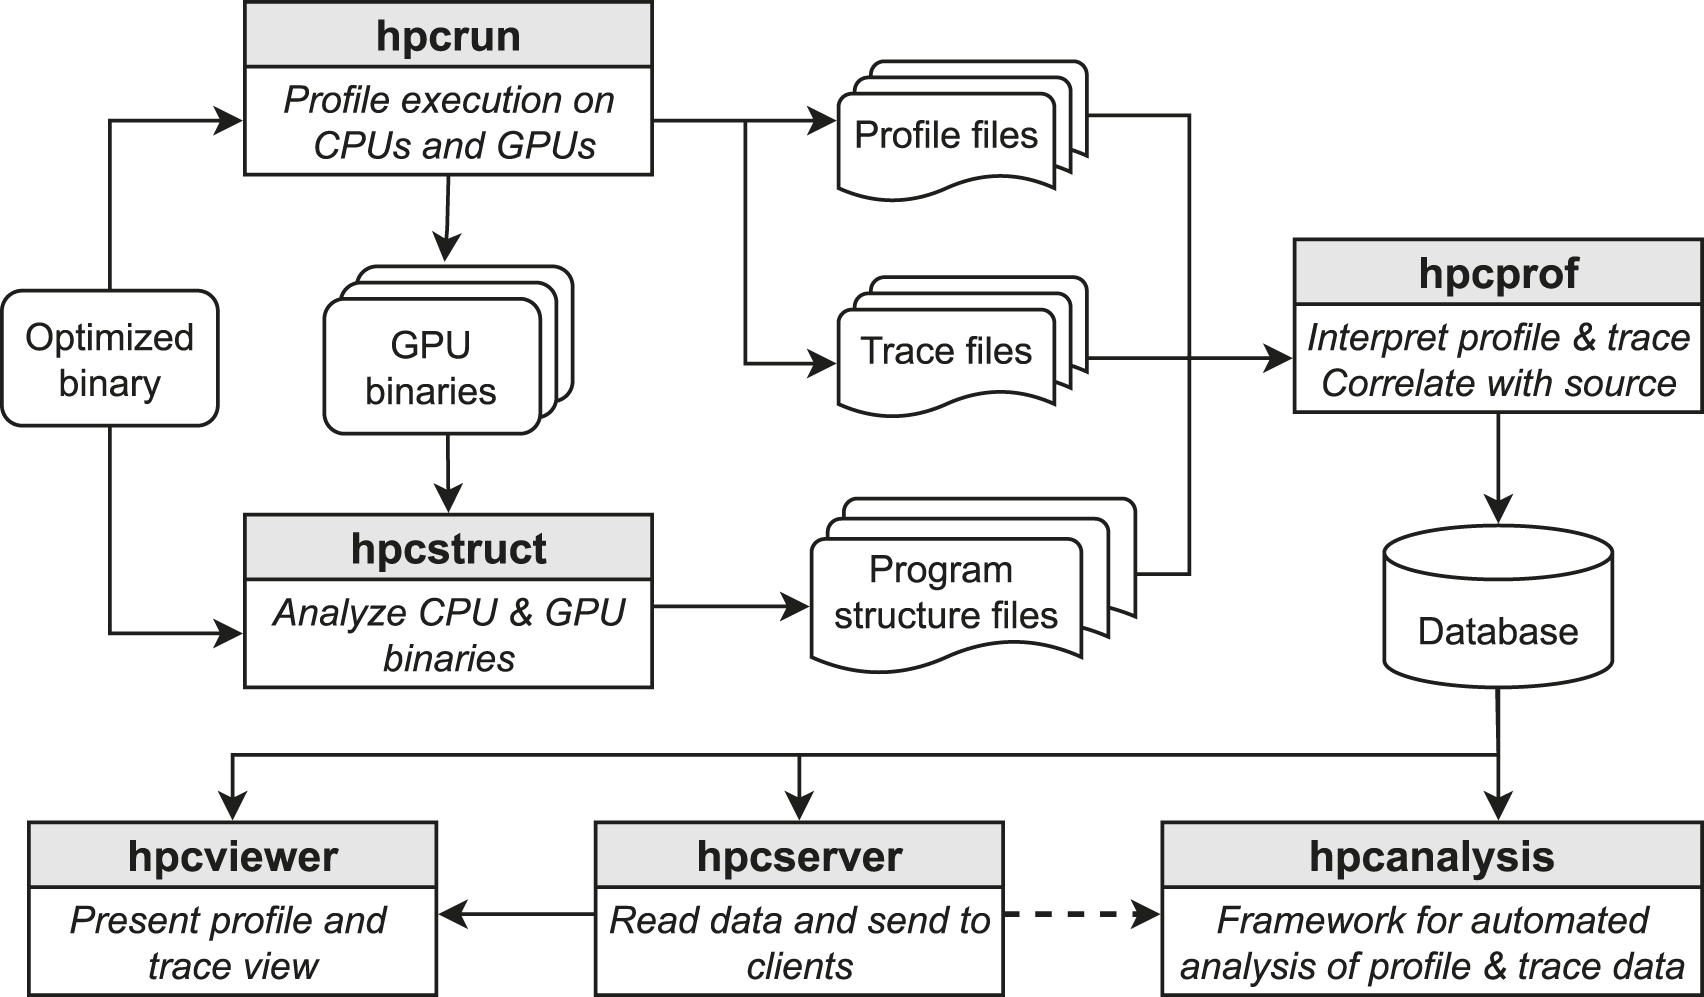
HPCToolkit’s measurement tool, hpcrun, collects call path profiles and traces as an application executes. To measure CPU threads, hpcrun uses statistical sampling to collect performance metrics and call stack unwinding to attribute costs to calling contexts. To measure GPU activity, hpcrun uses vendor-supplied APIs to collect activity traces of GPU operations, measure kernels with hardware counters, and in some cases collect instruction-level measurements within GPU kernels. The output of hpcrun is a measurement directory containing profiles, (optional) traces, and copies of GPU binaries observed during execution. There is one profile file and (optionally) one trace file per thread and GPU stream. Each profile file contains a calling context tree with metrics associated with individual calling contexts. Each trace file contains a sequence of <calling context tree node index, timestamp> pairs.
HPCToolkit’s binary analysis tool, hpcstruct, analyzes CPU and GPU binaries, recovering information recorded by compilers in symbol tables and line maps about procedures, inlined functions and templates, and source lines. Hpcstruct also recovers information about loop nests by parsing machine code, recovering application control flow, and identifying loops from cycles in the control flow of functions.
HPCToolkit’s postmortem analysis tool, hpcprof, reads measurement data and program structure files and then correlates performance metrics with program structure. Hpcprof uses both thread-level and optionally process-level parallelism to analyze measurement data, reconstruct a global calling context tree, generate per-thread metrics for each context, and integrate CPU and GPU traces. The output of hpcprof is a database directory containing sparse representations of profiles and (optional) traces.
The presentation layer of HPCToolkit comprises three applications: hpcviewer, hpcserver and hpcanalysis. Hpcviewer is a graphical user interface for interactive analysis of an application’s profiles and traces. Hpcanalysis is an emerging API for ad-hoc analysis and presentation of performance data. Hpcserver is an application that runs on a host where performance data is present and transmits that data to a remote client.
3. Scalable launch
While preparing HPCToolkit for exascale, we used pre-exascale CPU and GPU-accelerated systems to collect performance data on scientific applications using up to a thousand compute nodes (Anderson et al., 2022). On the Frontier exascale system, however, our example application, the Large-scale Atomic/Molecular Massively Parallel Simulator (LAMMPS) (Thompson et al., 2022), frequently crashed on launch when using more than a few thousand compute nodes, even without using hpcrun to collect performance data.
The root cause behind these crashes is the limited performance of Frontier’s Orion filesystem (Oak Ridge Leadership Computing Facility, 2024)—a shared Lustre filesystem that stores LAMMPS, HPCToolkit, and their library dependencies. Before an application such as LAMMPS can begin execution, the dynamic linker ld.so must first load all of the application’s library dependencies into the application’s address space. When more than a few thousand compute nodes simultaneously attempt to read library dependencies out of the shared filesystem, the filesystem’s servers are unable to service all requests for copies of the libraries before a 2-min initialization timeout. This timeout causes the application to crash before it begins execution. Adding separately-compiled, dynamically-linked libraries that belong to HPCToolkit’s measurement subsystem to an application’s dependencies exacerbates the difficulty of scalable launch.
Problems with scalable launch of dynamically-linked applications are not new; in fact, they’ve been researched for over two decades (Brightwell and Fisk, 2001). A way to avoid these problems is to use static linking, which integrates all library dependencies into an application’s executable and thus removes the need for dynamic linking with ld.so. Scalable launch approaches for statically-linked applications generally accelerate application launch by copying a statically-linked executable to all compute nodes prior to launch. Unfortunately, on GPU-enabled platforms, vendor GPU libraries are typically supplied only as shared libraries, meaning they cannot be statically-linked into an application. To make matters worse, static linking prevents both linker namespace isolation (Section 4.4) and LD_AUDIT function interception (Section 4.6), which are essential for performance monitoring of Intel GPUs or Python-based codes. These issues, combined with difficulties that we encountered building and linking HPCToolkit’s library dependencies as static archives, make this approach a naive and impractical solution for HPCToolkit.
At the time of this writing, Argonne Leadership Computing Facility’s documentation for using Aurora (ALCF, 2024a) offers no advice for scalable launch of a dynamically-linked application. For Frontier, Oak Ridge Leadership Computing Facility advises using sbcast to copy an application and its shared library dependencies to node-local storage on allocated compute nodes prior to application launch (OLCF, 2024). This strategy is difficult to use with software installed with third-party package managers such as Spack (Gamblin et al., 2015), the primary package manager for HPCToolkit, as Spack adds RPATH attributes into load modules to supplement default library search paths. After configuring Spack to include paths to the directories where we
We also investigated third-party tools designed to address scalable launch of dynamic binaries. LLNL’s Spindle (Frings et al., 2013) improves the performance of loading library dependencies by using an LD_AUDIT (Glibc Developers, 2024) auditor to intercept library loading and broadcast libraries to compute nodes instead of having each compute node independently request library dependencies from the filesystem. Shrinkwrap (Zakaria et al., 2022) is a tool that replaces library names in executables with full paths, which accelerates ld.so’s loading of library dependencies by removing the need to query dozens of directories in a search path to find them. Neither tool enabled us to launch at scale on Frontier: Spindle hung at launch while Shrinkwrap triggered the same incompatibility with vendor libraries as sbcast. In the end, the only way we managed to launch at scale was to Spack-install HPCToolkit and LAMMPS into node-local storage and then copy all load modules to all compute nodes as a tarball, a tedious process that is unsuitable for software in active development.
Although we have shown that it is possible to use HPCToolkit to measure large-scale executions of applications, we consider the problem of scalable launch unresolved in practice. It is unrealistic to expect every application team to hand-craft a scalable launch solution for their application and manually integrate shared libraries for HPCToolkit into it. Future supercomputers, exascale or otherwise, will need to carefully consider these issues and implement tools that help their users launch dynamically-linked applications on thousands of compute nodes. Third-party package managers designed for HPC systems, such as Spack, will also need to contribute to this effort and ensure that their strategies for linking applications and managing search paths used by the dynamic linker do not prevent scalable launch. Despite the challenges of scalable launch, we find that HPCToolkit remains well-poised to analyze the performance of exascale applications, as detailed in the following sections.
4. Measurement
As described in Section 2, hpcrun collects CPU and GPU performance metrics during program execution. CPU measurements are collected by sampling application threads and storing the samples into thread-private Calling Context Trees (CCTs). Unlike CPU measurement data, GPU measurement data cannot be directly collected by third-party tools. Instead, vendor runtimes deliver GPU monitoring data to runtime-managed monitoring threads.
Allowing monitoring threads to directly update HPCToolkit’s thread-private CCTs of application threads would make each CCT a highly concurrent data structure. This would require a complete re-design of HPCToolkit’s CCTs since they use splay trees (Sleator and Tarjan, 1985) to manage the children of each CCT node. While operations on splay trees are asymptotically efficient, splay trees are unsuitable for concurrency since even lookup operations typically rearrange a tree. Instead of re-designing HPCToolkit’s CCTs for concurrency, we keep CCTs private and communicate GPU measurement data from monitoring thread(s) to application threads.
4.1. GPU measurement: Initial design
NVIDIA was the first vendor to provide a performance monitoring interface for their GPUs. Their interface, known as CUPTI (NVIDIA Corporation, 2023a), employs a single monitoring thread for delivering GPU monitoring information to a first-party tool that operates within an application’s address space. Initially, we designed hpcrun to support communication between application threads and a single monitoring thread (such as the one used by CUPTI) using a pair of point-to-point wait-free bidirectional channels (Zhou et al., 2020b), referred to as correlation and activity channels, respectively. A correlation channel carries information from an application thread to a GPU monitoring thread about who launched a GPU operation and an activity channel carries performance information from a GPU monitoring thread back to an application thread. Additional channels are used to buffer (optional) traces to be recorded to the filesystem by one or more tool threads.
When using OpenCL (Stone et al., 2010) or Intel’s Level-Zero (Intel Corporation, 2024d), monitoring is a bit different: there is no specification of the thread or threads that may execute operation completion callbacks. For that reason, hpcrun redirected all GPU monitoring information to a runtime monitoring thread that forwards each record to its corresponding application thread.
When extending hpcrun to profile applications running on AMD’s GPUs, a drawback of this design became apparent. Unlike NVIDIA’s CUPTI, which uses a single GPU monitoring thread, AMD’s ROCm software stack (Advanced Micro Devices Corporation, 2024a) provides two libraries and an OpenMP (OpenMP Architecture Review Board, 2021) library that supports GPU offloading, each of which uses one or more dedicated threads for monitoring GPU operations: • AMD’s ROCTracer library (Advanced Micro Devices Corporation, 2024e) employs a thread for delivering HIP (Advanced Micro Devices Corporation, 2024b) trace records. • AMD’s ROCProfiler library (Advanced Micro Devices Corporation, 2024d) employs a thread for delivering performance counters measured while profiling HIP kernels. • AMD updated LLVM’s OpenMP’s device-independent libomptarget library to use one or more threads to deliver OMPT (Eichenberger et al., 2013) trace records.
Since hpcrun’s initial design assumed the existence of a single monitoring thread, we could only use it to monitor OpenMP programs on AMD GPUs after restricting the OpenMP device runtime to employ a single monitoring thread. Furthermore, profiling applications that employ both HIP and OpenMP required a multiplicity of channels.
When monitoring the TensorFlow (Abadi et al., 2015) framework for machine learning on systems with NVIDIA or Intel GPUs, we noticed that TensorFlow tends to launch roughly 4× as many application threads as the number of hardware threads on a node. For every application thread, hpcrun assigned a bidirectional channel for reporting GPU performance information.
Thus, as we moved beyond NVIDIA GPUs, multiple GPU monitoring threads led to an explosion of point-to-point communication channels, which was problematic.
4.2. GPU measurement: New design
To better position hpcrun for monitoring applications running on a range of GPU-accelerated exascale systems that employ threads differently within runtimes and profiling libraries, we redesigned hpcrun’s measurement subsystem around a novel, non-linearizable Multi-Producer, Single-Consumer (MPSC) concurrent queue with constant-time operations. The high-level design of the new architecture is shown in Figure 2. This new design, implemented in HPCToolkit’s main branch has two benefits. First, it reduces the number of channels needed for bidirectional communication between n application threads and m monitoring threads from n × m bidirectional channels to n + m MPSC queues. In the new design, each application thread has an MPSC queue where it receives GPU activity records and each monitoring thread needs an MPSC queue so that application threads can return GPU activity records to their originator. Second, it avoids the need for monitoring threads to poll multiple incident channels. HPCToolkit’s new infrastructure for coordinating application threads, monitoring threads, and tracing threads. Instead of making all data structures concurrent, HPCToolkit uses Multiple-Producer-Single-Consumer (MPSC) queues to communicate information between threads. Each thread uses information that arrives in its queue to update its own data structures.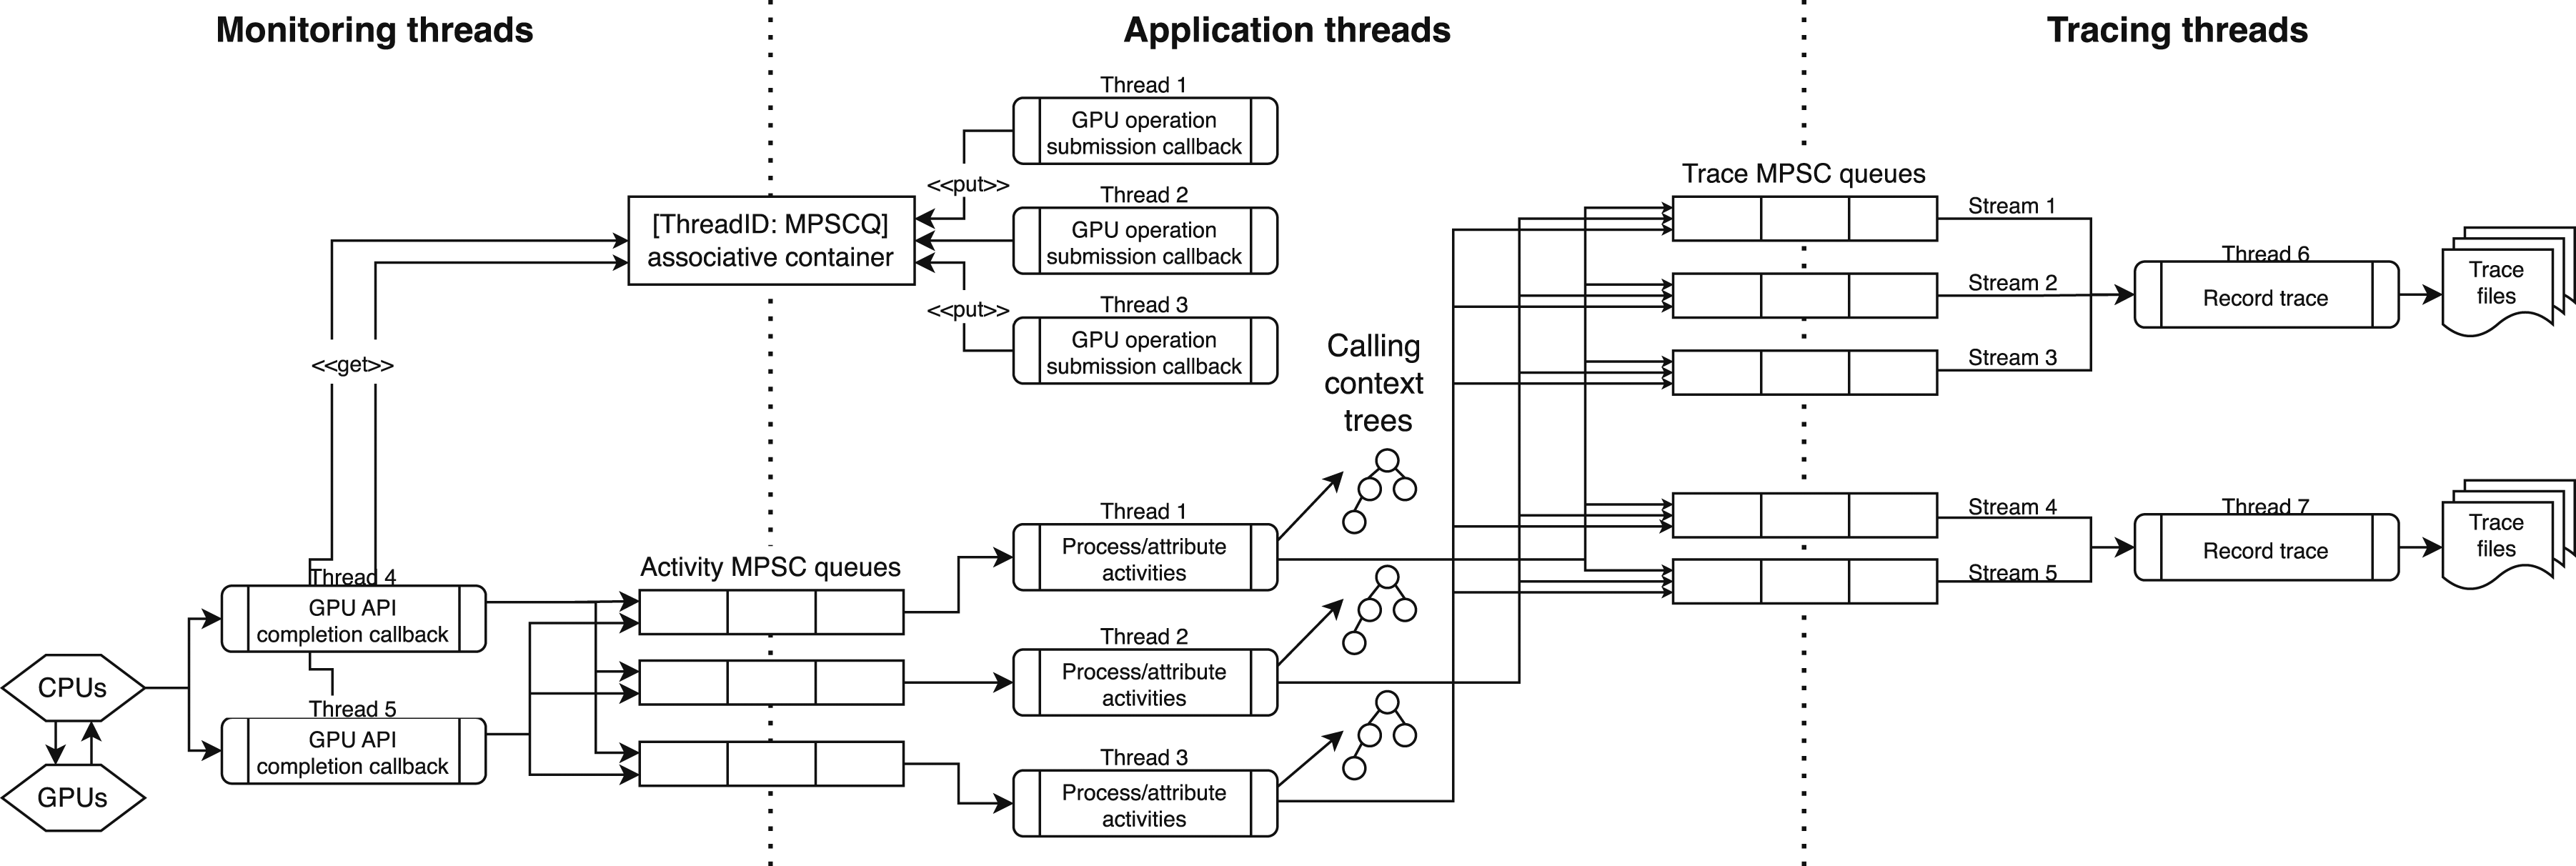
Here, we describe how hpcrun uses MPSC queues to communicate data between threads. When an application thread initiates a GPU operation (e.g., launching a kernel or a data copy), hpcrun unwinds the application thread’s call stack to determine the calling context of the operation. After the operation completes, a monitoring thread will receive one or more GPU activity records associated with the operation, and forward the activity records to the proper application thread via its MPSC queue. Finally, the application thread will consume these records and update performance metrics associated with the calling context of the GPU operation.
To match GPU activities with calling contexts, hpcrun uses correlation IDs. Monitoring threads use correlation IDs to determine which application thread contains the calling context tree. Depending on the vendor’s API, finding the thread with the calling context tree can be done in two ways. First, if the vendor’s API supports user-provided, 64-bit correlation IDs, we encode the thread ID in the higher 32 bits, and we use the remaining 32 bits to distinguish between GPU operations invoked by the same thread. Mapping thread IDs to application thread MPSC queues to return GPU performance records is done using a global concurrent data structure that supports fast insertions and reads for sequential IDs. If a vendor’s GPU monitoring API does not support user-provided correlation IDs, we maintain a shared associative container that provides the mapping from a correlation ID to the initiating thread.
When tracing is enabled, GPU activities are separated by stream and we create a separate MPSC queue to collect each stream’s trace information. Since multiple application threads may receive GPU activity records associated with the same stream, using an MPSC queue allows multiple application threads to send the trace data to the same trace stream. To avoid a slowdown if an application thread uses a large number of streams, HPCToolkit will create multiple tracing threads to write trace files for GPU streams to the filesystem. Each tracing thread writes traces for a distinct set of streams.
As described in this section, the MPSC queue is a critical component of the HPCToolkit’s new GPU measurement subsystem. In the next section, we describe the design of the MPSC queue itself.
4.3. MPSC queue
To efficiently pass performance information from monitoring threads to application threads as an application executes, we developed a novel unbounded, non-linearizable (Herlihy and Wing, 1990), Multiple-Producer, Single-Consumer (MPSC) queue with constant-time enqueue and dequeue operations. To our knowledge, no other concurrent queue design supports constant-time enqueue and dequeue operations.
We used a linked-list-based linearizable MPSC queue by Mellor-Crummey (1987) as the inspiration for our design. In that queue, an enqueue operation completes with a constant number of instructions. However, a dequeue operation may block to guarantee linearizability. For instance, if enqueue operation 2 linked an item behind another item being inserted by enqueue operation 1 but enqueue operation 1’s item is not yet visible at the head of the queue, a concurrent dequeue operation waits for enqueue operation 1 to complete. This guarantees that the dequeue operation does not return empty when enqueue operation 2’s item is already logically in the queue.
For communicating performance information to application threads in hpcrun, we altered the dequeue operation in Mellor-Crummey’s linearizable MPSC queue to return empty rather than waiting for an unfinished enqueue to complete. This change sacrifices linearizability in favor of constant time operations. When delivering performance information, linearizability is unnecessary; our only requirement is that all performance records are eventually delivered. In hpcrun, we guarantee that all performance records are eventually delivered by ensuring that as an application thread finishes, it waits to consume all activity records in flight by repeatedly calling dequeue until no more enqueues are in flight. Since this process happens just before an application thread terminates, the implied wait is not on the application’s critical path and thus will not dilate the application’s execution while it is being measured.
Listing 1 presents our MPSC queue. An element in the queue contains an atomic pointer to the next element in the queue and measurement data represented by an activity or tracing record. Our MPSC queue is represented by two atomic pointers: to the head and tail of a linked list. Procedure init_queue initializes the empty queue by setting Q.head and Q.tail to NULL. Procedure enqueue prepares the new element e to become the tail of the queue by setting e.next to NULL. Then, enqueue uses atomic_exchange to replace the previous value of Q.tail (stored in previous_tail) with e, which becomes the last element of the queue. A NULL value of previous_tail indicates that the queue was empty, so e is linked at Q.head as the only element in the queue. However, if the queue was not empty, then enqueue finishes by linking e after the previous_tail as shown on line 16.
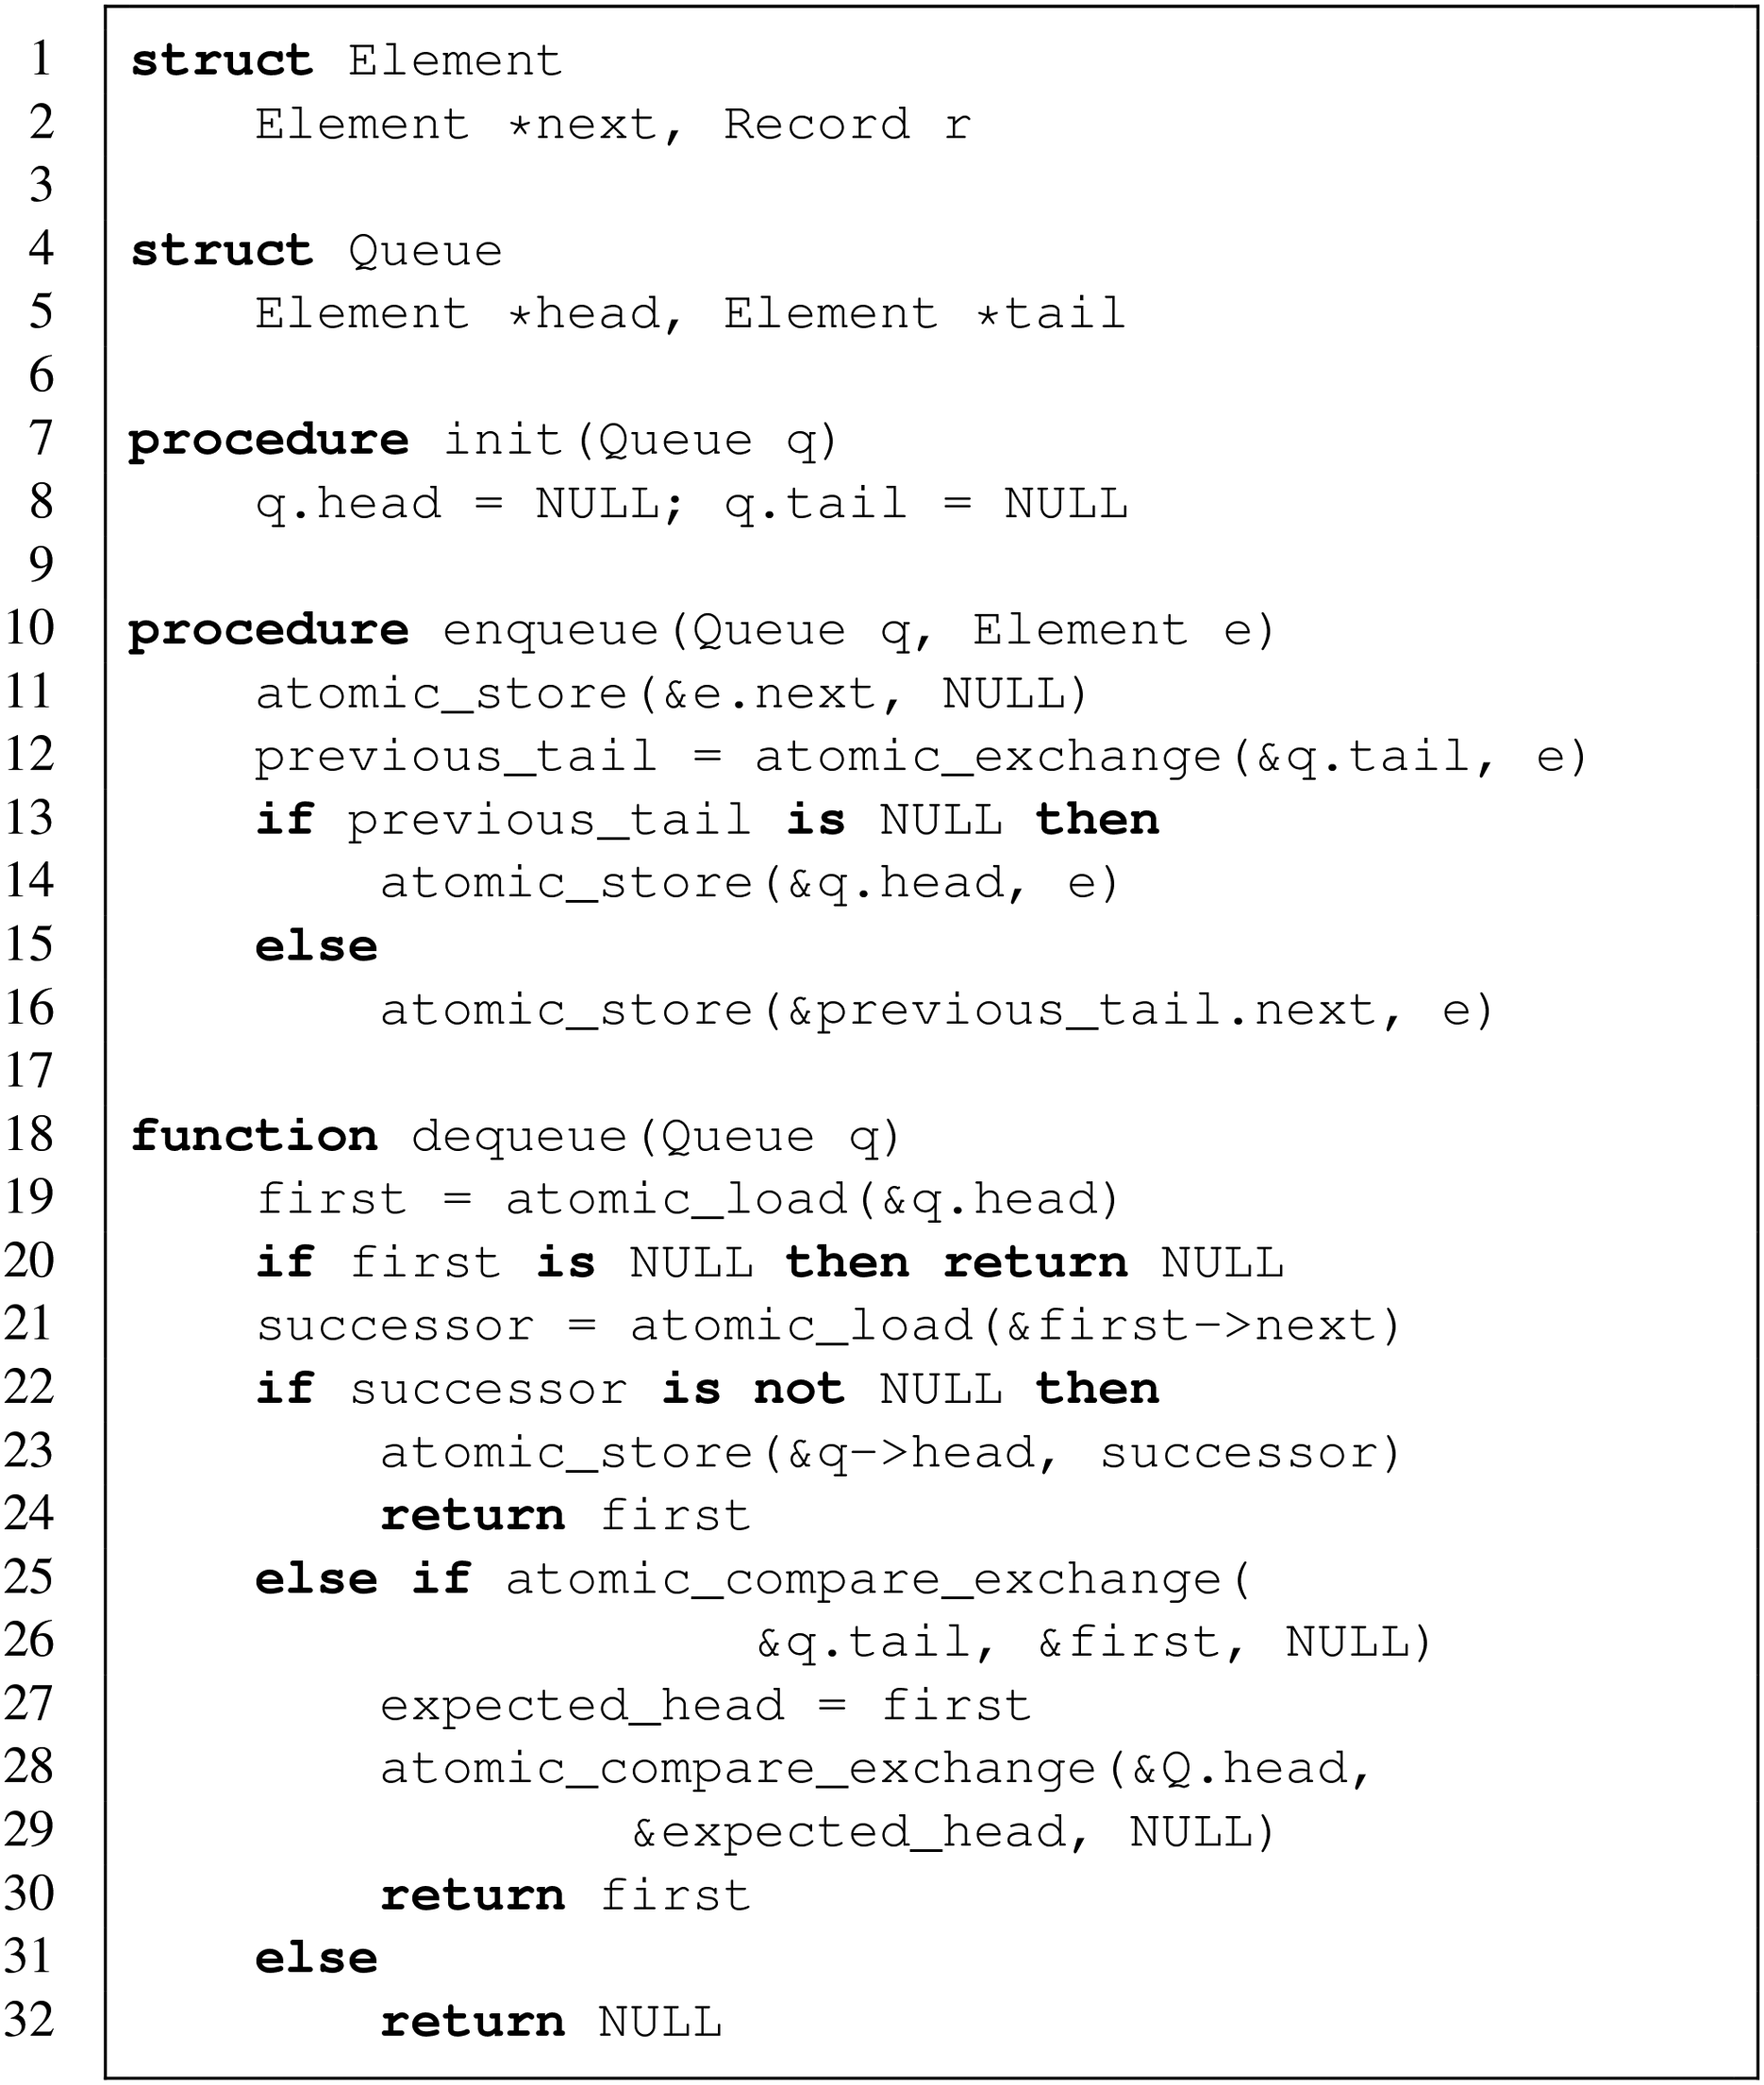
The dequeue procedure loads the value of Q.head into first. If first is NULL, the queue is empty, and the procedure returns NULL. Otherwise, dequeue determines the existence of first’s successor by reading first.next. If successor is not NULL, it is linked at Q.head, and dequeue returns the first element. Otherwise, the queue is either a singleton or a concurrent enqueue operation is in progress and has yet to link an element behind first.
The atomic_compare_exchange on line 25 tests if the Q.tail points to first. If it does, the queue is a singleton, so the same primitive tries removing first from the Q.tail. If it succeeds, the dequeue operation considers first as removed from the queue and becomes responsible for transitioning the queue into the empty state defined by init_queue. To do so, it tries removing first from Q.head by invoking atomic_compare_exchange on line 28. If the atomic_compare_exchange succeeds, then the queue is empty. Otherwise, a concurrent enqueue operation inserted a new element at Q.head. Even if the atomic_compare_exchange on line 28 fails, first has been successfully removed from the queue and is returned by dequeue on line 30.
The failure of atomic_compare_exchange primitive on line 25 means Q.tail does not point to first. Hence, the queue contains at least two elements. If first.next is NULL, it means that a concurrent enqueue operation inserted an element e into the queue but has not finished linking it after first. Our dequeue operation does not wait for e to be linked as line 32 shows. Note that this implementation of dequeue may violate linearizability by returning NULL when invoked on a non-empty queue. As described previously, linearizability of operations on an MPSC queue is unnecessary when using the queue to pass performance information between threads; the only requirement is that all performance information is eventually received by the dequeuer.
4.4. Using private namespaces for C++
Developing a measurement tool such as HPCToolkit is a complex task that requires the integration of various measurement libraries, each providing specific measurement capabilities. First party measurement tools are traditionally written in pure C; doing so enables a tool to share the address space of an application process, which greatly accelerates key measurement operations such as stack unwinding. Writing a tool in pure C requires that all libraries it uses are also written in pure C; however, today developers of tool components are eschewing C for C++ to manage the growing complexity of their software and improve development productivity. For example, Intel’s GTPin library (Intel Corporation, 2024a), which supports binary instrumentation of kernels that execute on Intel GPUs, recently dropped its C API in favor of a rich C++ API. This shift poses a major challenge to HPCToolkit’s future and timely support of such components.
There are many issues that arise when using C++ to write measurement tools that share an application’s address space. Many of the standard library features included with C++ are implemented with the assistance of one or more shared libraries linked with the final binary, e.g., libstdc++ 1 . If the compiler used to build the application differs from the one used to build the tool, the libraries required by each may be incompatible and cause crashes at runtime. Similarly, weak symbols are heavily used to implement C++ templates and “inline” code segments, including templates in the Standard Template Library. If tool and application C++ compilers differ, the implementations of these weak symbols will differ and can cause unexpected crashes or other misbehavior by violation of the One definition Rule. We cannot in general ensure that tool and application compilers are compatible as applications often use vendor compilers that cannot be used to compile HPCToolkit.
Our current solution isolates code sensitive to conflicts in a separate, private link namespace created by the dlmopen GNU extension available in GNU libc. This separates the libraries loaded by HPCToolkit from those loaded by the application, preventing the potential aforementioned conflicts while still sharing the application’s process address space. Currently this isolation is only implemented for a small fraction of the code in hpcrun, including the C++ interface to Intel’s GTPin library and certain unwinder libraries 2 . We plan to extend this solution to the majority of the code in hpcrun, which will improve our own productivity by permitting us to write C++ to implement our own measurement functionality.
A challenge we encountered while implementing this solution was that link namespaces other than the application’s lack proper support for debugging in GDB (GDB maintainers, 2022). Improvements in GDB 13.1 make symbols in namespaces created using dlmopen visible, however symbol visibility within namespaces created by LD_AUDIT are not available unless using Glibc 2.35 or above. As of this writing, Glibc 2.35 or later is not yet available on the DOE’s exascale platforms.
4.5. Measuring Python-based applications
Increasingly, scientific applications are being written in a mixture of Python and C/C++. Such applications use a high-level single-threaded Python script to call multi-threaded low-level operations dynamically loaded from a C/C++ extension module, which may then launch optimized kernels onto one or more GPUs. Previous versions of HPCToolkit were only able to measure C/C++ code, meaning it measures and attributes costs to the CPython interpreter rather than Python application code. Supporting better attribution to Python code required changes to HPCToolkit’s support for both measurement and attribution. Prior papers (Zhou et al., 2021a) describe HPCToolkit’s approach to produce a “hybrid” calling context spanning C/C++ and offloaded GPU code. Here, we report how we enhanced this functionality to also support Python code. Unlike other Python profilers such as Scalene (Berger et al., 2023), we produce a “hybrid” calling context spanning Python, C/C++, and offloaded GPU code as shown in Figure 3. A hybrid call stack from an example TensorFlow application measured by hpcrun. This demonstrates how HPCToolkit attributes GPU performance data back through C/C++ library code to a user’s high-level Python code.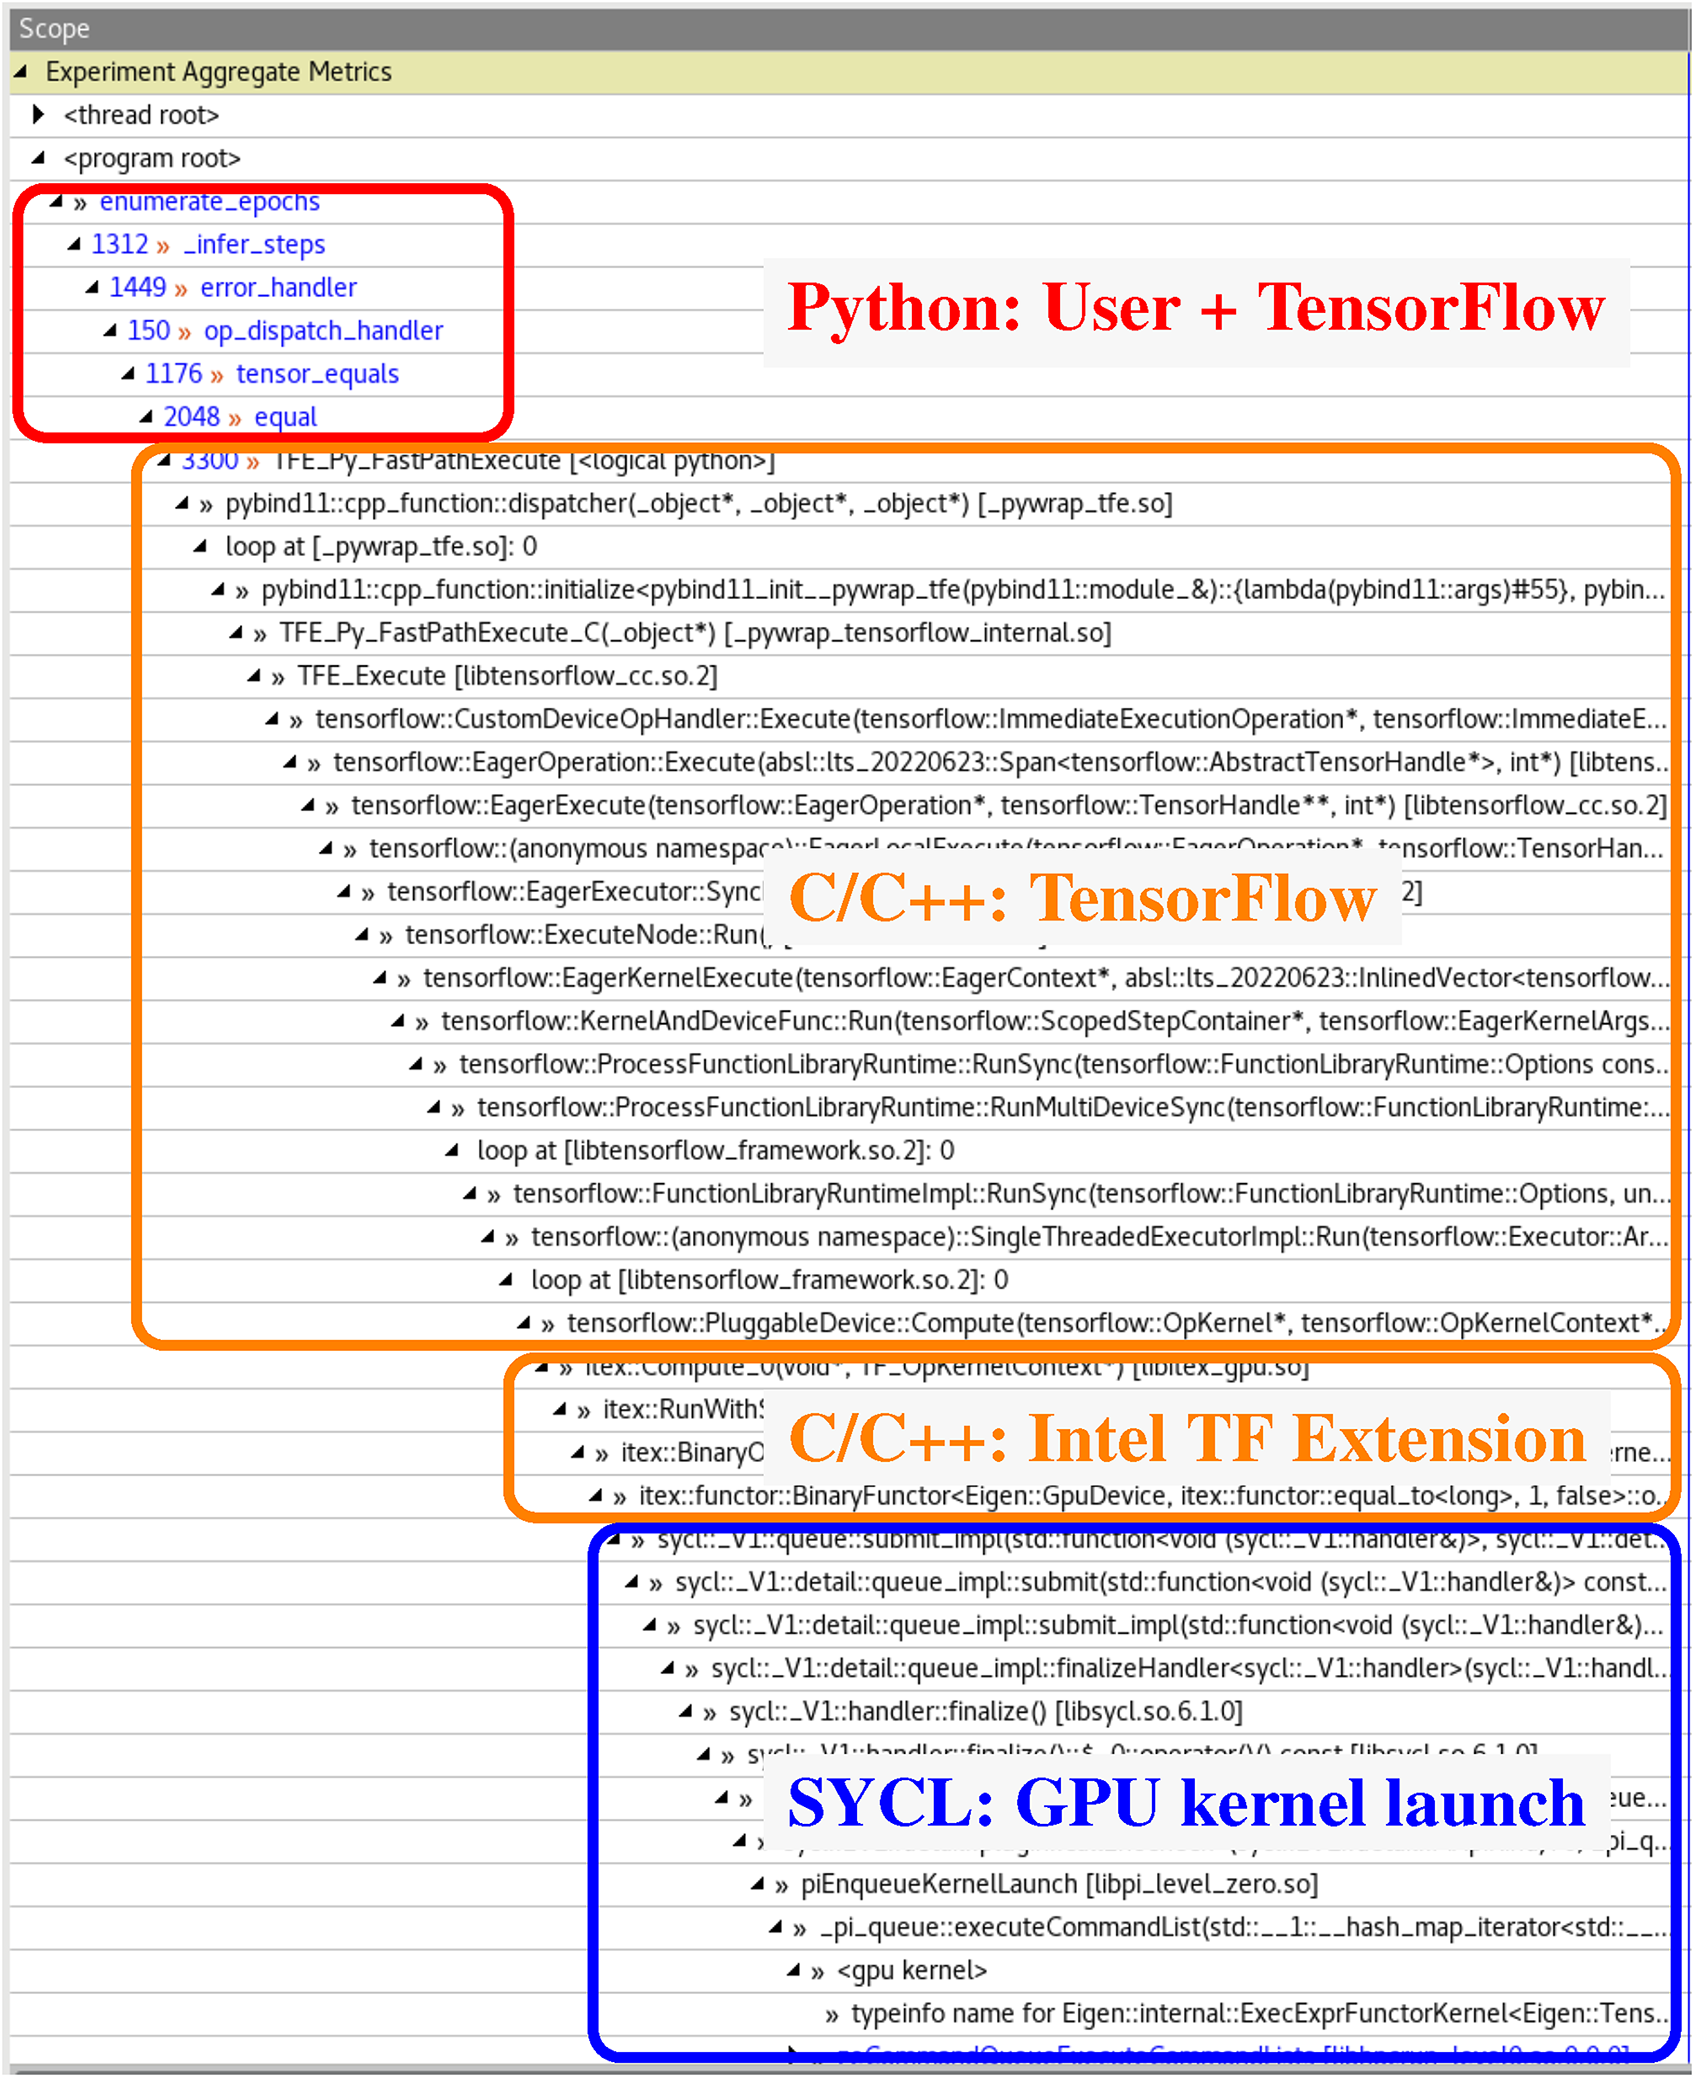
Attributing performance data to Python calling contexts requires the use of instrumentation. HPCToolkit uses this instrumentation in conjunction with asynchronous sampling to gather performance information. Hpcrun uses profiling hooks provided by the CPython interpreter to track Python actions, namely calls to or returns from a Python callable object or C/C++ extension module. Hpcrun uses these hooks to manage a per-thread shadow stack, each frame of which tracks a particular frame of execution in the Python call stack including the active function’s name, file and line number. When an asynchronous sample event interrupts a thread, hpcrun unwinds both the C/C++ call stack and the Python call stack via the shadow stack, and associates performance metrics with a hybrid calling context, which includes information from both.
Producing such hybrid calling contexts requires additional information to associate Python and C/C++ call stacks. When C/C++ calls into a Python function or vice versa, we record the topmost frame(s) in both call stacks as associated “transition frames”, identifying frames in the C/C++ call stack by their stack pointer. The frames of a C/C++ unwind between two transition frames belong to the CPython interpreter and not the application or an extension module. Then, to produce a hybrid calling context, hpcrun replaces each such range of frames in the C/C++ unwind with the associated range of frames from the Python shadow stack. This operation is orthogonal to hpcrun’s support for GPU calling contexts, which appends new leaf calling contexts. Thus, hpcrun’s new support for Python enables hybrid calling contexts that span Python and C/C++ code on the CPU in addition to GPU code as shown in Figure 3.
HPCToolkit uses a pair of integers to represent C/C++ frames; for consistency, we use this same representation for Python frames. For C/C++ frames, the first integer represents a load module as an index in a table of observed CPU or GPU binaries, while the second integer records the offset of a machine instruction within a binary. For Python frames the first integer still refers to a load module, but this load module represents a string table augmented on-the-fly as an application executes with entries for Python function names and source files encountered. The second integer contains two sub-fields: high-order bits that encode an index for the string table and low-order bits that encode a line number. We chose this approach so that the first integer consistently refers to the file containing the function names and source file information for the recorded calling context. During postmortem analysis, hpcprof abstracts away the difference and loads either DWARF for an application binary or a Python string table. The second integer is interpreted by the abstraction to produce a rich structure of function, source file, and line calling contexts. Using this abstraction enables HPCToolkit to produce a hybrid calling context with minimal change to its existing codebase.
4.6. Future tooling interface: LD_AUDIT
Performance measurement tools such as HPCToolkit must intercept certain functions to manage application execution or gather information at runtime. Like many other tools, hpcrun uses LD_PRELOAD to add lightweight wrappers around key functions. For example, hpcrun’s wrapper for pthread_create tracks when the application creates new threads, and its wrapper for sigaction prevents the application from overwriting hpcrun’s signal handlers. Unfortunately, LD_PRELOAD only applies during “implicit” symbol resolution, explicit symbol resolution by calling dlsym often avoids wrappers introduced by LD_PRELOAD. We have noticed an increase in the use of dlsym in low-level system libraries. For example, we have seen HPE’s SGI MPI and the UCX communication library (HPE, 2015; UCF Consortium, 2024) fetch and subsequently call pthread_create and sigaction (respectively) via dlsym, causing hpcrun to produce incoherent performance data or outright crash. Another problem is that using an LD_PRELOAD wrapper for dlopen to track the loading of application library dependencies interferes with the dynamic loader’s use of RUNPATH attributes. These difficulties pose a major challenge for the future of HPCToolkit and other performance tools.
The LD_AUDIT interface is an extension available in Glibc that provides a potential solution to each of the aforementioned challenges. First, each “auditor” loaded by LD_AUDIT is isolated in a namespace separate from other auditors and the application. This enables an auditor to use high-level language runtimes without conflict (described in Section 4.4). Second, auditors receive a callback on every symbol resolution (la_symbind) and can resolve a function to a wrapper, enabling auditors to intercept functions located using dlsym. Third, auditors receive callbacks when application libraries are loaded (la_objopen) or unloaded (la_objclose)), this removes the need to intercept dlopen to track application libraries, avoiding problems with RUNPATH attributes.
Despite LD_AUDIT being available in Glibc for years, we discovered a number of bugs in Glibc’s implementation of LD_AUDIT that cripple our ability to use many of its features. Our current auditor in hpcrun only leverages features known to work. At present, hpcrun uses LD_AUDIT to track application libraries but continues to use LD_PRELOAD to intercept symbols. We documented these bugs with reproducers (Mellor-Crummey et al., 2021) as part of a collaboration with Glibc maintainers, which resulted in many of the most critical LD_AUDIT bugs being fixed in Glibc 2.35. At the time of this writing, these fixes are not yet available on Frontier or Aurora but are available in recent versions of Red Hat Enterprise Linux. In anticipation of these fixes becoming widespread, we plan to refactor hpcrun to additionally intercept symbols using LD_AUDIT.
5. Binary analysis
As described in Section 2, HPCToolkit uses its hpcstruct binary analysis tool to gather information from CPU and GPU binaries about the mapping from machine instructions to source code. To accelerate analysis of large CPU and GPU binaries, as part of the ECP, we developed support for parallel analysis of large binaries using multi-threading (Meng et al., 2021).
However, when we tried to analyze binaries used by an execution involving 64K MPI ranks and 64K GPU streams on Frontier, we encountered an unexpected bottleneck in HPCToolkit’s workflow. Before hpcstruct can analyze the CPU and GPU binaries involved in an execution, it must first identify them from the load map embedded in each individual profile file recorded for a CPU thread or GPU stream. The approach used for years on smaller scale systems (using a sequential program to extract the list of load modules referenced by each profile, concatenating the lists, sorting the result, and eliminating duplicates) took minutes, even when using a Makefile to initiate analysis of multiple profiles in parallel. The slowness of this step had the effect of delaying initiation of parallel binary analysis on program load modules.
To more rapidly identify the load modules used by a program from many profiles collected for a large-scale execution, we developed hpcproflm—a new utility that uses an OpenMP parallel loop to scan the profiles in a measurement directory in parallel. Using hpcproflm reduces the time for identifying the load modules in a large-scale execution from minutes to seconds.
6. Postmortem analysis
Today, HPCToolkit exploits multiple strategies to analyze measurement data from exascale executions (Zhou et al., 2021a). This section describes the challenges in some of the strategies and our solutions. Section 6.1 describes the problem of call path unification. Section 6.2 describes strategies for improving I/O performance when writing profiles and traces. Section 6.3 describes the challenge imposed by the large size of GPU calling context trees inside GPU kernels and our solution to address it.
6.1. Call path unification
To enable efficient and consistent analysis of performance data, HPCToolkit attributes all performance data to a unified Calling Context Tree (CCT) that includes all call paths encountered in the profiles of each CPU thread or GPU stream. Today, HPCToolkit employs a hybrid method that exploits both shared-memory and distributed-memory parallelism to achieve consensus about the numbering of nodes in the unified CCT. Within an MPI rank, OpenMP threads share concurrent data structures to construct a local unified CCT for a set of profiles. Between MPI ranks, a reduction combines local unified CCTs from individual ranks to construct a global unified CCT, which is then broadcast to all ranks. Even though a reduction for this purpose is communication-efficient and has a short critical path, we have found that this reduction phase can take significant analysis time: up to 30.4% of hpcprof’s execution time when analyzing measurements gathered from 8K MPI ranks and 8K GPU streams.
We believe that the best approach for improving the performance and scalability of hpcprof is to replace this reduction phase with an approach that does not require communication. The purpose of the aforementioned reduction is to produce a consensus across MPI ranks about a unique identifier for each call path. We have begun to explore an alternative strategy for producing a consensus identifier for each call path by hashing information for each node along a call path. The challenges of using hashing for this purpose are to ensure the probability of collisions will be low enough and to handle collisions appropriately. While we have ideas for how to use hashing for this purpose and estimates of the additional space needed (hash codes need more bits than the dense node identifiers that hpcprof uses today), it is premature to discuss these ideas in detail until we have validated their practicality. We plan to investigate this hash-based approach for constructing a unified CCT and describe the details in a separate paper if the approach proves useful in practice.
6.2. Serialized I/O to parallel I/O
Hpcprof exploits non-overlapping writes from all threads in parallel to assemble analysis results files. When multiple MPI ranks are used, we use an exclusive scan across all MPI ranks to pre-allocate the output regions for each MPI rank and determine file offsets for processed profiles and traces. To fully exploit the available parallel I/O, each rank assigns one thread to communicate with other ranks to determine the allocations and all other threads continue to read and process profiles and traces in parallel. The processed results are stored in a temporary in-memory buffer before the allocation is complete and directly written to the output files afterward. In hpcprof’s current implementation, only the thread in each rank that performs the scan flushes data accumulated in the buffer to the output file. On Frontier’s Lustre filesystem (Orion) (Oak Ridge Leadership Computing Facility, 2024), we found that this serial I/O becomes a bottleneck, in one instance this thread completed its work 24 min after all other threads had finished.
Our initial approach to avoid this I/O serialization was to parallelize flushing the buffer among the threads that have completed their work, which accelerated hpcprof by 4.56×. With this initial bottleneck suppressed, we further found that the parallel I/O would occasionally “hang” and perform less than expected, causing significant load imbalance across the MPI ranks, as shown in Figure 4. This led us to explore alternative I/O primitives and strategies for better performance. Execution trace of parallel I/O in hpcprof running on 4 compute nodes with 56 threads per node. Color indicates sampled active work or pending MPI communication, white indicates idleness or blocked I/O. Highlighted blocks indicate significant and seemingly random hangs during I/O calls on two ranks, which cause large load imbalance across the ranks.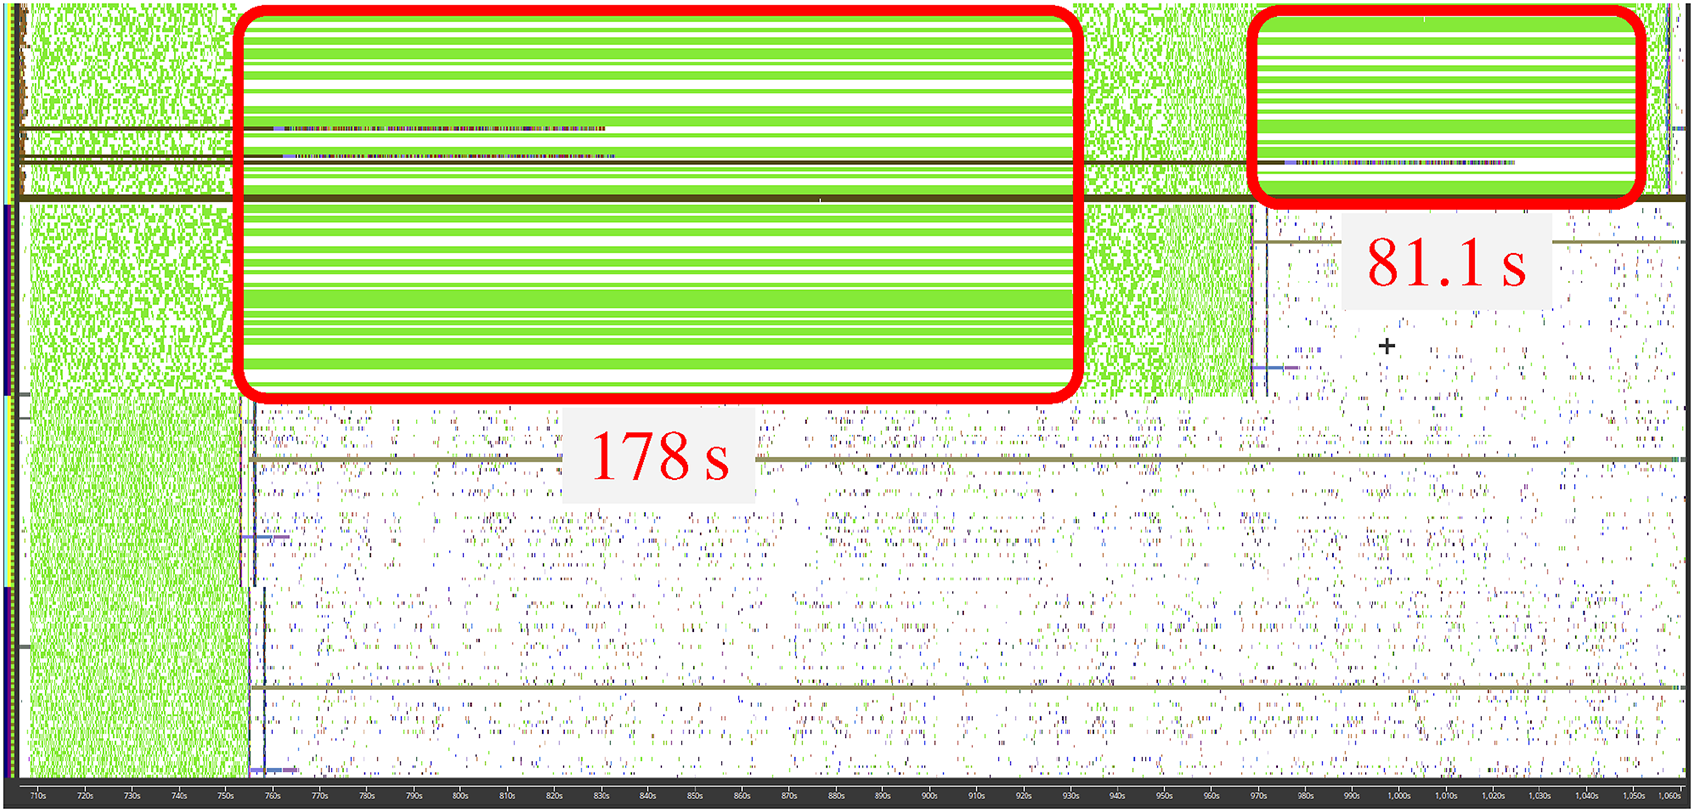
Performance of hpcprof on 4 compute nodes, using 56 threads per node in a single MPI rank. We ran the experiment with multiple algorithms and I/O strategies and compare their relative overall performance above. Details of the algorithms and I/O strategies used are described in the text.
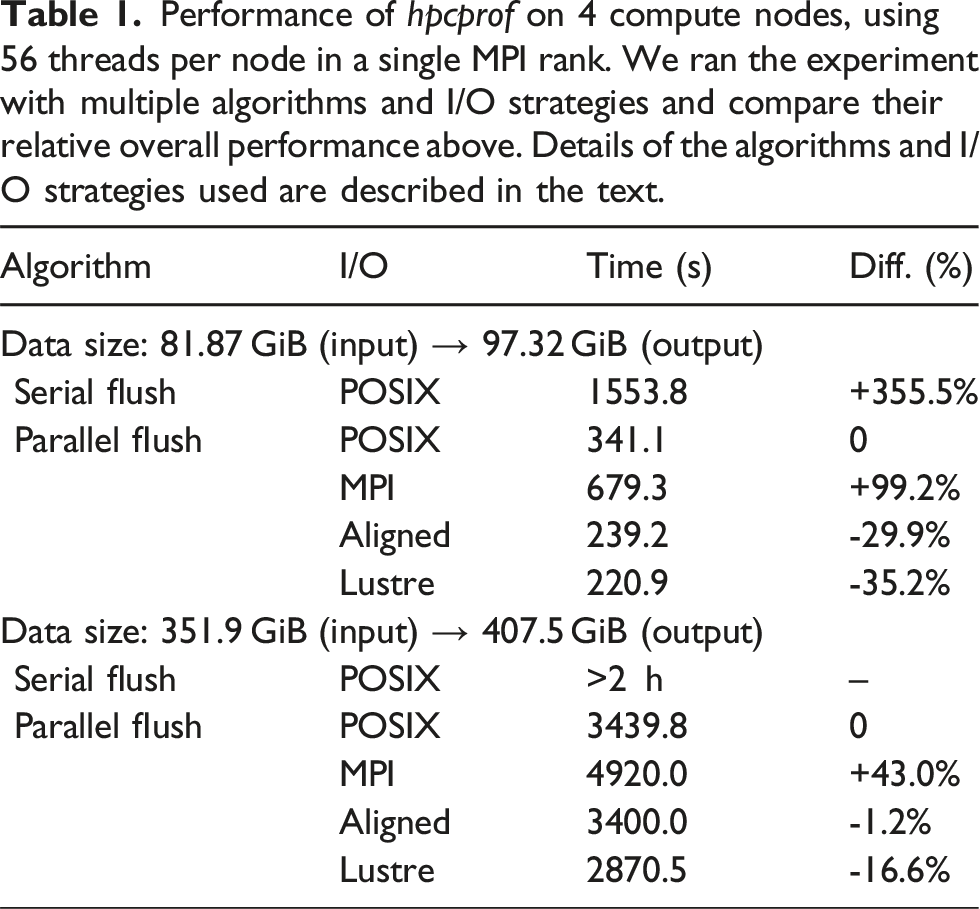
We then tried two more I/O strategies using POSIX I/O primitives. Lustre uses extent locks to maintain consistency across concurrent readers and writers (Moore et al., 2018). However, on Linux, the entire page must be locked to implement the page cache, which may cause contention between compute nodes. Therefore, we aligned all writes to the next 4 KiB page boundary to ensure the locks acquired by each MPI rank are non-overlapping (Aligned). This provided a minor performance boost as shown in the table. Then, we manually striped the output files with Lustre API calls when creating them (Lustre), which achieved the best overall performance. Although the Frontier user guide (OLCF, 2023) recommends against manual striping for files less than 512 GB, doing so boosted the speed of hpcprof by over 16% compared to the default Progressive File Layout (Mohr et al., 2016) settings.
In addition to the prototype I/O solutions evaluated in Table 1, we plan to explore an alternative I/O approach that eliminates the buffers used while waiting for allocations, and instead, dynamically allocates regions in the output file while I/O progresses in parallel. This approach would remove the exclusive scan and avoid mass synchronization across threads. We expect this will improve our utilization of parallel I/O resources.
6.3. Representing GPU calling context
Many state-of-the-art performance tools attribute performance metrics to calling contexts monitored in the application, including the full call path from the top-level main function down to leaf functions. HPCToolkit efficiently represents 100,000s of diverging call paths by storing them in a calling context tree, where each node in the tree represents a unique call path with a parent call path and additional stack frame. While this works well for CPU code, GPU code introduces a unique challenge as stack unwinding is unavailable in current GPU software stacks. Within each GPU kernel. HPCToolkit records flat samples in hpcrun and then reconstructs an approximate calling context tree profile postmortem in hpcprof based on static control flow information (Zhou et al., 2021a).
For complex GPU codes where a function is called from many different locations throughout the code, the reconstructed calling context tree balloons to sizes impractical to process. We have observed this with Mercury, a Monte-Carlo particle transport code developed at Lawrence Livermore National Laboratory (Brantley et al., 2016). In Mercury, some device functions contain over a hundred call sites to a GPU math intrinsic causing some GPU kernels to contain millions of reconstructed call paths. A more efficient representation for GPU performance data is a call graph where each node represents a unique range of instructions and edges possible calls. In fact, hpcprof currently constructs a call graph within each GPU kernel before splitting nodes to create a calling context tree. Each call path with a GPU kernel in the final reconstruction can be easily recovered by traversing the call graph. However, using such a call-graph based representation for CPU code would reduce the precision of attribution.
Our solution to this scaling challenge is to generalize both approaches as a “directed calling context graph” (DCCG), a graph that combines the features of calling context trees and call graphs by only separating nodes that can be measured independently. For example, if function F is called from functions A and B in CPU code, hpcrun can unwind the call stack to identify the caller and thus the DCCG contains two nodes for F each with a single incoming edge much like a calling context tree. However, if the same occurred on a GPU, hpcrun cannot unwind the call stack to identify the caller, so we represent this dependence by creating a single F node with two incoming edges much like a call graph. In this latter case the single F node represents two call paths, the performance metrics for F (and its callees) are apportioned to its two potential callers based on the relative number of calls from each. We record these apportioning factors on the incoming edges of F, which does not increase the size of the representation but still permits a reader to recover the performance cost attributed to each call path post-hoc. This solution should dramatically reduce the size of the representation for GPU kernels compared to calling context trees while avoiding imprecise attribution of costs for CPU code.
Many traditional algorithms for performance analysis are designed for calling context trees, these algorithms need to be carefully adjusted to be applied to a DCCG. For the example of “top-down” performance analysis, the recursive expansion of call paths starting from the root main function transitions well by treating the outgoing edges of a node as “children,” but calculating the “inclusive” cost of each node and its children requires the identification of strongly-connected components and a topological sort of the DCCG. We plan to transition the performance analysis features of HPCToolkit to our novel DCCG representation in a future version, preserving the current functionality while simultaneously accelerating our postmortem analysis and visualization for data gathered from GPU-accelerated codes.
7. Presentation
The presentation layer of HPCToolkit is composed of three distinct applications. First, hpcviewer is a Java-based graphical user interface that enables users to interactively explore and analyze performance data. Second, hpcanalysis is a Python-based API and analytical framework for processing performance data and visualizing analysis results. Finally, hpcserver operates on a host where performance data is present, extracting and transmitting subsets of the data requested by a (typically remote) client.
7.1. hpcviewer
To support interactive analysis of large-scale performance data collected on exascale systems, we have improved hpcviewer’s responsiveness and scalability with a multi-faceted approach. First, to reduce the wait when opening very large performance databases, hpcviewer now uses a lazy loading strategy for its Graphical User Interface (GUI) components. Rather than loading all of its GUI components into memory when it is launched, hpcviewer loads them on-demand. This avoids the cost of loading and initializing unused components, which reduces startup delay.
Second, after reading the calling-context tree (CCT) of a program into memory, hpcviewer only reads data necessary to display metrics for parts of the CCT visible in its navigation pane or intervals of selected traces for the space-time region displayed in its trace pane. In particular, the data needed to render a trace view is proportional to the number of pixels in the view rather than the full size of the selected traces for the requested interval. This approach reduces the cost for reading performance data, shrinks the size of the in-memory representation of metrics and traces, and improves GUI responsiveness by avoiding unnecessary I/O.
Finally, hpcviewer uses multiple threads to read, assemble, and display traces. Even though Linux GTK is not thread-safe, using multiple threads for everything except the final display of assembled trace lines significantly improves GUI performance.
Using these techniques, hpcviewer’s responsiveness is good enough to interactively explore profiles, analyze traces, and plot metrics for performance databases that contain hundreds of gigabytes of profile metrics and terabytes of traces when they are stored in Frontier’s fast Lustre-based Orion filesystem.
7.2. hpcanalysis
To analyze terabytes of traces from executions at exascale, manual inspection has its limits. While gross characteristics such as load imbalances may be visually evident in hpcviewer, finer-grained characteristics can benefit from automation.
To address this need, we developed a Python library called hpcanalysis, which enables users to programmatically conduct detailed and complex analysis of HPCToolkit performance databases. The library has been designed to support sophisticated analyses of large, out-of-core datasets with ease, using a few lines of Python code. Built atop Pandas (McKinney, 2010), a popular data analysis framework, hpcanalysis supports a variety of advanced data filtering, aggregation, grouping, and manipulation functions, enabling users to perform a wide range of analytical tasks.
Hpcanalysis has been designed to be memory-efficient. Upon opening a database for analysis, the user is presented with an object representing the database that they can use to examine and analyze the measurement data within. However, data is not fetched or stored in memory until a specific request is made. This ensures that the library is fast even when processing large datasets: it enables users to selectively extract data for an analysis task and only incur work proportional to the size of the data subset extracted.
Hpcanalysis manipulates five Pandas DataFrames, which represent data for calling context trees, metrics, profile metadata, profile metric values, and trace lines. Users can manipulate data with DataFrame operations and extract subsets of performance data with specialized query APIs we developed. Hpcanalysis provides three query APIs for extracting specific subsets of data: one for call paths from the calling context tree, one for metrics, and one for profile metadata, profile metric values, and trace lines. Initially, our in-memory representations of performance data are empty and they are lazily filled with slices of data as requests to analyze specific slices of performance data are made through query API invocations.
Users can manipulate the unified CCT for a program execution by extracting specific call paths. Call path queries can specify various types of nodes (functions, loops, lines, instructions) and may use wildcards for call path fragments or part of node attributes, such as function name. This makes it simple for users to perform complex queries, such as extracting all calling contexts that invoke GPU operations. Once the nodes for a query are extracted from the CCT and stored in a table, users can perform DataFrame operations to filter and aggregate them based on their type, the total number of metric values recorded, depth in the tree, function name, source file path, and more. Additionally, the library provides a graphical tree view of the call hierarchy between nodes. Users can visualize an entire CCT or specific call paths using a call path query.
Other query APIs are used to query metadata, metric values, and trace lines for profiles. When a query is performed on profile metadata, e.g. the calling context tree, all profile metadata is fetched all at once because it is typically only a few megabytes in size. On the other hand, when a query is performed on profile metric values or trace lines, only requested data slices are fetched and stored in memory. After fetching and storing metric values for profiles in memory, we can use standard Pandas DataFrame operations to perform various statistical analyses, such as computing standard statistics for different metrics, identifying imbalances of specific metrics across various profiles, and clustering profiles with similar metric values. For instance, we can calculate the variance of a GPU operations metric across MPI ranks to determine whether there is a GPU load imbalance. Additionally, users can extract relevant trace lines and then aggregate and visualize their GPU operations to confirm the imbalance.
Hpcanalysis supports a higher-level analysis capability called hpcreport, which automatically analyzes a program’s execution summary profile and generates a high-level overview of its behavior. Hpcreport breaks down the time spent in a program execution into three main categories: MPI, OpenMP, and GPU execution and provides details about each. For instance, it reports timings for certain GPU operations including kernel execution, memory allocation, memory de-allocation, memory setting, explicit data copy, implicit data copy, and synchronization. A strength of hpcreport is that it can automatically identify whether a program execution is compute-bound, memory-bound, communication-bound, or I/O-bound.
Hpcanalysis has an additional feature that enables users to create custom regression tests for validating performance databases. Using our API, users can extract specific call paths from the tree and validate their profile data. For instance, a user might write a predicate to check that the execution time on GPUs exceeds a certain fraction of the total program running time. Such a predicate could be used to evaluate nightly tests for performance regressions.
While hpcanalysis is implemented as described and available as open source, it is a new addition to HPCToolkit and, as of this writing, has not yet been packaged in an HPCToolkit release.
7.3. hpcserver
After collecting terabytes of performance data from exascale executions on one system, it is costly to move the data to another system for analysis and exploration. To date, our principal approach to this problem has been running hpcviewer on a node attached to the filesystem where measurement data resides and having hpcviewer display results to a user’s remote system using X11 forwarding. However, the latency to a remote desktop makes X11’s chatty protocol a less than ideal way to deliver a responsive user interface.
To accelerate analysis of performance data on a remote system, we developed hpcserver—a utility that enables a client to request the transfer of select information from a remote performance database. The design of the communication protocol between hpcserver and its clients (hpcviewer and hpcanalysis) reduces the impact of network latency on client responsiveness. For example, hpcviewer uses a single client message to request all data needed for a view and then hpcserver provides the required data in one or more bulk replies. This approach is effective in combination with hpcviewer’s strategies for rendering views of profiles and traces using only subsets of the performance data.
To efficiently deliver subsets of profile and trace data to a client upon demand, we have designed hpcserver as a collection of coordinating processes. An hpcserver deployment consists of a “broker” process and zero or more “worker” processes, all with direct access to the filesystem where the performance data resides. The broker is responsible for communication with a remote client and for managing any workers. Worker processes, which communicate only with the broker, may load up large traces in the memory of one or more compute nodes so that they can provide on-demand access to selected portions of terabytes of trace data much faster than reading the requested traces from the filesystem for each user query. Communications between client, broker, and workers all occur over
The broker and worker processes work in parallel to process requests received by the broker from the client. For example, when a request is made from the client to the broker for trace information that spans many trace lines, the broker typically decomposes the request into independent parts, each targeting a single trace line, and distributes these component requests to workers. Workers provide requested information back to the broker, who relays responses back to the client in a first-completed-first-transmitted order, fulfilling client requests with one or more bulk replies. The broker does not wait for results from all workers before reporting the results from an arbitrary worker, which facilitates providing information to the client as quickly as possible. This enables hpcviewer to render a trace visualization progressively as it receives trace data it requested from hpcserver in multiple parts.
Today, hpcserver provides the information needed by a hpcviewer client. While the communication protocol for hpcserver has been designed to also meet the needs of hpcanalysis, hpcanalysis currently only reads data from the filesystem; extending hpcanalysis to read performance data through hpcserver is future work.
8. An I/O abstraction layer
Inefficient file I/O can easily degrade the performance of measurement and analysis. To support the measurement and analysis of applications at a very large scale, performance tools must avoid I/O becoming a bottleneck.
We designed and integrated an I/O abstraction layer in HPCToolkit atop low-level I/O system APIs. With this I/O abstraction layer, HPCToolkit can exploit different I/O systems efficiently and gain the most benefits from the I/O systems available on exascale supercomputers. Today, to optimize HPCToolkit’s I/O on Frontier and Aurora, our I/O abstraction layer supports Lustre (Intel Corporation, Oracle et al., 2010-2017) and DAOS (Intel Corporation, 2016-2024b), in addition general POSIX I/O. This I/O abstraction layer hides I/O management details from other measurement and analysis subsystems in HPCToolkit. For example, for Lustre, we hide striping and locking management, and for DAOS, we exploit its DFS API (low-level API for DAOS) (Intel Corporation, 2016-2024a) and hide all the challenges imposed by it. With the layer, users can choose different I/O support on different machines, even for different files within the same execution. This feature has been implemented and will be released after access to DAOS on Aurora is available for its testing and validation.
HPCToolkit has two main I/O concerns. First, HPCToolkit’s measurement tool, hpcrun, generates a profile file and optionally a trace file for each thread and GPU stream. Hpcrun opens these files in parallel, which may lead to large metadata contention. Second, HPCToolkit’s postmortem analysis tool, hpcprof, writes three relatively large files with both thread-level and process-level parallelism. All of hpcprof’s writes are non-overlapping, and thus file systems trying to control consistency between multiple threads and processes may introduce unnecessary overhead. With its I/O abstraction layer, HPCToolkit can easily switch between different I/O implementations as needed. For example, on Lustre, we may turn off the locking to minimize the overhead from consistency control, and with the DFS API, we can rely on DAOS’s simplified metadata without a centralized metadata server for objects to reduce metadata contention significantly.
To decide which functionalities to support in the I/O abstraction layer, we evaluated each I/O capability used by HPCToolkit. For some capabilities, a code refactoring in HPCToolkit was more appropriate than extending the features of I/O the layer. For example, not all I/O system low-level APIs provide file streams, which hpcrun needs. For fwrite/fread, since they optimize I/O significantly, we added this functionality in the I/O layer by implementing stream buffering ourselves when necessary. However, since it is easy for hpcrun to calculate file offsets and jump around with read_at and write_at, we modified hpcrun to eliminate its use of fseek.
9. Case studies
As part of the Exascale Computing Project (ECP), we engaged with various domain application developers at DOE and National Nuclear Security Administration (NNSA) facilities to use HPCToolkit to analyze the performance of their applications on pre-exascale and exascale systems. The goal of these engagements was to look for opportunities to improve the performance and scalability of HPCToolkit as well as the application codes. Here, we present three case studies involving three ECP applications: LAMMPS (Thompson et al., 2022), GAMESS (Barca et al., 2020), and WDMApp/GEM (Chen et al., 2022; Chen and Parker, 2007; Cheng et al., 2020).
9.1. ECP LAMMPS
LAMMPS (Large-scale Atomic/Molecular Massively Parallel Simulator) is a classical molecular dynamics code with a focus on materials modeling (Thompson et al., 2022). LAMMPS has support for a wide range of parallel programming models spanning CPUs, GPUs, and other accelerators, making it a robust parallel code suitable for exascale executions. For one of our case studies, we measured the performance of LAMMPS running on the Frontier exascale supercomputer (Oak Ridge Leadership Computing Facilty, 2023). At small scales, LAMMPS’ Lennard-Jones potential solver produces a regular alternating pattern of GPU computation and neighbor communication; however, when running on 8K compute nodes (64K GPUs) we encountered as-of-yet unexplained performance patterns unique to such large scales.
Figure 5 shows an execution trace of the GPU activity in a large-scale execution of LAMMPS. While the regular alternating pattern of communication and computation is dominant, we surprisingly found frequent delays where GPUs were starved for work for tens of milliseconds and sometimes even multiple seconds (as in the right side of the figure). Further inspection found that these delays were because the host was blocked waiting for MPI communication to complete. Based on the pattern in the trace, we speculate that a delay from external forces was encountered on a few or even a single MPI rank, but subsequent synchronous neighbor communications propagate this relatively local delay across all MPI ranks. Three iterations of a GPU execution trace of LAMMPS running on 8K compute nodes and 64K MPI ranks and 64K GPU tiles. Color represents GPU activity over time; white represents idleness due to MPI communication. Note the algorithm’s regular pattern and balanced workload, however random MPI delays “propagate” across the ranks, occasionally causing exceptionally long delays.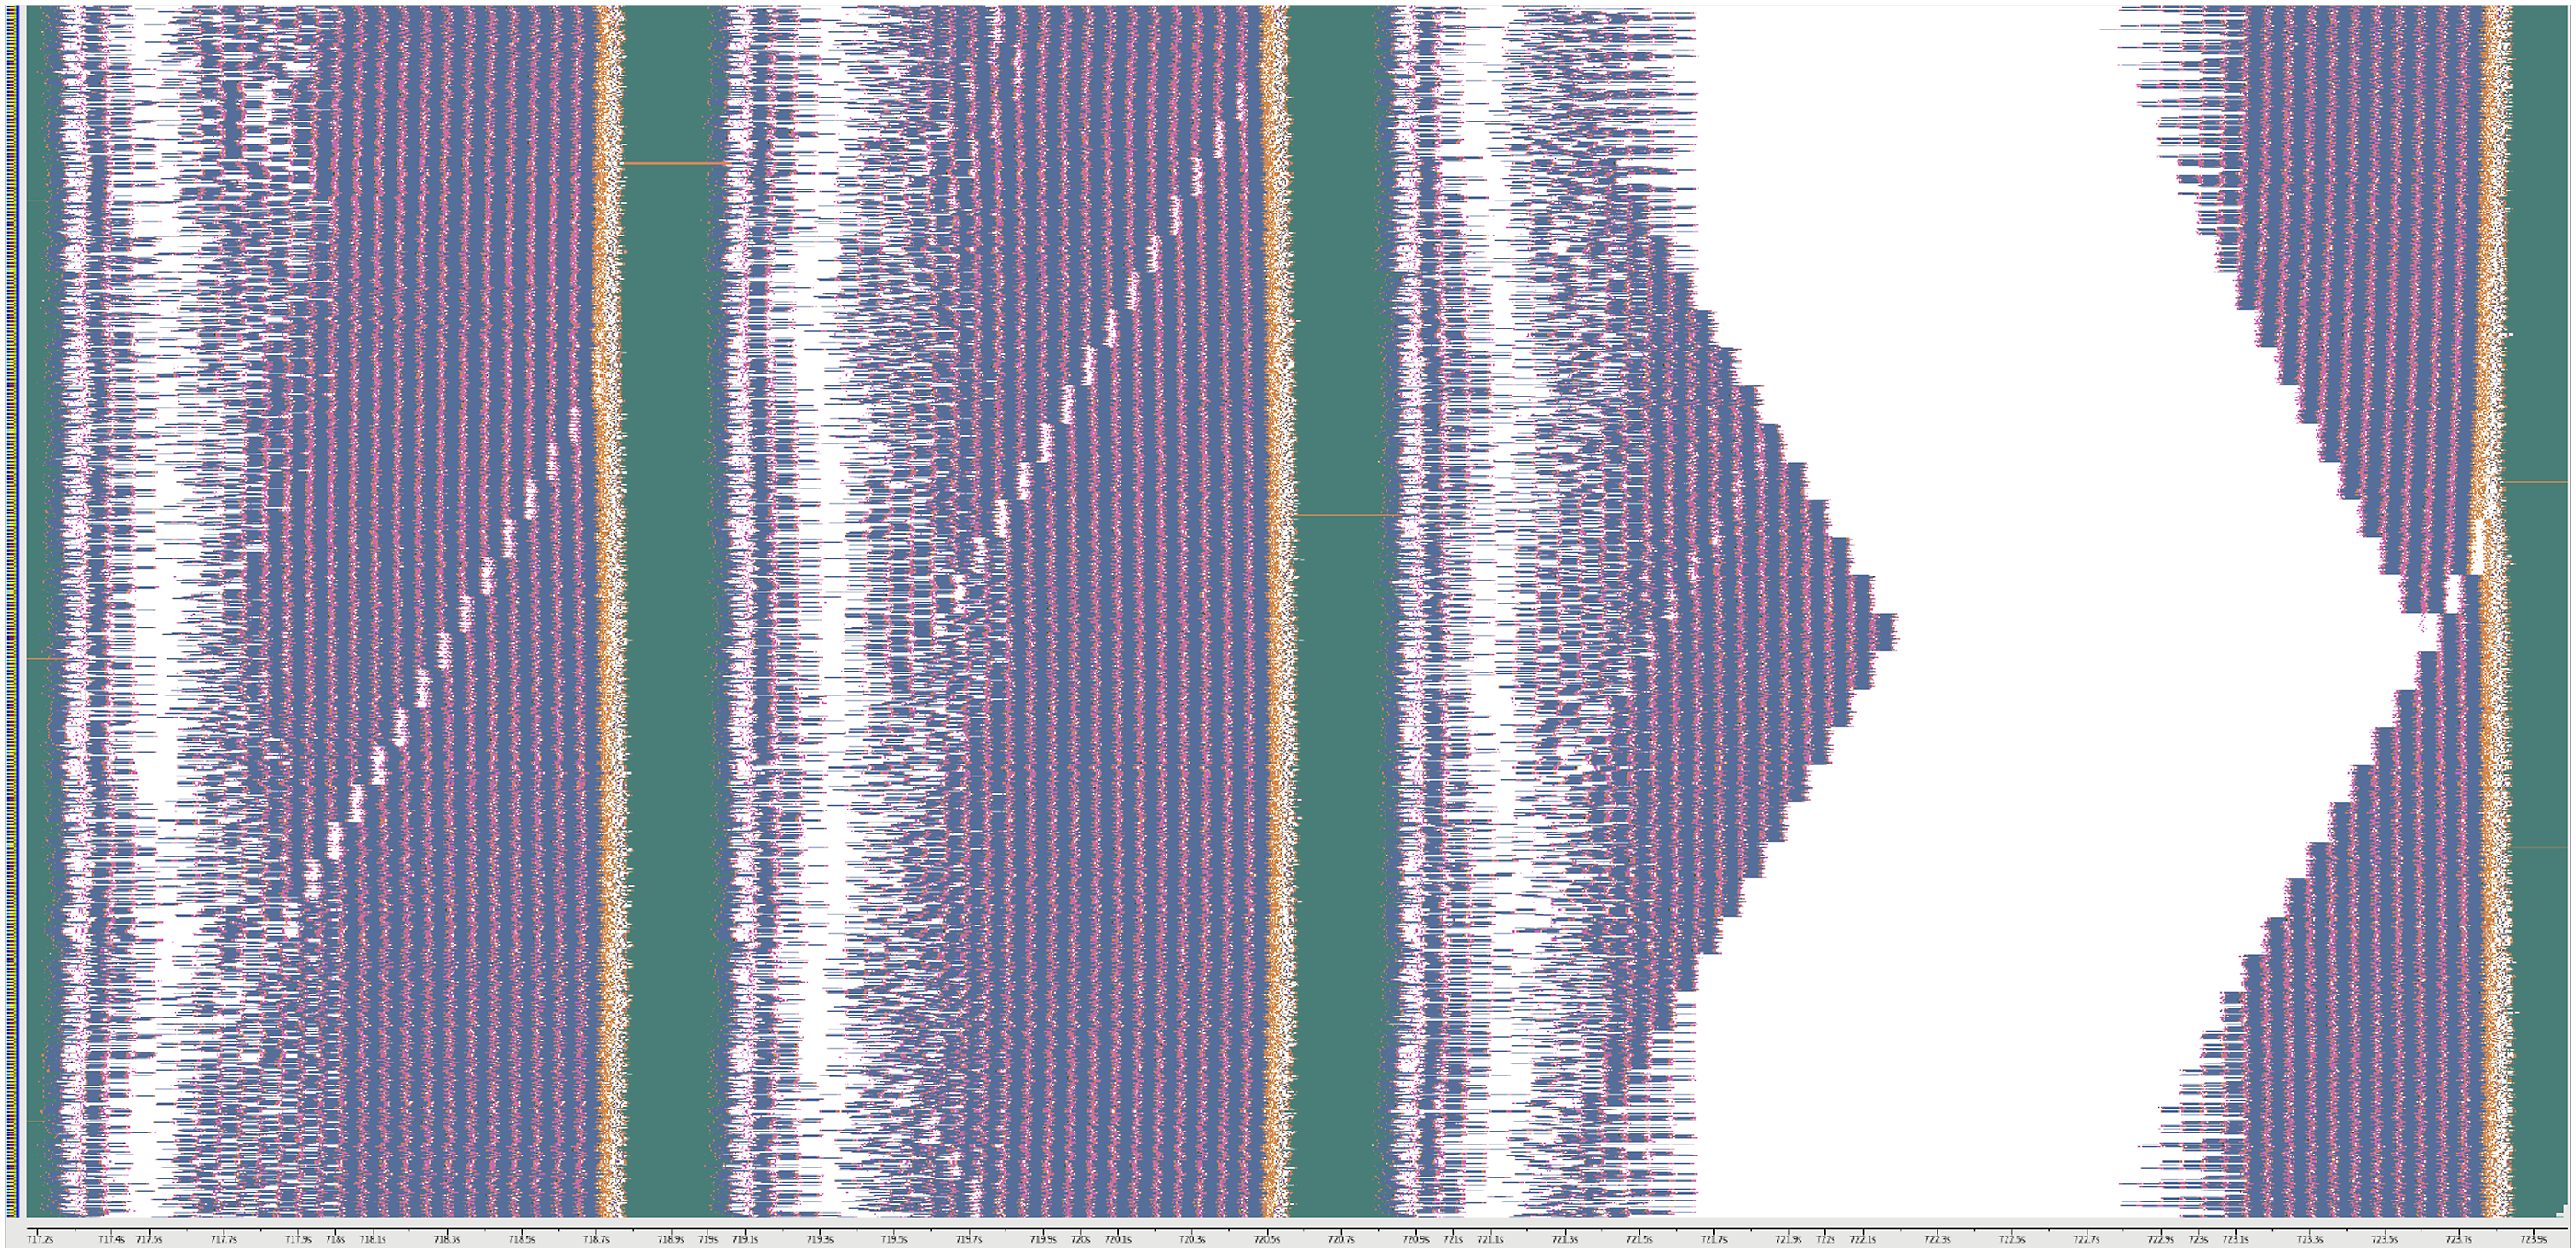
Figure 6 shows an execution trace of LAMMPS using a reduced problem size; this configuration minimizes the time spent in GPU computation to highlight the performance of the MPI communication. While we did not expect every pair of MPI ranks to communicate with the same performance, we expected the time spent to be more-or-less consistent across multiple MPI calls between the same pair of ranks. This did not turn out to be the case; in fact, we found that communication delay varies widely over time, with both long and short delays encountered. In addition, while we expected computation and delay times to be strongly synchronized across the MPI ranks (barring clock skew), this was not the case. MPI ranks arrive at and exit communication routines with variations sometimes larger than the delays themselves. While the figure contains many visible “wave-like” patterns with distinct high and low frequencies, we are unable to confidently declare if these are an effect of the network topology, communication pattern, and contention; a lack of tolerance for asynchrony in the LAMMPS code; or rogue delays caused by background system processes. Three iterations of a GPU execution trace of LAMMPS, like Figure 5 but with smaller problem size. Note the GPU is mostly idle as the GPU kernels are short and the time is dominated by communication. This experiment shows the inconsistent performance of MPI on Frontier, the delay visually produces a pattern of “waves” across the MPI ranks of a wide range of frequencies.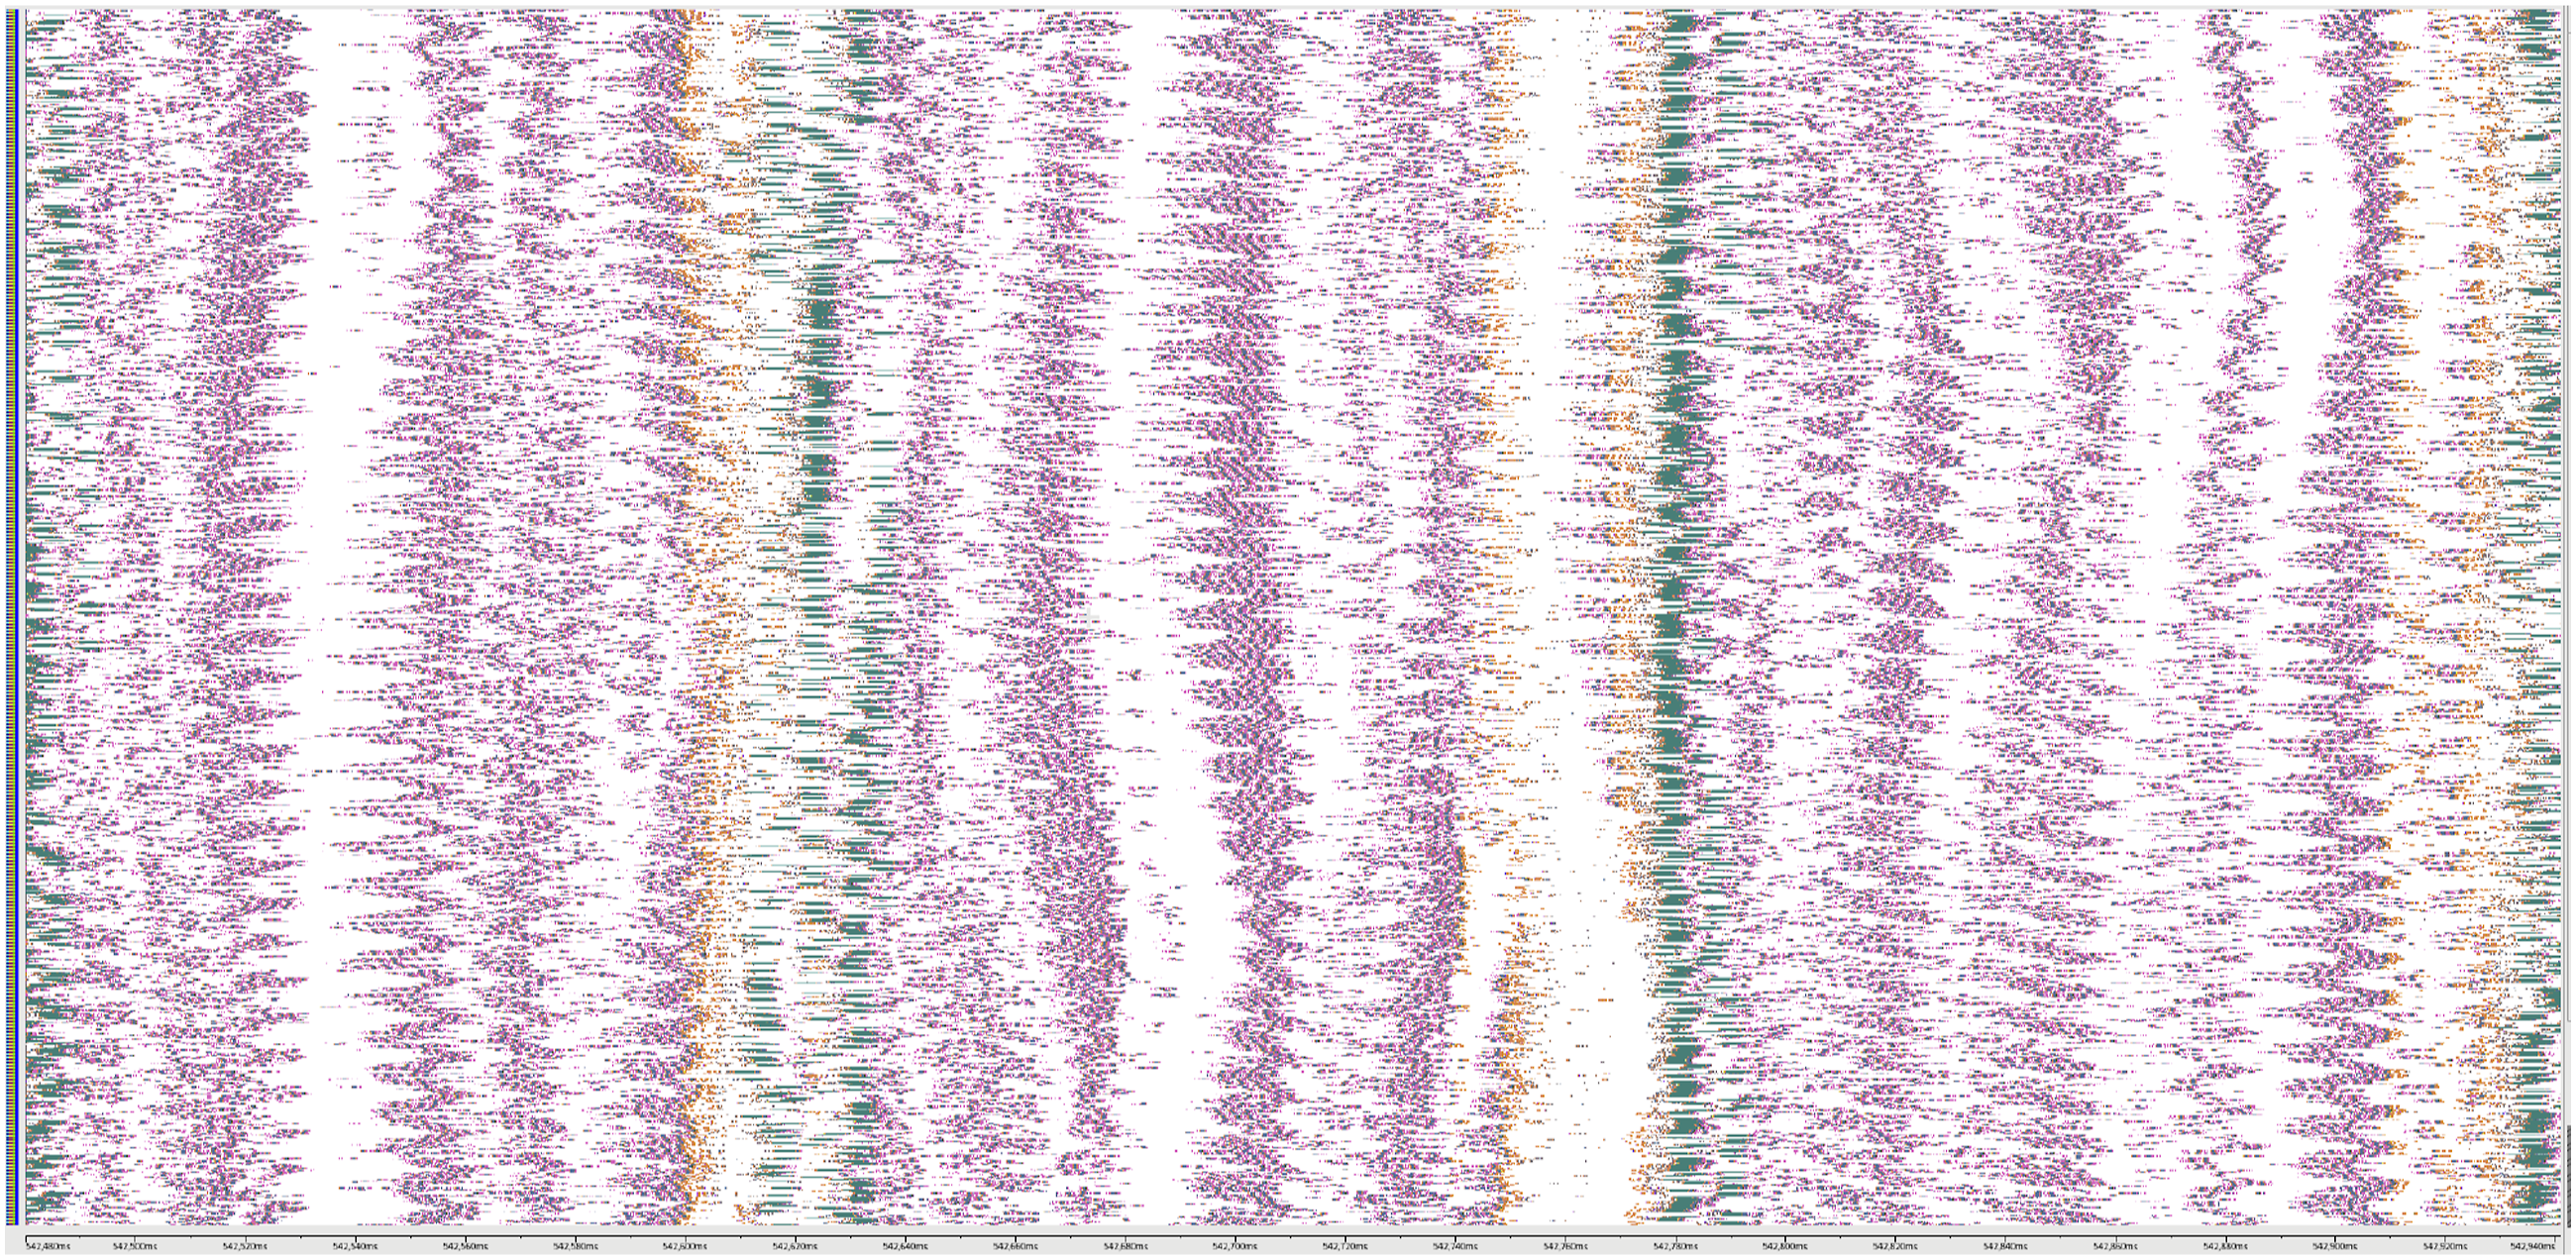
This case study demonstrates the fact that exascale computing is still a very new frontier with many open questions for HPC and performance analysis in particular, highlighting the need for performance tools that can gather detailed performance information at scale such as HPCToolkit. Based on the unexplained patterns identified here, we intend to continue to expand the measurement and analysis capabilities of HPCToolkit to include the information necessary to explain the performance of applications running at scale. For instance, we have begun investigating hardware counters available in Frontier’s Slingshot interconnect hardware to assess network contention. We also plan to record additional information to associate nodes with the network topology and add support for monitoring of background system operations on AMD GPUs, such as scratch space reclamation.
9.2. ECP GAMESS
General Atomic and Molecular Electronic Structure System (GAMESS) (Barca et al., 2020) is a general-purpose ab initio quantum chemistry suite developed at Iowa State University. During the ECP, the GAMESS project aimed to calculate the electronic structure of mesoporous silica nanoparticles (MSN), a catalyst in carbinolamine formation (Exascale Computing Project, 2023a). A figure-of-merit calculation on exascale platforms involves several thousands of atoms.
GAMESS is written mostly in Fortran 77 with critical parts modernized to Fortran 90, and C for the MPI-based data server. OpenMP offloading is used for portability across GPU platforms. In a typical execution of GAMESS, each MPI rank performing computation offloads to one GPU is accompanied by a data server MPI rank. Thus, the total number of MPI ranks in a typical execution is double the number of GPUs. This configuration was problematic for hpcrun when collecting fine-grained performance measurements with PC sampling on NVIDIA GPUs, as CUPTI forbids configuring multiple processes to perform PC sampling on the same GPU. To rectify this, we added a new flag to hpcrun to enable monitoring of selected ranks; for GAMESS, we use this flag to configure monitoring only for compute ranks.
We investigated the single-node performance of a Hartree-Fock energy calculation in GAMESS. Initial profiling and tracing with HPCToolkit revealed a noticeable load imbalance across GPUs bound to different compute tasks due to a triangularly nested loop. The developers subsequently implemented a rectangularization scheme to improve the load balance, and Figure 7 compares the GPU kernel execution times across MPI ranks before and after the code change. Load imbalance in GAMESS gpu_rhf_j06_pppp kernel, before and after loop rectangularization, measured on a Perlmutter (NERSC) compute node.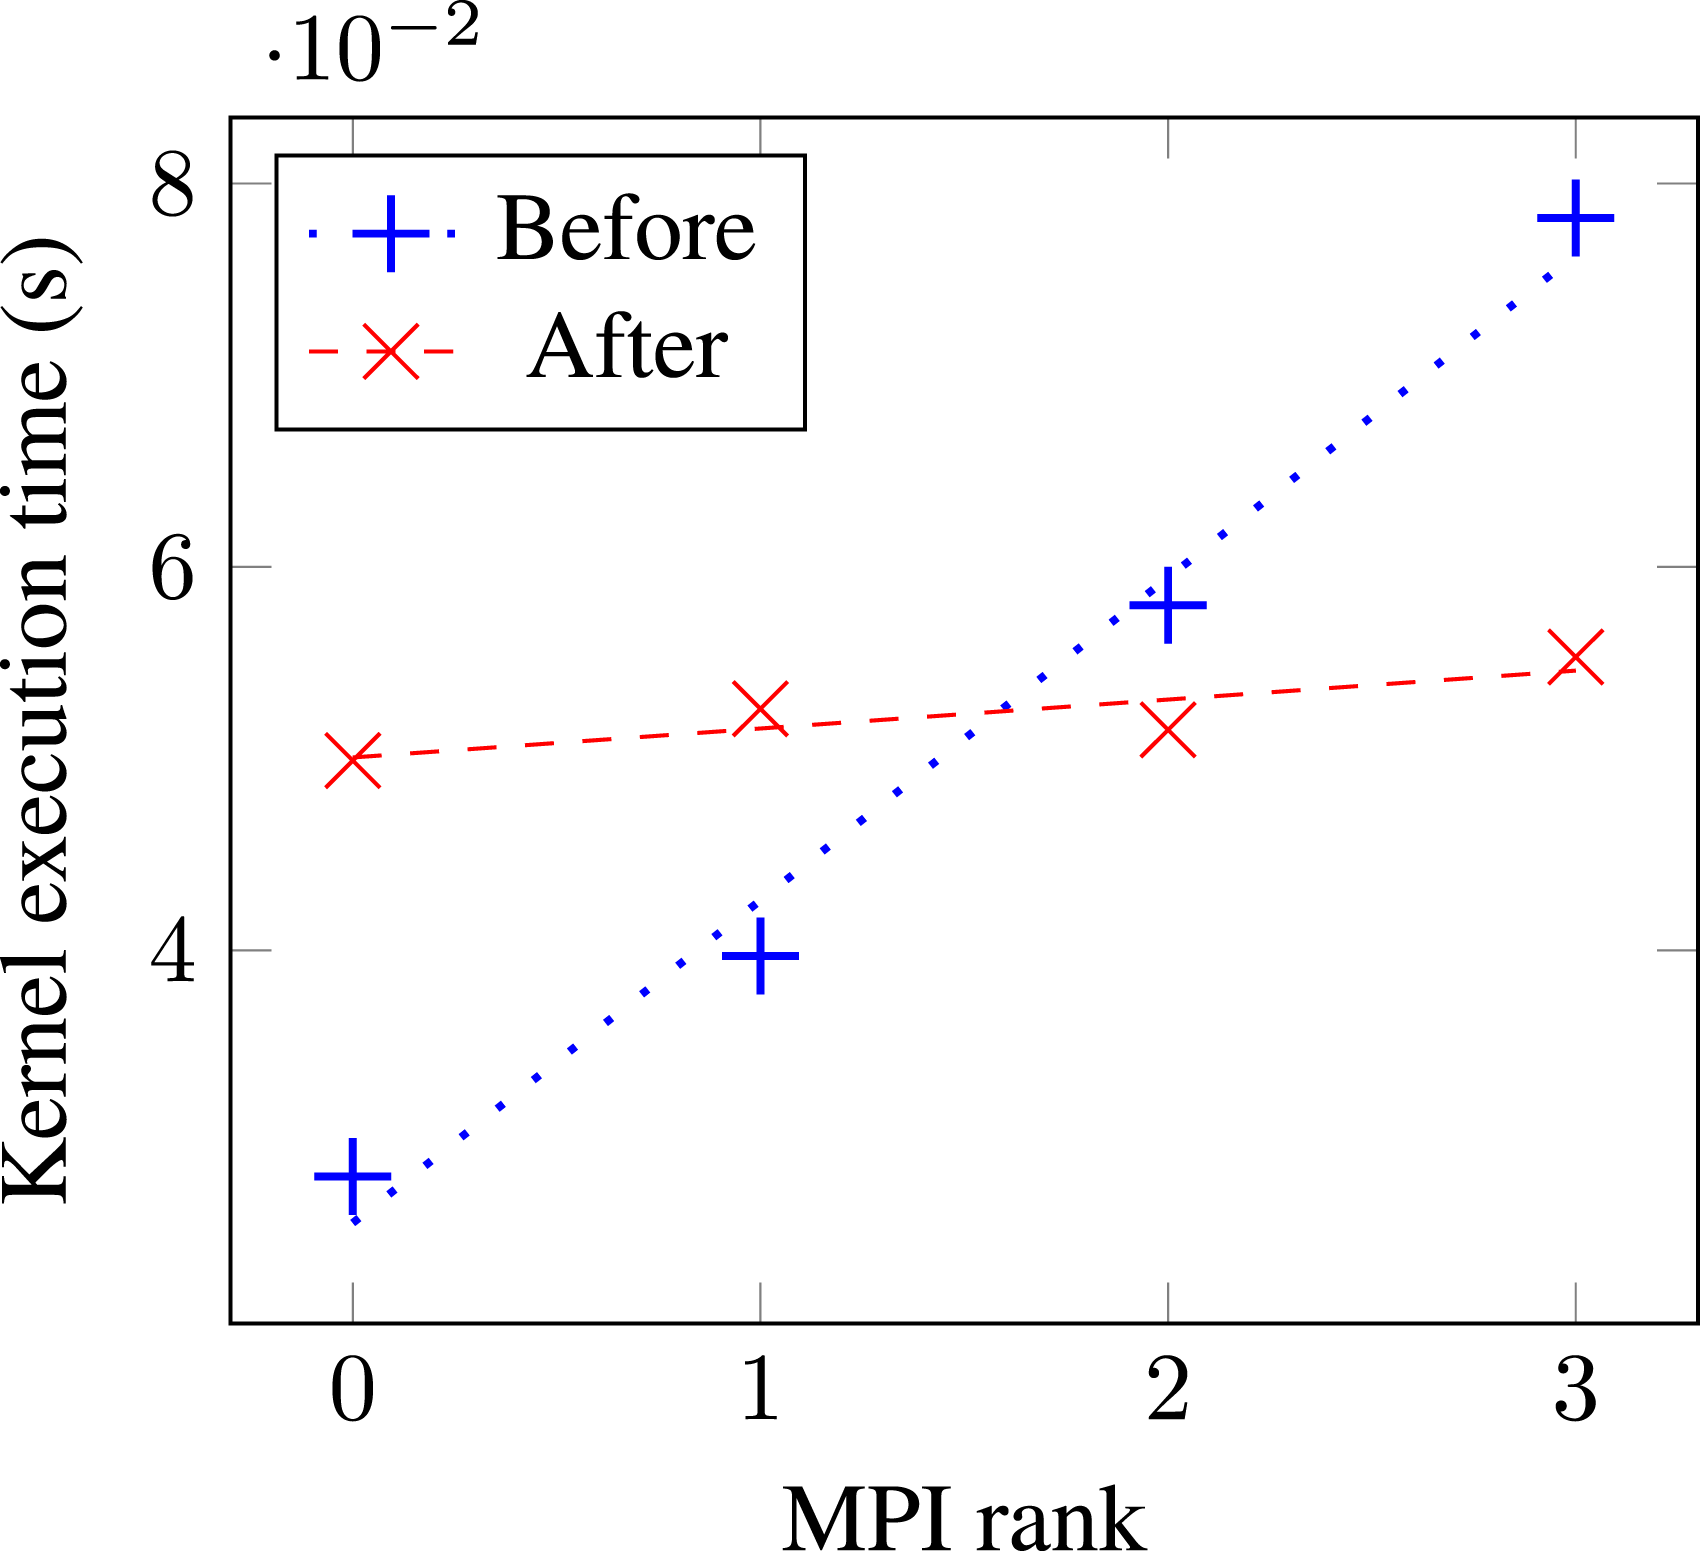
9.3. ECP WDMApp/GEM
GEM is an electromagnetic gyrokinetic particle-in-cell code for plasma physics developed at the University of Colorado, Boulder (Chen et al., 2022; Chen and Parker, 2007; Cheng et al., 2020). It is one of the core packages in the Whole Device Model Application (WDMApp) project (Exascale Computing Project, 2023b), which aims to develop a model for nuclear fusion in magnetically-confined plasma reactors. GEM is written in Fortran 90 with the MPI and OpenACC programming models; development during ECP involved a translation to OpenMP offload for exascale platforms (Cai et al., 2021).
The GEM team’s initial attempt to offload the test_init_pmove subroutine to GPU yielded lower performance than the original CPU-only code on Frontier. Profiling with HPCToolkit revealed a major GPU bottleneck in an OpenMP target region containing a serialized loop that performs a prefix sort for “holes” — electrons that left the cell after the cell contents had been simulated for one timestep. In addition, there is branching inside this loop, which makes this kernel highly unsuitable for execution on the GPU. Moving execution back to the CPU results in a 7× wall clock time speedup. A longer-term solution would involve developing a data-parallel hole-filling algorithm based on parallel prefix reductions suitable for execution on the GPU. When we explored this, AMD’s OpenMP compiler had not yet implemented OpenMP 5 scan operations on GPUs.
HPCToolkit also identified further optimization opportunities in GEM. Analysis of the execution trace revealed substantial GPU idle time, indicating under utilization. Digging deeper, 10% of this idleness was attributed to the fltm subroutine. This subroutine was non-trivial to port to a GPU. HPCToolkit’s guidance led the team to use OpenMP multithreading to parallelize the subroutine and unleash the power of multiple CPU cores, significantly reducing the bottleneck and boosting overall performance. This yielded an overall speedup of 7.4× compared to the original version.
Overall, HPCToolkit helped the team achieve significant performance gains by pinpointing problematic functions and identifying bottlenecks.
10. Related work
In recent years, both vendor and third-party tools have added capabilities to support performance measurement of GPU-accelerated applications.
NVIDIA’s Nsight Compute and Systems (NVIDIA Corporation, 2024a,b) profiles and traces GPU activity, attributing it to CPU calling context. Intel’s VTune (Intel Corporation, 2024b) measures performance on both CPU and GPU, providing a profile of resource utilization, hotspot analysis, and data movement statistics. Intel’s Unitrace (Intel Corporation, 2024e) traces and profiles CPU and GPU activities, interactions, and resource utilization on GPUs. AMD’s ROCProf (Advanced Micro Devices Corporation, 2024c) collects performance counters and provides a trace view of GPU operations. AMD’s OmniTrace (Advanced Micro Devices, Inc, 2022b) profiles and traces applications on CPU and GPU, and Omniperf (Advanced Micro Devices, Inc, 2022a) focuses on profiling kernels on AMD Instinct GPUs by monitoring hardware counters (Advanced Micro Devices, Inc, 2022).
Third-party performance tools have been extending capabilities on GPUs as well. For example, TAU (Shende and Malony, 2006) provides metrics for individual GPU kernel launches based on hardware counters. The BSC performance tools (Llort et al., 2016) generate traces for GPU activity offloaded via CUDA, OMPT or OpenCL. HPCToolkit provides profiles and traces for offloaded GPU activity that are attributed to their CPU calling context.
Applications with large and complex kernels require a finer granularity of performance analysis than GPU kernels; the performance of instructions within a GPU kernel must also be measured. Today, GPU vendors support fine-grained measurements through PC sampling or instrumentation. NVIDIA GPUs allow tools to collect instruction stall information through PC sampling. NVIDIA’s Nsight Compute (NVIDIA Corporation, 2024a) exploits stall sampling and correlates efficiency metrics to source lines. CUDABlamer (Zhang and Hollingsworth, 2019) collects PC samples and uses information from LLVM-IR to capture static call paths on GPU. GPA (Zhou et al., 2021b) uses PC sampling to capture stall reasons and provides optimization suggestions based on stall reasons. DrGPU (Hao et al., 2023) and GPUscout (Sen et al., 2023) use hardware counters and PC samples to identify causes of performance losses on NVIDIA GPUs. HPCToolkit attributes instruction-level measurements to fully reconstructed calling contexts within GPU kernels.
Instrumentation of GPU kernels can be done through NVIDIA’s NVBit or Compute Sanitizer libraries (NVIDIA Corporation, 2023b; Villa et al., 2019), or Intel’s GTPin library (Intel Corporation, 2024a). ValueExpert (Zhou et al., 2022) uses NVIDIA’s Compute Sanitizer to pinpoint inefficient value patterns in load and store operations inside kernels. GVProf (Zhou et al., 2020a) uses Compute Sanitizer to identify value redundancies inside kernels and guide users to remove redundant computations and data movements. HPCToolkit uses GTPin to instrument GPU kernels offloaded on Intel GPUs and record instructions executed and vector inefficiencies at the instruction level.
Several tools provide programmatic interfaces for performance analysis. Hatchet (Bhatele et al., 2019) can analyze a summary profile from a single execution. Thicket (Brink et al., 2023) can examine multiple profiles from multiple runs of performance experiments. Pipit (Bhatele et al., 2023) can analyze multiple parallel execution traces. A shortcoming of these tools is that they load entire datasets into memory at once and users can’t selectively read slices of performance data. With hpcanalysis, users can load only subsets of interest into memory, which is essential when dealing with large-scale executions.
We noticed other issues with the existing tools for automated analysis. Hatchet stores profiles in a dense format where metrics are separate columns inside a Pandas DataFrame. HPCToolkit profiles are sparse: when measuring applications that use GPUs, CPU code will not have any associated GPU metrics. We experimented with importing HPCToolkit databases that contain GPU metrics into Hatchet and saw that more than 90% of GPU columns were empty. Hpcanalysis avoids this problem by storing metrics as a DataFrame index instead of columns, eliminating the problem of storing empty cells for sparse data. With Thicket, we encountered issues with loading multiple large datasets because creating a unified CCT across multiple executions can be costly when merging large CCTs from individual runs.
Intel’s VTune Profiler Application Performance Snapshot (Intel Corporation, 2024c) reports various performance characteristics of parallel executions such as CPU usage, memory access efficiency, vectorization, I/O, and memory footprint. Linaro Map Performance Reports (Linaro Ltd., 2024) categorizes execution time as compute, communication, or I/O. These tools provide performance summaries without detail. While HPCToolkit collects and presents detailed performance measurements, hpcreport aims to provide high-level summaries of execution behavior similar to those provided by the aforementioned tools.
Application tuning often requires detailed information. On exascale platforms, developers need scalable tools that can measure and analyze performance in detail at scale. NVIDIA’s Nsight tools, Intel’s VTune, AMD’s ROCProf, the BSC performance tools, and others store postmortem performance measurements as traces. For large executions with long runtimes, storing performance data only as traces results in huge measurement files and limits the scalability of these tools. Linaro MAP (Linaro Ltd., 2024) and ScalaTrace (Noeth et al., 2009) scale well by eliding or compressing the performance data they collect at runtime. For instance, MAP only keeps a limited number of samples per application thread or GPU stream, and ScalaTrace compresses traces across time and nodes. These tools scale well but lack measurement detail needed to support in-depth performance analysis. HPCToolkit easily scales to thousands of compute nodes while providing very detailed performance data.
11. Summary and conclusions
To support fine-grained profiling and tracing of GPU-accelerated applications on exascale systems, we refined many of HPCToolkit’s core capabilities.
HPCToolkit’s measurement subsystem required considerable changes. Coping with the complex software stacks used by ECP and DOE NNSA applications led us to pursue better approaches for tracking dynamic library loading and intercepting function symbols (using LD_AUDIT) as well as insulating the application and HPCToolkit’s performance measurement system from one another (using linker namespaces). The need to interface with diverse GPU runtimes requires hpcrun to accept performance measurements from multiple, perhaps unspecified, monitoring threads. The combination of multiple monitoring threads in GPU runtimes and large thread counts in ML frameworks, such as TensorFlow, led us to redesign our core support for communicating performance information between threads to use Multiple-Producer-Single-Consumer concurrent queues instead of point-to-point communication between thread pairs. Hpcrun also required extensions to support source-level performance monitoring of Python for Python-based AI frameworks. Finally, to reduce the overhead of instruction-level performance measurement using GTPin on Intel GPUs, hpcrun now maintains metrics at the block level throughout execution and only propagates metrics to individual instructions as it writes out profiles.
To relate performance measurements back to code, HPCToolkit now scans profiles in parallel to identify CPU and GPU binaries that need to be analyzed and then recovers information about functions, inlined code, loops, and source lines using multi-threaded parallelism.
Based on our experiences with postmortem analysis of exascale, we improved the parallelism of hpcprof’s I/O and plan to further improve the scalability and parallelism of hpcprof by changing calling context identifiers to hash codes and changing the calling context representation from a tree to a directed graph.
As described above, considerable effort has gone into simply measuring GPU-accelerated applications at scale, analyzing reams of performance data in parallel, and building both GUI and programmatic interfaces for exploring the results. Over the next year, changes to GPU monitoring interfaces will require considerable additional effort just to keep tools current.
Beyond that, to fully realize our vision for HPCToolkit, there are three issues that require considerable further investment. • Improved instruction-level performance measurement for GPUs. Hardware and software support for instruction-level performance monitoring using PC sampling is finally falling into place for Intel’s Ponte Vecchio GPUs and AMD’s MI300A.
3
Without instruction-level measurements, it can be difficult to pinpoint the causes of performance losses. • Interpretation of instruction-level performance measurements on AMD and Intel GPUs. While there already has been considerable work interpreting instruction-level measurements on NVIDIA GPUs, Intel and AMD’s GPUs are organized differently and will need new work in this area. • Automated analysis of performance measurements in the large. Automating the analysis of profiles and traces to identify bottlenecks and inefficiencies, and suggesting optimizations will provide a better experience for tool users and and boost productivity.
Footnotes
Acknowledgements
Keren Zhou, Xiaozhu Meng, Aaron Cherian, and Dejan Grubisic helped design and implement HPCToolkit’s initial support for measurement and analysis of GPU-accelerated applications. Marty Itzkowitz developed minitest for testing HPCToolkit’s capabilities for measurement and analysis of GPU-accelerated programs. Tao Zhou contributed to HPCToolkit’s support for measurement of Python. Heather McIntyre improved HPCToolkit’s support for parallel binary analysis. This research used resources of the Oak Ridge Leadership Computing Facility, which is a DOE Office of Science User Facility supported under Contract DE-AC05-00OR22725. This research also used resources of the Argonne Leadership Computing Facility, a U.S. Department of Energy (DOE) Office of Science user facility at Argonne National Laboratory and is based on research supported by the U.S. DOE Office of Science-Advanced Scientific Computing Research Program, under Contract No. DE-AC02-06CH11357.
Declaration of conflicting interests
The author(s) declared the following potential conflicts of interest with respect to the research, authorship, and/or publication of this article: In addition to his academic affiliation, Vladimir Indic is a contractor for AMD.
Funding
The author(s) disclosed receipt of the following financial support for the research, authorship, and/or publication of this article: This work was supported by the Exascale Computing Project (17-SC-20-SC), a collaborative effort of the U.S. Department of Energy Office of Science and the National Nuclear Security Administration. This research was also supported in part by subcontracts from Lawrence Livermore National Laboratory (B639429, B645220, B650752, B658833), Argonne National Laboratory (9F-60073), Advanced Micro Devices Inc., Total Energies E&P Research & Technology USA, LLC, and gifts from Intel Corporation and Advanced Micro Devices Inc.
ORCID iDs
Notes
Author biographies
Laksono Adhianto is a Senior Research Software Engineer in the Department of Computer Science at Rice University in Houston, TX. He received a PhD degree in computer science from the University of Houston, TX in 2007. His research focuses on software technology for high-performance parallel computing.
Jonathon Anderson is a PhD student working with Dr. John Mellor-Crummey at Rice University in Houston, TX. He received a Bachelor of Science degree in computer science from Concordia University, Seward, NE in 2018. His research work focuses on parallel algorithms for postmortem performance analysis.
R. Matthew Barnett is a Senior Research Programmer in the Center for Research Computing at Rice University, Houston, TX. He received a Bachelor of Arts degree in computer science from Rice University in 2004. His work in both industry and academia focuses on the software engineering of large systems. He is the author and recipient of two software-centric U.S. patents.
Dragana Grbic is a PhD student in computer science at Rice University, Houston, TX. She is working with Prof. John Mellor-Crummey. Dragana received a Master’s degree in Electrical and Computer Engineering from the University of Novi Sad, Serbia, in 2022. Her research focuses on performance analysis and high-performance computing.
Vladimir Indic is a PhD student in computer science at the Faculty of Technical Sciences, University of Novi Sad, Serbia. He received a Master’s degree in Electrical and Computer Engineering from the same institution in 2020. In addition to his academic affiliation, he is a contractor for AMD. His work in both academia and industry focuses on developing tools for performance analysis of GPU-accelerated applications.
Mark Krentel is a Senior Research Software Engineer at Rice University, Houston, TX. He received a PhD degree in computer science from Cornell University, Ithaca, NY, in 1987. He has worked for the Rice HPCToolkit project since 2007 and has worked in almost all areas of HPCToolkit including the build system, integration with sampling and interrupts, locking subsystem, testing and documentation.
Yumeng Liu is a PhD student working with Dr. John Mellor-Crummey at Rice University in Houston, TX. She received a Bachelor of Science degree in computer science from University of Rochester, Rochester, NY, in 2019. Her research works focus on performance measurement and analysis of GPU-accelerated applications at exascale.
Srđan Milaković received a PhD degree in computer science from Rice University, Houston, TX in 2023. His PhD dissertation focuses on optimizing irregular workloads, particularly in the domain of sparse linear algebra. He currently works as a software engineer.
Wileam Phan is a Research Software Engineer at Rice University, Houston, TX. He received a Master’s degree in computational physics from the University of Tennessee, Knoxville in 2021. His research focuses on software technology for high-performance parallel computing.
John Mellor-Crummey received a PhD degree in computer science from the University of Rochester, Rochester, NY, in 1989. He is a Professor of Computer Science at Rice University, Houston, TX. His research focuses on software technology for high performance parallel computing, including compilers, runtime systems, tools, and synchronization. Mellor-Crummey is a co-recipient of the 2006 Dijkstra Prize in Distributed Computing and a Fellow of the ACM.