
Abstract
Introduction:
In osteosarcoma, the most significant indicator of prognosis is the histologic changes related to tumor response to preoperative chemotherapy, such as necrosis. We have developed a method to measure the osteosarcoma treatment effect using whole slide image (WSI) with an open-source digital image analytical software Qupath.
Materials and Methods:
In Qupath, each osteosarcoma case was treated as a project. All H&E slides from the entire representative slice of osteosarcoma were scanned into WSIs and imported into a project in Qupath. The regions of tumor and tumor necrosis were annotated, and their areas were measured in Qupath. In order to measure the osteosarcoma treatment effect, we needed to calculate the percentage of total necrosis area over total tumor area. We developed a tool that can automatically extract all values of tumor and necrosis areas from a Qupath project into an Excel file, sum these values for necrosis and whole tumor respectively, and calculate necrosis/tumor percentage.
Conclusion:
Our method that combines WSI with Qupath can provide an objective measurement to facilitate pathologist’s assessment of osteosarcoma response to treatment. The proposed approach can also be used for other types of tumors that have clinical need for post-treatment response assessment.
Keywords
Introduction
Osteosarcoma, the most common non-hematopoietic bone malignancy, is a high-grade malignant tumor characterized histopathologically by the malignant osteoid produced by the neoplastic cells. 1 It is the prototype for evaluation of post-treatment effects in sarcomas. 2 Many factors have been studied for their prognostic significance, including age, sex, tumor location, size, and stage. However, the most used and useful indicator of prognosis for osteosarcoma is the histologic changes related to tumor response to preoperative chemotherapy, measured by the percentage of treatment-related changes such as necrosis divided by tumor area. 3
The current standard of care for management of high-grade osteosarcoma includes biopsy followed by neoadjuvant chemotherapy. Radiologic imaging is used to assess tumor response. The subsequent surgical resection of the treated primary tumor then provides a specimen to evaluate tumor response to treatment. 3 The pathologic examination requires careful gross dissection, description, bone decalcification and section, and histologic evaluation, with detailed specimen mapping. The final pathologic report should include classification of the osteosarcoma, tumor margins evaluation, measurement of tumor dimensions, tumor location, and evaluation of the percentage of necrosis after chemotherapy, for which the methods have been summarized in various publications and is required by the Children’s Oncology Group protocol.3-5 At least an entire representative slice of the tumor should be taken through the long axis and this slice should be mapped using a grid pattern diagram, photocopy, or radiologic film to indicate the site for each tumor block (Figure 1). After fixation and decalcification, the entire cross-section is submitted for histologic evaluation. In addition, the remainder of the neoplasm should be sampled at the rate of 1 section per centimeter. Areas of soft tissue extension and the interface of tumor with normal tissue should also be sampled. Response to chemotherapy is measured by summing all necrotic (or viable) areas measured microscopically divided by the total cross-sectional area occupied by tumor to arrive at a percentage. 5 The sum of percentage of viable tumor and tumor with therapeutic response (such as necrosis) should be 100. The prognostically significant response cutoff in osteosarcoma according to most series is 90%; a more favorable prognosis is seen with those tumors showing at least 90% therapeutic response.5,6
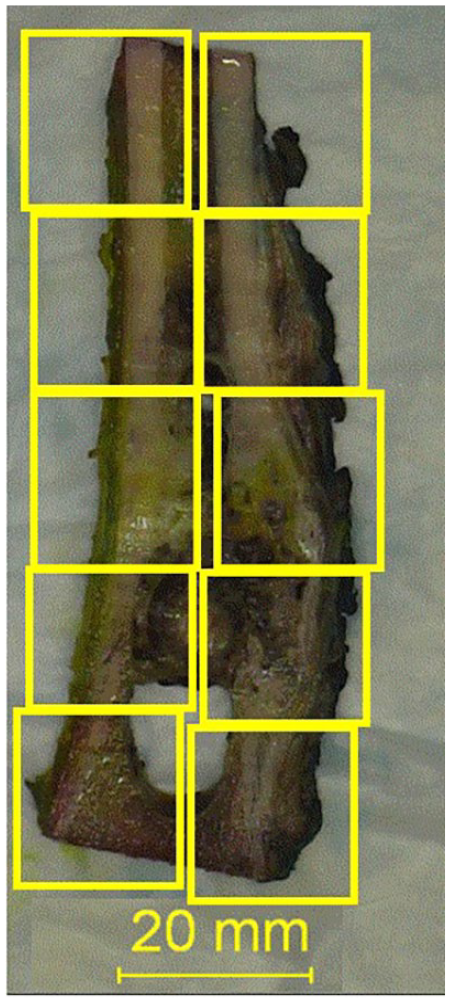
Representative section map of an entirely submitted slice of osteosarcoma resection specimen.
The current “gold standard” histopathologic assessment of osteosarcoma treatment effect, as described above, is a method of subjective manual estimate. Factors such as different section size and irregular distribution of individual tissue components such as viable tumor cells and necrosis can make it challenging for the subjective estimate to reach an accurate percentage. An objective approach is always needed for clinical care and research. The objective of this manuscript is to provide a digital pathological tool using computer image analysis software to objectively measure, instead of subjectively estimate, the percentage of necrosis (or any histologic changes related to treatment effects), both manually and semi-automatically using computer programming. The application of this digital tool is demonstrated below using a case of posttreatment osteosarcoma, for the proof of principle.
Materials and Methods
Institutional Review Board (IRB) approval
The current study (Artificial Intelligence in pediatric pathology) was reviewed and approved by the Institutional Review Board (IRB) office, Washington University in St. Louis, with IRB ID #202107131.
Case Selection
“Osteosarcoma,” as a keyword, was searched in departmental archives. A case with post-treatment effect percentage estimate was selected. Slides from the entire section (determined by grossing and section map) were used as a convenient case (Figure 1) to demonstrate the use of proposed digital tool. Treatment effect (%) was defined as “total area of necrosis” (necrosis) divided by “total area of tumor” (tumor).
Whole Slide Scanning and Whole Slide Image (WSI)
H&E slides of the entire slice of the bone specimen with tumor (as seen in Figure 1) were scanned at 40× using an Aperio Scanscope AT2 scanner (Leica Biosystems, Wetzlar, Germany) and stored in SVS format in the Digital Pathology Center, Department of Pathology & Immunology. For the current study, WSI images were downloaded to the local hard drive of Pathologist’s desktop computer.
Qupath
QuPath (https://qupath.github.io) is an open-source software specifically designed to analyze and explore whole slide imaging data (https://qupath.github.io). 7 It was used to view, annotate, and area measurement for WSIs in the current study, within the region of interest (ROI), using version Qupath-0.4.3 (https://qupath.github.io). 7
Create Project
Each osteosarcoma case was treated as a separate project. First, Qupath-0.4.3. was opened, and “create project” was clicked (step 1, Figure 2). The project was saved to a local folder. Second, “Add images” was clicked (step 2, Figure 2) to import all WSIs of the entire slide of osteosarcoma (Figure 2) to the project.
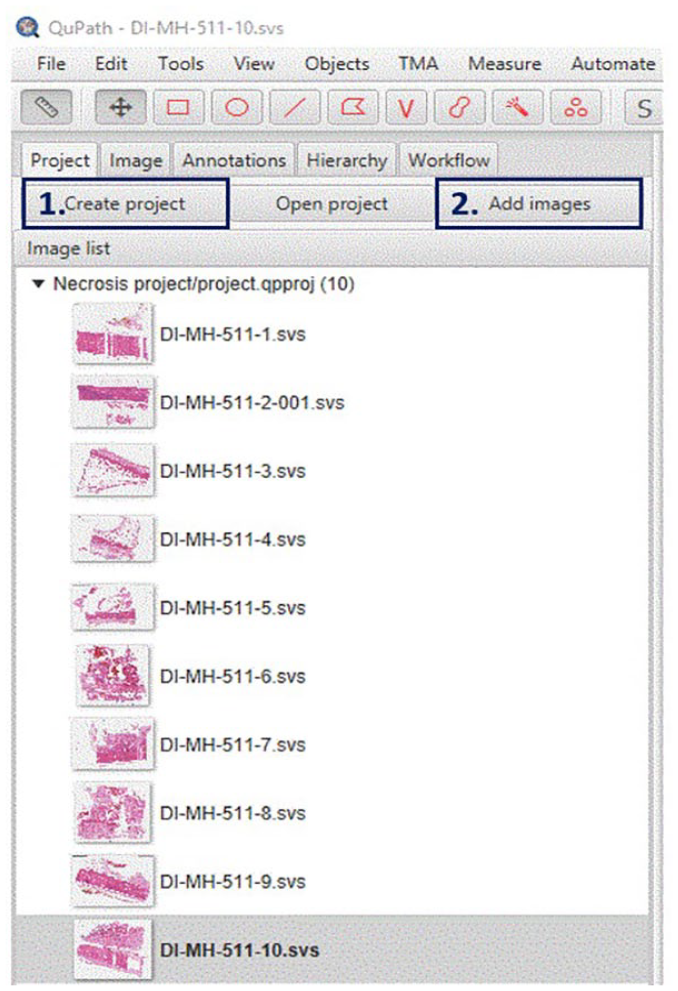
“Creating a project” (step 1) for each individual post-treatment osteosarcoma case for necrosis percentage measurement. Save the project in a designated folder and start to import all WSI images of the entire slide of bone sampled (with section map) using the “Add image” button (step 2).
Annotation
Following online instructions, WSI images were annotated using Qupath (https://qupath.github.io). 7 Briefly, “Annotations” was clicked (Yellow arrow, Figure 3). Annotations for “tumor” (entire tumor bed) and “necrosis” were set by clicking the button (Blue arrow, Figure 3, right to the “Set class.” In the current study, only “tumor” (red) and “necrosis” (black) were set. Users could add more annotations (such as “Fibrosis”) by repeating this step.
The region of tumor bed was circled by the polygonal button (Red arrow, Figure 3) and a red object (Annotation (Tumor)) would appear in the left window to the Class window (Figure 3). A region of necrosis was selected in a same way and a black object (Annotation (Necrosis) would appear in the left window (Figure 3).
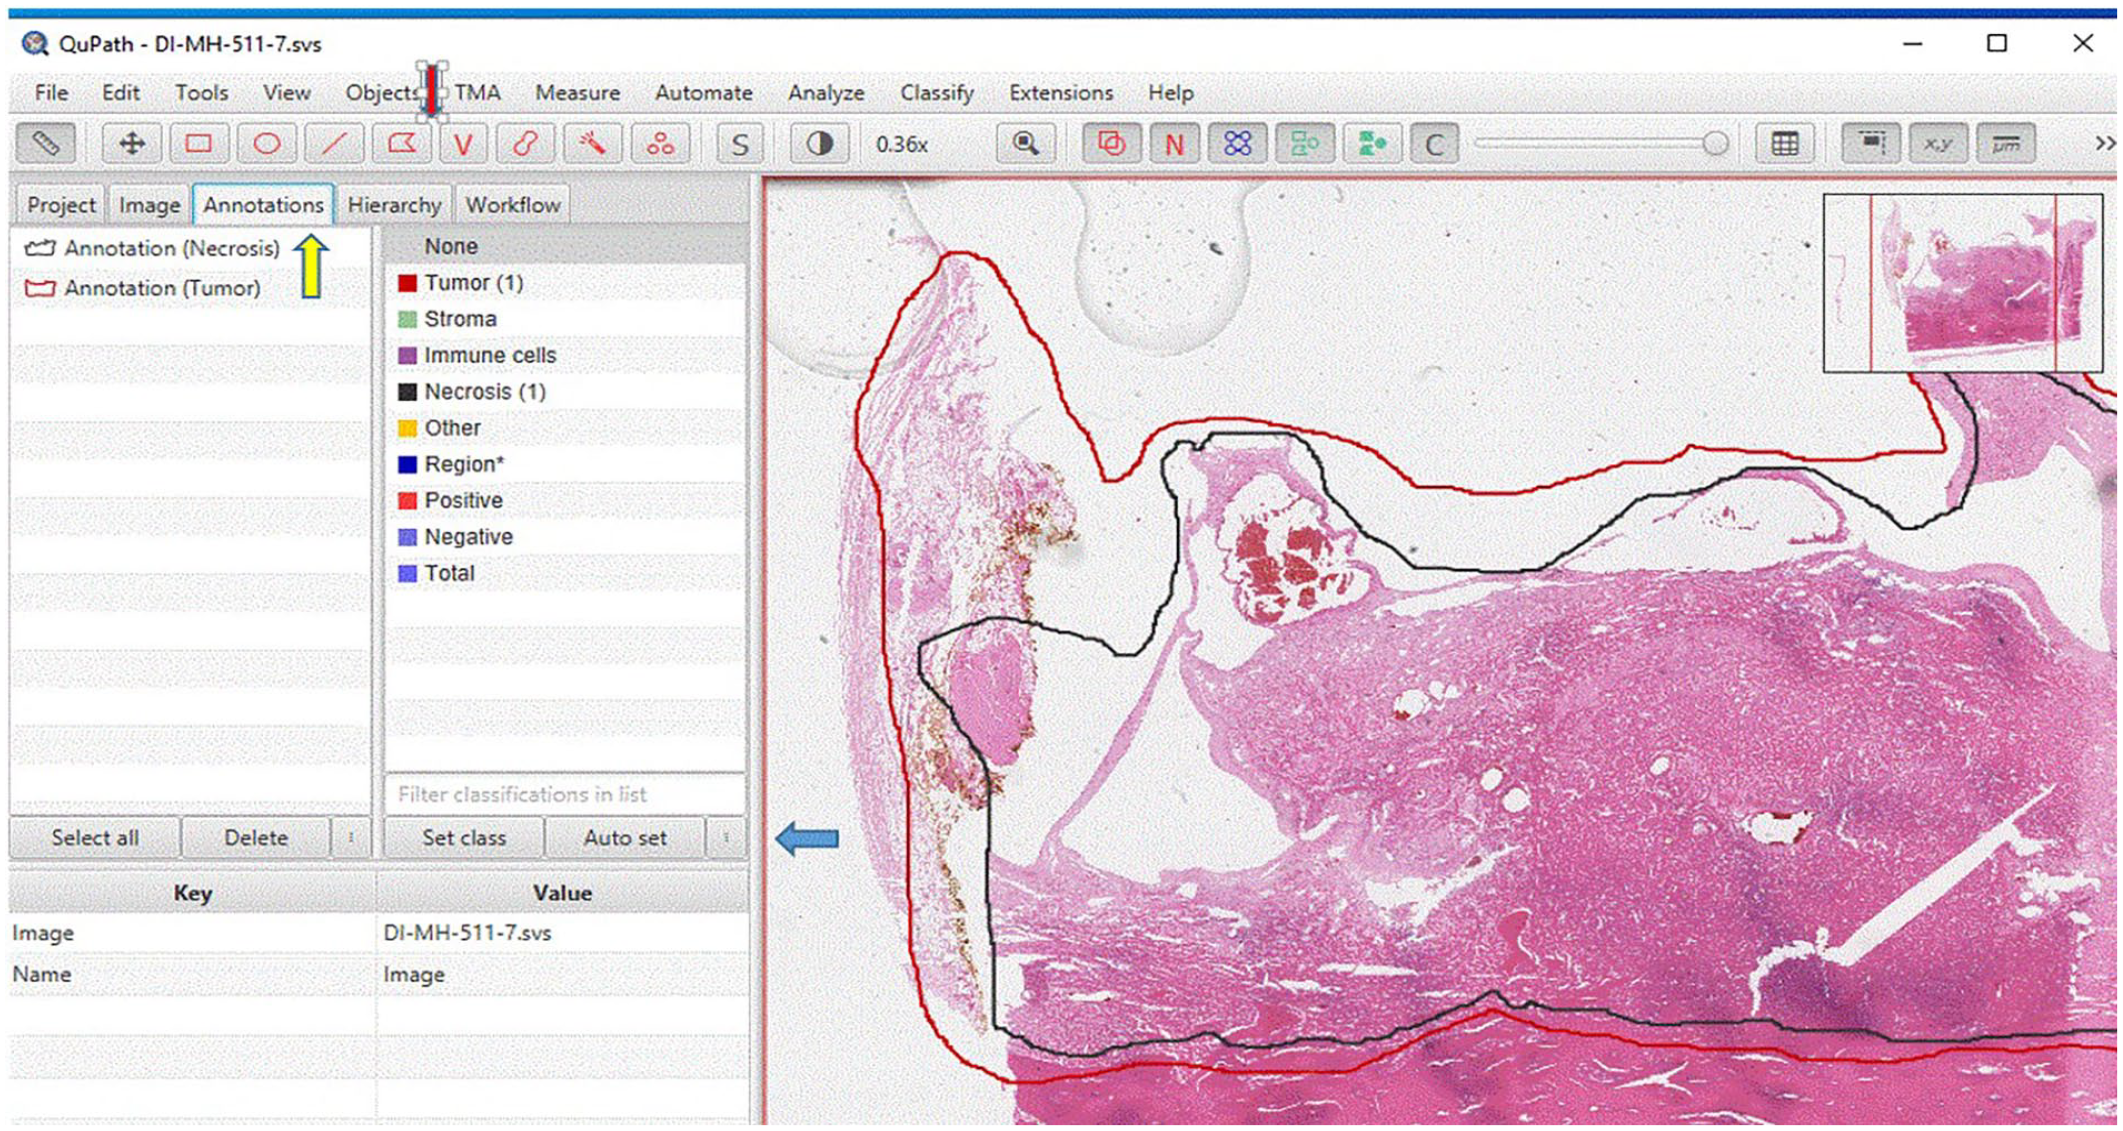
Annotation. Click “Annotations” (Yellow arrow) to set annotation class including “Tumor” (red, tumor bed) and “Necrosis” (black). Annotations classes for “tumor” and “necrosis” can be set by clicking the button (Blue arrow, right to the “Set class”). The region of tumor can be circled by the polygonal button (Red arrow). And a red object (Annotation (Tumor)) will appear in the left window to the Class window. A region of necrosis can be selected in a same way and a black object (Annotation (Necrosis)) will appear the left window.
Area Measurement
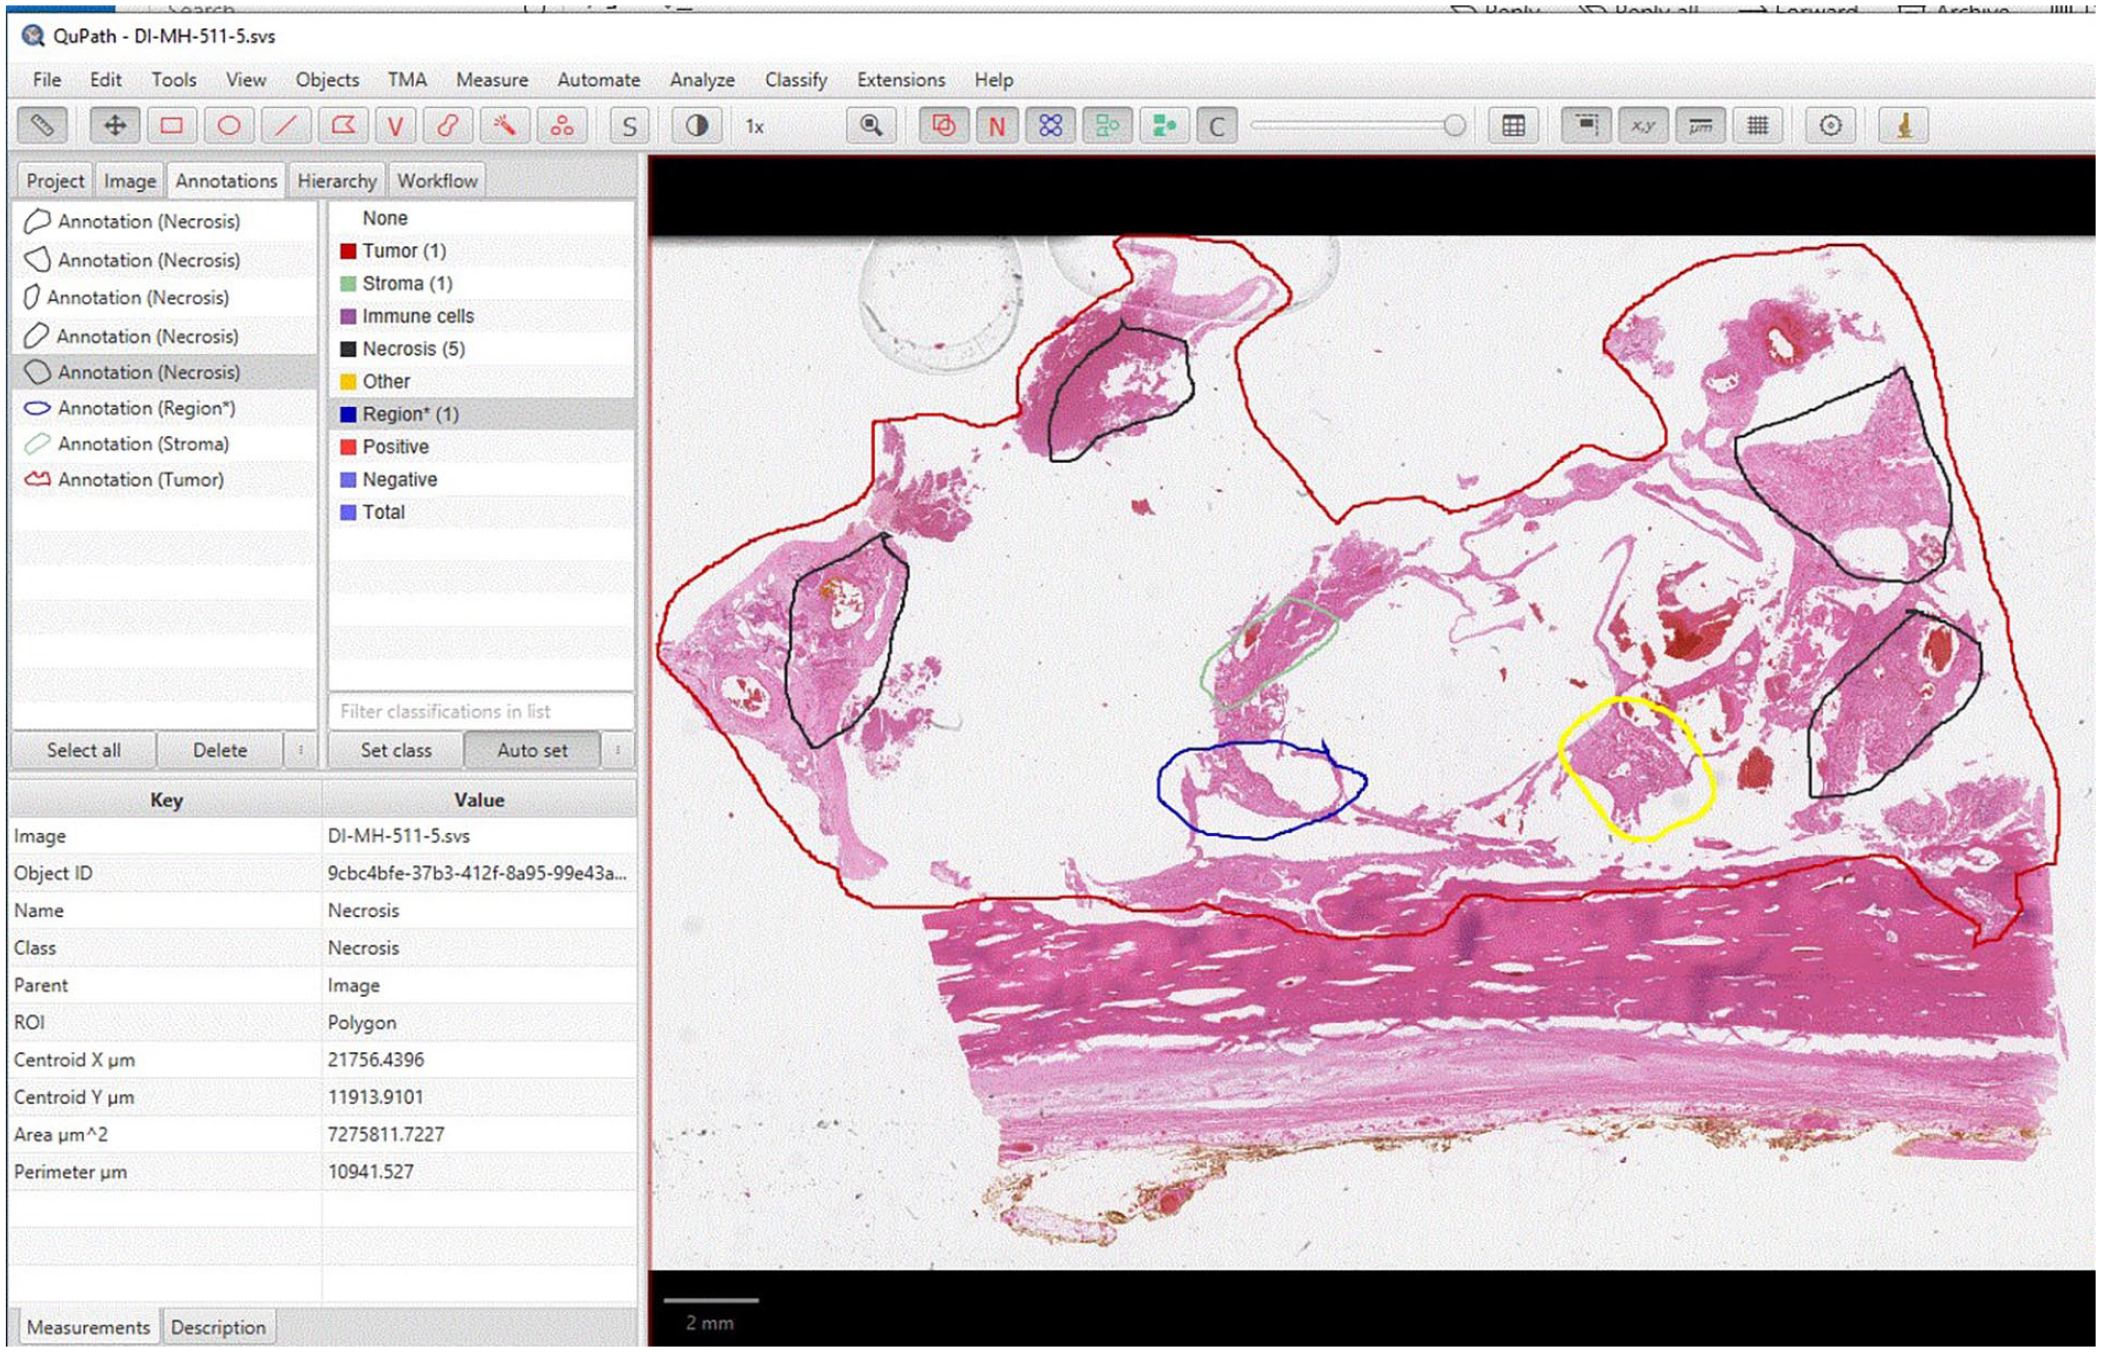
In the same “Annotation” page, at the left window of an object, when the object of interest (tumor or necrosis) was clicked, a description of multiple parameters including area would appear in the left lower window of “Key and Value” (Figure 4).
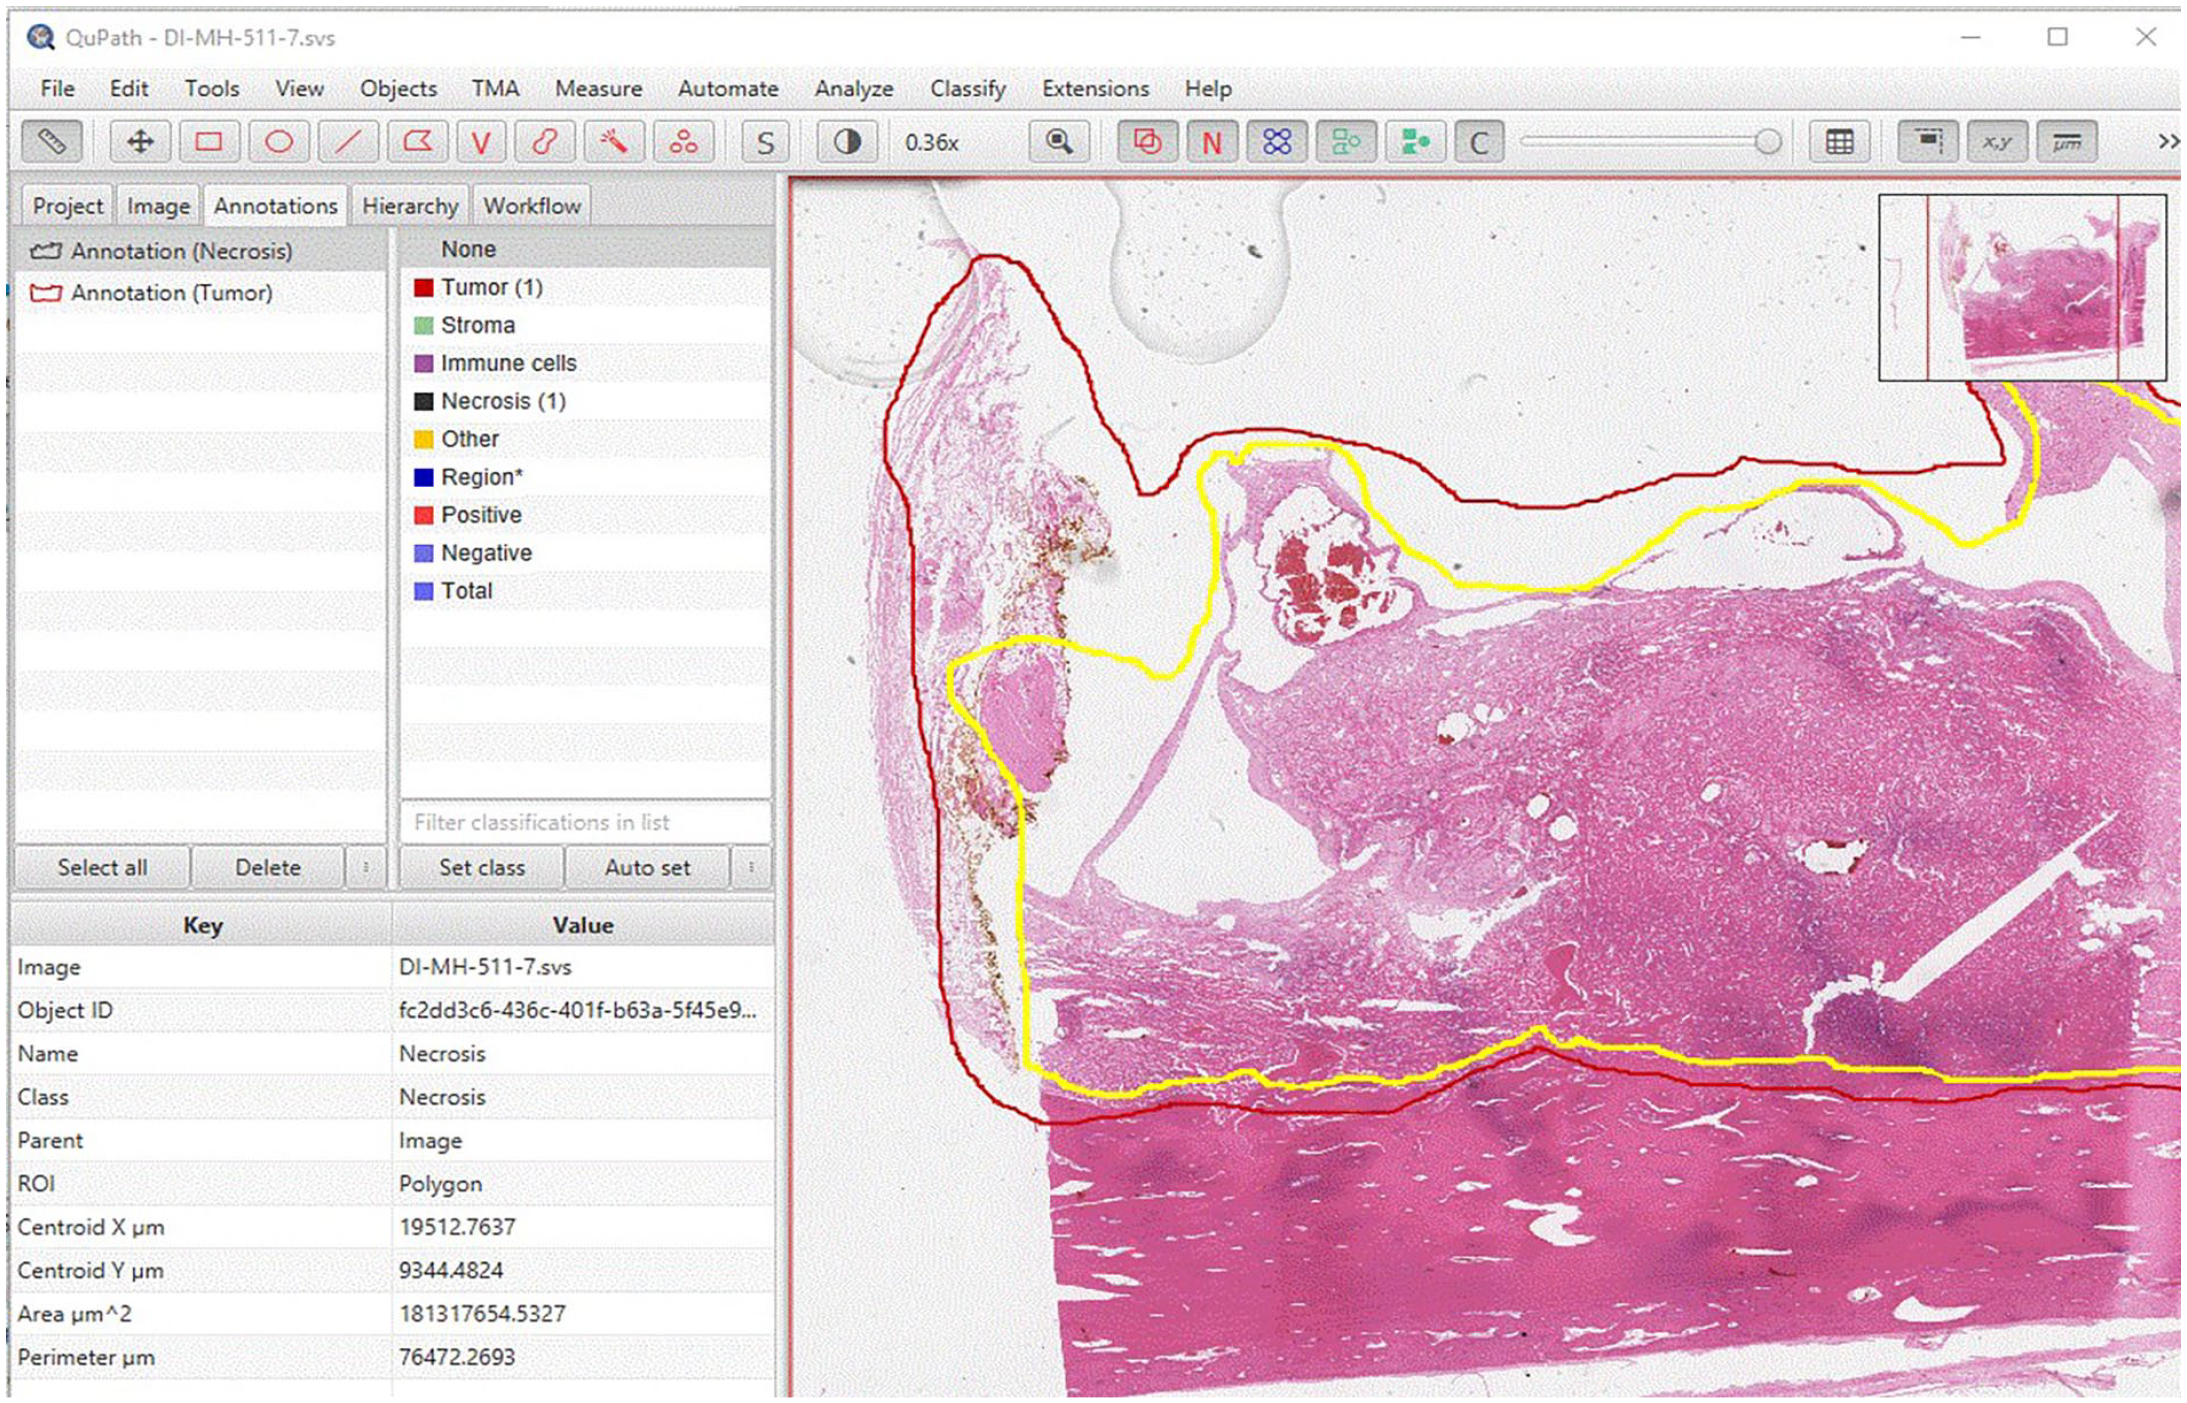
In the “Annotation” page, at the left upper window of object, click the object of interest (Annotation (Tumor) or annotation (Necrosis), a description of multiple parameters including area will appear in the left lower window of “Key and Value.” User can copy the value of area of “tumor” and “necrosis,” and paste into an Excel file.
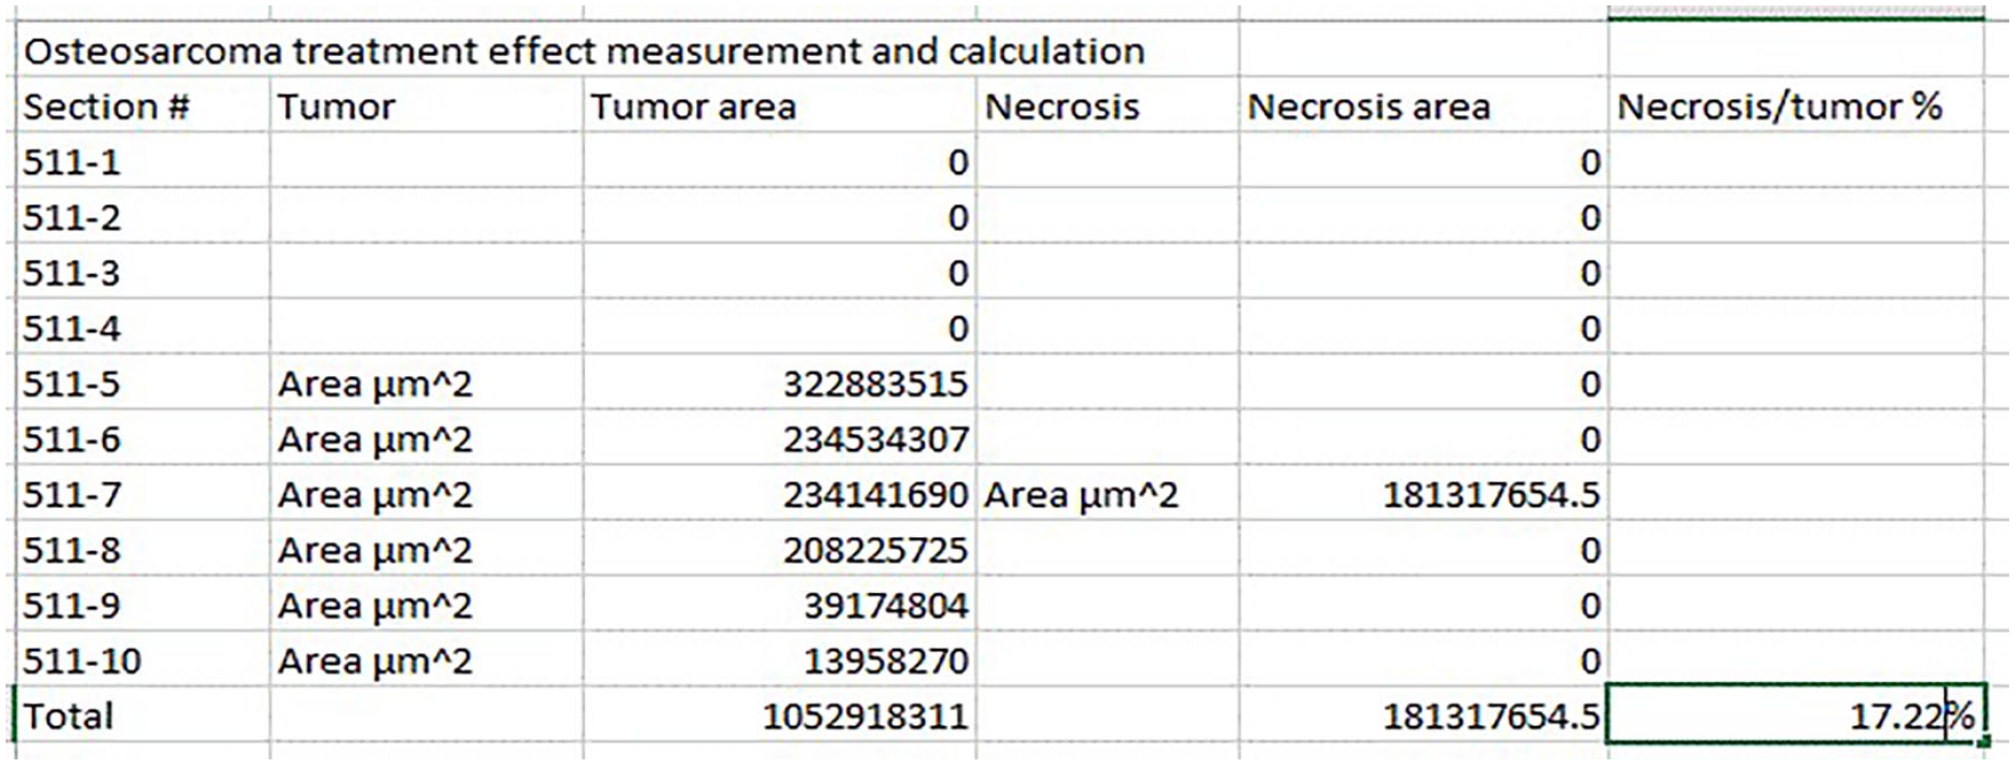
The values of the area of “tumor” and “necrosis” were pasted into an Excel file (Figure 5). The button of “save” was clicked to save the annotation results. The area measurement of “tumor” and “necrosis” in all images could be obtained by repeating the above steps mentioned in “Annotation” and “Area measurement.”
By clicking “Image” button, user can go to different images. By repeating steps of “Annotation” (to define/annotate region of “tumor” and “necrosis,” respectively) and “Area measurement,” user can obtain the area measurement of “tumor” and “necrosis” in all images. These measurements can be entered into an Excel file. The total area of “tumor” and “necrosis” of all images can be summed using the Excel “Sum” function. Percentage of “necrosis” can be obtained by dividing the total area of “necrosis” by the one of “tumor.” In this example, the necrosis percentage is 17%.
Calculation of the Tumor Necrosis Percentage
The total areas of “tumor” and “necrosis” of all images were summed using the Excel “Sum” function. Percentage of “necrosis” was calculated by dividing the total area of “necrosis” by the one of “tumor” (Figure 5).
Results
Necrosis Percentage Measurement and Calculation
Following the basic annotation and area measurement steps described in the Methods section, a protocol for necrosis percentage measurement and calculation was developed. Buttons of “Project’, “Image” and “Annotations” on the third row (from above) on the home page (Figures 3 and 4) were clicked to perform the different functions of Qupath. The “Image” button was used to select the image of interest. The “annotation” button was used to define ROIs (including tumor and necrosis” and parameters of these ROIs appeared in the “annotation” page. These measurements were manually copied and pasted into an Excel file. The total areas of “tumor” and “necrosis” of all images were summed using the Excel “Sum” function. Percentage of “necrosis” was calculated by dividing the total area of “necrosis” by the one of “tumor” (Figure 5). For the example used in this study, necrosis/tumor ratio was measured and calculated as 17.22% by Qupath and estimated as 20% by the case pathologist.
Table 1 summaries the differences between our method and the current “gold standard” approaches.
Comparison of Proposed Digital Measurement to Current “Gold Standard” Approach.
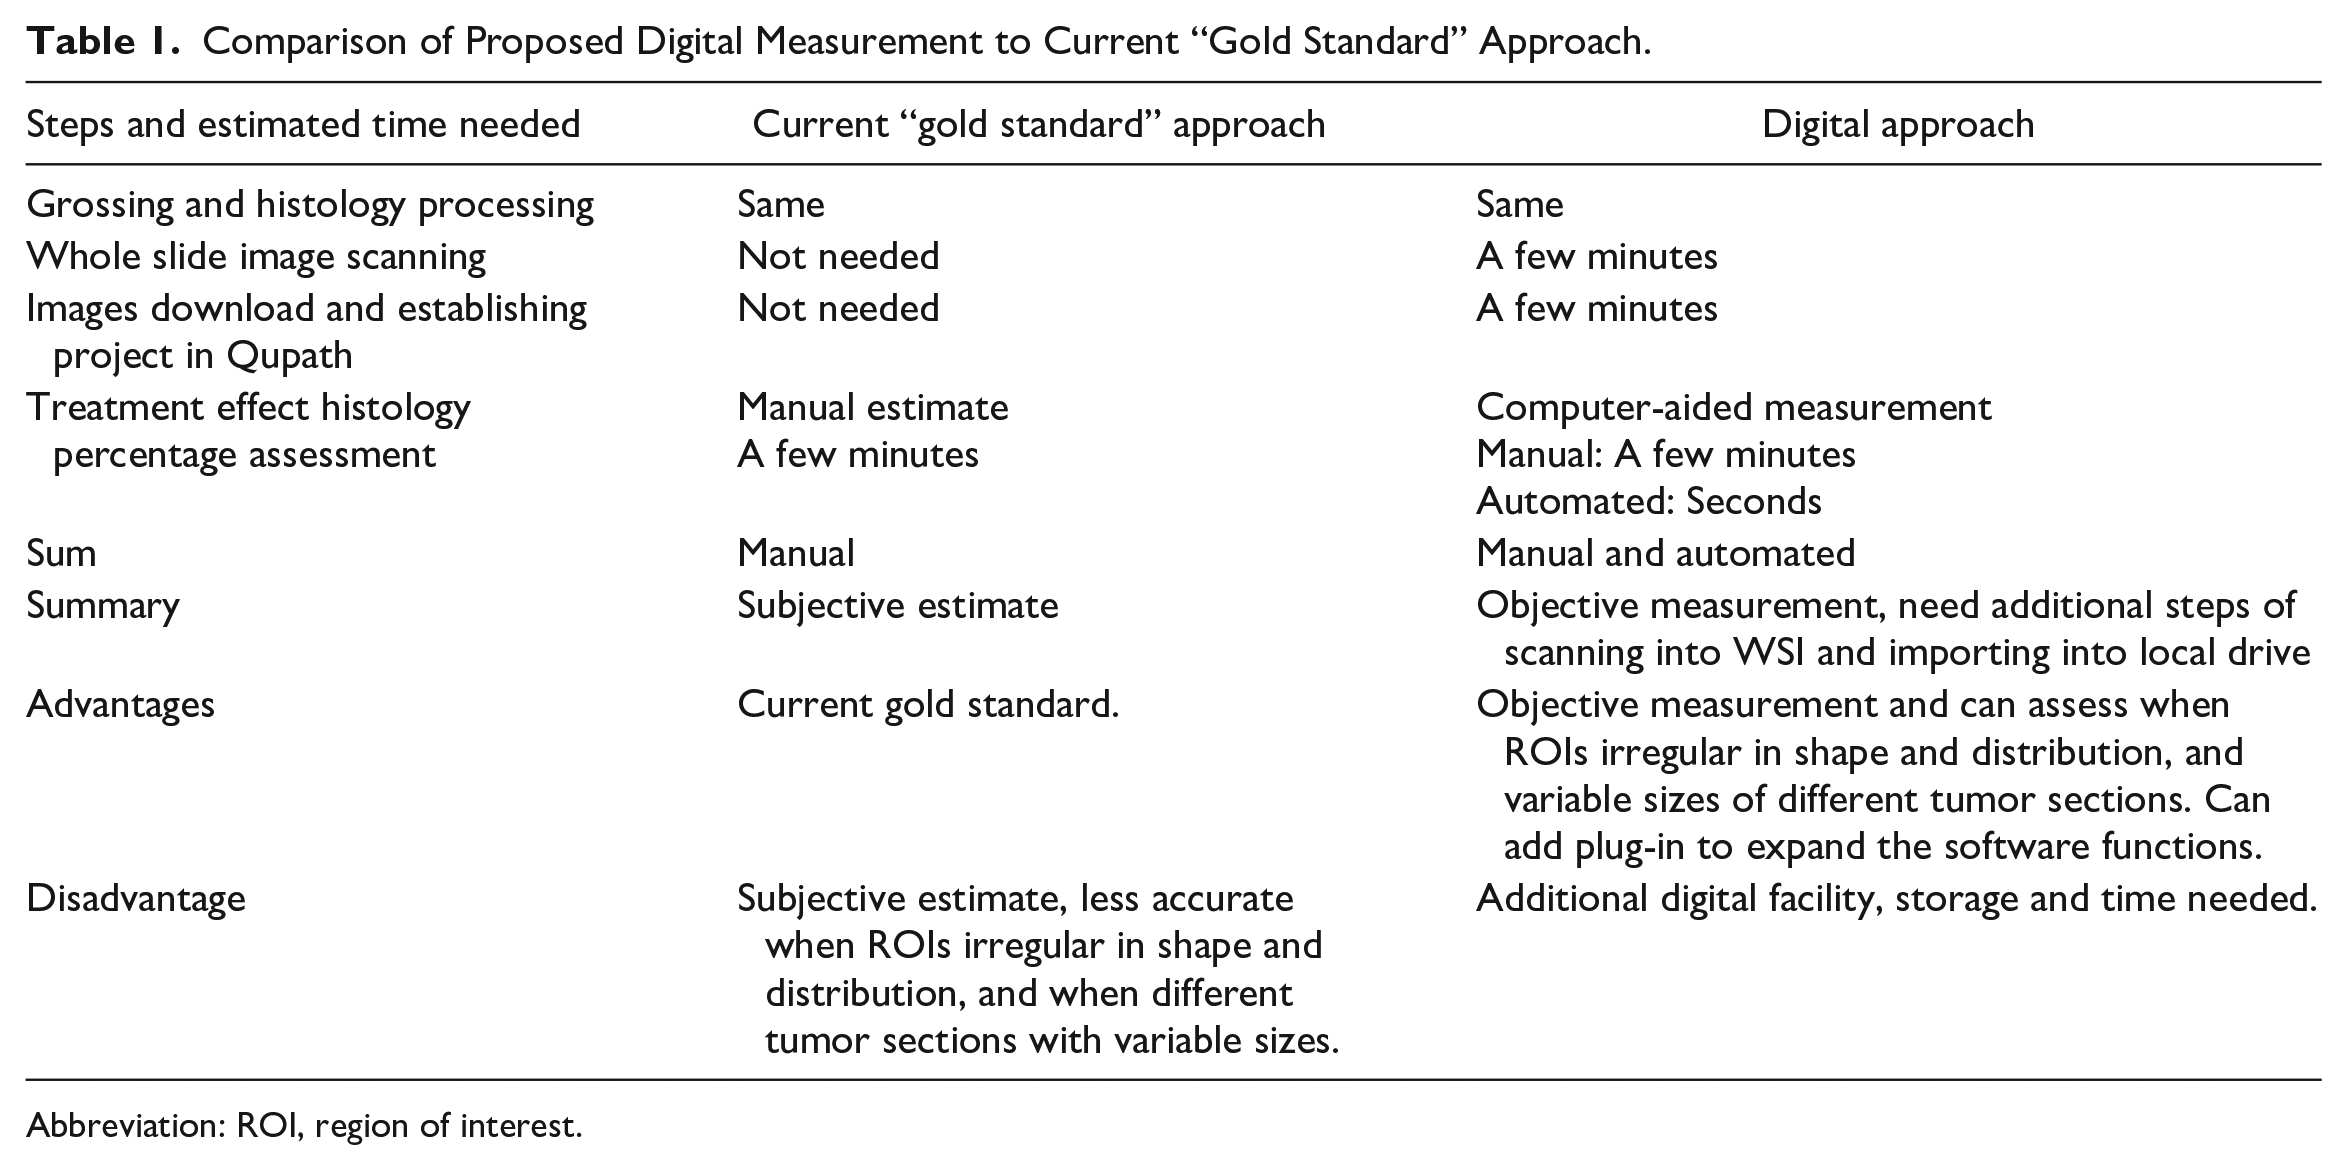
Abbreviation: ROI, region of interest.
Semi-Automatic Necrosis Percentage Estimate
A program was developed to read the “area” of “tumor” and “necrosis” from individual images (Figure 6(a)), sum the total of these 2 objects from each image, and calculate the percentage (Figure 6(b).
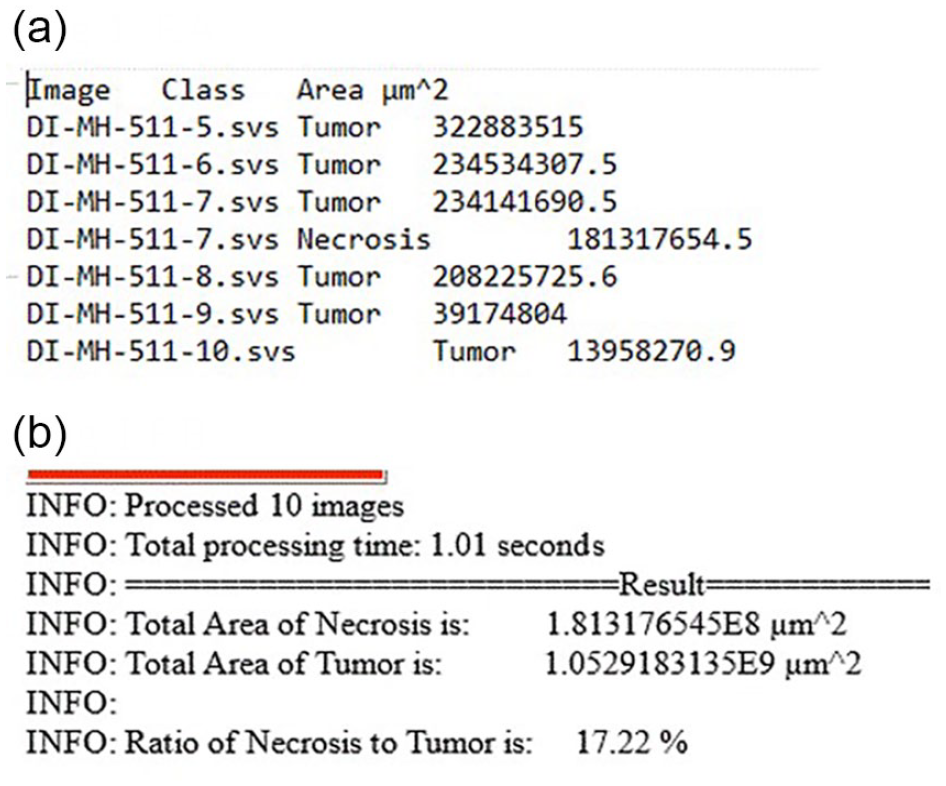
(a) A program was developed to read the “area” of “tumor” and “necrosis” from individual images. (b) And to sum the total of these 2 objects from each image, and calculate the percentage.
The “Automate” was clicked, and “Show Script Editor” was selected, which opened a “Script Editor.” In Script Editor, “File” was clicked, followed by “open.” A “groovy” script was chosen; When the correct script was loaded into the script editor, then “Run” bottom was clicked to execute the script. Using this automated program, each area of “tumor” and “necrosis” is detected, and their area measurement can be collected with a final percentage calculated automatically by the script, as proof of concept (see Figure 6). The script generated the same 17.22% as the result generated by manual extraction of Copath annotation parameters and calculation mentioned above.
Measurement of multiple regions of interest (ROIs)
The developed protocol and semi-automated program can be (or was) augmented to address issues such as identification of individual viable tumor cells. On a same WSI, different ROIs, that could represent same or different tissue types, such as total tumor bed, necrosis, fibrosis, or viable tumor cells, could be annotated separately in different colors with their own parameters obtained separately (Figure 7). This approach was tested as proof of concept. This feature would allow separating individual viable tumor cells in areas of necrosis since parameters of different ROIs could be obtained separately.
To assess different histopathological features, each histological feature, such as tumor, necrosis, and fibrosis, can be annotated as different colors. Each color represents different tissue type (for demonstration only, color does not correlate with tissue type indicated). Following same steps as 1 to 5, area of each category (tumor, necrosis, and fibrosis) can be obtained and summed.
Discussion
More and more institutions have started to implement digital pathology including whole slide images into clinical service. 8 There is a fast-growing need for digital pathology tools to assist pathologists in daily service. These tools can be commercial image analysis software that have associated costs, such as a license fee; or self-developed tools which need significant resources in computer science and technology. Qupath is an open-source software. It provides another option for pathologists for image analysis and measurement with WSIs. It can be downloaded freely. There are many functions including object detection that can be used to count cells by H&E or immunohistochemical stains. 9 Users, if technically possible, can add a plug-in to achieve additional functions.
In the current study, we developed a method that can measure tumor treatment effect by calculating the percentage of total necrosis area over tumor area. Taking advantage of the open-source nature of Qupath, we added a program that can extract the measurement value (of area) for each image from QuPath, sum them, and calculate the percentage automatically.
A comparison of the proposed digital approach using WSI/Qupath and the current “gold standard” by pathologist’s manual estimate is listed in Table 1. The histopathology of tumor treatment effect could be multifocal and in irregular shapes. Each section of the tumor usually has a different size. Pathologists can only achieve a subjective estimate of the “treatment effect/tumor” percentage. The digital approach provides an objective measurement instead of an estimate. The current approach also allows annotation and area measurement of multiple regions of interest of same or different histopathology, for example, total tumor bed, necrosis, fibrosis, or viable tumor cells, and can assess situations such as focal necrosis among viable tumor cells, or vice versa (Figure 7). The accuracy of the digital measurement is only limited by the user (pathologist)’s recognition of individual histological features. As demonstrated by the example used in this study, experienced pathologists can reach a highly accurate estimate (20%) very close to the measurement by computer image analysis software (17.2%).
Although the digital approach does need image scanners to scan glass slides into WSIs, digital storage space to store the WSIs, and additional time for scanning glass slides into WSIs and importing the WSIs into software, it only takes a few minutes for these extra steps. The time for individual cases will be even shorter if all processes are organized in batches. With more and more institutions adopting WSI for clinical applications, this additional time can be well integrated into daily operations.
The above approach can also be used for other types of tumors that have a clinical need for post-treatment response assessment, such as Ewing sarcoma and hepatoblastoma, and the assessment of metastatic tumor to bone marrow.
A promising future direction will include automated viable and necrotic histopathologic tumor assessment using artificial intelligence based on machine learning,10,11 and a potential real-time radiomic approach based on a model to predict tumor response to chemotherapy using multi-modal MRI sequences which could be established by direct correlation between histopathology and MRI. 12 Current efforts to develop such a model by Teo et al 12 have utilized histology performed using the current “gold standard.” Methods like what is provided in the current study would be able to provide an objective and accurate histopathologic measurement of treatment effect so to aid future model development.
Footnotes
Declaration of Conflicting Interests
The authors declared no potential conflicts of interest with respect to the research, authorship, and/or publication of this article.
Funding
The authors disclosed receipt of the following financial support for the research, authorship, and/or publication of this article: The study was supported by the Department of Pathology & Immunology faculty development fund (PJ000023111) to Dr. Mai He, Washington University in St. Louis School of Medicine. This work was also partially supported by the National Science Foundation Grants CCF1909963 and CNS2120350 (to Dr. Jerry Cheng). We appreciate the excellent work of the Path Digital Image Center, Department of Pathology & Immunology, Washington University in St. Louis School of Medicine.