
Abstract
Background:
Next generation sequencing (NGS) has increased the detection of fusion genes in cancer. NGS has found multiple fusions in single tumor samples; however, the incidence of this in pediatric soft tissue and bone tumors (PSTBTs) is not well documented. The aim of this study is to catalogue the incidence of multiple fusions in a series of PSTBTs, and apply a modified gene fusion classification system to determine clinical relevance.
Methodology:
RNA from 78 bone and soft tissue tumors and 7 external quality assessment samples were sequenced and analyzed using recently-described Metafusion (MF) software and classified using a modification of previously-published schema for fusion classification into 3 tiers: 1, strong clinical significance; 2, potential clinical significance; and 3, unknown clinical significance.
Results:
One-hundred forty-five fusions were detected in 85 samples. Fifty-five samples (65%) had a single fusion and 30 (35%) had more than 1 fusion. No samples contained more than 1 tier 1 fusion. There were 40 tier 1 (28%), 36 tier 2 (24%), and 69 (48%) tier 3 fusions.
Conclusions:
A significant percentage of PSTBTs harbor more than 1 fusion, and by applying a modified fusion classification scheme, the potential clinical relevance of such fusions can be determined.
Keywords
Introduction
Chromosomal translocations resulting in fusion genes occur in up to 20% of soft tissue and bone tumors. 1 Such events are disproportionately more common in pediatric soft tissue and bone tumors (PSTBTs) and are thought to play a major role in tumorigenesis, diagnosis, prognosis, and therapeutic targeting.2-5 Within the last decade, deep sequencing technologies such as NGS has led to an exponential increase in the discovery of molecular abnormalities in PSTBTs, 3 including fusion genes. This has resulted in more precise diagnoses and treatment plans for patients, leading to increased survival rates. 6 Conversely, there remains continued debate about which fusion genes are of clinical value and are considered actionable, particularly when more than 1 fusion is discovered in a single tumor sample.7,8 Several studies have demonstrated multiple fusions in single tumor samples, predominantly in hematopoietic9-11 and epithelial12-15 malignancies. While similar findings have been reported in soft tissue samples, 16 the incidence of multiple fusions in single PSTBT samples has not been well documented.
Frequently, multiple fusions in a single tumor sample represents a single driver fusion and several “passenger” fusions. 16 However, some tumors have multiple fusions with therapeutic relevance.11-13 Thus, the classification of fusions according to potential clinical significance is of paramount importance. There is a well-known scheme for classifying and reporting sequence variants in cancer, including SNVs, CNVs, and structural variants, based on criteria published by the American Society of Clinical Oncology and College of American Pathologists. 17 This system uses a four-tiered classification scheme: Tier 1 are variants of strong clinical significance; Tier 2 are variants of possible clinical significance; Tier 3 are variants of unknown clinical significance; and Tier 4 are benign and or possible benign variants. The scheme proposes classifying fusion genes using these same criteria. However, fusion genes are unique structural variants and classification according to clinical significance presents additional challenges. For example, when considering a gene fusion breakpoint, reading frame must be maintained to create a functional fusion protein and is a critical step in deciding pathogenicity with few exceptions. In this example, the mechanisms of fusion gene tumorigenesis are either oncogenic gene activation or tumor suppressor gene inactivation. Further, in most instances of in-frame fusions, designation of “benign” is challenging to justify without appropriate functional data. Several studies have proposed modifications to this scheme to account for such complexities present in fusions,14-16 and the current study has used a combination of standard and modified criteria to classify fusion genes according to likely clinical relevance.
The aims of this study were (1) to determine the incidence of tumors harboring more than 1 fusion gene in a single institute series of PSTBTs by using sensitive fusion detection software, and (2) to describe the process used to help determine clinical significance of the fusion genes at the time of diagnosis.
Materials and Methods
Sample and Case Selection
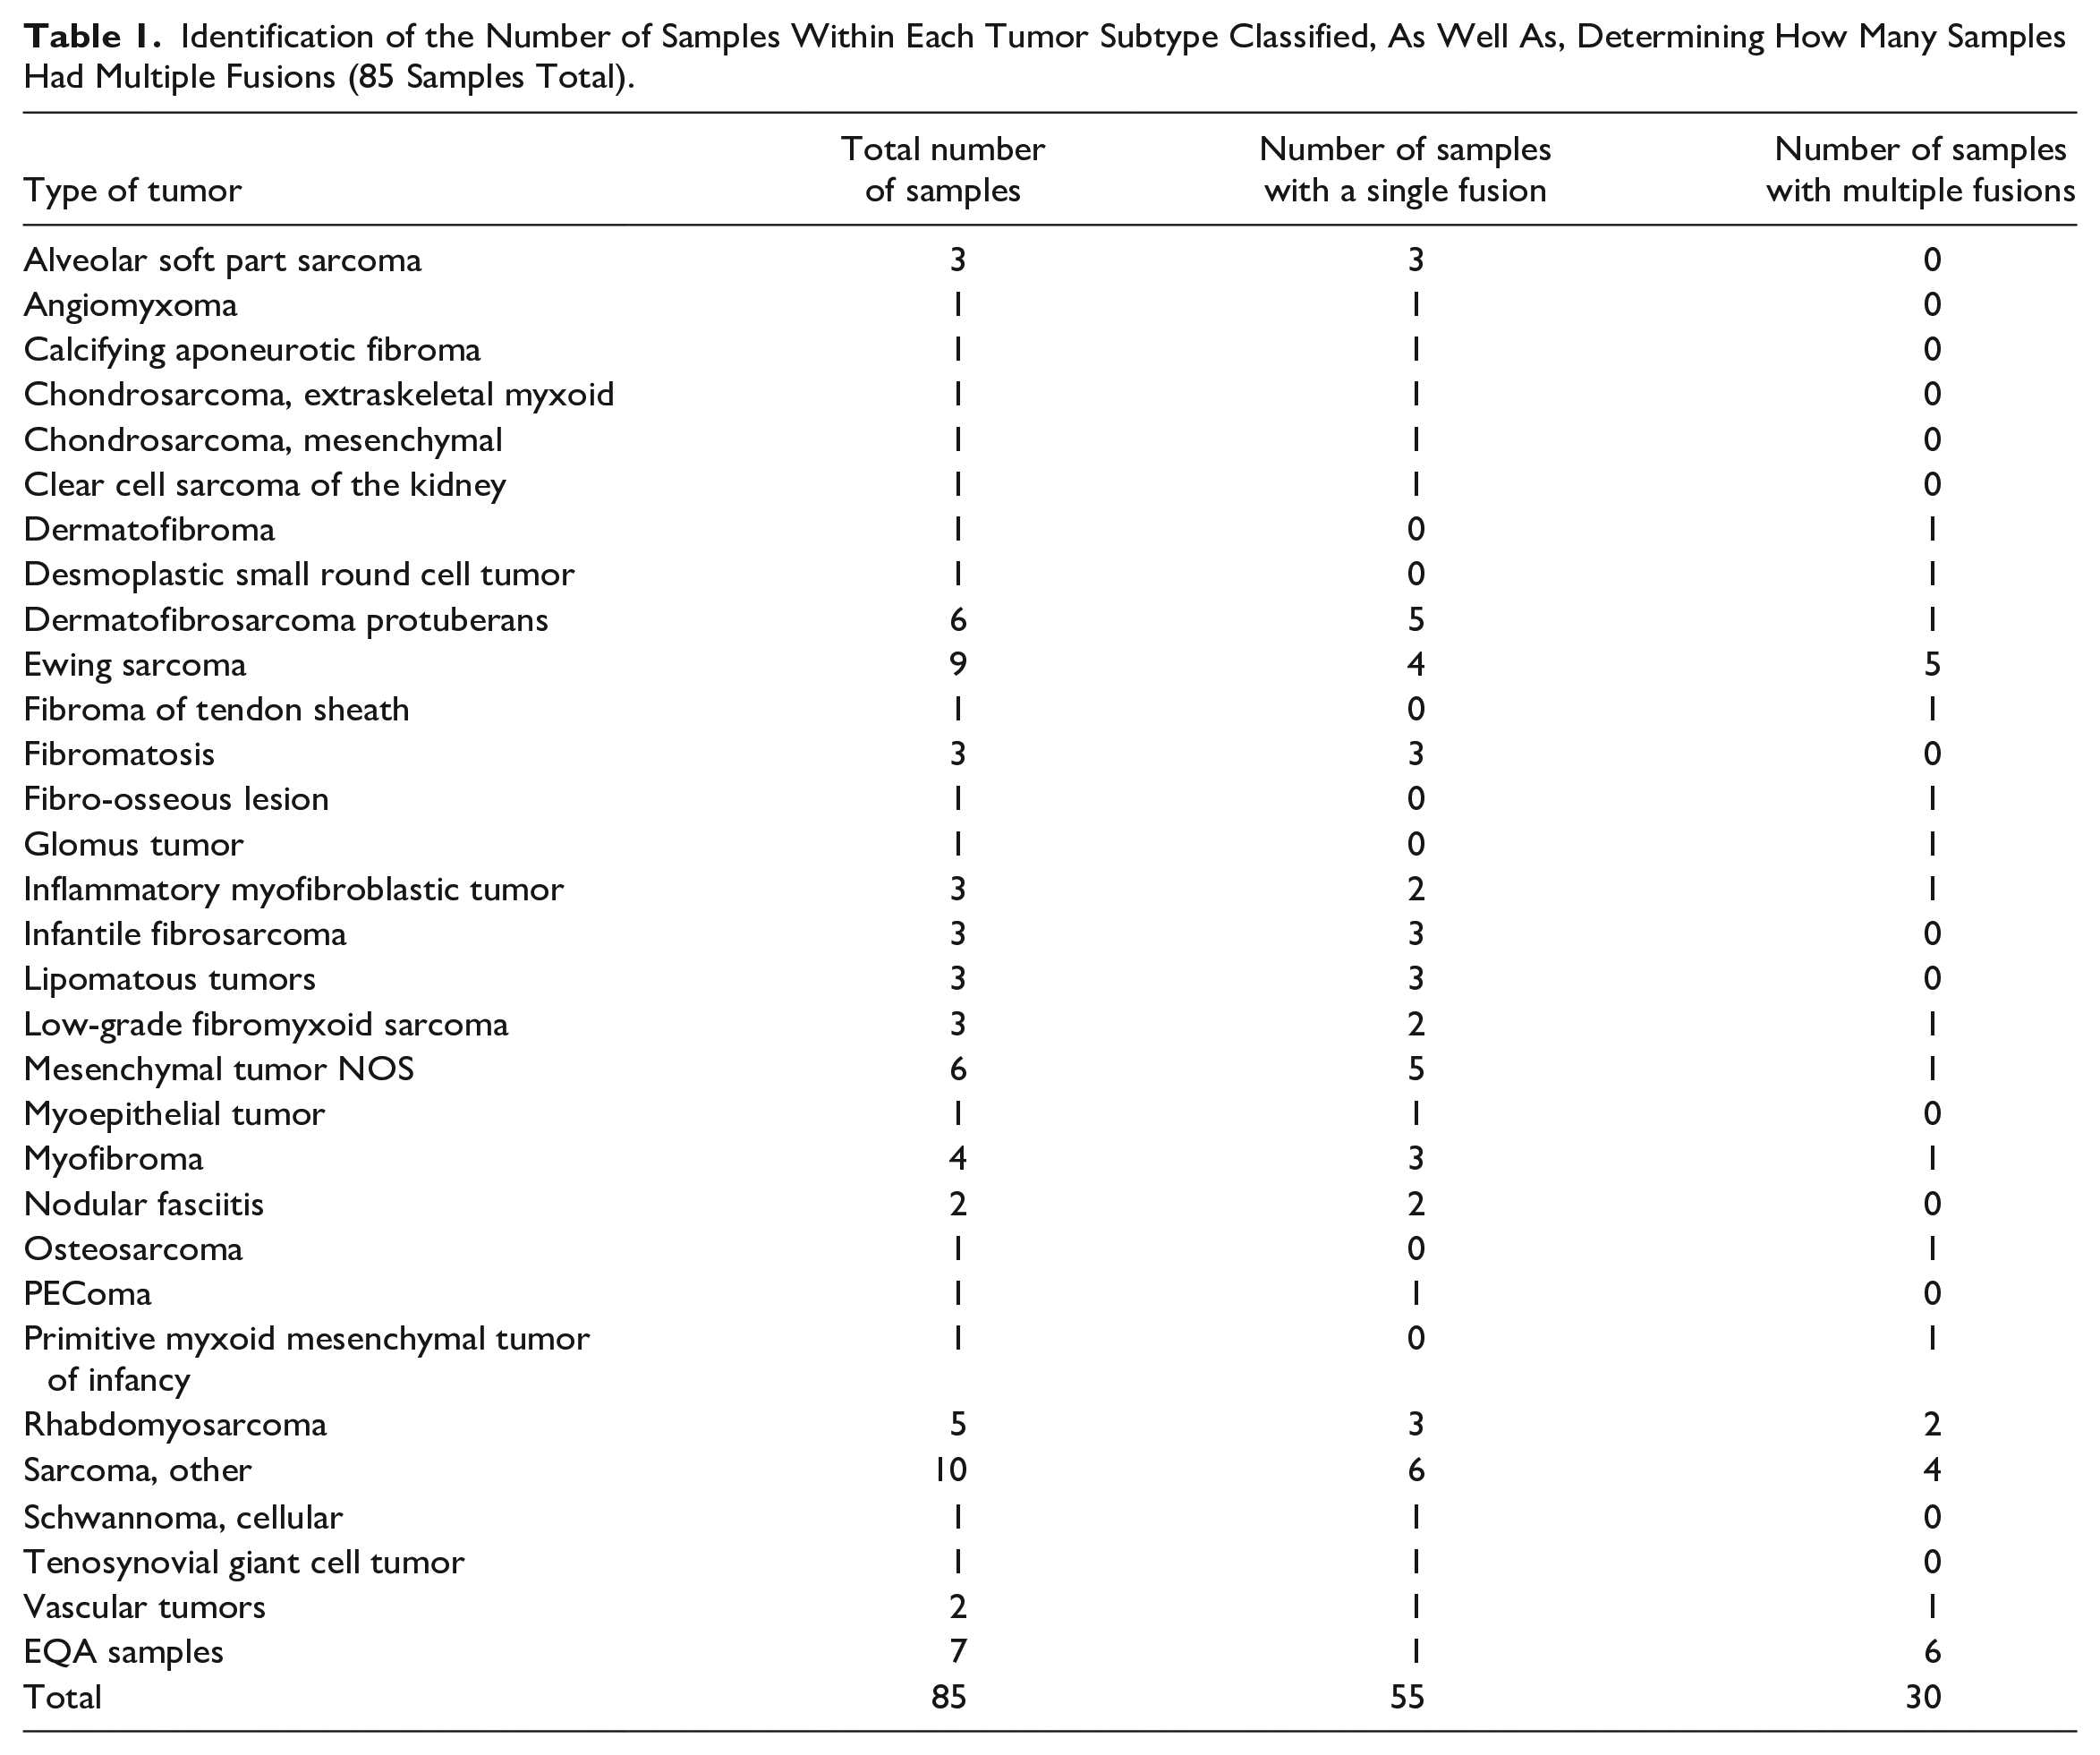
A total of 85 PSTBT samples (tumor samples = 78, external quality assessment [EQA] samples = 7) collected over a 42-month period (January 2018 to July 2022) were analyzed and classified (see Table 1 for details). Inclusion criteria were: (1) soft tissue and bone tumors diagnosed during the study period in patients aged under the age of 18 years, and (2) that had undergone TruSight targeted RNA sequencing (see below). Exclusion criteria included tumors not meeting the above age and site criteria and tumors that had not undergone sequencing analysis as part of the original diagnostic workup. EQA samples in this study come from the College of American Pathologist EQA program, and were added as an alternative source of material for molecular testing, adding rigor to our fusion detection and classification process. The study was approved by the Hospital for Sick Children’s Research Ethics Board (REB #1000079915). All tests performed were done according to the Hospitals Research Ethics Board Protocol.
Identification of the Number of Samples Within Each Tumor Subtype Classified, As Well As, Determining How Many Samples Had Multiple Fusions (85 Samples Total).
Fusion Transcript Sequencing and Analysis
All samples were sequenced using the Illumina TruSight RNA Pan-Cancer Panel, which is a targeted RNA sequencing assay that provides in-depth examination of the cancer transcriptome (Illumina, San Diego, California, USA). The panel covers 1385 genes including those involved in pediatric cancer (see TruSight RNA Pan-Cancer Panel | Study cancer gene fusions and expression [illumina.com]). The Trusight Pan-Cancer assay is primarily used for fusion detection but also allows assessment of expression levels and SNVs (Illumina, San Diego, California, USA). Raw sequencing data was analyzed with MetaFusion, a recently developed algorithm for the detection of fusion genes.
18
MetaFusion combines results from eight fusion callers, extensively filters calls to remove events including artifacts and read-throughs, and compares results against a curated list of known oncogenic fusions.
18
When compared with both its individual callers and independent gold-standard software, MetaFusion significantly improves the sensitivity, precision and specificity of fusion detection (paper in review; see discussion for metrics; see also Figure 1). The fusion breakpoints and frame of the fusion was determined manually by using the Integrated Genomics Viewer from the Broad Institute (
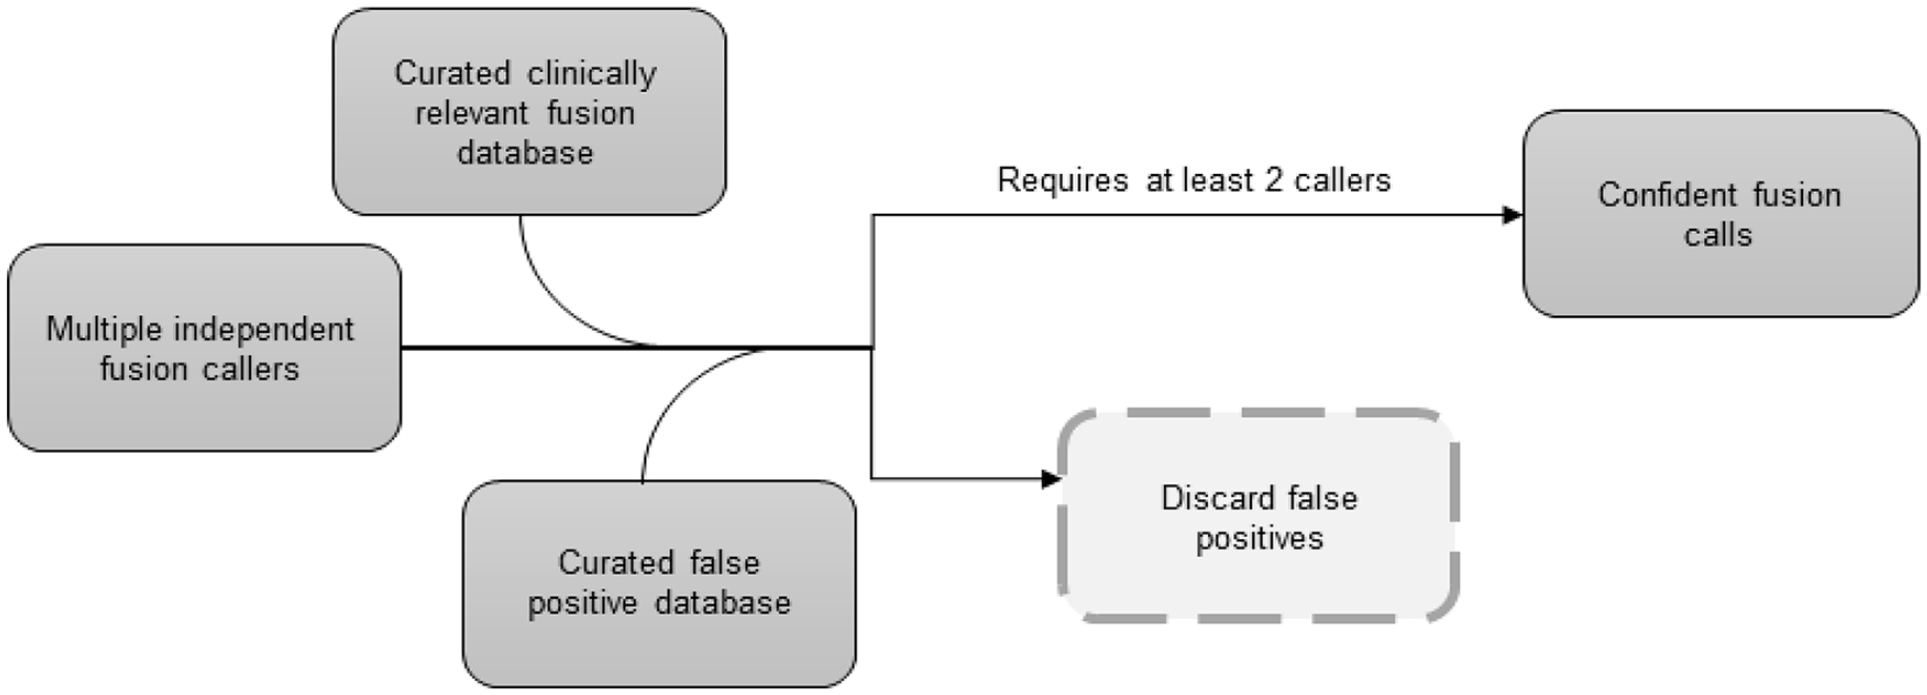
MetaFusion schematic. MetaFusion leverages the results of multiple independent fusion callers, as well as 2 additional databases: (1) a database of fusion pairs known to be clinically relevant, and (2) a database of known false positives. Both additional databases were internally curated and are constantly updated. This approach maximizes sensitivity, specificity, and precision of fusion detection. Requiring putative fusions to be detected by a minimum of 2 callers further increases confidence in the final fusion calls.
Analysis was conducted by compiling the list of fusions according to tumor type. Extensive research was done using COSMIC, Mitelman, NCBI, and PubMed databases to determine the pathogenicity of each gene in the fusion and what types of tumors the fusion has previously been detected. The St. Jude Pecan database was then used to determine which protein domains were lost or preserved in each translocation. A PubMed search was performed to compile studies describing the fusion and tumor types, as well as the scientific rigor and type of the manuscripts published, to allow for stringent tiered classification (see below and Tables 2–4).
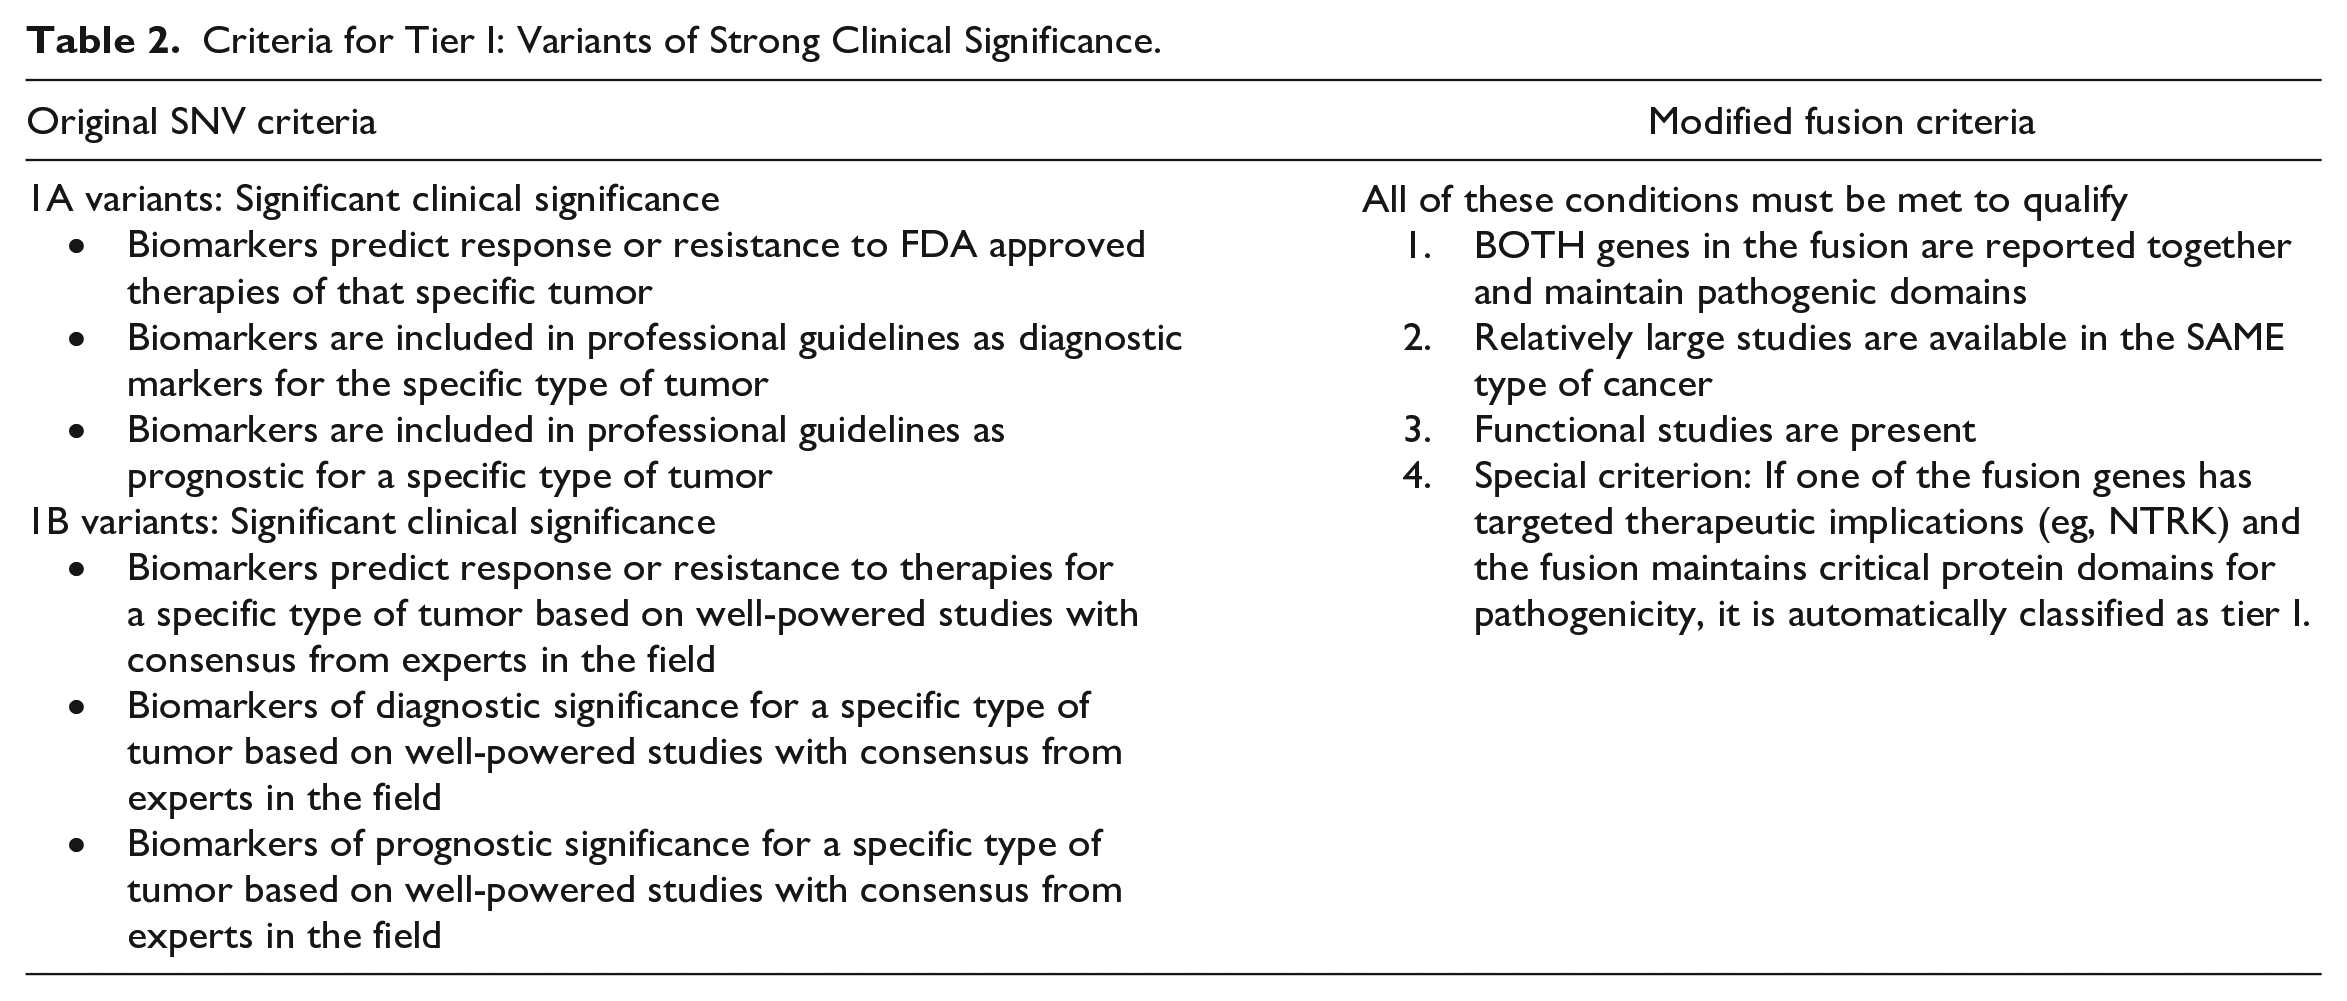
Criteria for Tier I: Variants of Strong Clinical Significance.
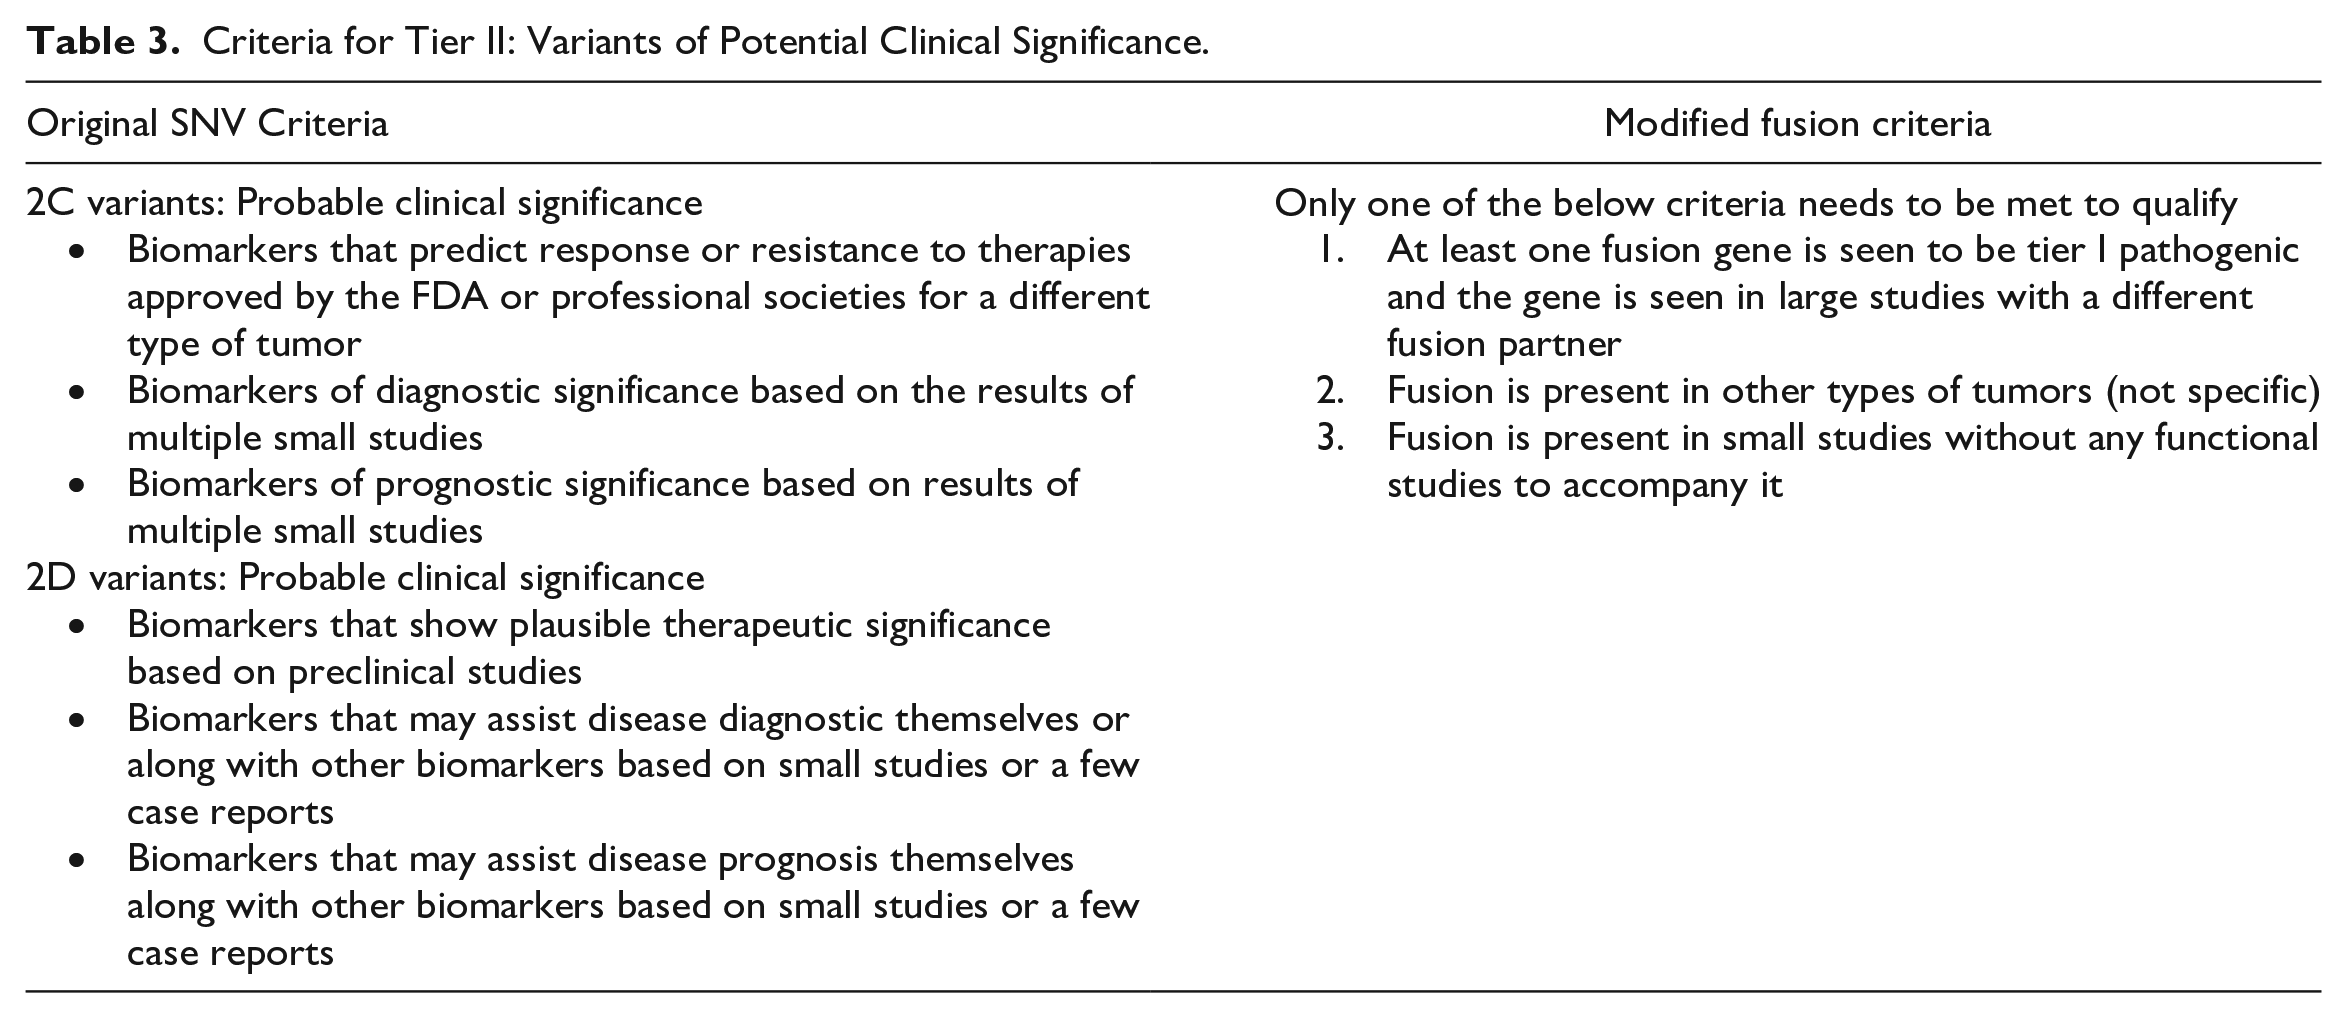
Criteria for Tier II: Variants of Potential Clinical Significance.
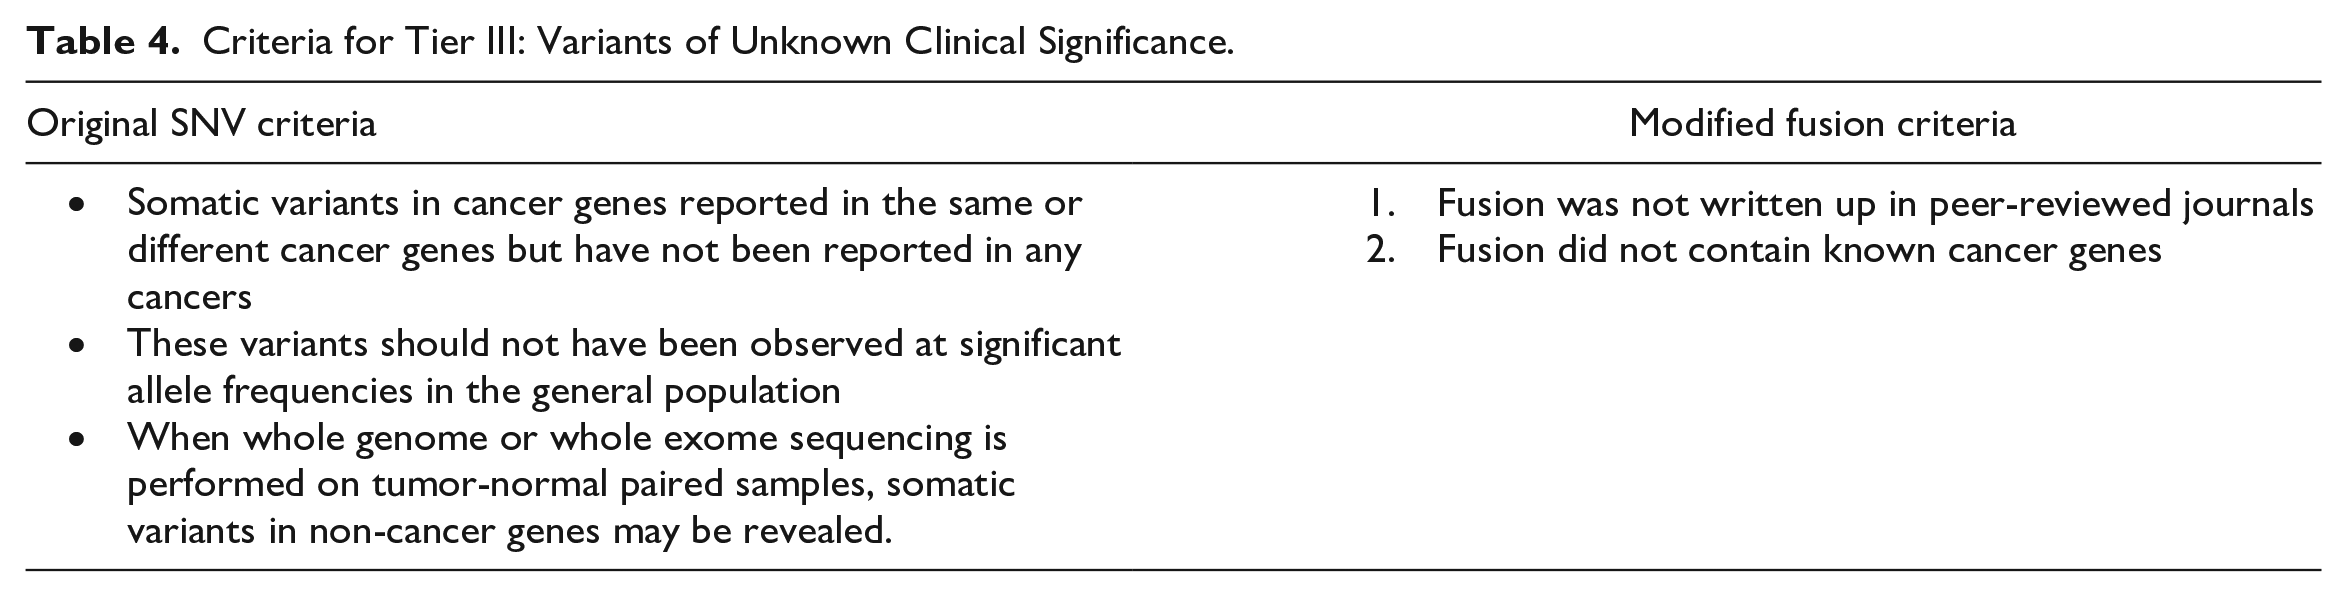
Criteria for Tier III: Variants of Unknown Clinical Significance.
Fusion Transcript Classification:
The existing four-tiered classification system for SNVs 17 was modified into a three-tiered classification system to categorize novel and canonical fusion transcripts. Briefly, tier I fusions are those with strong clinical significance and have been proven to be pathogenic. For a fusion to be classified as Tier I, all the following criteria must be met: (1) both genes in the respective fusion must be reported together in a singular fusion in previous literature with their pathogenic domains retained; (2) relatively large studies must exist describing the fusion in the same type of cancer being evaluated, and; (3) functional studies must be present that confirm the pathogenicity of the fusion. A final type of tier I fusion are those fusions that include genes with therapeutic implications, where the fusion must include the appropriate functional domain for therapy to be effective (eg, NTRK fusions). See also Table 2.
Tier II fusions are those with potential clinical significance for the formation and progression of tumors. Only 1 of the following criteria must be met to be classified as tier II fusion: (1) 1 of the fusion genes was seen to be tier 1 pathogenic; (2) the fusion was reported in other tumor types, or (3) the fusion was reported in small studies without functional data. See also Table 3.
Tier III fusions are those in which none of the above criteria are met; for example, the fusion in question has not been published in peer-reviewed journals, and/or the fusion does not contain any known cancer-causing genes. See also Table 4.
Results
Sequencing 85 samples identified a total number of 145 fusion genes after analysis with MetaFusion. Of the 85 samples, 55 (65%) had a single fusion and 30 (35%) samples had more than 1 fusion (Table 1). Samples analyzed from patient tissue resulted in a total of 78 samples with 117 total fusions. The most frequent tumor types with multiple fusions included Ewing sarcoma (5 of 9, 55%), followed by rhabdomyosarcoma (embryonal, translocation-negative alveolar, and spindle cell) (2 of 5, 40%), sarcoma NOS (4 of 10, 40%), inflammatory myofibroblastic tumor (IMT) (1 of 3, 33%), low-grade fibromyxoid sarcoma (LGFMS) (1 of 3, 33%), myofibroma (1 of 4, 25%), mesenchymal tumor NOS (1 of 6, 17%), and dermatofibrosarcoma protuberans (1 of 6, 17%) (Table 1). In addition, several tumor types with just 1 sample in the cohort harbored multiple fusions (see Table 1). In samples with more than 1 fusion gene, the additional fusion genes were tier 3, usually combined with either a tier 1 or a tier 2 fusion (supplementary Table S1). No tumor sample had more than 1 tier 1 or tier 2 fusion, and only 1 tumor sample (a glomus tumor) had both a tier 1 and a tier 2 fusion (MIR1434HG, CARMN::NOTCH2 [tier 1] and ATP2B4::NOTCH2 [tier 2]).
Of the 145 fusions, 144 were in-frame. Overall, 40 of 145 (28%) fusions in this study were classified as tier I fusions (variants of strong clinical significance; eg, EWSR1::FLI1 present in Ewing sarcoma, see Figure 2). Thirty-six fusions (24%) were classified as tier II (variants of potential clinical significance; eg, FN1::EGF in a calcifying aponeurotic fibroma, see Figure 3), and 69 (48%) fusions were classified as tier III (variants of unknown clinical significance; eg, ANGPT1::EIG3H in a myofibroma, see Figure 4).
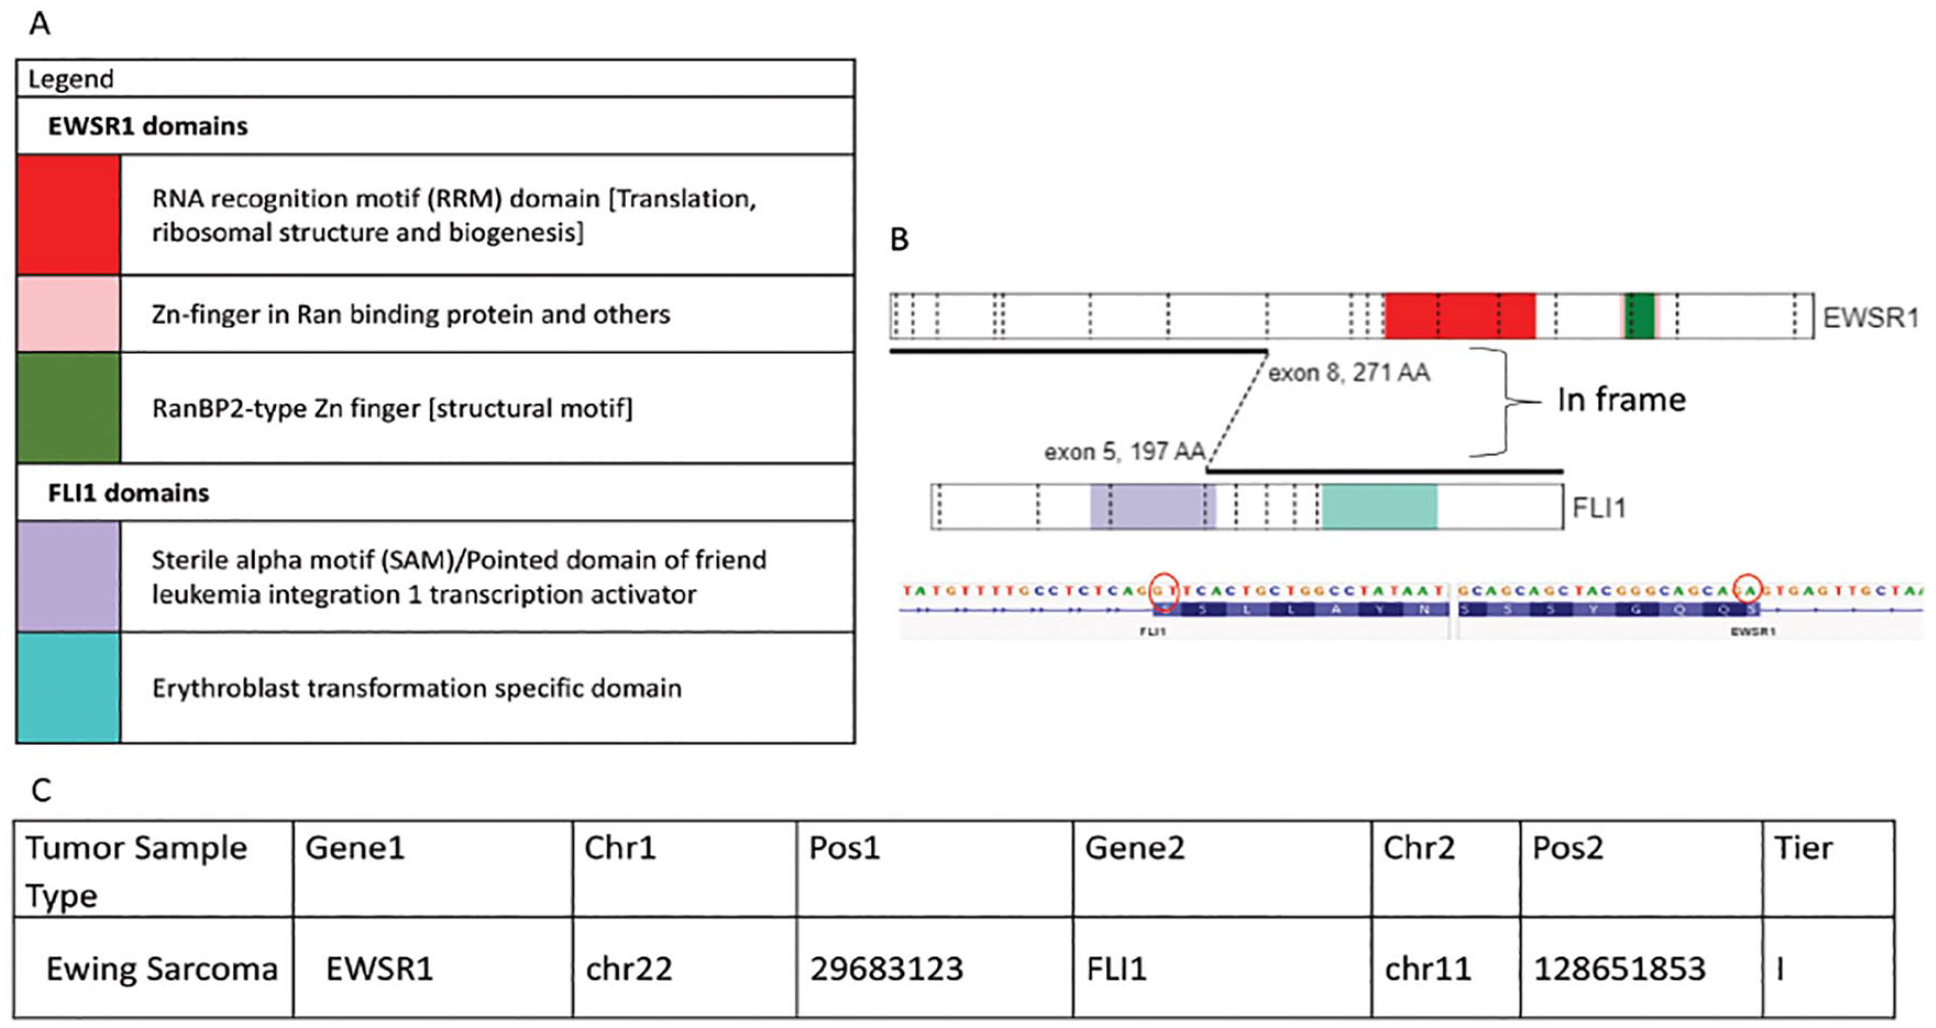
The EWSR1::FLI1 fusion in a Ewing Sarcoma tumor was identified as a tier I fusion (fusion of strong clinical significance) during this study. (A) Depicts a colour coded legend that identifies the different domains present within each gene and the chromosomal fusion. (B) Shows a visual representation of the fusion between the EWSR1:FLI1 genes indicating where the chromosomal breaks occur and then are rejoined together (generated from St. Jude Pecan). The sequence found just below identifies the nucleotide sequence involved at the breakpoint of fusion and confirms that the fusion is in-frame (generated on IGV). (C) Is a tabular representation of data that depicts the type of tumor the fusion, the genes involved in the fusion, the chromosomal location of breaks identified and analyzed by the next-generation software Trusight and MetaFusion, and the tier classification.
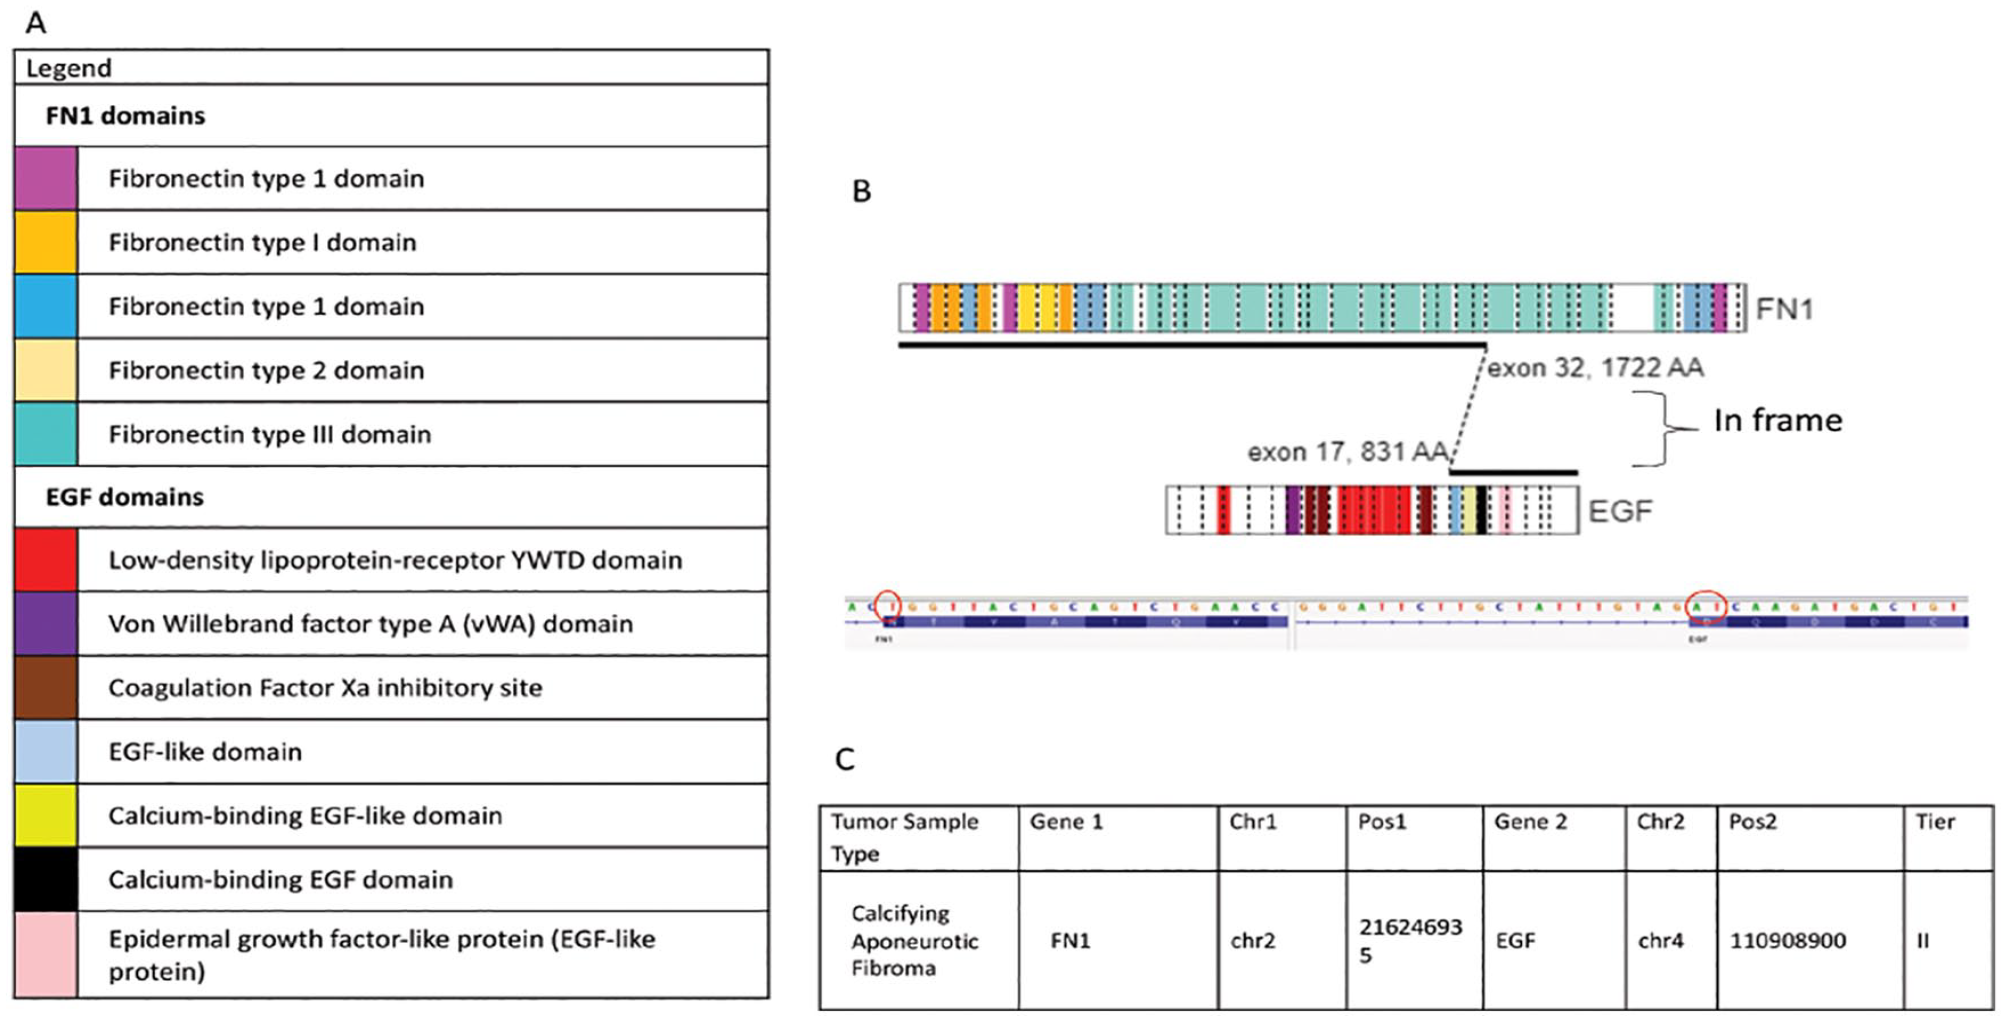
The FN1::EGF fusion in a calcifying aponeurotic tumor was identified as a tier II fusion (fusion of potential clinical significance) during this study. (A) Depicts a colour coded legend that identifies the different domains present within each gene and the chromosomal fusion. (B) Shows a visual representation of the fusion between the FN1::EGF genes indicating where the chromosomal breaks occur and then are rejoined together (generated from St. Jude Pecan). The sequence found just below identifies the nucleotide sequence involved at the breakpoint of fusion and confirms that the fusion is in-frame (generated on IGV). (C) Is a tabular representation of data that depicts the type of tumor the fusion, the genes involved in the fusion, the chromosomal location of breaks identified and analyzed by the next-generation software Trusight and MetaFusion, and the tier classification.
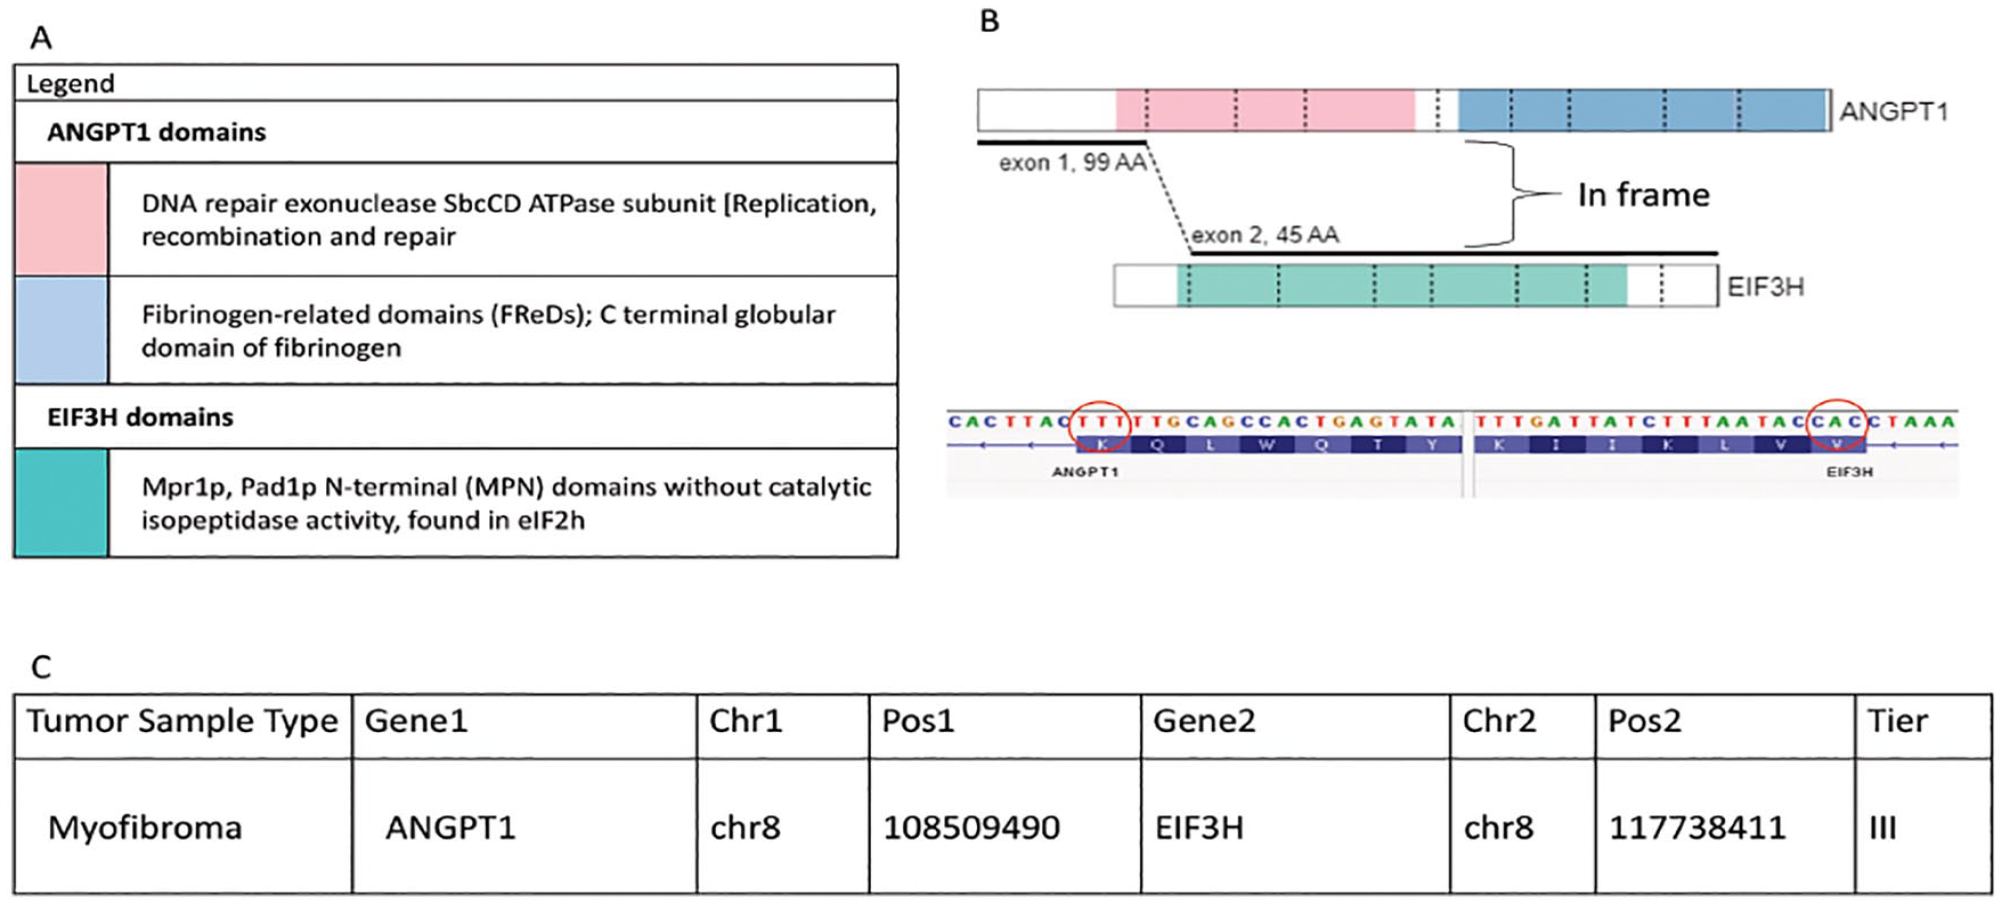
The ANGPT1::EIF3H fusion in a myofibroma was identified as a tier III fusion (fusion of unknown clinical significance) during this study. (A) Depicts a colour coded legend that identifies the different domains present within each gene and the chromosomal fusion. (B) Shows a visual representation of the fusion between the ANGPT1::EIF3H genes indicating where the chromosomal breaks occur and then are rejoined together (generated from St. Jude Pecan). The sequence found just below identifies the nucleotide sequence involved at the breakpoint of fusion and confirms that the fusion is in-frame (generated on IGV). (C) Is a tabular representation of data that depicts the type of tumor the fusion, the genes involved in the fusion, the chromosomal location of breaks identified and analyzed by the next - generation software Trusight and MetaFusion, and the tier classification.
In EQA samples, given that the tumor type was unascertainable, the highest tier a fusion could be given was II (see Tables 1 and 2 for criteria). A total of 28 fusions were identified within 7 EQA samples. Six of the 7 EQA samples harbored multiple fusions. Of the 28 fusions, 21 were classified as tier II (75%) and 7 were classified as tier III (25%).
Two examples of fusion gene pathogenesis were found that are worthy of note, and both were classified as tier II (potential clinical significance). Firstly, 1 fusion was found to be out-of-frame but still of potential clinical significance. The fusion comprised an out-of-frame SMARCB1::IGF1R fusion in a sarcoma NOS (Figure 5). By CGH array analysis, it was shown that the second copy of SMARCB1 was lost (results not shown), and loss of protein expression was confirmed using immunohistochemistry (Figure 5). Secondly, 1 fusion was found to comprise an oncogene fused adjacent to a strong 5′ UTR promoter, BOC::PLAG1, in a mesenchymal tumor NOS (so called “promoter swapping”). This fusion joined the 5′ UTR in exon 1 of the BOC gene, which was then fused to the 5′ UTR and into the entire exon 3 of the PLAG1 oncogene (Figure 6). Given the potential clinical significance of overexpression of PLAG1, this was classified as tier II.
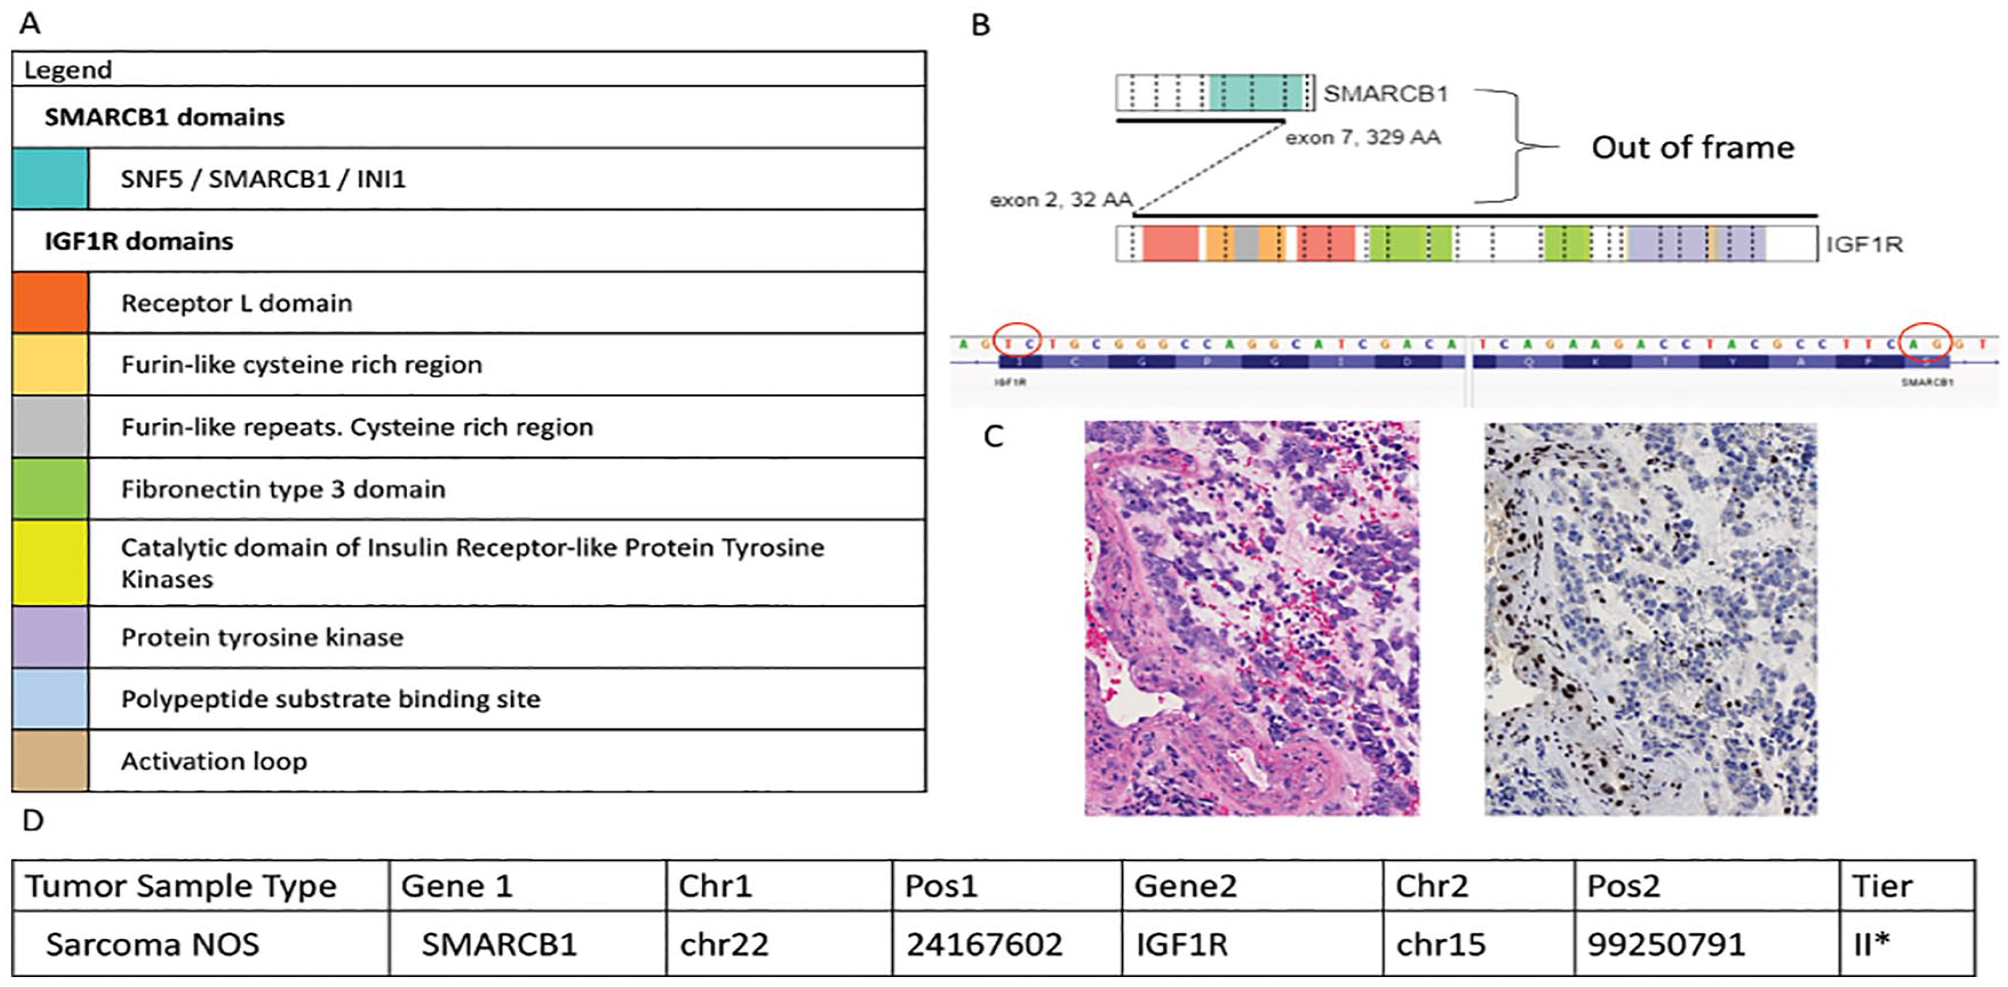
The SMARCB1::IGF1R fusion in a sarcoma NOS was identified as a tier II fusion (fusion of potential clinical significance) during this study. (A) Depicts a colour coded legend identifying the different domains present within each gene and the chromosomal fusion. (B) Shows a visual representation of the fusion between the SMARCB1::IGF1R genes indicating where the chromosomal breaks occur and then are rejoined together (generated from St. Jude Pecan). The sequence found just below identifies the nucleotide sequence involved at the breakpoint of fusion and confirms that the fusion is out-of-frame (generated on IGV). (C) Is an H&E image of the tumor (left) shows undifferentiated primitive cells (original magnification ×200). Immunohistochemical staining for the SMARCB1 protein shows loss of expression in tumor cell nuclei (clone BAF47, Cell Marque, original magnification ×200). (D) is a tabular representation of data that depicts the type of tumor the fusion, the genes involved in the fusion, the chromosomal location of breaks identified and analyzed by the next-generation software Trusight and MetaFusion, and the tier classification.
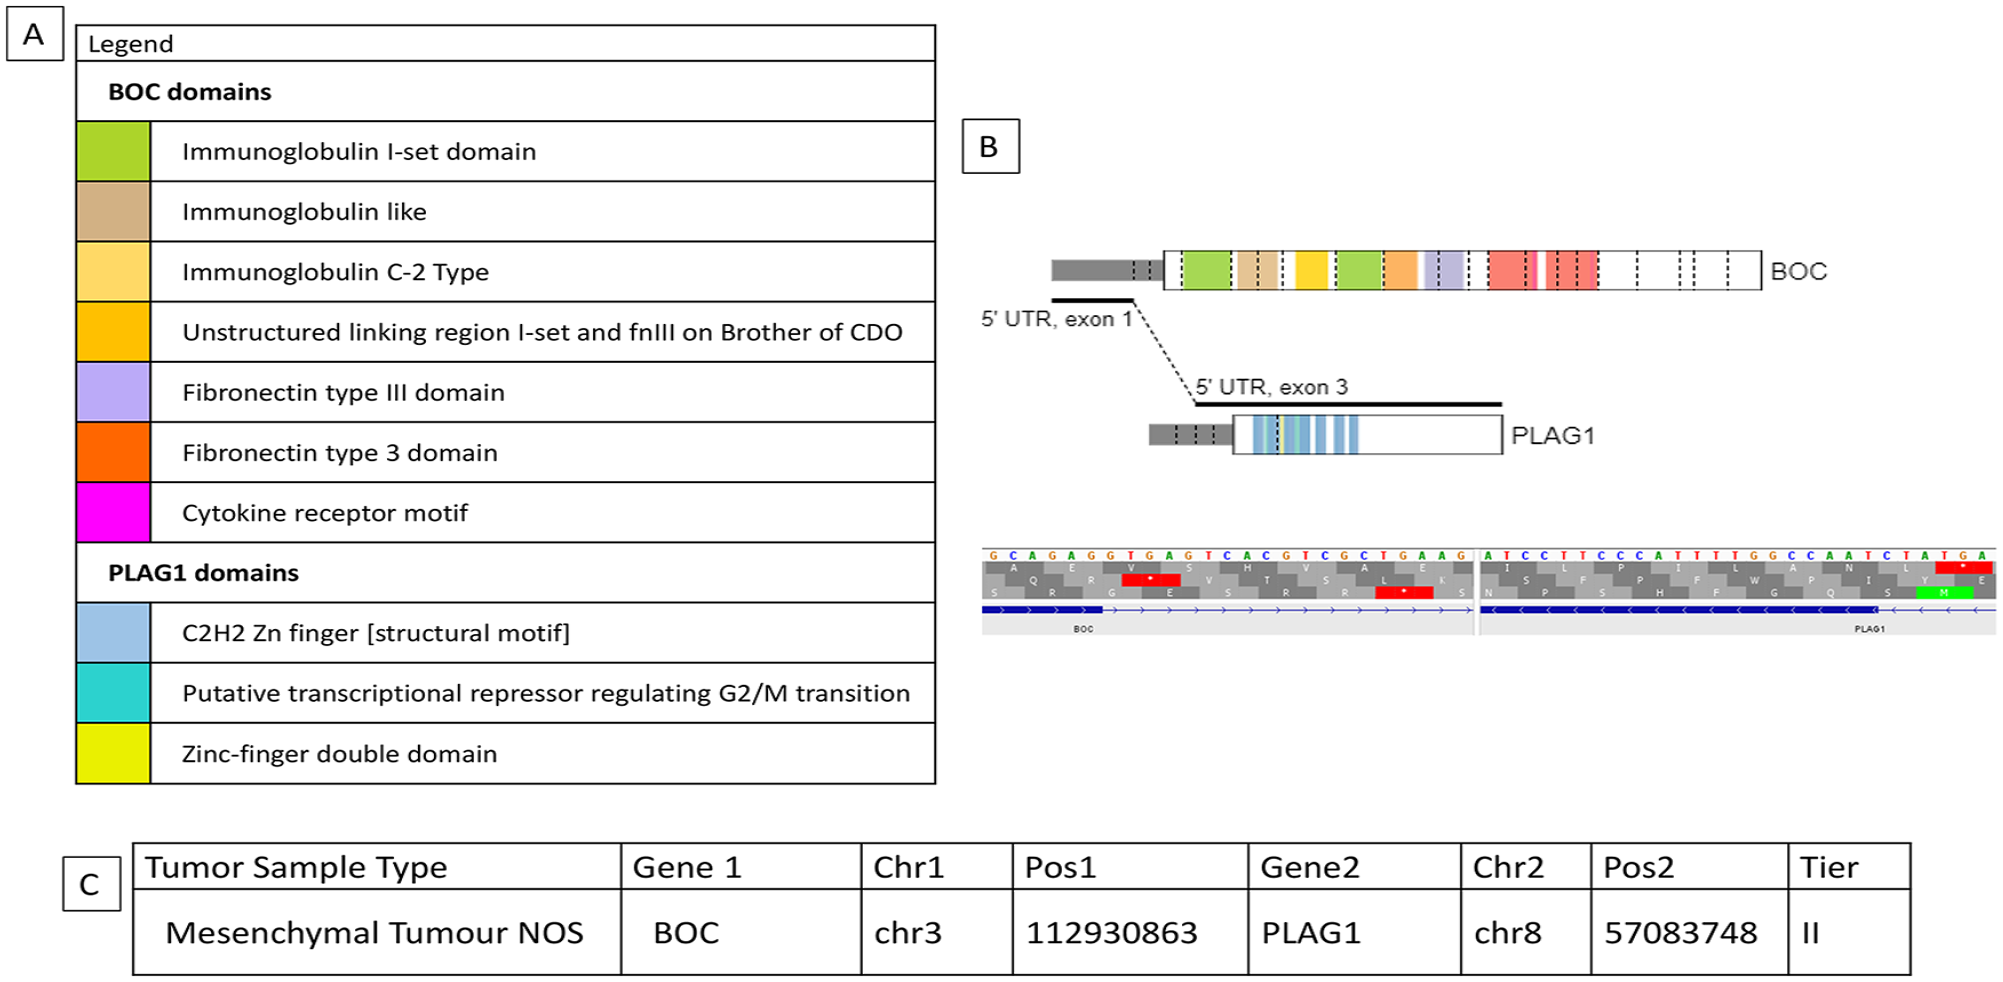
The BOC::PLAG1 fusion in a mesenchymal tumor NOS was identified as a tier II fusion (fusion of potential clinical significance) during this study. (A) Depicts a colour coded legend identifying the different domains present within each gene and the chromosomal fusion. (B) Shows a visual representation of the fusion between the BOC::PLAG1 genes indicating where the chromosomal breaks occur and then are rejoined together (generated from St. Jude Pecan). (C) Is a tabular representation of data that depicts the type of tumor the fusion, the genes involved in the fusion, the chromosomal location of breaks identified and analyzed by the next-generation software Trusight and MetaFusion, and the tier classification.
Discussion
By applying sensitive fusion detection software to a series of 85 PSTBTs and EQA samples, a total of 145 fusions were found. Both Ewing sarcoma and rhabdomyosarcoma had the highest percentage of tumors with multiple fusions (55 and 40%, respectively); however, the number of tumors in this series was small and were selected using convenience sampling, so this should be interpreted with caution. Of the 145 fusions identified, 28% of fusions were tier I, 24%, were tier II and 48% were tier III. Of the 85 samples, 55 (65%) had a single fusion and 30 (35%) had more than 1 fusion.
The performance of the Metafusion software has been described in a previous study (under review). A subset of 32 samples from this study underwent both Metafusion and standard bioinformatics analysis in the previous study, allowing a limited comparison. Within the 32 samples, 33 fusions were detected by the standard bioinformatics pipeline; 26 were either tier 1 or 2. By applying Metafusion, 44 fusions were detected, and none were missed, when compared to the standard bioinformatics pipeline. Of the additional 11 fusions detected by Metafusion, 3 were tier 1 or 2 and 8 were tier 3 fusions.
An example of a tier I classification using this model was an in-frame EWSR1::FLI1 present in Ewing sarcoma. This fusion is tier I as it has many large studies and functional studies showing a direct link to Ewing sarcoma pathogenesis.19,20 Tier II fusions are fusions of potential clinical significance, and an example is an in-frame FN1::EGF fusion in a calcifying aponeurotic fibroma (CAF). This fusion has been seen to be recurrent in CAF in small studies. 13 The FN1::EGF fusion has only been observed in CAF and not in other types of neoplasms and small studies indicate it is the main driver mutation in CAF. 21 However, further functional studies need to be conducted to determine the mechanism of cancer onset in CAF tumors 21 and therefore it cannot yet be classified as a tier I fusion (see Figure 3). Other unusual and rare fusions classified as tier II included FUS::FLI1 in Ewing sarcoma and SS18::VGLL3 in schwannoma. In the former, this fusion has been reported in AML but not in Ewing sarcoma or other sarcomas. 22 While FUS is known to be interchangeable with EWSR1, by applying the classification criteria set out in our paper, this would be regarded as a tier II. On searching the literature, the SS18::VGLL3 fusion has not been reported in any tumor; however, a certain subset of hybrid schwannomas are well known to harbor VGLL3 fusions. 23 Further, the tumor was also classified as schwannoma by methylation analysis (results not shown).
The largest number of fusions were categorized as tier III (of unknown clinical significance). Fusions were classified as tier III if none of the criteria for either a tier I or a tier II fusion were met. An example of a tier III fusion that was classified using this model was an in-frame ANGPT1::EIG3H fusion. This fusion has not been reported in the literature and neither was reported in any databases at the time of writing as a known tier I cancer-causing gene using the SNV classification scheme. 17 As a result of the lack of information surrounding this fusion, it was classified under the tier III category (see Figure 4).
EQA samples were run to test the ability of the classification system to classify a variety of fusions. The classification scheme developed in this study is heavily context dependent on the type of tumor analyzed. Given the nature of the EQA samples as of unknown origin, the highest tier classification that could be rendered was that of a tier II. EQA material contained multiple tier II fusions in the same sample; this contrasts with the tumor samples and is likely a reflection of the complex nature of the in vitro cell pellets comprising the EQA material. 24 Cell lines investigated in other studies detected fusions in multiple types of cancers including soft tissue. 24 They found multiple fusions within each cell line (median of 6 with 26% in frame) and 14% had at least 1 gene reported in COSMIC. 24 Further, the relative homogeneity of the cell lines 25 may lead to increased sensitivity in detecting multiple fusions, as opposed to the heterogeneous nature of tumor samples, 26 where fusions expressed in subpopulations at lower levels might not be detected.
The mechanisms of fusion formation include chromosomal translocations, insertions, deletions, tandem duplications, inversions, chromothripsis, chromoplexy, and aberrant splicing.7,20 One study has shown that in Ewing sarcoma, a burst of loop-like rearrangements (chromoplexy) is likely to be the main mechanism of fusion formation, rather than reciprocal translocations. 16 However, although these loop-like rearrangements form the driving fusion, there are additional gene disruptions generated in this process causing additional fusions to occur that are not pathogenic, but rather incidental findings.16,24 Interestingly, the tumor with the highest percentage of multiple fusions was Ewing sarcoma. Chromothripsis, like chromoplexy, is a large genomic rearrangement which can contribute to the formation of fusions. 27 As a result of chromothripsis being such a large event, it gives rise to multiple rearrangements including that of an oncogene fusion as well as other disruptions that are not known to be pathogenic. 27 Both chromoplexy and chromothripsis provide mechanisms by which multiple fusions are formed, with the driver fusion being pathogenic and others of uncertain significance.16,20,27 Indeed, almost all tumor samples harboring multiple gene fusions had only a single tier I or tier II fusion (and multiple tier III fusions), consistent with this model. However, there was a single tumor sample from a glomus tumor that had both a tier I and a tier II fusion gene. This phenomenon has been reported in hematopoietic and epithelial malignancies and is thought to contribute to treatment resistance and disease progression.9,10,11,15,24 While this is an intriguing possibility, the current study is constrained by limited clinical data. Further work on this cohort is continuing to determine the potential clinical and prognostic significance of multiple fusions in PSTBTs.
In addition to the tumor harboring 2 possible driver fusion genes, 2 other unusual examples were discovered in the cohort. The first was an out-of-frame SMARCB1::IGF1R fusion gene resulting in inactivation of SMARCB1. SMARCB1 is a known tier I cancer-causing gene and acts as a tumor suppressor in several malignancies,28-30 and it was classified as a tier II fusion. This rearrangement demonstrates how an out-of-frame fusion can still be clinically relevant and contribute to tumorigenesis. However, it is noted that the vast majority of clinically relevant fusions were in-frame. Furthermore, confirmation of lack of protein expression of the SMARCB1 gene product using immunohistochemistry added important functional information and should be considered as an additional tool in problematic cases. The second example includes a fusion containing a strong BOC promoter to PLAG1 in a mesenchymal tumor of uncertain histogenesis. The same fusion has been reported in pediatric lipoblastomas in which PLAG1 was overexpressed, presumably thought the action of the BOC promoter,31,32 as well as in pleomorphic adenoma of the salivary gland. 33
The current study found that just over one third of PSTBTs harbored more than 1 fusion gene. By application of modified classification criteria, all fusions were classified into 1 of 3 categories, and it was shown that, rarely, tumors may harbor more than 1 potential driver mutation. This has both therapeutic and prognostic relevance and shows the value of applying powerful sequencing assays and appropriate classification systems to promote diagnostic accuracy and optimal therapy for PSTBTs.
Supplemental Material
sj-docx-1-pdp-10.1177_10935266231199928 – Supplemental material for The Incidence of Multiple Fusions in a Series of Pediatric Soft Tissue and Bone Tumors
Supplemental material, sj-docx-1-pdp-10.1177_10935266231199928 for The Incidence of Multiple Fusions in a Series of Pediatric Soft Tissue and Bone Tumors by Anastasia MacKeracher, Anthony Arnoldo, Robert Siddaway, Lea F. Surrey and Gino R. Somers in Pediatric and Developmental Pathology
Footnotes
Declaration of Conflicting Interests
The authors declared no potential conflicts of interest with respect to the research, authorship, and/or publication of this article.
Funding
The authors disclosed receipt of the following financial support for the research, authorship, and/or publication of this article: Anastasia MacKeracher was funded by the Dr. Daria Haust Studentship at the Hospital for Sick Children.
Supplemental Material
Supplemental material for this article is available online.
References
Supplementary Material
Please find the following supplemental material available below.
For Open Access articles published under a Creative Commons License, all supplemental material carries the same license as the article it is associated with.
For non-Open Access articles published, all supplemental material carries a non-exclusive license, and permission requests for re-use of supplemental material or any part of supplemental material shall be sent directly to the copyright owner as specified in the copyright notice associated with the article.