
Abstract
Climate change effects are evident across the National Park System, and units are encouraged to provide proactive, meaningful interpretation on the issue to cultivate informed partners and encourage collaborative stewardship. But climate change is not currently interpreted across all units of the National Park System. Anecdotal observations suggest some units highly prioritize the topic, while others do not. Thus, we conducted an assessment of current online climate change interpretation across the National Park System as one means of quantifying park engagement.
Results suggest that—of the 391 units included in the analysis—37% interpreted climate change in some manner online as of February, 2019. Though our method of analysis does not fully describe park interpretive efforts, our findings provide a baseline measure of online interpretation and help to prioritize future training and support. Furthermore, our work provides a minimally intensive approach for future assessment of online climate change interpretation.
Keywords
Introduction
The U.S. National Park System includes a diverse array of federal land holdings that protect and showcase outstanding natural, cultural, and historic resources of national significance (National Park Service, 2019b). National Park System units span nearly 20 distinct naming designations—including national parks, monuments, preserves, recreation areas, historic sites, battlefields, memorials, national rivers, and national trails—and are administered across several geographically distinct administrative regions of the National Park Service (NPS). Regardless of designation, all units have a park website that provides visitor information, interpretive content, and relevant information on NPS priorities and programs. With over 350 million unique pageviews across NPS.gov in 2019 (D. Restivo, personal communication, April 1, 2021), park websites are an efficient means of communicating important topics to potential visitors and the general public.
Human-caused climate change is a significant global concern that poses difficult management challenges for federal public lands (Joyce et al., 2009). Traditionally, management goals for units of the National Park System are derived from known past conditions (Baron et al., 2009). However, an overwhelming majority of parks are already at the extreme warm end of their historical conditions (Monahan & Fisichelli, 2014), and the present trajectory of our shifting climate virtually assures many parks will move beyond historic ranges of variability. This move toward novel conditions will likely render existing management targets, or desired conditions, increasingly unattainable.
National Park System units already face challenges from climate change (Gonzalez, 2011). Many parks now experience effects including the earlier onset of spring (Monahan et al., 2016), potential lengthening of visitor seasons (Albano et al., 2013) and the loss of snow pack and glacier ice (Gonzalez, 2017). Many coastal parks face significant challenges due to effects from relative sea level rise and storm surge (Caffrey et al., 2018). And due to large holdings in Alaska and the American West, the System is experiencing a more rapid rate of warming than the United States as a whole (Gonzalez et al., 2018).
The NPS (2010) Climate Change Response Strategy provides a broad framework for addressing climate change in the context of management. The plan sets forth goals and objectives regarding investments in science, mitigation of greenhouse gases, and adaptation to changing conditions. In addition, the plan calls for robust communication efforts with all NPS stakeholder groups in order to facilitate productive dialogue on the issue. This includes interpretation to park visitors as well as outreach to NPS personnel and external NPS audiences (National Park Service, 2010). The National Park Service (2016) National Climate Change Interpretation and Education Strategy provides further encouragement and a framework for engaging audiences on the topic.
Problem Statement
Research suggests that American audiences are becoming more concerned about climate change (Leiserowitz et al., 2018), and park visitors are particularly interested in—and open to—discussion about the topic (Davis et al., 2013). Per the Centennial Act of 2016, the NPS is directed to use audience analysis to inform the development and delivery of interpretation efforts, defined by Balasubramanyam et al. (2019) as informal communication processes designed to translate scientific information to visitors for educational purposes. The Centennial Act directs that these offerings be learner-centered, inclusive, and grounded in current scientific content (54 USC § 1008).
Within the context of the National Park System, every park unit has an important climate change story. For example, historic sites such as the Homestead National Historical Park recently implemented electric vehicle charging stations to lower their carbon footprint (National Park Service, 2021), while Golden Gate National Recreation Area fully shifted to carbon-neutral park operations in 2019 (National Park Service, 2019c). The NPS encourages all units to share those stories using outlets such as their park web pages (National Park Service, 2010). Doing so can proactively cultivate an informed constituency necessary for successful collaborative stewardship in the face of climate-related challenges (National Park Service, 2016). Loomis (2013) identified innovative communications and programing about climate change by numerous units of the National Park System. However, many aspects of National Park System administration—including interpretation and education—are highly decentralized, providing units significant latitude to interpret topics of greatest perceived importance. Consequently, climate change communication efforts vary widely and are not uniform across the NPS.
Throughout all units of the NPS, the overarching and omnipresent influence of climate change is apparent, though it manifests differently and to varying degrees. The NPS has an opportunity to provide information at a local level that can help visitors and communities understand and address climate change. Yet currently there exists no servicewide accounting of climate change interpretation across the National Park System. Furthermore, the new direction of interpretation across the NPS places an emphasis on evidence-based scientific information that can help to invoke a sense of stewardship regarding the issue in question, making climate change a timely theme for park interpretation (National Park Service, 2018). Here we present methods and results from a high-level assessment of current online climate change interpretation across the NPS website. The results of this work provide a useful baseline for tracking servicewide progress over time. Additionally, the results serve as a guide for future investments in park-level training and support necessary to encourage climate change interpretation across all units of the National Park System.
Methods
Scope
NPS units employ an array of both personal and non-personal interpretive methods, including printed material, audiovisual displays, wayside exhibits, visitor centers, social media, and ranger-led tours. However, interpretive offerings are not uniform across park units. Because interpretive facilities, capacity, and efforts vary greatly between parks, conducting a comprehensive, servicewide assessment of climate change interpretation would require robust sampling inquiries across all units of the National Park System.
The study team opted to carry out a census of online interpretation by analyzing content across all individual park websites. The tremendous increase of online information in recent years provides opportunities to use content analysis as an alternative to traditional methods of data collection, such as in-person surveys and interviews (Kim and Kuljis, 2010). Focusing on website content to characterize servicewide climate change interpretation provides several advantages beyond sampling. Nearly every unit of the National Park System maintains a site-specific website, providing the opportunity for an equitable and near-servicewide analysis. Furthermore, because authorship and management of content is highly decentralized, content hosted on unit-specific websites typically reflects priority interpretive themes and messages as determined by park staff, subject to their understanding, abilities, and support by their leadership. Finally, because they provide virtually limitless space to host content, unit-level websites have the potential to showcase all interpretive efforts, themes, and messages deemed relevant by park staff, not just those of highest priority.
Using methods adapted from Hinduja and Patchin (2008), the study team sought to answer three basic questions regarding online climate change interpretation across the National Park System:
What proportion of parks currently interpret climate change topics on their websites?
What trends are evident in online climate change interpretation among National Park Service administrative regions?
What trends are evident in online climate change interpretation across unit designations?
An initial list of all 419 units of the National Park System extant at the time of analysis was first identified (National Park Service, 2019a). This preliminary list was reduced in accordance with the following categorization rules:
Where differently designated units are currently administered as one with a unified web presence, those units were combined accordingly (i.e., Sequoia & Kings Canyon National Parks).
Where the current web presence for a designated unit exists wholly under the web site of a parent administrative park, the former was consolidated under the latter (i.e., Fort Caroline National Memorial was consolidated under Timucuan Ecological and Historic Preserve).
Where differently designated units are spatially adjacent and administered as a single unit, those units were consolidated as a single entity (i.e., Lake Clark National Park and Lake Clark National Preserve were consolidated into Lake Clark National Park and Preserve).
Given both their proximity and unified administration, 12 differently designated units of the National Mall were consolidated as the National Mall and Memorial Parks.
Where units are not directly under the ownership of the NPS and have no NPS.gov website, those units were removed from the analysis (i.e., Hohokam Pima National Monument).
Applying these rules resulted in a final list of 391 park units—and corresponding websites—for analysis.
Inclusion Criteria
Prior to analysis, the study team agreed upon important inclusion criteria. Our goal was to separate interpretive material (text-based content meant to provide climate change information to a non-expert audience) from specialized content (information that was related to climate change but did not have an interpretive focus).
First, we characterized climate change content as “interpretive” if it was:
written for general audiences and
comprised of substantial content on climate change or adjacent concepts (i.e., we excluded mentions within site indices without accompanying interpretive information, lists that mention climate change, and links to other pages).
Second, we characterized climate change content as “specialized” if it was:
written for non-general (or specialized) audiences and
included as an element of larger scientific, planning, or management documents.
Finally, climate change is a complex and multifaceted issue which can be interpreted in terms of history, causes, implications, and responses. The issue is commonly addressed in media through adjacent concepts, often without specific use of the words “climate change” (Whitmarsh, 2008). As such, the team identified six common adjacent concepts for use in the analysis as described below:
Carbon Emission
Carbon Footprint
Carbon Sequestration
Global Warming
Greenhouse Gas
Sea Level Rise
Analysis
In February, 2019 the study team reviewed website content across all 391 units to document the presence and nature of climate change content available. Analysis was limited to text results, including video or other multimedia hits with accompanying text related to climate change interpretation. Depending on content encountered during analysis, each park website was then sorted into one of the following four categories:
Category 1: Climate Change Interpretation Page
All park websites are authored through a servicewide content management system, and content is organized under a standardized page taxonomy. Though park authors are obligated to populate a small number of mandatory pages, they are free to populate and publish additional pages in the standard taxonomy as they see fit or create additions to the taxonomy for custom content.
Since 2013, two locations for climate change pages have been available to authors as a non-mandatory standard element in the NPS.gov taxonomy (T. Edgar, personal communication, May 21, 2019). If either of these elective pages—or a similarly dedicated climate change page encountered elsewhere in the taxonomy—was activated and populated with interpretive content, as defined above, the park was placed in Category 1.
Category 2: Interpretive Climate Change Information
For parks where no dedicated climate change page was located, the study team used the site search function to determine whether interpretive climate change content existed elsewhere on the site. The study team separately searched for the term “climate change” and all six climate change-adjacent terms. If interpretive climate change content was found, the park was placed in Category 2.
Category 3: Specialized Climate Change Information
For parks where the site search function returned results that did not fall within the definition of interpretive content but captured other pages that contained specialized information (defined above), the park was placed in Category 3.
Category 4: No Climate Change Information
In instances where review of a park website resulted in no finding of relevant climate change content, the park was placed in Category 4.
At the time of this analysis, units of the National Park System were organized across seven NPS administrative regions, specifically the Alaska Region (AKR), Pacific West Region (PWR), Intermountain Region (IMR), Midwest Region (MWR), Northeast Region (NER), Southeast Region (SER), and National Capital Region (NCR). Website categorization results were sorted across the seven NPS regions to identify any apparent spatial trends. Categorization results were also sorted across National Park System designation types to identify any associations. To examine possible confounding between region and designation types, a chi-square test of independence was conducted using SPSS Statistics 25 software to assess the distribution of unit types across the regions. Unit types with less than five occurrences in a given region were removed from the chi-square analysis.
Results
RQ1: What Number of Parks Currently Interpret Climate Change Topics on Their Websites?
Of the 391 units included in the analysis, 45 units (11%) were classified as Category 1 by having a web page dedicated to interpreting the topic of climate change, an example of which can be seen in Figure 1.
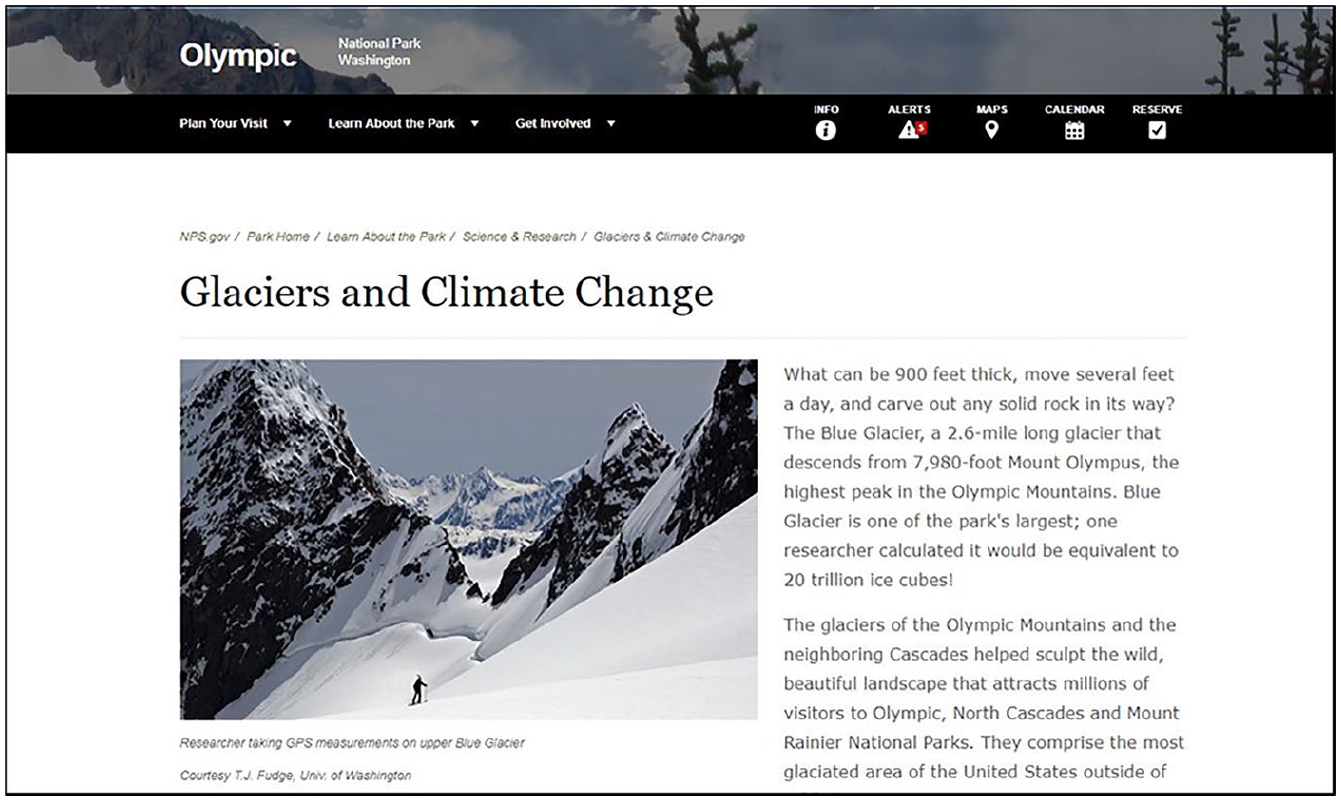
Example of a Category 1 dedicated climate change webpage from the Olympic National Park website.
An additional 101 units (26%) occurred under Category 2 because they interpreted climate change in a manner (e.g., Figure 2) that a site visitor could easily find using the webpage’s search bar function and entering “climate change” or a related keyword. Combined, Categories 1 and 2 included 146 park units (37%) that currently interpret climate change on their website.
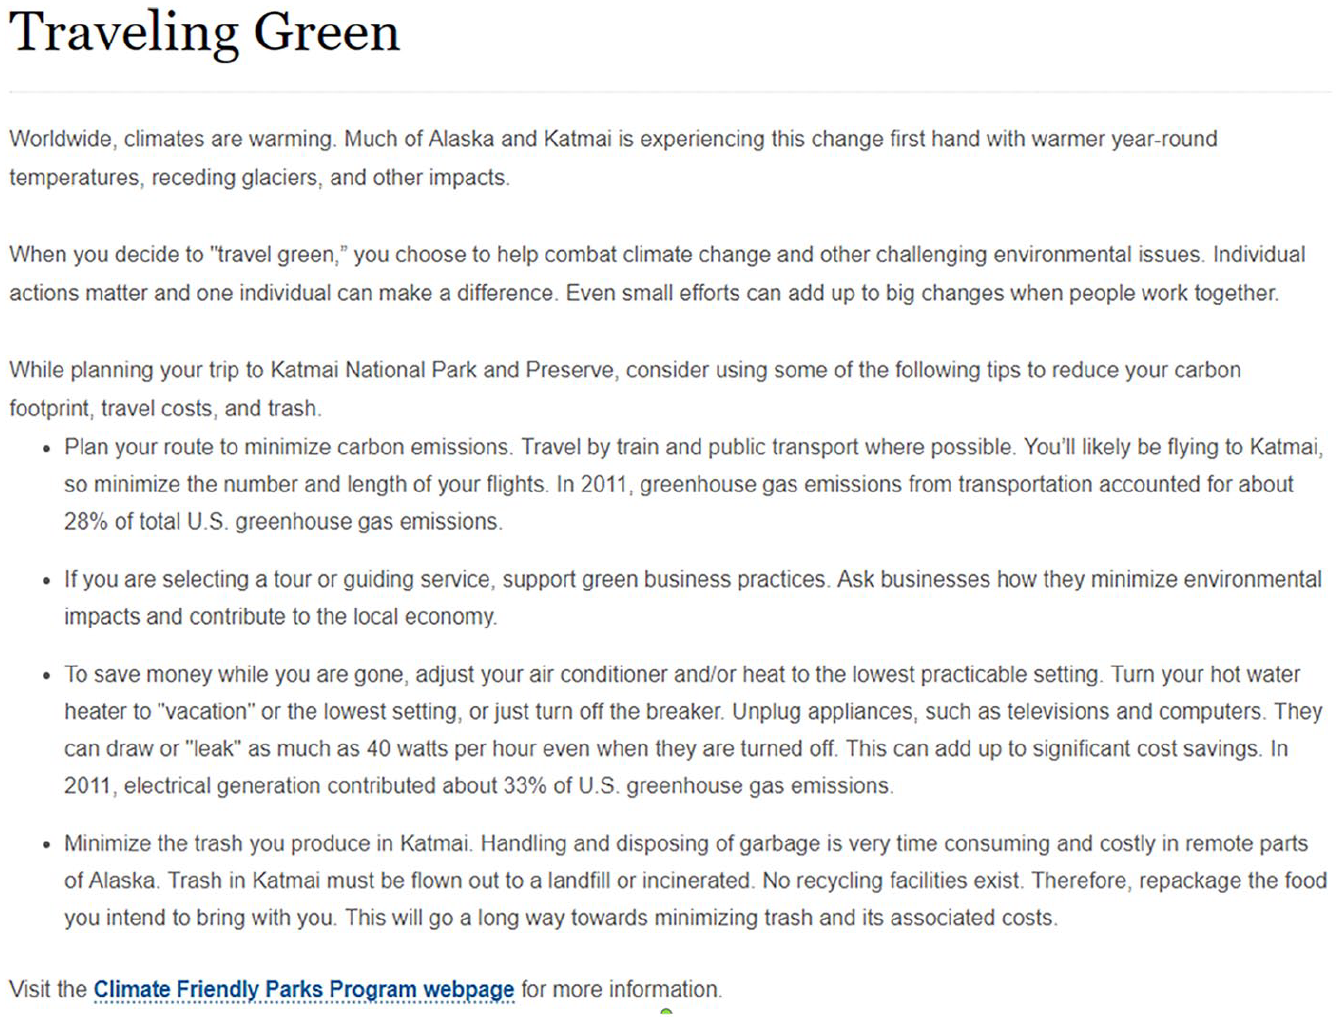
Example of a Category 2 climate change interpretative page from the Katmai National Park & Preserve website.
A total of 24 park units (6%) fell within Category 3, hosting specialized climate change information that is not translated into interpretive information for website visitors (e.g., Figure 3).
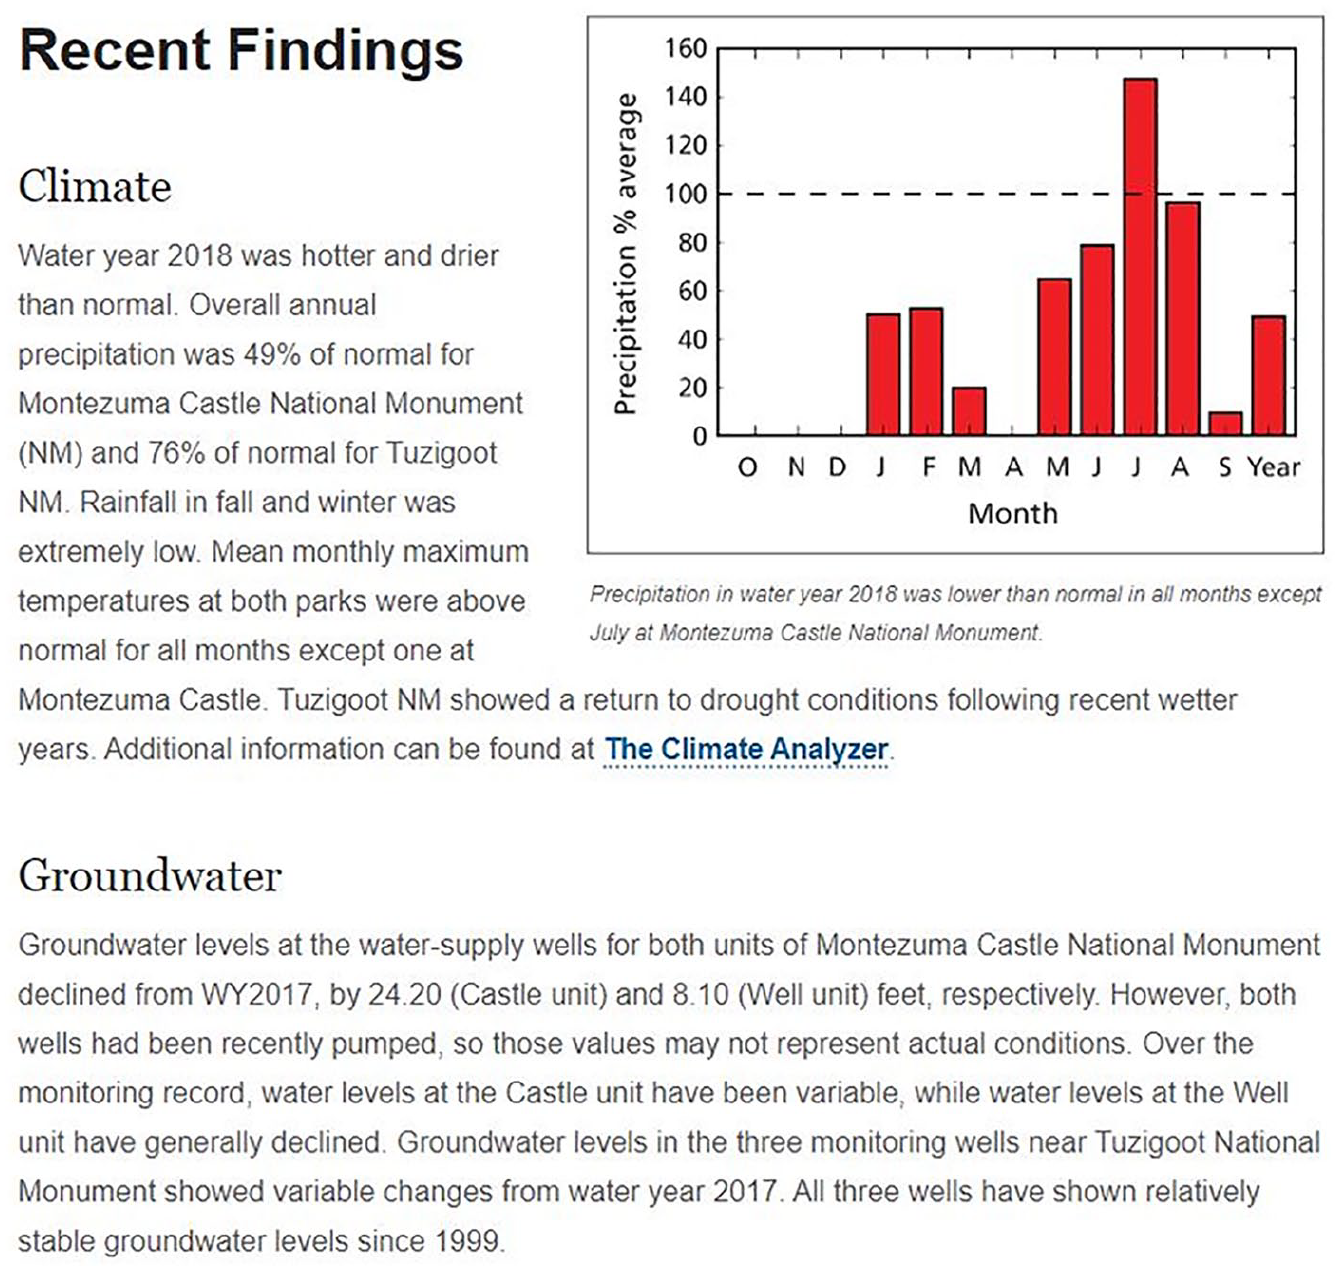
Example of a Category 3 specialized climate change reference from the Montezuma Castle National Monument website.
Two-hundred and twenty-one units (57%) were in Category 4, having no discoverable climate change information on their webpages. Please see Figure 4 for a visual distribution of all the park units’ climate change interpretive efforts.
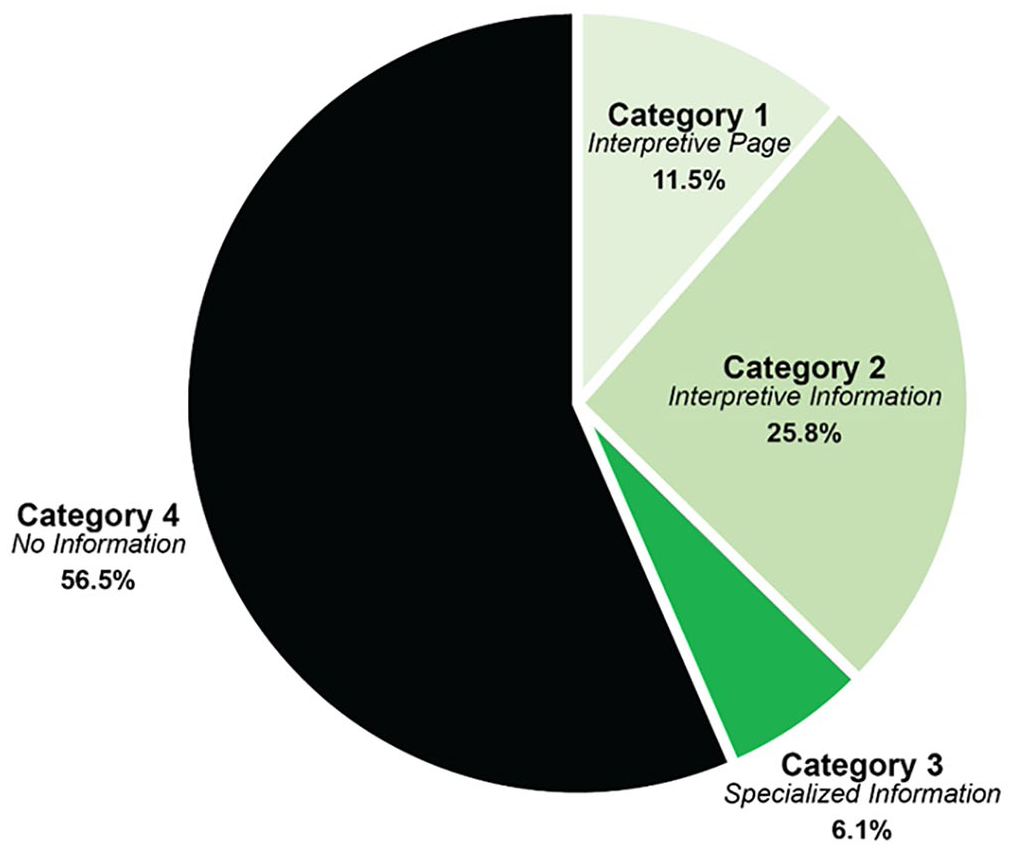
Distribution of parks currently interpreting climate change topics on their websites by assessment category.
RQ2: What Trends are Evident in Online Climate Change Interpretation Among National Park Service Administrative Regions?
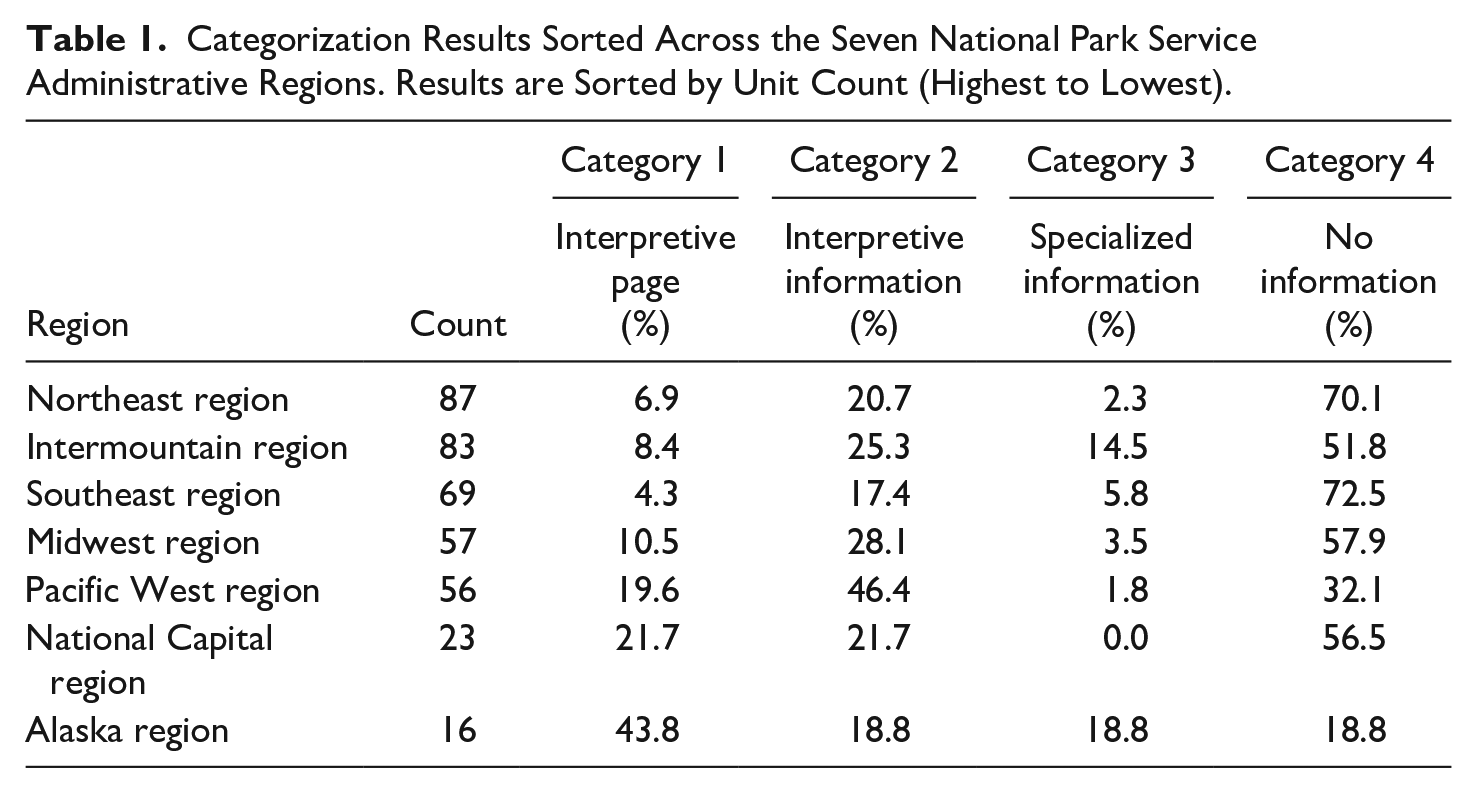
Categorization results were sorted across the seven NPS administrative regions (Table 1) to identify spatial patterns. Nearly half of the units in the Alaska region shared climate change-focused webpages, followed by the National Capital region (5 units, 22%) and the Pacific West region (11 units, 20%). The Alaska region also had the highest percent of units that housed specialized climate change information (3 units, 19%) and the lowest percent of units that did not contain any climate change information (3 units, 19%). In contrast, the Southeast region contained the lowest percent of units with climate-changed focused webpages (3 units, 4%) and the highest percent of units that did not share any type of information related to climate change (50 units, 72%).
Categorization Results Sorted Across the Seven National Park Service Administrative Regions. Results are Sorted by Unit Count (Highest to Lowest).
RQ3: What Trends are Evident in Online Climate Change Interpretation Across Unit Designations?
Categorization results were also sorted across 21 National Park System designation types. To simplify the reporting of results, similar designation types were grouped together. The result was a condensed list of 14 designation types (Table 2).
Categorization Results for a Condensed List of 14 National Park System Unit Designation Types. Condensed Groups are Listed in All Caps, With Included Unit Designation Types Listed Beneath. Results are Sorted by Unit Count (Highest to Lowest).
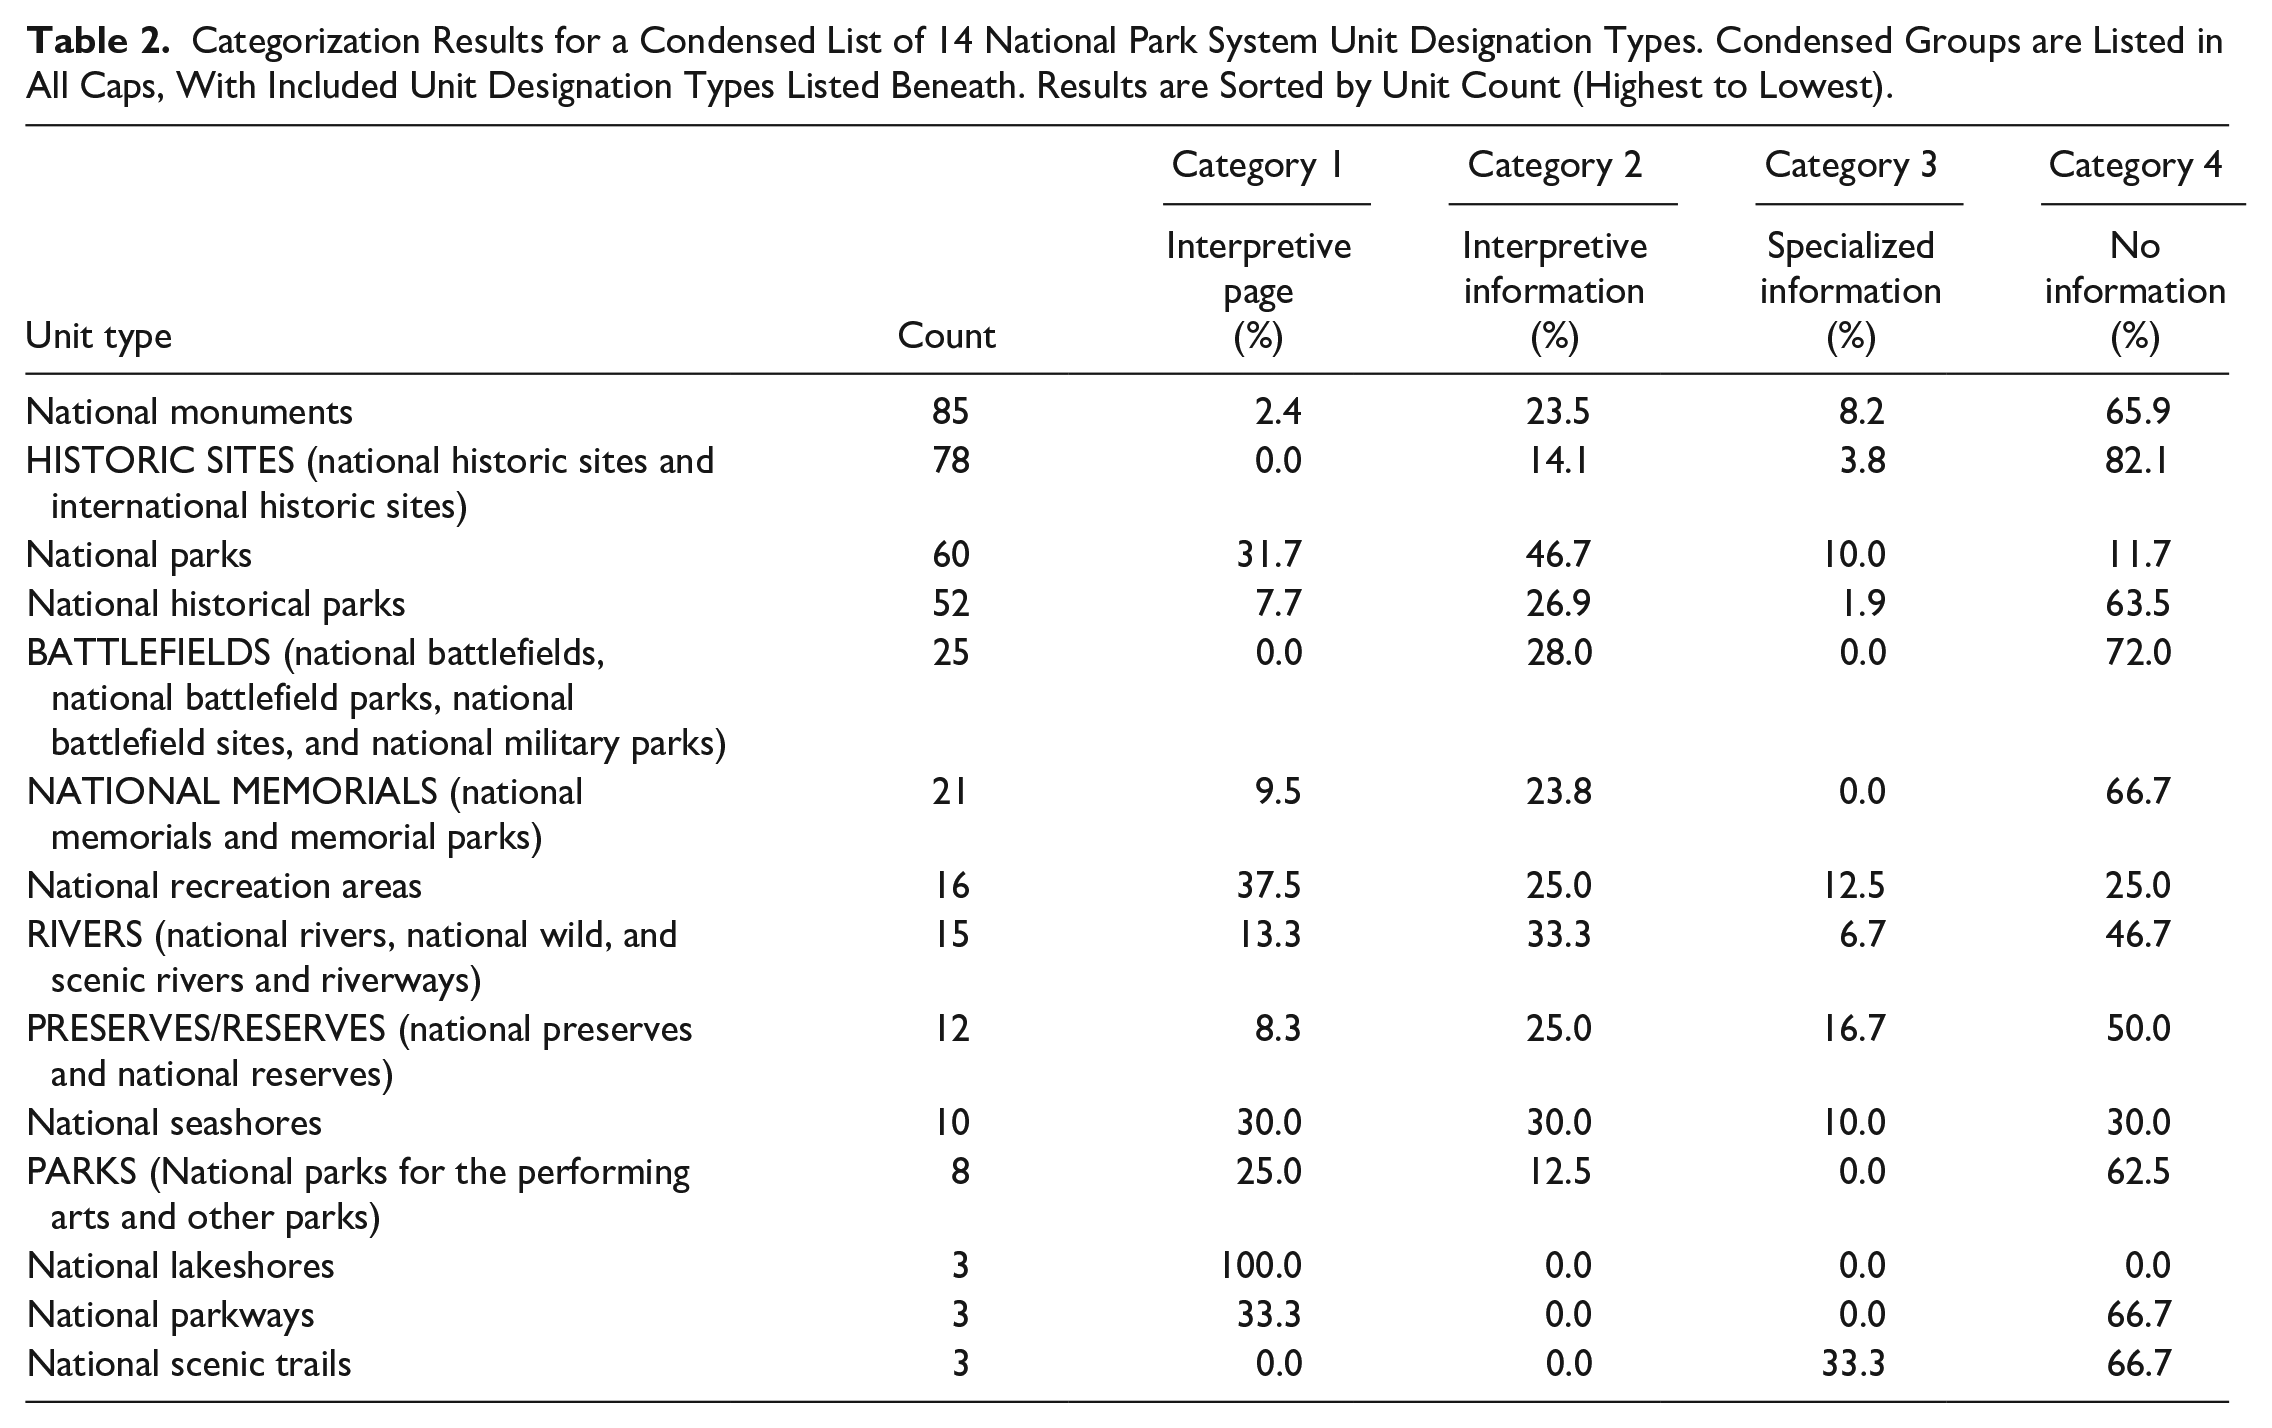
Of the unit designation types that had at least 10 units analyzed, national recreation areas had the highest percent of Category 1 designations (6 units, 37.5%), followed by national parks (19 units, 31.7%) and national seashores (3 units, 30%). National parks had the highest percent of Category 2 pages (28 units, 47%), followed by the RIVERS category (5 units, 33%) and national seashores (3 units, 30%). The highest percent of units falling into Category 4 included the HISTORIC SITES category (64 units, 82%), the BATTLEFIELDS category (18 units, 72%), and the NATIONAL MEMORIALS category (14 units, 67%). The HISTORIC SITES and BATTLEFIELDS categories also did not have any units in Category 1.
Chi Square Test of Independence
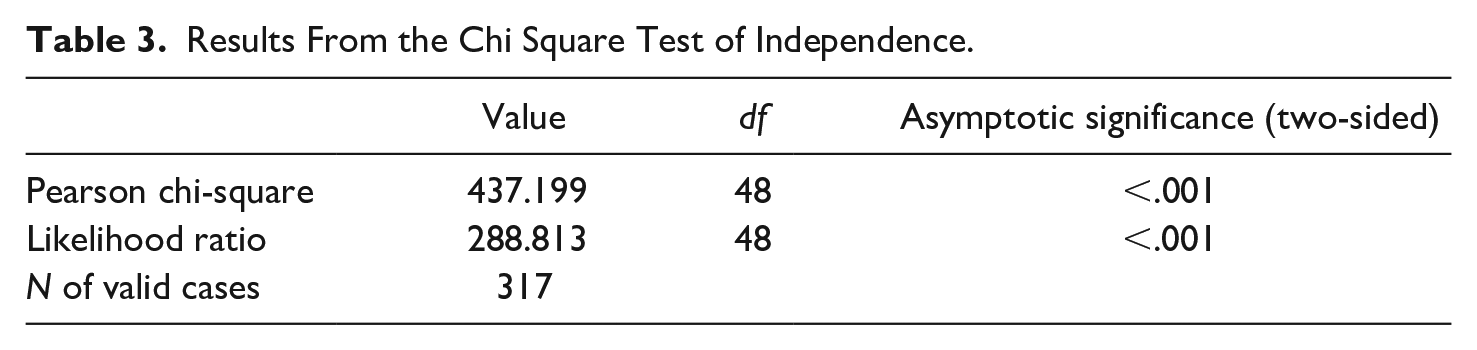
The chi square test (Table 3) revealed that the presence of different unit types differed significantly across the NPS regions, χ2 (48, N = 317) = 437.2, p < .01. In particular, the most overrepresented unit/region were national monuments in the Intermountain region (residual value = 13.9), while the BATTLEFIELDS category was most overrepresented in the Southeast region (residual value = 10.7). NATIONAL PARKS were least common in the Northeast region (residual value of −13.4) and HISTORIC SITES were least common in the Intermountain region (residual value = −9.9).
Results From the Chi Square Test of Independence.
Limitations
Several caveats should be considered when interpreting the results from this study. First, the servicewide website content analysis was undertaken primarily during the spring and summer of 2019, constituting a point-in-time assessment that may not accurately reflect web content at the time of this publication. Additionally, parks communicate information through a variety of personal and nonpersonal outlets, webpages constituting just one of these channels. It is impossible to infer the total extent of climate change interpretation, or even electronic communication, by analyzing web pages alone. However, we deemed web pages as an appropriate indicator for assessing park online climate change interpretation due to the overwhelming number of park units that host websites, as well as the uniform nature in which information is displayed on the NPS web pages.
This analysis only included park unit webpages and did not consider climate change information from supporting programs and offices. We did not assess climate change outreach via social media outlets. Given these caveats, the results from this study should not be taken as a full representation of NPS electronic interpretation of climate change. Rather, they are meant to provide an overview of web pages as a very specific type of communication outlet, to serve as a starting point for future assessment of the availability of climate change interpretation.
Discussion
Given the long-term and large-scale implications of climate change for natural and cultural resources, meaningful interpretation of the issue is increasingly important for many organizations like the NPS. Park visitors in particular tend to harbor a strong environmental conservation ethic (Balasubramanyam et al., 2019), making climate change a suitable and relevant interpretive theme for the NPS to address. Although climate change impacts all parks at varying scales, the communication of these impacts is not uniform across the National Park System. The study team attempted to assess the current state of online climate change interpretation in the NPS, and how these trends differ across administrative regions and unit designations. Examining the park web sites is one method of evaluating this form of communication. The decentralization of website management and interpretation programing affords parks the opportunity to interpret climate change topics as appropriate, and many already do so. However, a review of online content suggests a majority of parks as of 2019 did not address the topic in their interpretive efforts.
Several conclusions regarding climate change interpretation across the 391 park units can be drawn from the results described above. Regarding our first research question, we found that 45 units (11.5%) hosted a webpage dedicated to climate change and 146 units (37%) interpreted climate change in some manner. Although the impacts of climate change are felt across all park units, a minority of units shared climate change information with their web-based visitors. The reasons for this low rate of engagement are likely varied and many, but earlier research has shown that park and refuge interpreters generally underestimate audience interest in learning about climate change (Davis et al., 2013). A lack of national level directives related to climate change also means that parks are left to focus on local priorities and perceptions, which may or may not focus on climate change interpretation.
To answer our second research question, we found large disparities across regions interpreting climate change. In the Alaska region, 10 park units (63%) interpreted climate change, and an additional 3 units (19%) contained some type of specialized climate change information on their sites, well above the averages across all units. Reports of climate change impacts throughout the Arctic such as melting permafrost and altered hydrological processes are on the rise (Teufel & Sushama, 2019), and as such are more tangible to the parks and visitors within the Alaska region. In contrast, 50 units (72%) in the Southeast region had no climate change information on their webpages. Several studies point to differences among audience segmentation in regards to perceptions of climate change communication (Akerlof et al., 2011; De Urioste-Stone et al., 2016; Lam-González et al., 2021), which could be attributed to regional influences and beliefs surrounding the topic. The geography of a region itself may be a barrier to effective climate change interpretation. Balasubramanyam et al. (2019) describe how states in the Midwest region lack climate indicators more familiar to coastal areas, which may also apply to some Southeastern states. Despite these regional differences, Brownlee et al. (2013) found that NPS visitors became more aware of climate impacts on a park after exposure to park units and resources that were vulnerable to climate change, highlighting the importance of effective interpretation. These considerations illustrate a significant opportunity to provide online climate change interpretation that can be used to inform anyone on the topic, regardless of geographic location.
We also found differences across unit types when analyzing the interpretation of climate change. Of the unit designation types that were comprised of at least 10 units, national recreation areas, national parks, and national seashores had the highest number of units classified under Category 1. Units designated as historic sites and battlefields did not generate any Category 1 results, but some did produce a few documents that interpreted climate change under Category 2. Although it stands to reason that websites of larger park units with an ecological focus and greater staff capacity would contain more climate change content than smaller parks with a historical focus, climate change is a challenge that impacts the entire National Park System, regardless of unit size or designation. Parks with a historical and cultural focus have the unique opportunity to explore human facets of climate change across space and time, but may need more focused training and assistance in drawing connections to their particular site stories.
When considered together, unit types and region likely both influence the degree of climate change interpretation in each unit. Our chi-square analysis revealed that unit types are not spread uniformly across the National Park System. The finding that the Southeast has more BATTLEFIELDS than other regions likely also contributes to the regional findings discussed above. Similarly, regions like the Northeast that have a lower representation of national parks and other ecologically focused unit types tended to interpret climate change less (70.1% Category 4) compared to regions like Alaska, with an overrepresentation of national parks (43.8% Category 1). Thus, the types of units and their counts by region should be carefully considered when interpreting the results from this effort on a regional level.
We quantified which units interpret climate change—and in what manner—via a medium preferred by park visitors (Davis et al., 2013). Yet a disparity in staffing levels related to interpretation exists throughout the National Park System. Parks are directed to develop interpretation programs grounded in themes related to their legislative history and importance. Although some parks understand climate change as an important issue and thus include it in their programing, others either don’t view it as imminent and locally important, or they lack capacity or understanding of how to address it. Furthermore, the management of park websites is often accomplished at the park level, largely as collateral duty. Given this decentralized system, parks with a desire to communicate climate change may not always have the resources at their disposal to do so.
Recent studies have shown that climate change has a direct impact on visitors’ travel behavior, and will continue to do so in the future (De Urioste-Stone et al., 2016; Fisichelli et al., 2015). Some sources report a visitor’s hypothetical decision to postpone or cancel their trips altogether under certain climate scenarios (Lam-González et al., 2021), while other studies point to an extension of visitor seasons with warming temperatures (Albano et al., 2013). Communicating the current and anticipated impacts of a changing climate will become increasingly vital as the phenomenon plays a stronger role in a park visitor’s trip planning considerations. The authors of this study provide the results of this investigation as both a point-in-time assessment and an opportunity to highlight gaps in NPS online content regarding climate change interpretation. The assessment provides a valuable baseline against which to measure future progress in better interpreting the critical issue of climate change. Furthermore, the results provide a useful spectrum of opportunities for visitor engagement across the National Park System. This information, together with what is known regarding barriers to climate change communication (Leal Filho, 2009), positions the NPS and its interpretation, and education partners to provide training and support to the parks that can most benefit from assistance.
Implications for Practice
In the spring and summer of 2019, we found that only 37% of National Park Service unites directly interpreted climate change on their websites. The results of this work are important for advancing servicewide goals around climate change communication. Various NPS programs and offices—as well as federal and non-governmental partners—currently support park interpretation and education efforts. These entities regularly provide training, technical assistance, and financial assistance for climate change communication efforts (e.g., see https://www.nps.gov/orgs/ccrp/training.htm). In addition to these resources, external documents are available online related to the topic, such as the Center for Research on Environmental Decisions’ guide to understanding the psychology behind climate change communication (http://guide.cred.columbia.edu/). Lastly, park rangers and interpretive specialists need not necessarily reinvent the climate change interpretation wheel, but can rather seek out NPS or other land management agency employees that have already implemented climate change communication at their respective sites, and apply any lessons learned from the experience (Ettling, 2012).
Overall, study findings can help focus support on parks, regions, and unit designations that struggle to find and share relevant climate change stories by identifying target areas for future interpretive prioritization. As more parks subsequently host climate change information online, follow up assessments that repeat the data collection methods of this study can demonstrate progress over time and guide continued investments of NPS resources and effort.
Supplemental Material
sj-pdf-1-jix-10.1177_10925872211042935 – Supplemental material for Categorizing Online Climate Change Interpretation Across the National Park System
Supplemental material, sj-pdf-1-jix-10.1177_10925872211042935 for Categorizing Online Climate Change Interpretation Across the National Park System by Ryan Roberts, Matt Holly and Larry Perez in Journal of Interpretation Research
Footnotes
Acknowledgements
In particular, the authors would like to thank Lee Grunau, Cat Hawkins Hoffman, Joel Reynolds, Natalie Sexton, and Melanie Wood for their kind support of the project.
Disclaimer
Views, statements, findings, conclusions, recommendations, and data in this report do not necessarily reflect views and policies of the National Park Service, the U.S. Fish and Wildlife Service, or the U.S. Department of the Interior. Mention of trade names or commercial products does not constitute endorsement or recommendation for use by the U.S. Government.
Declaration of Conflicting Interests
The author(s) declared no potential conflicts of interest with respect to the research, authorship, and/or publication of this article.
Funding
The author(s) disclosed receipt of the following financial support for the research, authorship, and/or publication of this article: This work was funded through a partnership between the National Park Service Climate Change Response Program and Colorado State University.
Author Biographies
References
Supplementary Material
Please find the following supplemental material available below.
For Open Access articles published under a Creative Commons License, all supplemental material carries the same license as the article it is associated with.
For non-Open Access articles published, all supplemental material carries a non-exclusive license, and permission requests for re-use of supplemental material or any part of supplemental material shall be sent directly to the copyright owner as specified in the copyright notice associated with the article.