
Abstract
Concept maps have been used to assess knowledge acquisition, track learning, and reveal mental models. This study proposes and validates a computationally measurable coding scheme to overcome educational assessment limitations: time consuming, inconsistency in coding, and difficulty in measuring semantic and structural complexity. The three-step coding scheme includes (i) classifying vertices and edges using a guidebook, (ii) training coders through a standardized manual, and (iii) validating reproducibility via inter-rater reliability (IRR) using Fleiss’ Kappa. Results from 22 undergraduate researchers coding six student-generated maps yielded moderate to substantial agreement (Kappa = 0.67 for vertices, 0.45 for edges), supporting both the accuracy and consistency of the scheme. This coding scheme enables scalable, real-time analysis of student thinking and lays the groundwork for automated feedback systems, with potential applications in adaptive learning and tracking of engineering identity in students pursuing engineering education. Beyond enabling structural and semantic analysis of student thinking, the scheme supports automated translation of hand-drawn maps into a digital, analyzable format laying the groundwork for scalable, real-time feedback systems in engineering education. By aligning methodological precision with reflective assessment practices, this research introduces a tool for measuring how students organize and evolve their understanding within project-based curricula. Future directions include integrating AI for automated coding, with promising applications in adaptive learning environments, formative feedback mechanisms, and long-term identity tracking in engineering programs.
Motivation: Concept Graphs as Assessment Tools
In engineering education, evaluating student learning is often constrained by traditional assessment tools such as exams, quizzes, or project reports. These instruments typically fail to capture the iterative and non-linear nature of how students develop conceptual understanding throughout a design or systems-based course. Engineering curricula increasingly emphasize inquiry, reflection, and problem-solving, demanding assessment tools that can account for growth in cognitive complexity, process thinking, and disciplinary identity formation. As a result, educators and researchers are turning to more expressive and diagnostic tools that can reveal how students organize and connect knowledge.
Concept maps can visualize a learner's mental model by representing relationships between concepts through nodes (vertices) and connecting lines (edges). They capture what a learner knows, in addition to how that knowledge is structured and interrelated. In educational research, concept maps have been used to identify misconceptions, assess conceptual depth, and track knowledge evolution over time. Their application in design education is especially promising, where systems thinking, creativity, and iterative refinement are integral learning outcomes.
Challenges with Concept Maps
Concept maps represent relationships between vertices (concepts described with words) through edges (connections between the concepts) (Patel et al., 2024). This visualization helps users make sense of complex systems and captures users mental models (Chang, 2007). The maps is used in design to represent systems, subsystems and the flow of information between them (Padilla et al., 2017; Reichherzer & Leake, 2006). Concept maps are created with specific purposes in mind and are used in various experiments and studies to analyze thought processes (Ruiz-Primo et al., 2001; Watson et al., 2016). However, the challenge of coding these maps increases when numerous unique maps are generated by participants with diverse backgrounds (Lopez et al., 2014). This necessitates a robust coding scheme and a tool to streamline the coding and analysis processes, ultimately improving research outcomes when dealing with large datasets generated from concept maps that have to be manually coded (Khajeloo & Siegel, 2022; Kinchin et al., 2010).
Concept maps are effective in capturing and assessing learning by visualizing a learner's knowledge structure (Grundspenkis & Strautmane, 2010; Lopez et al., 2014; Patel et al., 2024; Tergan et al., 2006). They help educators identify misconceptions, evaluate conceptual understanding, and track knowledge evolution over time (Kamble & Tembe, 2013). In educational contexts, particularly in engineering and design, concept maps facilitate brainstorming (Besterfield-Sacre et al., 2004; Trochim & Kane, 2005), understanding complex systems (Chang, 2007; Darmofal et al., 2002; Schroeder et al., 2018), and visualizing design processes (Correia et al., 2008; Crampes et al., 2006). They also support collaboration and knowledge/project management by providing a clear framework for integrating multidisciplinary knowledge (Gamble & Blackwell, 2001; Henry, 1974). Earlier research excludes robust guidelines for encoding these maps systematically, which can lead to inconsistencies and biases in evaluations (Carley, 1993; Mathieson & Summers, 2010; Mathieson & Summers, 2017). Specifically, this study highlights that understanding the structural complexity of concept maps has proven to be a challenging task, necessitating a rigorous training manual and guidebook to ensure uniform, accurate coding that mitigates evaluator bias.
Manual coding of many maps is time-consuming, while achieving consistency across coders is complicated by individual variations in interpreting and classifying map elements, raising concerns about inter-rater reliability (IRR). Furthermore, existing systems of coding hand-drawn concept maps often lack the computational capacity to analyze structural and semantic complexity, limiting their scalability and integration into digital learning environments. Although previous studies have proposed various scoring techniques, few have produced validated frameworks that are both reproducible and scalable. Most rely on subjective expert judgment or oversimplified rubrics, compromising analytical depth and consistency. Additionally, few coding schemes have undergone rigorous validation using statistical measures like Fleiss’ Kappa or demonstrated effectiveness in large-scale or longitudinal educational settings. These limitations highlight the need for a standardized, evidence-based coding framework that can deliver both structural and semantic insights from hand-drawn, student-generated, concept maps.
To address these challenges, this research introduces the foundational principles of the proposed concept map coding scheme. The coding scheme includes defining core components as discrete units of analysis and classifying their variations through a structured typology of types, scenarios, and cases. The goal is provide an approach that is independent of individual coders (objective) and suitable for future image recognition support.
Concept Map Coding Scheme
The Concept Map Coding Scheme was developed as part of an ongoing study to align and measure the engineering identity of undergraduate students (Kumar & Summers, 2024a). The coding scheme introduces and standardizes three key terms, coding, rating, and scoring, each grounded in existing literature and designed to ensure consistency across evaluations (D’Antoni et al., 2009; Jackson & Trochim, 2002; McClure et al., 1999; Ruiz-Primo et al., 2001; Rye & Rubba, 2002; Schau et al., 2001; Van Zele et al., 2004; West et al., 2002; Yin et al., 2005). By using concepts or keywords (vertices) and connections between the keywords (edges), the graphs represent the conceptualized mental models of the student.
For the scope of this research, concept maps are analyzed for three things:
To minimize evaluator bias, the coding process follows a uniform, method supported by a detailed training manual and guidebook. This guidebook organizes coding practices into Types, Scenarios, and Cases, enabling coders to accurately and consistently interpret a wide range of student responses that largely occur in vertices, edges or overall maps. Each concept map is treated like a fingerprint unique to every modeler (Chang, 2007; Hamdiyati et al., 2017; Moon et al., 2018). Figure 1 illustrates this process and provides an overview of the coding process. In the case of studying engineering identity, students are asked to model their understanding of “engineer”.
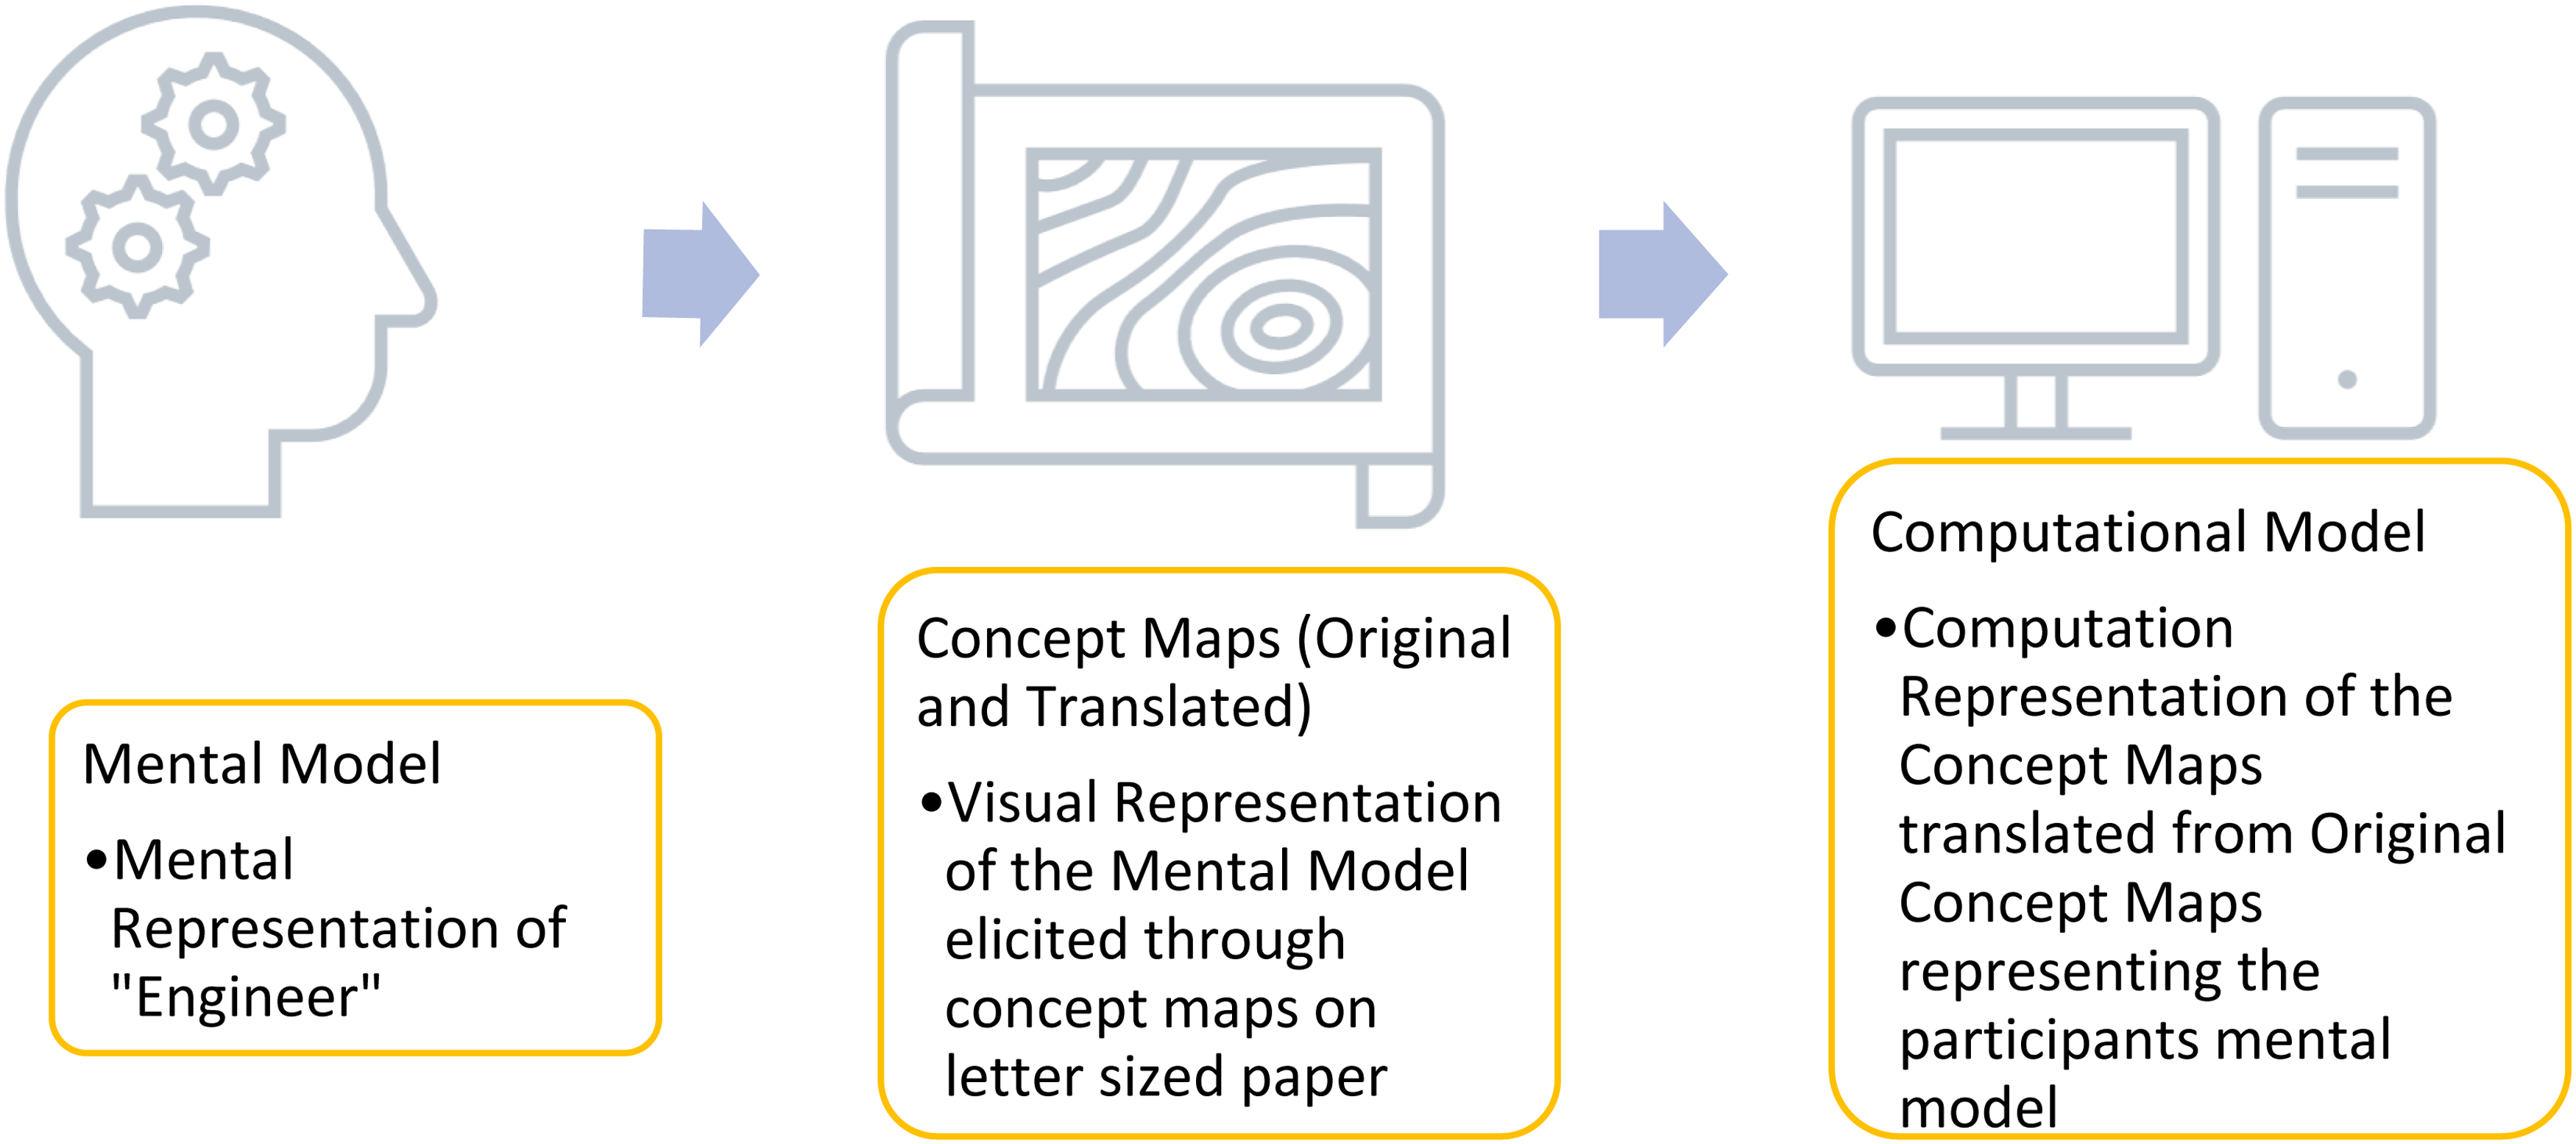
Concept map coding process.
Guidebook
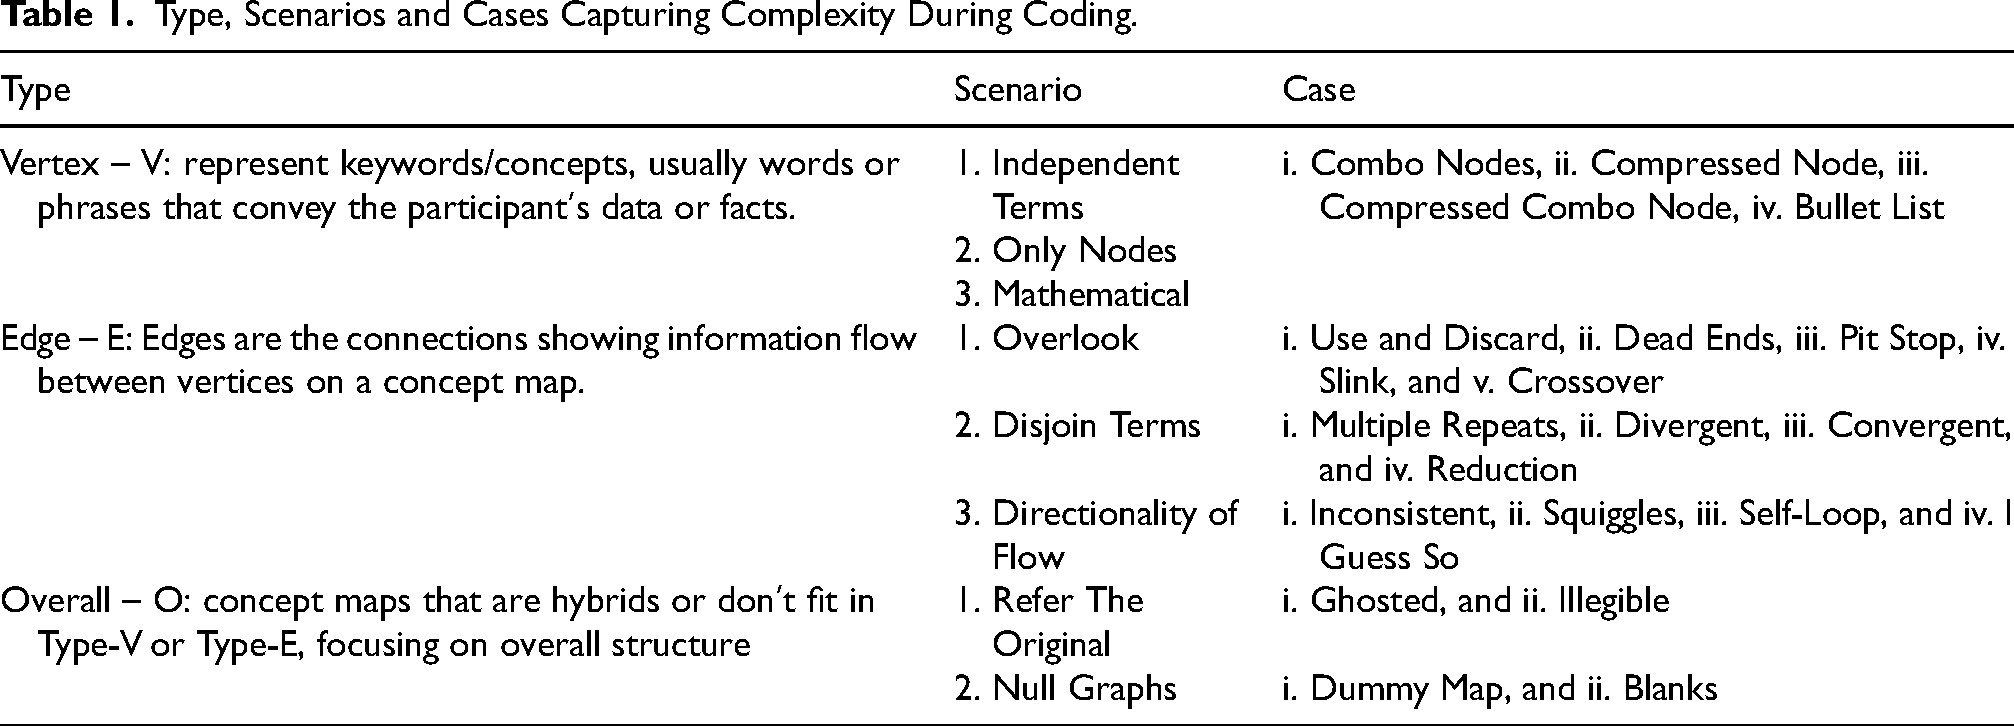
The guidebook serves as a foundational document to assist researchers in coding concept maps. It outlines the challenges encountered due to the varied styles of expression, thought, and diagraming used by individuals. The guidebook captures these variations to promote a consistent understanding of participants’ mental models through their concept maps that need to be retraced and recreated by the coders. The itemized list of these various challenges with concept maps are illustrated through scenarios, cases, and examples in Table 1.
Type, Scenarios and Cases Capturing Complexity During Coding.
Training Manual
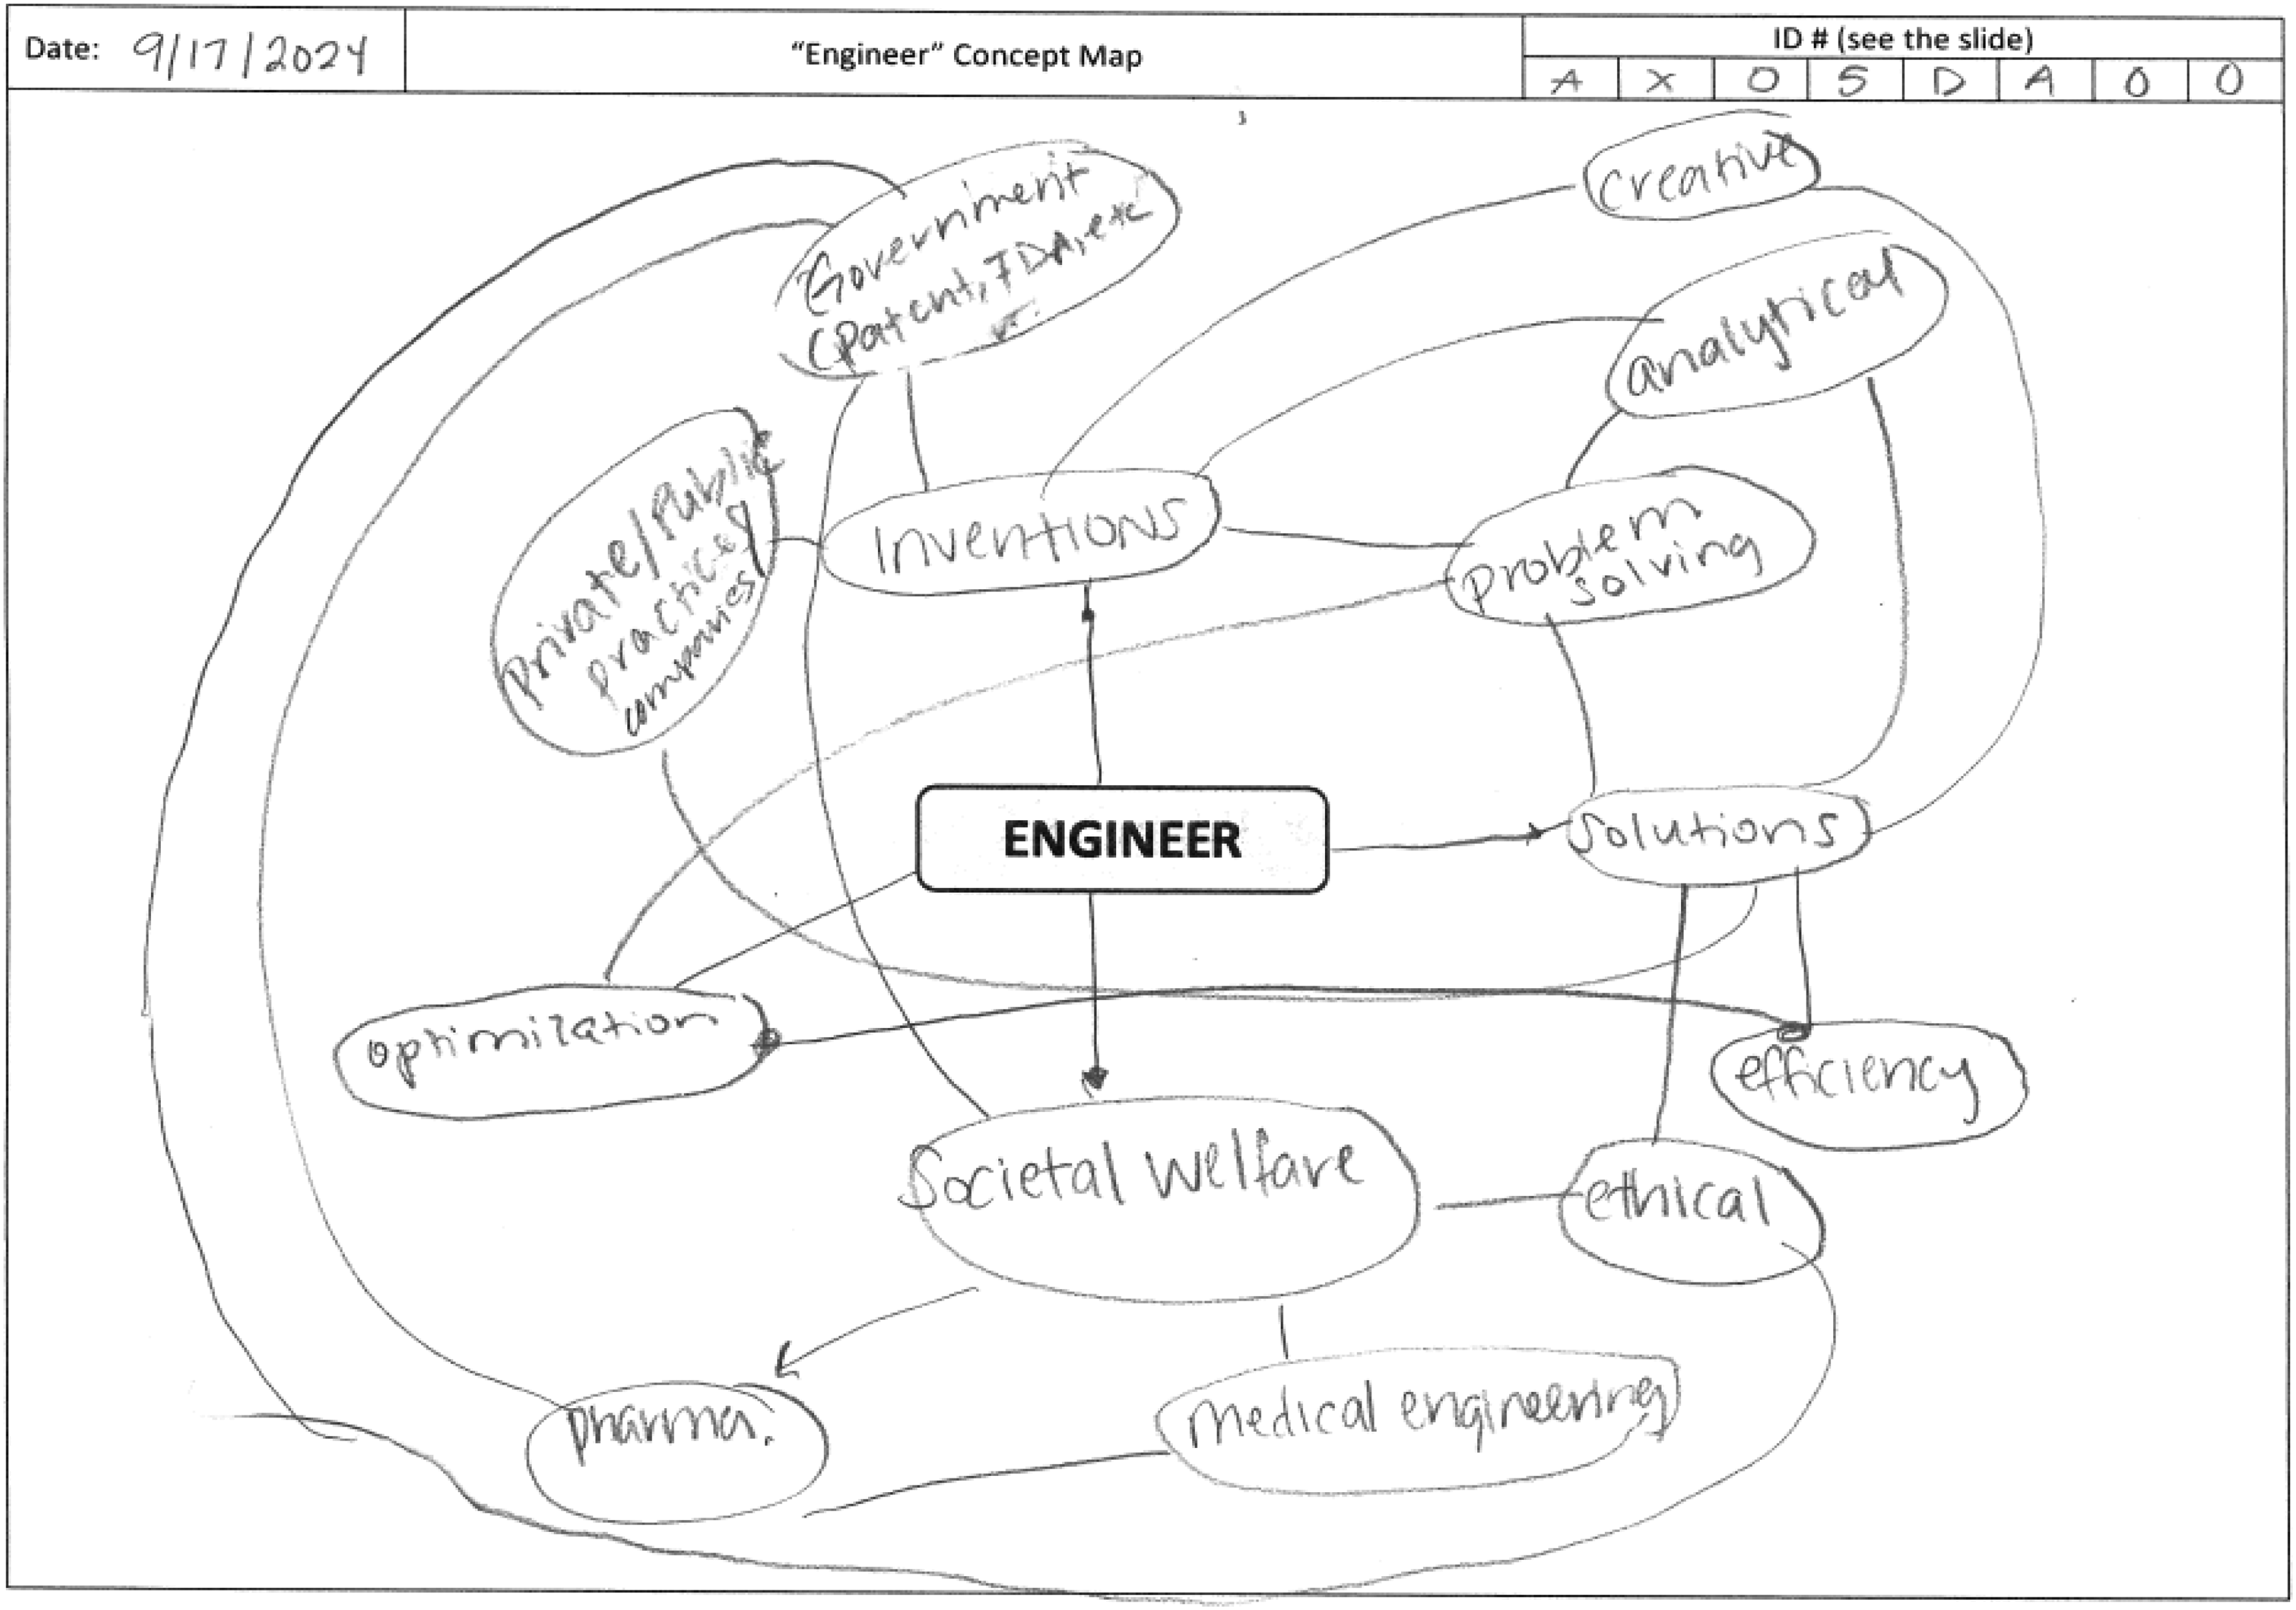
To illustrate the coding process, consider an example concept map for this section as shown in Figure 2.
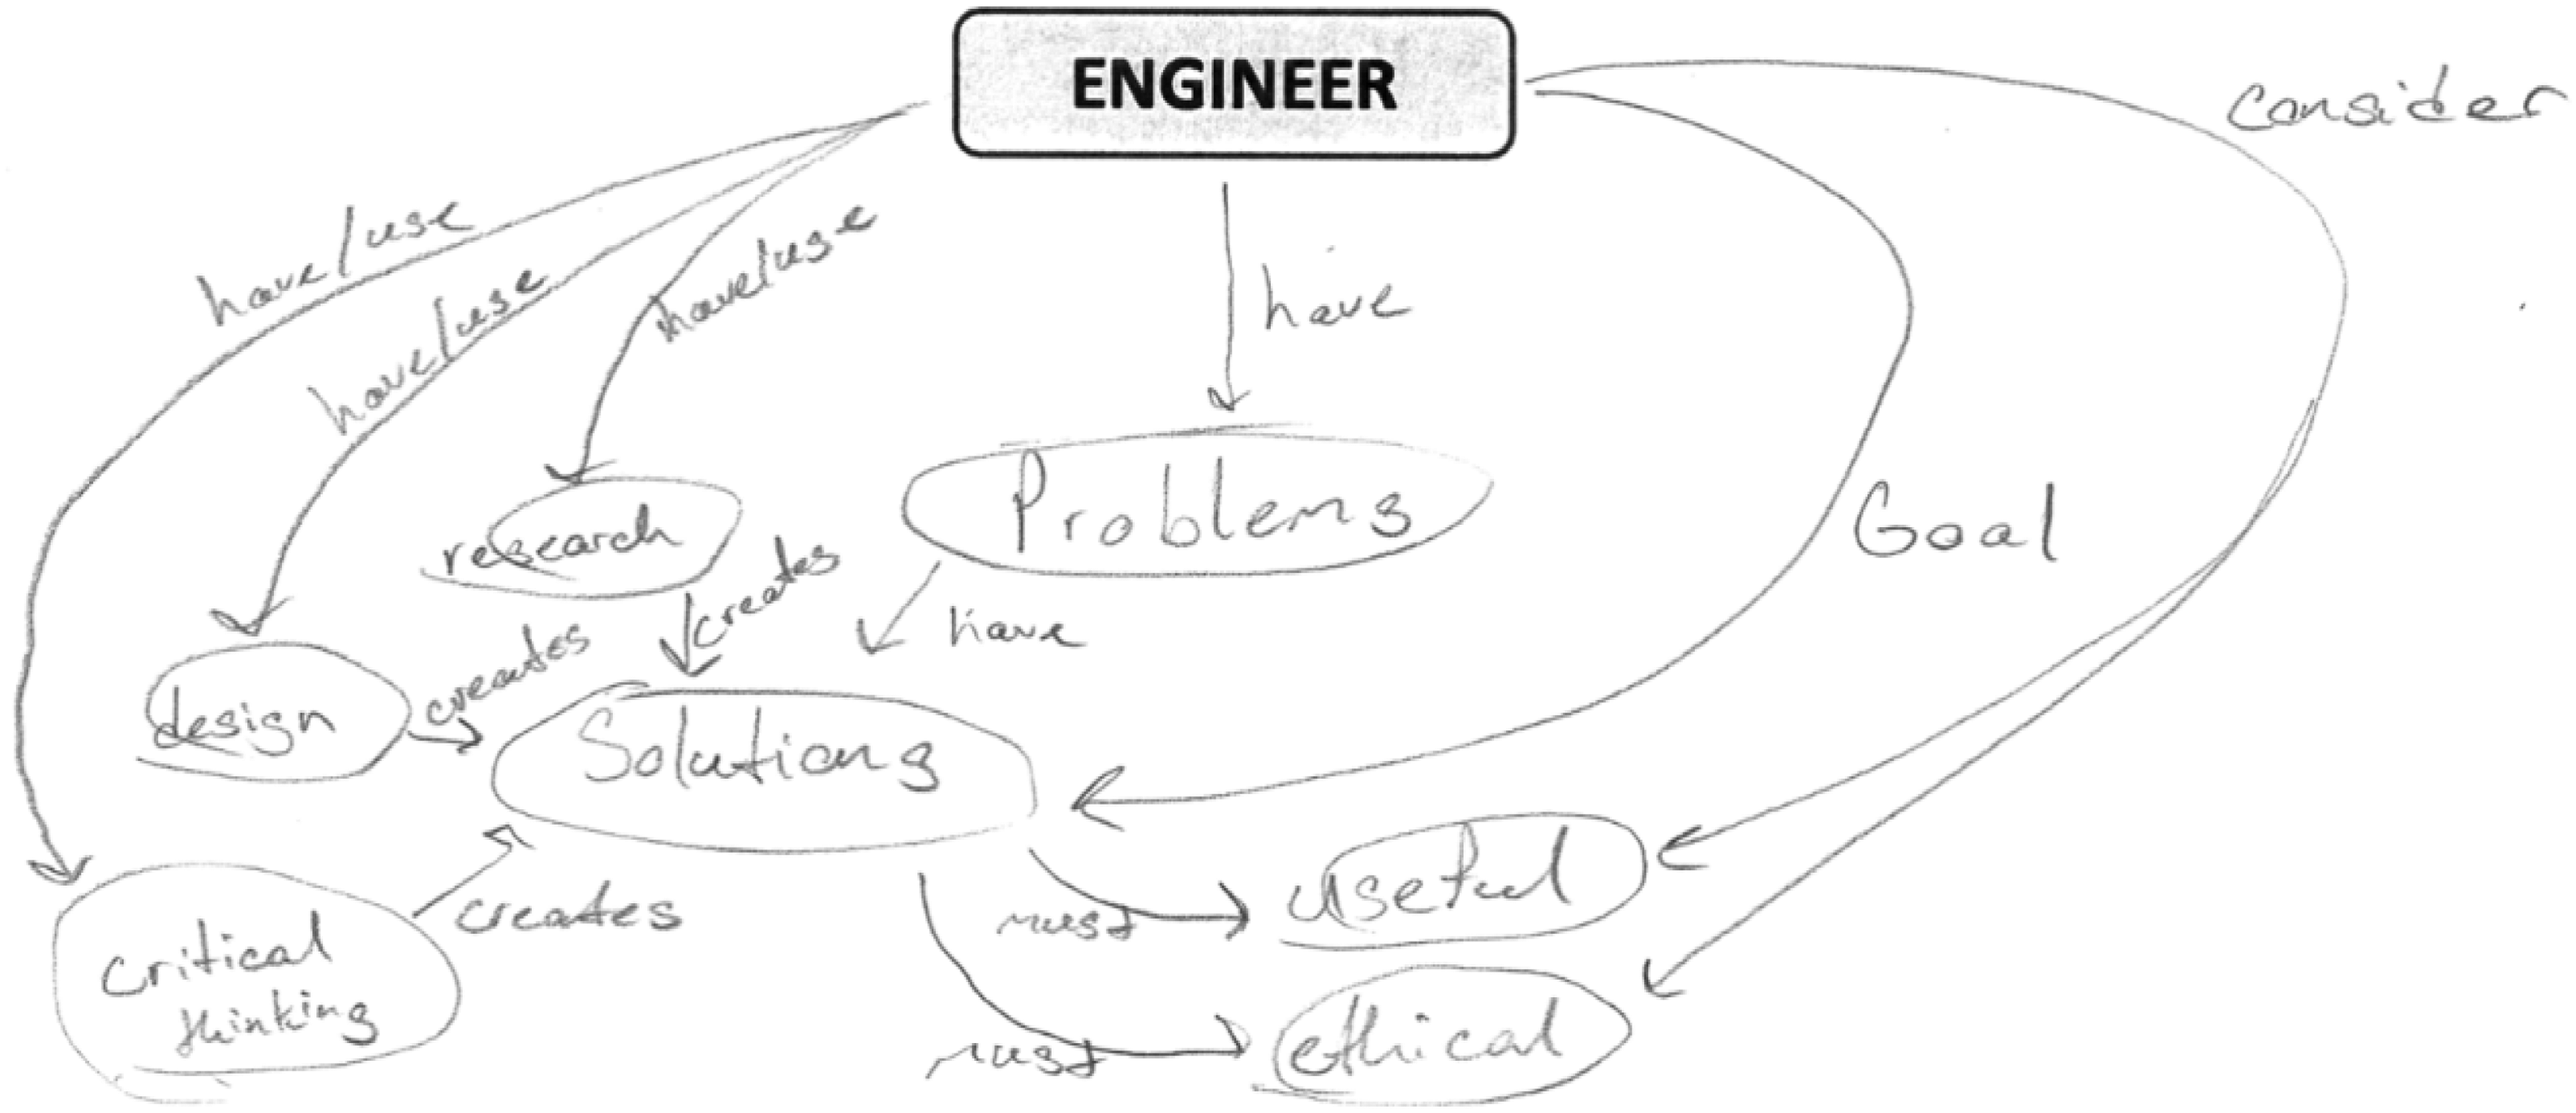
Example concept map by a pre-service engineering student (Initial).
The three-step procedure to ensure accuracy and consistency in coding for this example is illustrated below:
Step 2: Recreate the concept map (Translated Concept Map).
Step 1: Checking and Classification.

Step 3: Code the Translated Concept Map (Sample).
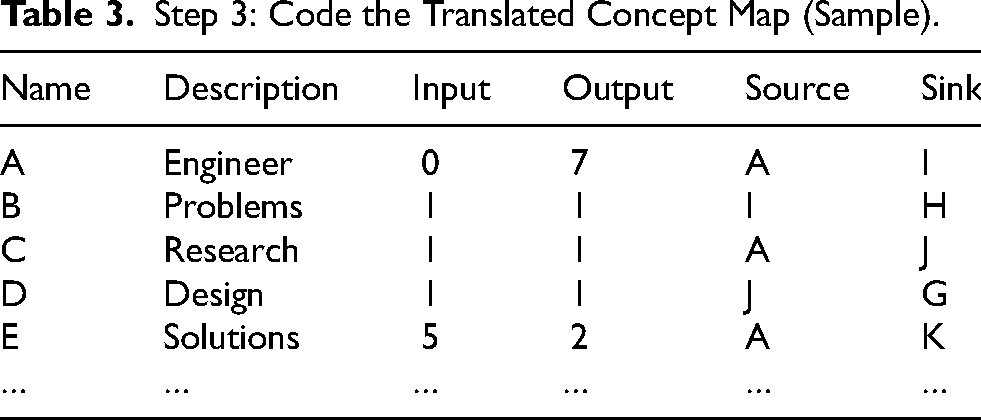
Throughout these steps, emphasis is placed on maintaining consistency and accuracy to facilitate the extraction of complexity metrics for analysis, making sure that the spreadsheet files correlate with the original maps.
Study Deployment and Data Collection
As part of a larger study (Kumar, 2025; Kumar & Summers, 2024b, 2025a, 2025b) on engineering identity, approximately 5,000 undergraduate students at a public R1 university in a U.S. suburban metropolitan area completed two instruments, a survey and a concept map, administered at the beginning and end of the Fall 2024 semester. The survey measured engineering identity using validated items and asked students to define “engineer,” while the concept map served as a visual, complement by capturing their understanding of the “engineer”. Conducted as a timed, in-class activity, students were given six minutes to hand-draw a concept map on a template sheet with “engineer” as the central node. The given prompt was “What does an engineer do? What should engineers focus on? What do you anticipate as the future for engineers? What does it mean for an engineer to be successful? What skills or characteristics does an engineer possess?” The time limit of six minutes was calibrated in pilot studies to ensure that there was sufficient time for students to build a concept map of sufficient complexity to be of interest. These maps are reconstructed into bipartite graphs using the three-step systematic coding approach to analyze their structural complexity and gain deeper insights into the concept maps which ultimately lead to mapping their evolving Engineering Identity.
The output from this process is processed computationally. This method enables researchers to convert the tool from one format (Concept Maps-Visual Representation Models) to another format (Computational Models) using a guidebook and training manual. Hence, it is important to present all the aspects of the coding scheme for a thorough investigation to capture all potential complexities that arise through type, scenarios and cases, which enables an early mitigation or failure-modes strategy to avoid future pitfalls. To validate the objective robustness of this coding scheme, 22 undergraduate researchers were given six concept maps and asked to translate them into the spreadsheet format to capture the bi-partite graphs (concepts are vertices or nodes, connecting lines are edges or relations). These bi-partite graphs are then analyzed for the structural complexity using 29 complexity metrics (Mathieson & Summers, 2010; Owensby & Summers, 2014). The specific vocabulary terms included in the concept maps are captured and analyzed through a separate sematic coding approach.
Use Case and Validation
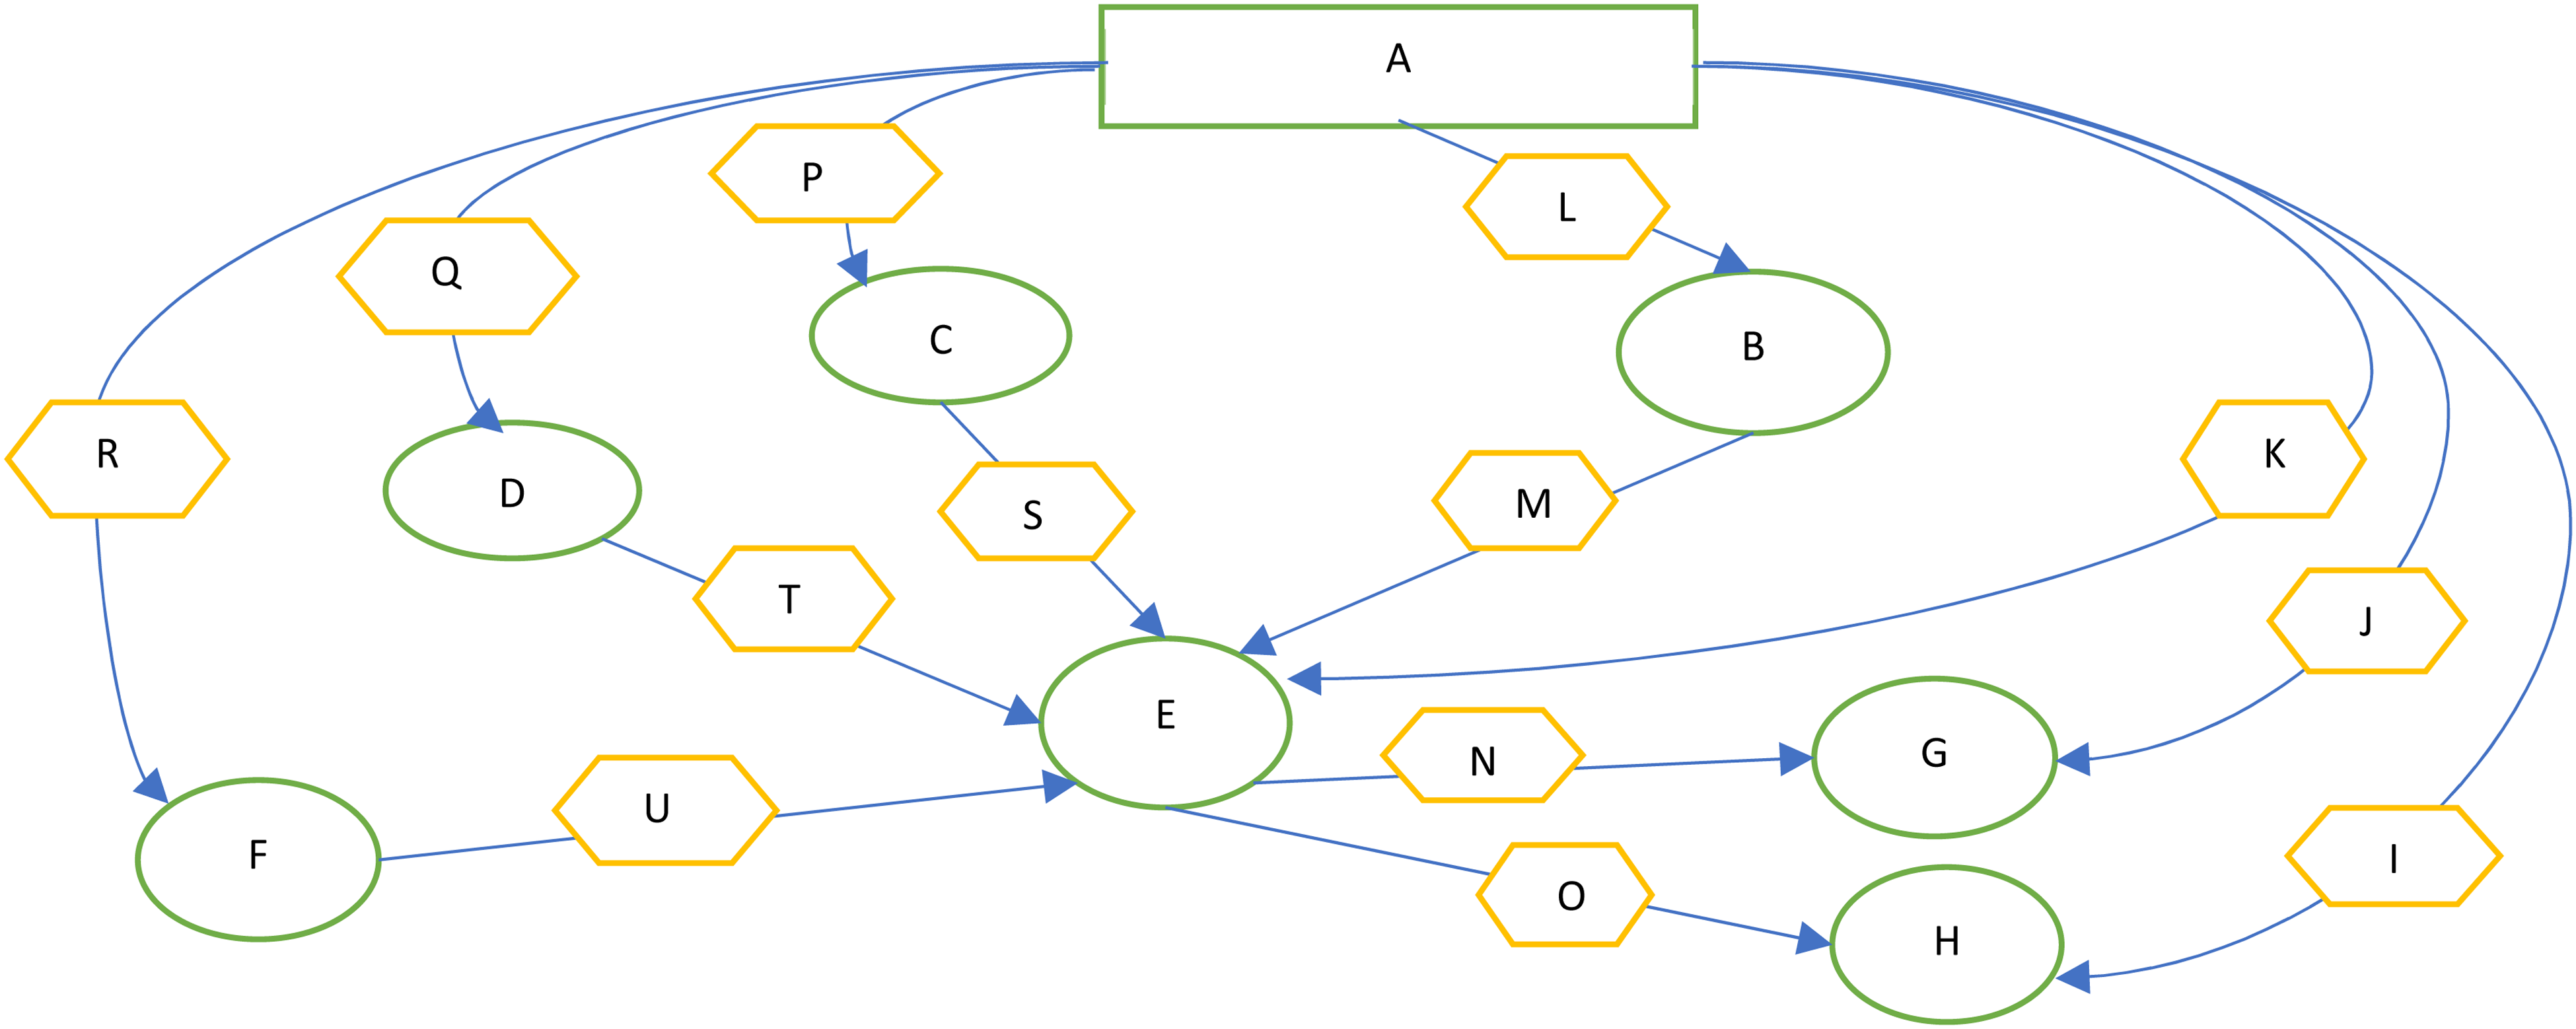
The guidebook, training manuals, videos and other hands-on training were provided to the coders for a duration of two weeks. The coders were tested once after the training period and once again after two more weeks to check if more time and effort on working on several concept maps would increase their understanding of the coding scheme and the process. All researchers were given the same material, information and time duration for the two interrater reliability (IRR) tests conducted to check the validity of the method and tools of the coding scheme of concept maps as observed in prior work (D’Antoni et al., 2009; Rye & Rubba, 2002; Watson et al., 2016; West et al., 2002). The consistency of interpretation and reconstruction of the concept graphs needs to be sufficient to allow for parallel processing of the concept maps without a loss of information. Thus, inter rater reliability and intra rater reliability tests are conducted to verify the consistency. As the concept maps could have multiple concepts within a single node, it is important to be able to split these consistently. Tests are run on the objectivity of the code for vertex splitting and edge construction. Six concept maps were randomly selected for testing. The more complicated of the maps is illustrated in Figure 4.
Original concept map - P1 detailing high complexity.
The goal of this analysis is to assess robustness of the scheme by comparing the results as coded by 22 undergraduate researchers coming from diverse backgrounds and years of engineering in their undergraduate program. These six concept maps were chosen randomly using the random Excel function. The results of the analysis are presented in this section using the averages of the vertices and edges coded by the participants using the coding scheme for all these six concept maps as part of this use case. The analysis is used to determine the standard deviation and coding consistency amongst the 22 coders.
Analysis of Vertices and Edges
Figure 5 highlights the standard deviation on the average number of vertices. Here one can see that Map P1 and P6 were the most complex in nature and hence they had the highest nonconformity compared to the other four with P5 being the least. This variability highlighted the relative complexity of vertices and edges chosen for this test. Figure 6 shows standard deviation on the average number of edges as they were the most difficult element on the concept maps to code. Hence, there is a larger magnitude of standard deviation recorded in their coding. The largest deviance is P2 which was coded with a standard deviation of 1.6 edges compared to its counterparts. Figure 7 shows the coding consistency related to vertices and edges for the 22 coders. Figure 7 shows the scatter plot of the 22 coders arranged alphabetically, thus randomizing the sequence as it is to check the consistency amongst the coders. It is seen that the R2 Values of the three trendline shows that the coding has been consistent for both vertices (0.0942) and edges (7E-05), and when we take an average (0.0317) for both as well. The small R2 values indicate that there is no increasing or decreasing trend.
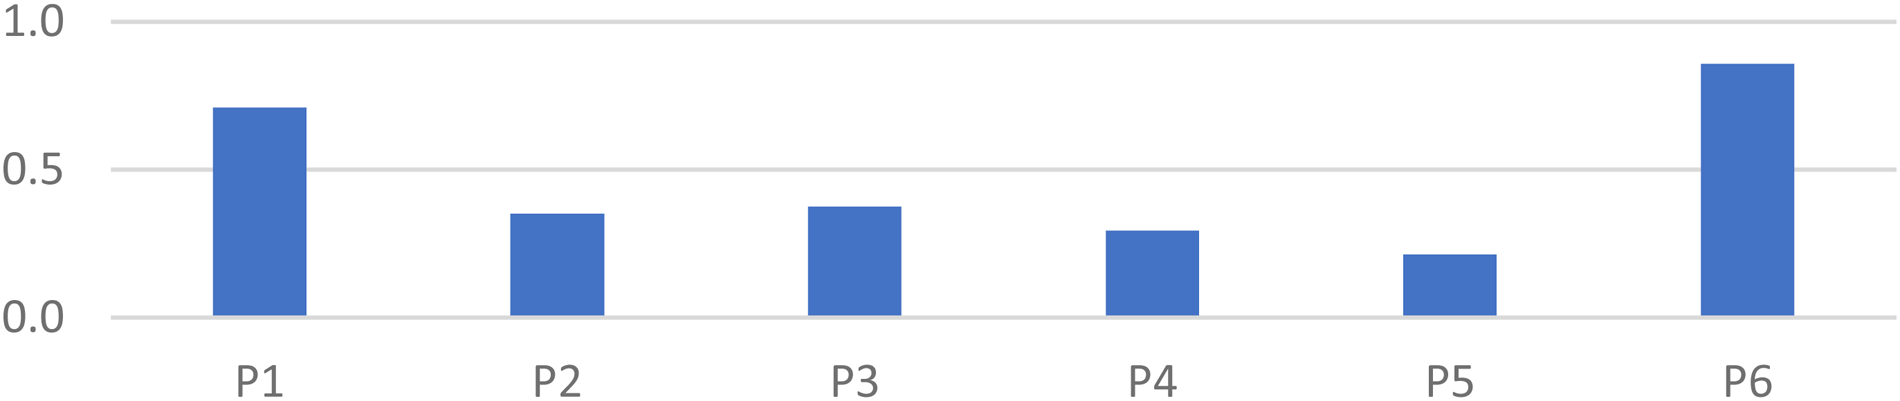
Standard deviation of vertices.
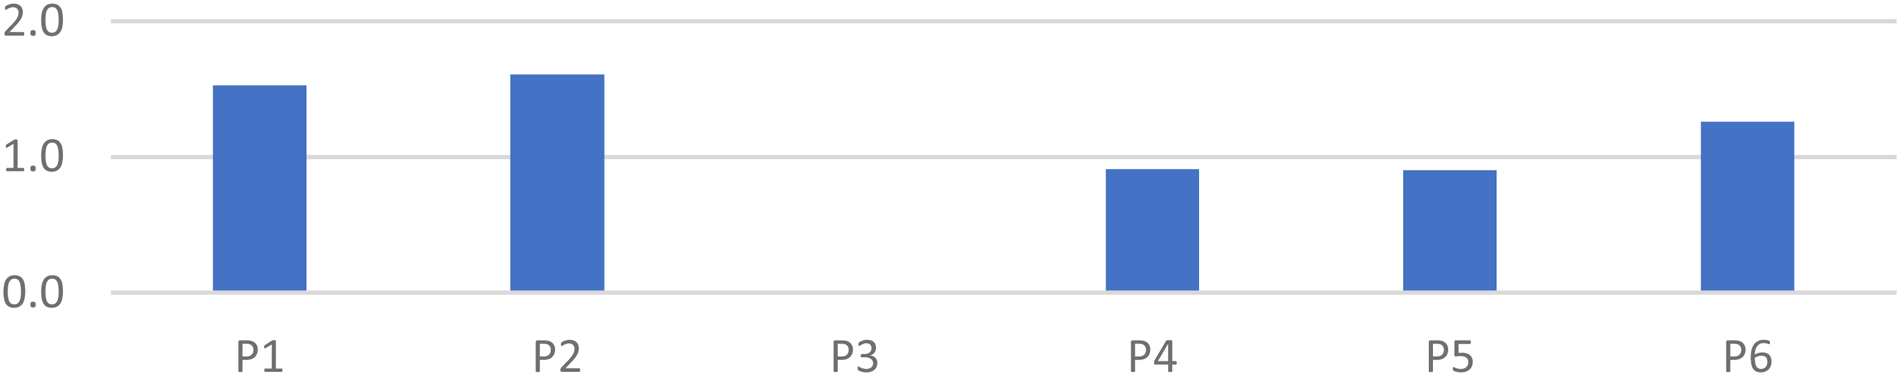
Standard deviation of edges.
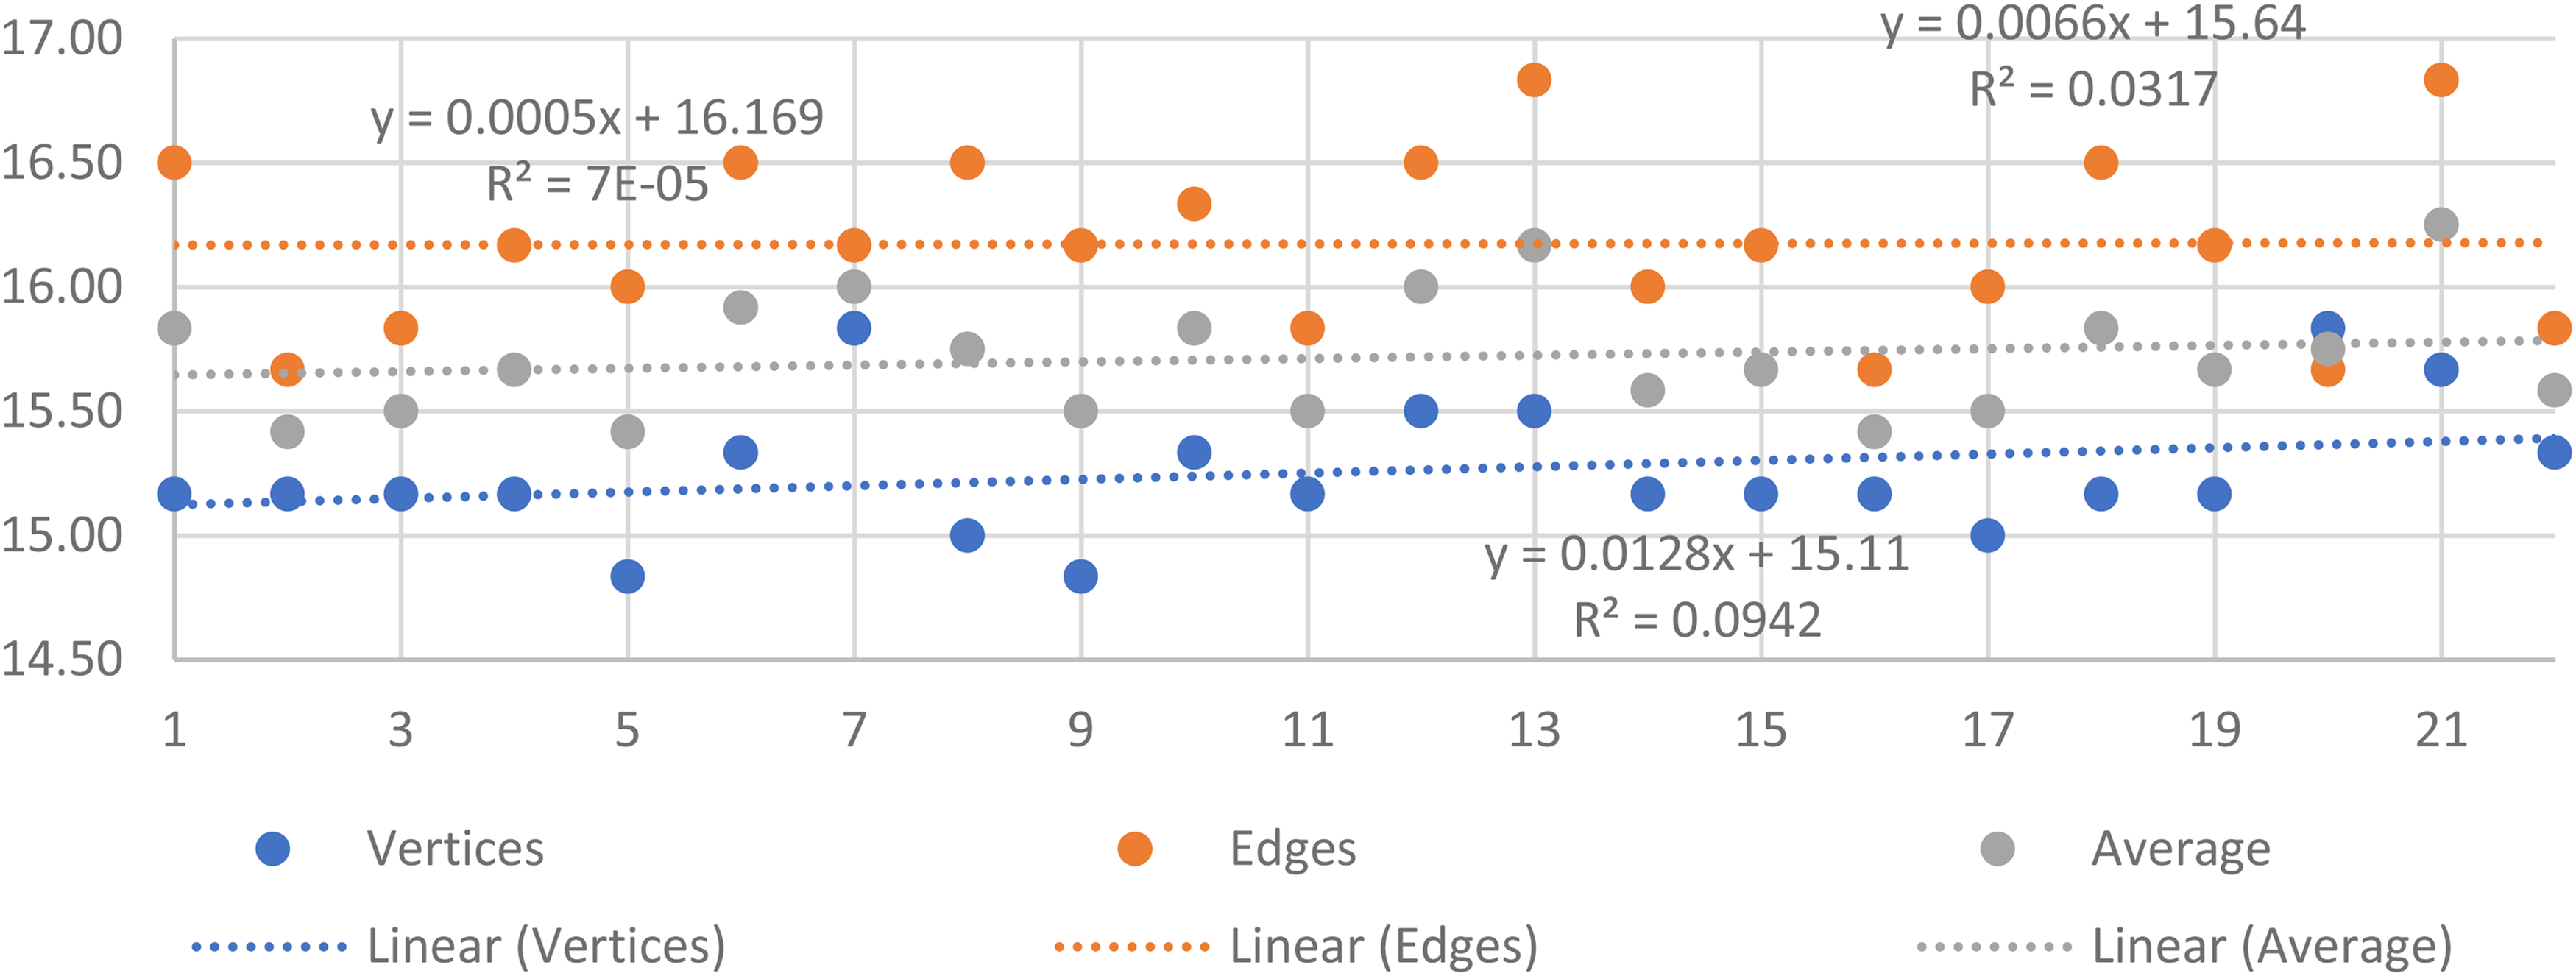
Coding consistency of coders.
It is also worth noting that the two sets of concept maps analyzed in this study were obtained during distinct phases of the research timeline. P1-P3 was taken earlier just after the coding training period and P4-P6 was taken during a later time to test the coding scheme. This analysis revealed that the standard deviation is the same for all the three concept maps (P4-P6) highlighting that the coders might have gotten used to the coding scheme and were able to be in a particular deviation range. This also highlights the consistency of the coders, and the coding scheme. Overall, the analysis validated the coding scheme's effectiveness in capturing the structural intricacies of the participants’ concept maps.
Inter-Rater Reliability (IRR) - Fleiss’ Kappa
The final validation of the coding scheme developed for concept maps can be shown with IRR testing. This section analyses, validates and tests the hypotheses that the coding scheme is robust with reasonable agreement between the coders, and this is not based on chance as suggested by the IRR's null hypothesis. The testing includes IRR for coding the vertices and edges. Since this research had 22 coders, the research used Fleiss’ Kappa (FKappa) (Falotico & Quatto, 2015; Moons & Vandervieren, 2023) which is a statistical measure used to evaluate the agreement between multiple coders (more than two) when assigning categorical coding to a fixed set of items. It is an extension of Cohen's Kappa. FKappa is the main statistic that shows the agreement between coders and has a value between 0 and 1, where 0 would be no agreement and 1 would be in complete agreement eliminating the probability of agreement by chance and other bias. FKappa is widely used in research where IRR among multiple observers or evaluators needs to be quantified, such as healthcare, education, and social sciences.
Unlike ANOVA or Z-test, the p-value is preferred to be zero in Fleiss’ Kappa (or very close to 0), indicating that the null hypothesis (which assumes agreement by chance) can be rejected with high confidence. In other words, the observed level of agreement among coders is statistically significant and not due to random chance. The research also acknowledges that a p-value of 0 doesn't necessarily mean perfect agreement; it just means that the observed agreement is statistically significant. The strength of the agreement is still determined by the FKappa value itself. It is noted that if the value is between 0.75 and 1, it means “Excellent” agreement. Between 0.4 to 0.75 is recognized as “Moderate to substantial” agreement and 0 to 0.4 is “Slight to fair” agreement (Falotico & Quatto, 2015; Moons & Vandervieren, 2023).
Vertices IRR
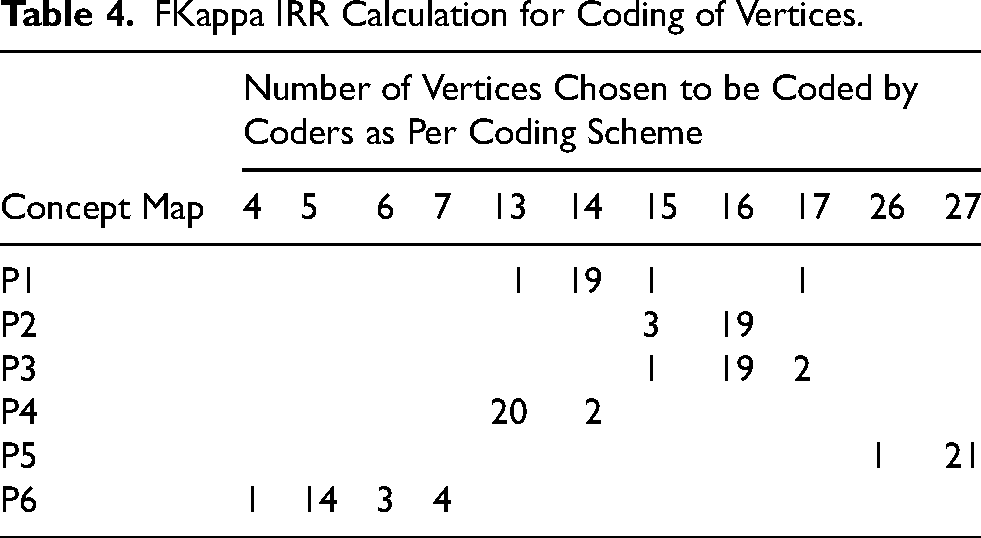
This section presents the IRR related to vertices to be checked between all coders on the vertices of the concept maps. The vertices are the nodes that are presented in the concept maps that need to be coded in the excel file as close to the original concept map while also ensuring accuracy and consistency by applying the rules in the guidebook and the training manual. Table 4 shows the calculation relevant for this section, and Table 5 shows the FKappa value for the coding of vertices, 0.6787. Thus showing that most of the coders are in “Substantial” agreement with each other, hence proving the effectiveness of the coding scheme and process (method and tool) for vertices. It can be observed from the coding as well that P1 and P6 can be seen to have more spread of values. If we consider P1 in the first row, we see that out of the 22 coders, 1 coded for 13 vertices, 19 coders coded 14 vertices, 1 coder coded it to have 15 vertices and 1 more coder coded it to have 17 vertices, showing that each row adding up to 22 coders to complete the calculation section of this table.
FKappa IRR Calculation for Coding of Vertices.
FKappa Final IRR Results for Coding of Vertices.
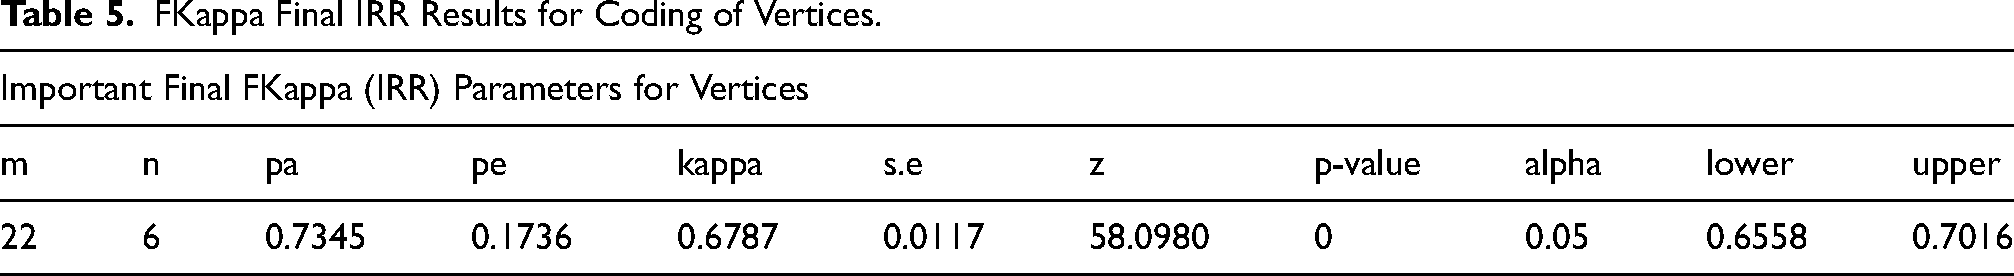
Table 5 highlights several final parameters pertaining to Fkappa test, such as
Edges IRR
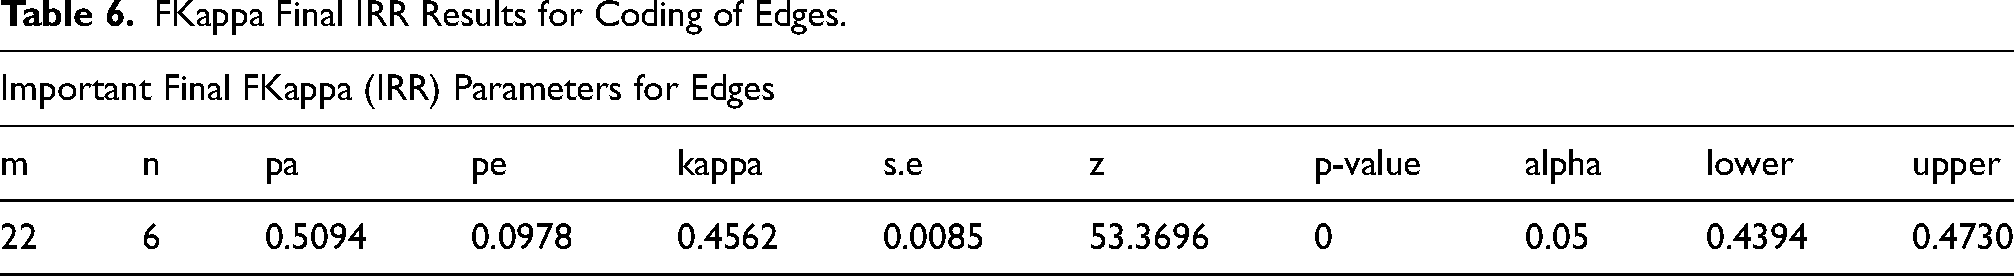
Like the IRR of vertices, the research obtained a Fkappa value of 0.4562 with an alpha of 0.05 and other important values pertaining to the FKappa test as shown in Table 6. Thus, indicating that there was substantial agreement on the coding scheme applied to the edges as well. The research acknowledges that as the edges are the elements that create complexity in concept maps which ultimately presents the understanding through flow of information by connecting the facts or data points. These edges also get further complicated when the writing utensil or the scan of the concept maps have issues. Thus, justifying the need for a digital tool that can eliminate such human-induced errors in data collection and codification. Again, this Fkappa value for coding of edges according to the process and tool, proves and validates the coding scheme developed for concept maps.
FKappa Final IRR Results for Coding of Edges.
Conclusion, Limitations and Future Work
As demonstrated throughout this study, the development of a consistent, scalable coding scheme for concept maps addresses a critical methodological gap in engineering education research. By grounding the framework in theoretical clarity and validating it through empirical reliability testing, the study offers a robust approach for analyzing the structural and semantic dimensions of student thinking. The following concluding section summarizes the core contributions of this work, outlines its limitations, and suggests avenues for future research and expansion.
This study developed and validated a structured, reproducible, and scalable concept map coding scheme tailored for engineering education. The research contributions can be summarized as follows:
Foundational Framework: Introduced a conceptually grounded coding architecture based on three dimensions: Type, Scenario, and Case, enabling coders to capture both structural and semantic features of hand-drawn concept maps. Guidebook and Training Manual: Developed and implemented a comprehensive guidebook and training protocol that ensures uniformity in coder interpretation and minimizes evaluator bias. Three-Step Coding Procedure: Operationalized the scheme through a stepwise method involving map classification, recreation, and data translation into computational formats. Validation with Fleiss’ Kappa: Demonstrated moderate to substantial IRR with 22 undergraduate coders across six maps (Fleiss’ Kappa = 0.6787 for vertices, 0.4562 for edges), validating both the consistency and practicality of the coding process. Application in Engineering Identity Research: Deployed the coding scheme within a longitudinal study on engineering identity, linking coded map complexity to self-reported measures such as initiative, self-efficacy, and disciplinary engagement. Metric Extraction for Computational Analysis: Enabled the generation of 29 complexity metrics per concept map, facilitating learner-level and cohort-level analysis in design education research.
Despite its strengths, this study has several limitations. First, while the coding scheme has shown promising IRR, its application was limited to a specific domain, engineering education and within a controlled environment using hand-drawn concept maps. Second, the Fleiss’ Kappa for edge coding, though within acceptable thresholds, was lower than that for vertices, indicating that additional refinement or digital pre-processing tools may improve coder consistency in capturing complex relational structures.
This research opens several promising directions for future work. One key opportunity is to extend the coding scheme to other disciplines such as health sciences, business, or the liberal arts where visual reasoning and systems thinking are equally relevant. Applying the framework to digitally scanned concept maps could also streamline analysis by enabling direct computational processing. Further, integrating artificial intelligence to automate coding tasks such as identifying patterns in concept structures could enable real-time feedback for educators and learners. Lastly, longitudinal studies could leverage this scheme to track conceptual development over time, linking map evolution to academic performance, identity formation, and learner outcomes. Collectively, these directions highlight the coding scheme's potential for interdisciplinary impact, automation, and long-term learning analytics.
Results from the engineering identity study that includes concept graph comparisons, engineering identity surveys, student definitions of engineering, and keyword selection to describe engineering can be found in (Kumar, 2025). The concept maps helped explore the growth of individuals across the semester, comparing the complexity of the graphs and the increase in the number of words or concepts employed.
Footnotes
Funding
The authors received no financial support for the research, authorship, and/or publication of this article.
Declaration of Conflicting Interests
The authors declared no potential conflicts of interest with respect to the research, authorship, and/or publication of this article.
Author Biographies