
Abstract
Participatory approaches to innovation aim to address persistent failures of technology to respond to end-user needs and context. Here, we present the results of a transdisciplinary project aimed at co-developing technology for water quality monitoring in developing countries. Drawing from social science, we developed and implemented a suite of approaches to engage community members and regional stakeholders in the innovation process. Part of our engagement activities involved sampling and molecular analysis of drinking water sources from two communities on the island of Efate in Vanuatu. The results revealed evidence for temporal variations in faecal contamination from different sources. This analysis was used to frame discussions about microbial contamination, water quality and health, which, along with other structured conversations, led to technical and institutional specifications for water quality sensing. Informed by these specifications, a device for monitoring colorimetric changes in response to microbial growth was designed and built. This device was able to quantify growth of faecal coliform indicator species Escherichia coli inoculated into sterile media and could detect E. coli inoculated into sterilised river water and naturally occurring E. coli in raw river water samples. The limit of detection was a single E. coli cell in 100 mL of liquid.
Introduction
Globally 1.8 billion people rely on drinking water sources that are faecally contaminated (Bain et al., 2014), contributing to over 500,000 deaths per annum amongst children under five years old from diarrhoeal diseases (Pruss-Ustun et al., 2014; WHO, 2017). This global health crisis is exemplified by the situation in the South Pacific island nation of Vanuatu, in which poor hygiene and insufficient infrastructure result in high child mortality from diarrhoeal diseases (File & McLaws, 2015). Vanuatu also has a high susceptibility to natural disasters and a low coping capacity (UNDRR, 2022). For example, following Tropical Cyclone Pam (March 2015) half the population was without clean drinking water for one month after two thirds of water and sanitation infrastructure was destroyed (Reuters, 2015).
Vanuatu is an extreme example of a global problem. Across the globe, climate change is set to increase the frequency and intensity of extreme weather events (Seneviratne et al., 2021). For example, Tropical Cyclone Judy impacted Vanuatu on 1 March 2023, followed by Tropical Cyclone Kevin just two days later and the category 5 Tropical Cyclone Lola impacted northern Vanuatu on 25 October 2023; the earliest Tropical Cyclone recorded in the South Pacific. Research across multiple countries has demonstrated the significant risk of water contamination and diarrhoea following such natural disasters, emphasising the need for the rapid implementation of water quality monitoring and control measures (Jafari et al., 2011). While the long-term solutions to these problems are complex, technology has the potential to play a critical role in supporting access to clean water. Indeed, the United Nations (UN) suggest that international cooperation and knowledge sharing on science, technology and innovation will be necessary for the achievement of the Sustainable Development Goals (SDGs) (UNIDO, 2022).
Despite the significant role science and technology can play in the lives of people all over the world, the benefits of technological innovations are often unevenly spread (Mormina, 2019). There is now a breadth of literature making it clear that, if the potential for equitable value and sustained use of technology is to be achieved, it is inadequate to consider science and engineering in isolation from the setting in which it is applied (Douthwaite & Hoffecker, 2017; Glover et al., 2019; Gomez-Marquez & Hamad-Schifferli, 2021). Participatory approaches to technology development aim to embed communities in the innovation process from the outset, ensuring that technology is developed to meet the needs, skills and socio-economic context in which a particular community live, and deliver benefits that are distributed equitably. Developed historically to narrow the gap between users and researchers in the agricultural sector (for example, Almekinders et al., 2019; Crane, 2014; Douthwaite et al., 2002; Hoffmann et al., 2007), we recently extended the analysis of participatory technology development into the broader context of all technology, and provided a framework that scientists and engineers can use to better address pressing societal problems (Ensor et al., 2025).
Informed by this framework, we have been working with rural and periurban communities in Vanuatu, in a transdisciplinary project the aim of which is the participatory design of new sensor technology for microbial contamination of drinking water. In collaboration with national NGOs and local communities, we developed a range of contextually appropriate methods for knowledge sharing about water sources, water usage and microbial contamination, and attitudes to technology and the importance of equity in technology use and distribution of benefits. The emergent shared knowledge was used to specify the requirements for a new sensor technology appropriate for use in and by local communities. Moreover, our participatory approach recognises the importance of social, political and economic context in determining the acceptance, equity and long-term impact of a technology. This allows us to deliver co-designed solutions that are both social and technical, incorporating technical design and institutional arrangements that govern access, use, financing and maintenance of the technology.
Here we present a summary of the methodological approaches deployed in co-development of the water quality monitoring technology, the technical and institutional specifications of the co-developed solution and the performance metrics of the water quality sensing apparatus. While the co-developed solutions are specific for our partner communities in Vanuatu, the transdisciplinary approach and actionable methods described here are generic and versatile and it is our hope that our methodological considerations will influence and support technology innovation that delivers benefits that are equitably distributed among users.
Materials and Methods
Interactions between the participating communities and the project team took place in four workshops between 2017–2020. Together, these workshops provided a structured approach to participatory technology development. A combination of methods and activities were developed and trailed and we refer the reader to our earlier work for a detailed description of all participatory methods and the underpinning conceptual framework for equitable technology development (Ensor et al., 2025). Here we discuss a selection of methods employed in the co-production of a water quality monitoring technology, focussing on those that were grounded in knowledge exchange between the communities and scientists in the research team and methods used for evaluation of the water quality monitoring technology.
Community and Participant Recruitment and Engagement
Vanuatu is Pacific Island nation with a population of c. 250,000 distributed across 65 inhabited islands. Around 75% of communities in Vanuatu are situated in rural areas and rely on a diversity of water sources including piped water (39% of rural households), rainwater (22%), river, stream, creek, lake or spring water (11%) and underground borehole or well water (5%) (VNSO, 2018). The piped water in rural areas usually originates in a spring, river or stream located above the village and reaches the village through a gravity fed system that fills one or more storage tanks.
To ensure versatility and wide applicability, we co-designed our water quality monitoring technology with four communities located on two islands of Vanuatu. Our interdisciplinary team, comprising three natural scientists (with expertise in microbiology, environmental science and engineering), two social scientists (with expertise in participatory research and Science, Technology and Society studies) and experienced development professionals from Oxfam in Vanuatu, identified communities that reflect the diversity across Vanuatu in terms of population, isolation and water access challenges. 1) Community EP (pop. c. 500) located on Vanuatu's most populated island (Efate), 60 km from the capital city Port Vila. The community maintains a gravity fed water system with standpipes located throughout the settlement. The community also has access to rainwater collection tanks (both owned by the community and by individual households) and river water. While rural, the community is in close proximity to the urban and commercial centre of Port Vila (60 min. drive). 2) The BL community (pop. c. 100) is part of a rapidly growing, peri-urban informal settlement on the outskirts of Port Vila with access to shallow bore holes, rainwater collection tanks and river water. The community can also pay to access standpipes that deliver potable water from the Port Vila public water supply. 3) SA (pop. c. 200) is a rural and very remote community on the island of Epi with a poorly functioning gravity feedwater, rainwater collection tanks, springs and a ground water well. 4) BA (pop. c. 750) is a rural community located in the north of Epi. The community has a gravity fed water system which, while well maintained, has insufficient capacity to serve this growing community. The community also access drinking water from rainwater collection tanks, river water and a deep well.
All community interactions were facilitated by a dedicated member of the project team with local language skills and a thorough understanding of local customs. The task for the facilitator was to support interaction, deliberation and critical reflection within and between the project team and the participating community members enabling the emergence of shared understanding. At the outset, the aims, expectations and opportunities of being involved in the project were discussed with communities and explicit opportunities were given to opt-in/out of the process at intervals throughout our engagement. Participating communities subsequently identified individuals to participate in workshops. To ensure equitable, diverse and inclusive representation across the communities, we identified groups within each community likely to display different perspectives in relation to water access, use, quality and decision making. Through discussion with NGO partners and local community leaders, these groups were: young people (aged 18–25 years); members of the community water, sanitation and hygiene (WASH) committee; adult women; adult men; single mothers; elderly people; and people with disabilities. Four representatives from each of these groups were identified by the community to take part in all subsequent interactions (i.e., a maximum of 28 participants in each workshop of 2–4 days duration). With the permission of participants, data was gathered in terms of facilitator notes taken during each workshop, augmented by subsequent triangulation and reflection between members of the facilitation team. Hard copies of drawn media were collected after each session and catalogued alongside digital objects (photographs, video recordings of plays and presentations).
Microbial Sampling: Study Design, Sampling and Sample Preparation
Water was sampled (five times over a 9-month period) from three different sources in the two communities on Efate island (EP and BL). Communities were consulted to agree the key water sources to be sampled. BL: Water was sampled from the municipally-supplied tap water (provided by Unelco), from the Tgabe River (which passes through the urban and industrial centre of Port Vila before reaching BL) and from a local well. EP: Water was sampled from a community-maintained gravity-fed system which is accessed by multiple households via standpipes, the Epong River (rises inland and passes mixed-use agricultural land (including livestock) within its watershed but through no major populations upstream from EP) and a rainwater collection tank in the village. Sea water was also sampled at a single time point from the Nambawan Lagoon (−17.744612, 168.324190).
At all sampling sites, triplicate separate samples were collected in 220 mL sterile plastic containers (Corning Falcon™, Fisher Scientific, Loughborough, UK). 100 mL of the water samples were filtered using a 0.22 μm mixed cellulose membrane filter (Merck Millipore, Fisher Scientific) inserted into a plastic filter holder (25 mm inner diameter; EMD Millipore™ Swinnex™, Fisher Scientific) and the filters were stored in ∼1 mL Longmire's buffer (0.1 M Tris (pH 8), 0.1 M EDTA, 10 mM NaCl, 0.5% (w/v) SDS; (Williams et al., 2016). In-field blanks involved transferring 100 mL of sterilised water (ultrapure (MilliQ), filter-sterilised through 0.22 μm and shipped with sampling kits from the host institution) on site at each of the locations where drinking water was sampled. Additional controls were of ultrapure water filter-sterilised through 0.22 μm prepared under laboratory conditions in the host institution. A detailed sampling procedure was developed enabling the lead author to train staff from Oxfam in Vanuatu (see Figure 1a). Initially, samples were processed by the lead author, or under their supervision. Subsequent samples were taken by NGO staff or self-selecting EP / BL community members under supervision by the project team. Observations contextualising the water sources (e.g., water levels, water appearance), recent and current weather conditions at time of sampling and other observations (e.g., level of community participation in sampling) were recorded with each sample. Filters were stored in Vanuatu (in Longmire's buffer at room temperature (15–30 °C) in the offices of our NGO partners) and sent to the UK (via Fedex) within 7–12 days of the original sampling for processing and sequencing.
DNA Extraction, Processing and Sequencing
In the UK, the filters were removed from the re-useable plastic housing using sterile tweezers under flame and transferred to a sterile 2 mL microcentrifuge tube with 900 μL of Longmire's lysis buffer and incubated at 65 °C for 10 min. Next, 9 mg of lysozyme was added to each tube and incubated at 37 °C for 30 min, followed by addition of 50 μL proteinase K (New England Biolabs; 800 units/mL) and incubation at 56 °C for 30 min. Then, 900 μL of phenol-chloroform-isoamyl alcohol (25:24:1) were added to each tube and samples were vortexed for 5–10 s, ensuring that the two liquid layers were well-mixed and centrifuged for 10 min. 700 μL of the aqueous layer was transferred to new 2 mL microcentrifuge tubes (Bosshard et al., 2000; Renshaw et al., 2015). Bacterial DNA was extracted from the samples using the Qiagen DNeasy PowerSoil extraction kit (Qiagen Ltd, Manchester, UK). DNA from each sample was spiked with DNA from Thermus thermophilus as an internal standard to allow for absolute quantitation of DNA concentration. T. Thermophilus DNA was added at 0.1% of the average DNA concentration of the extracted samples (Smets et al., 2016). The V4-V5 region of the 16S rRNA gene of both Archaea and Bacteria was amplified using the 515f/806r primer set (Walters et al., 2016), including Illumina adapters with Promega Go Taq Hot Start Polymerase. The 16S rRNA amplicons (20 μL) were then purified using 0.9 X Agentcourt AMPure XP paramagnetic beads (Beckman Coulter, Brea, CA, USA), quantified using Nanodrop (Thermo Scientific, Waltham, Massachusetts, USA) and submitted for Illumina MiSeq dual-indexed sequencing (300-bp paired end) to the Bioscience Technology Facility, University of York. 16S sequence data were converted into FASTQ files by the Illumina BaseSpace software. Next, the number of reads was clipped to 100,000 using a customised python-based script and the clipped, raw, paired-end sequence data were trimmed, de-multiplexed and quality filtered, followed by sequence alignment, operational taxonomic units (OTUs) picking against the Greengenes database, clustering, phylogenetic and taxonomic profiling and principle coordinate analysis of beta diversity using a qiime2-based pipeline (https://qiime2.org/). The gene abundances of OTUs across the different samples was calculated as follows: OTU gene abundance = No. of reads of OTUn * Total reads from sample / T. thermophilus reads. Clustering analysis was conducted using non-metric multidimensional scaling (NMDS) in R using the metaMDS function, with distances calculated based on Bray Curtis dissimilarity.
Construction and Use of a Simple Field Microscope
A simple microscope was constructed in communities during one of the workshops (Phase 3 workshops; see (Ensor et al., 2025) for details) as a method to support relationship building and knowledge sharing about contamination, water usage and sensor technology. The microscope consisted of a 2 mm spherical ball lens (Thorlabs) that was mounted centrally in a 3 cm×3 cm×2 mm black plastic housing. A frame was built from 7.5 cm×1.5 cm×0.5 cm wooden blocks (Kapla) so that the lens was secured above a battery operated, white LED light source. Water samples were placed on a standard microscope slide with a plastic Pasteur pipette and a cover slip was placed on top. The slide was mounted approximately 0.5 cm above the lens, and an iPad camera lens was oriented above this on the wooden block frame (Figure 2).
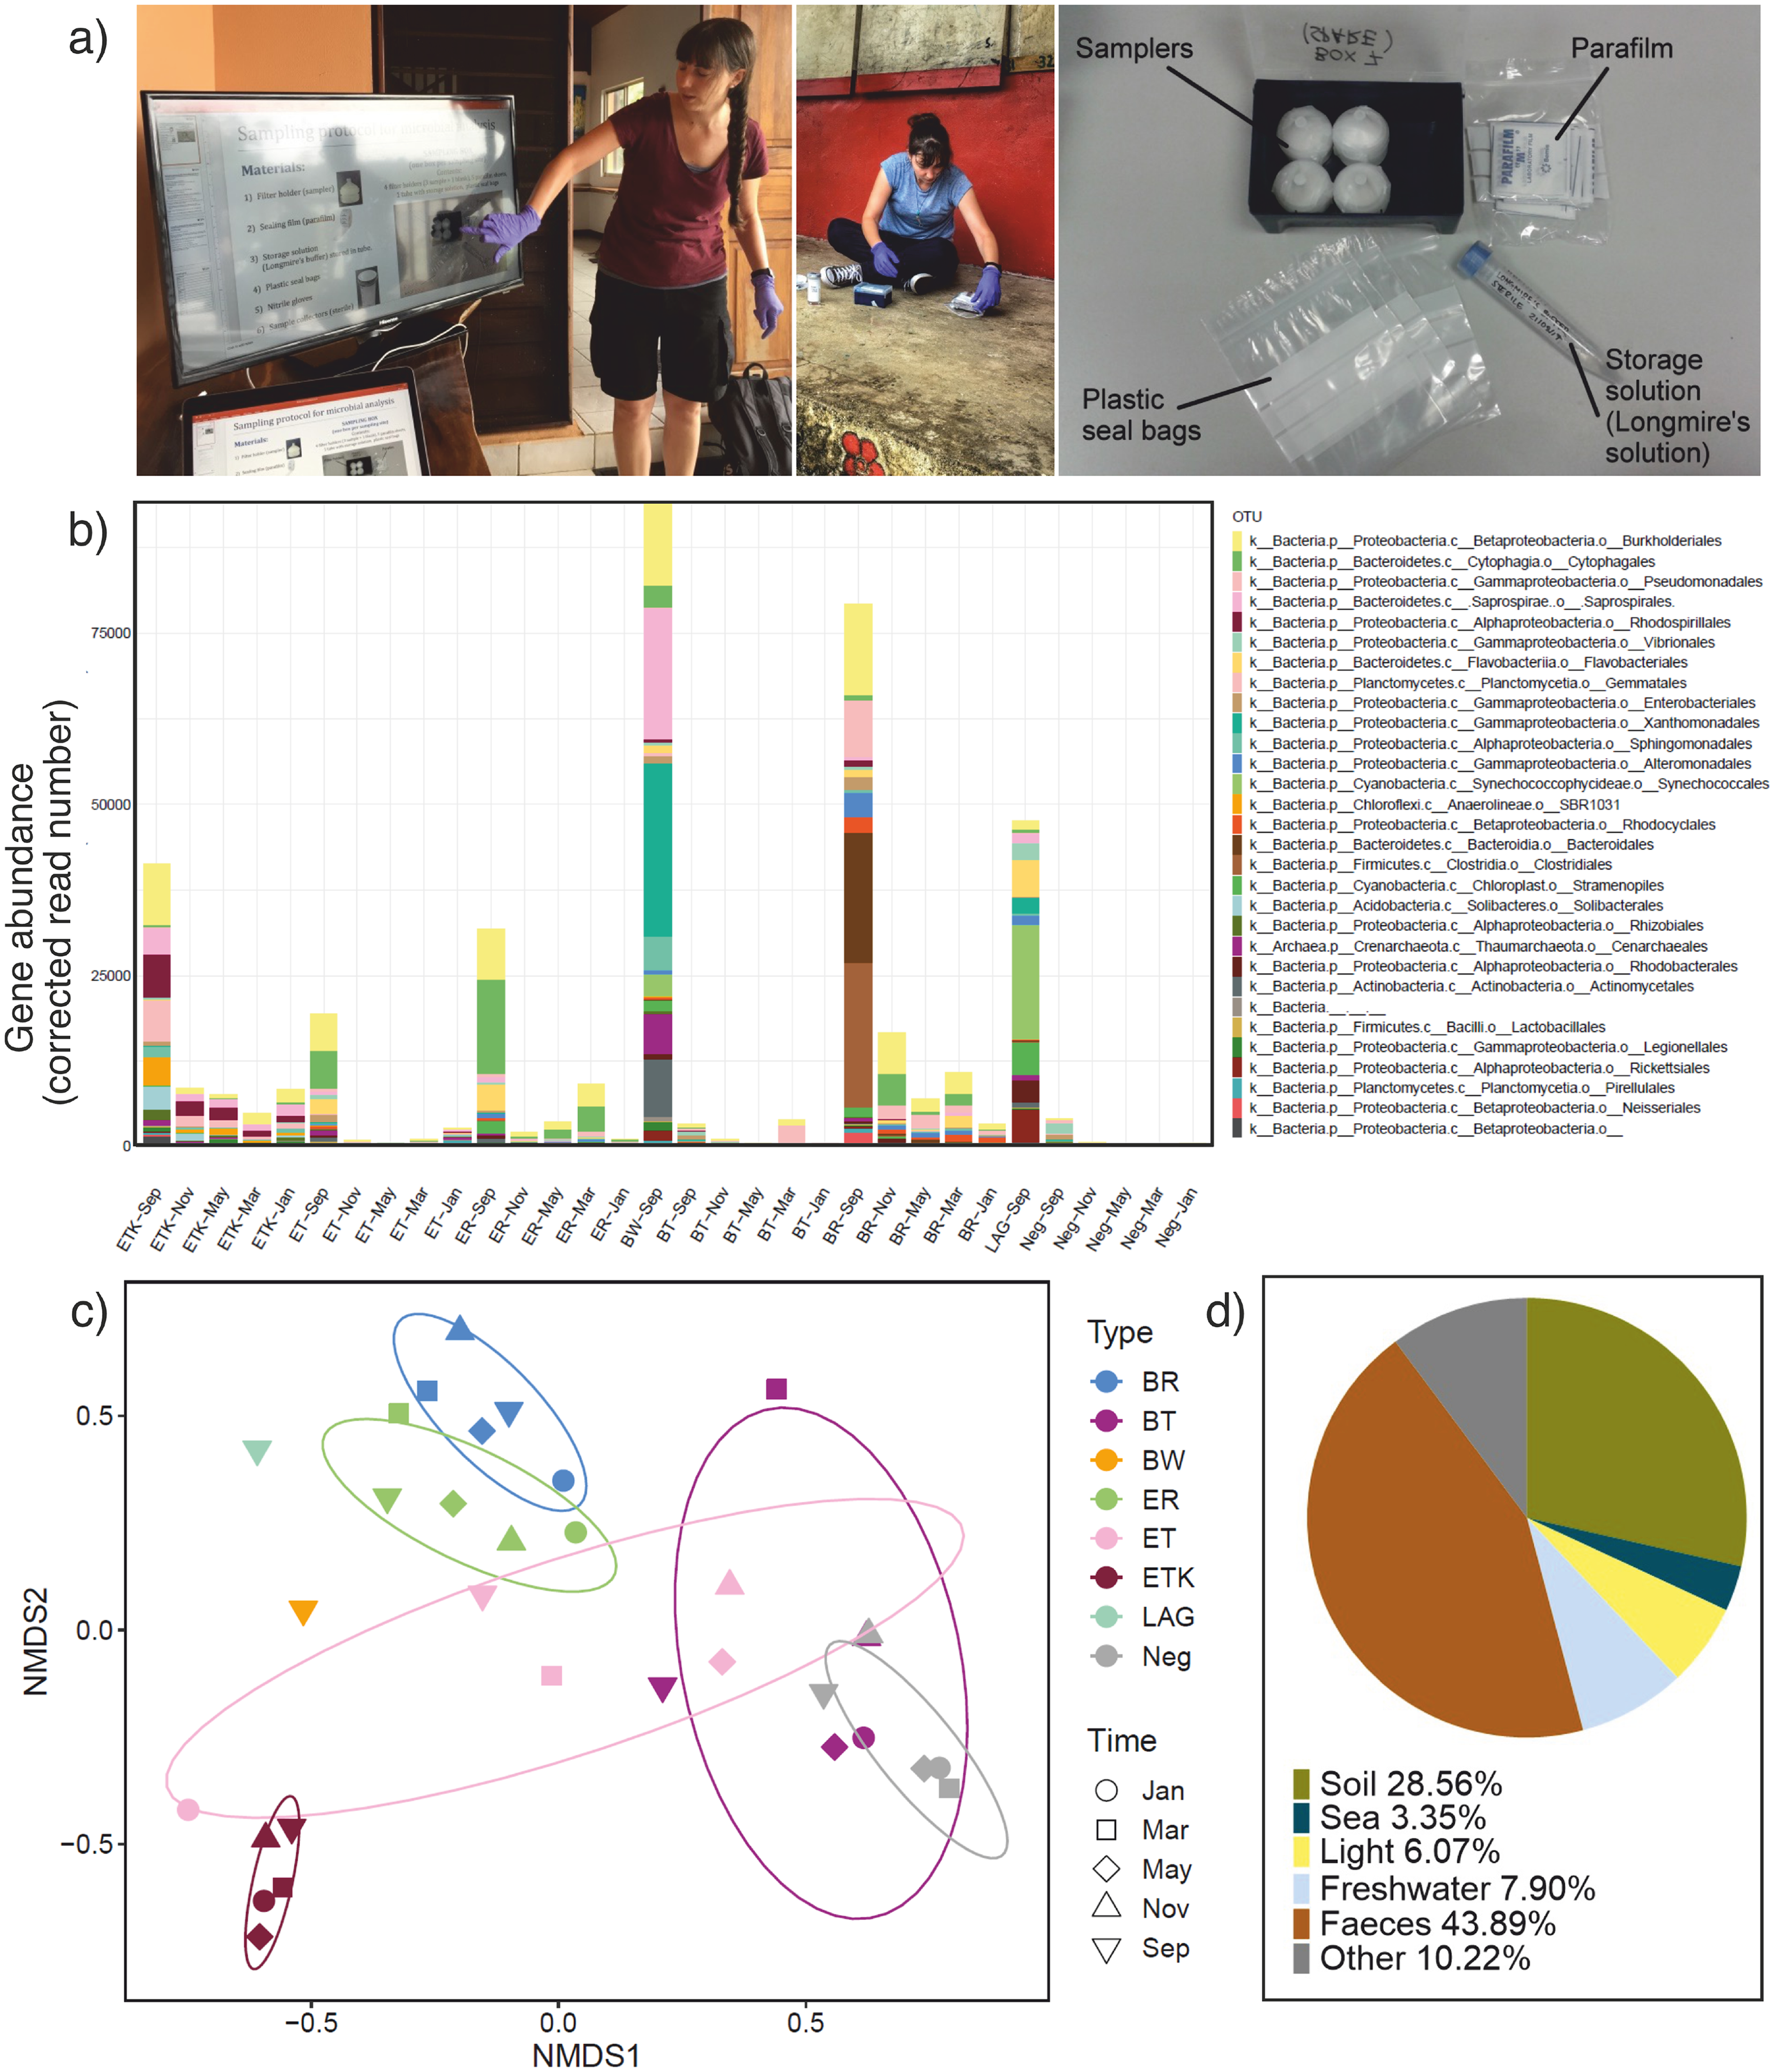
Analysis of microbial diversity in Vanuatu drinking water sources. (a) A simple water sampling kit and associated protocol that could be deployed for microbial sampling in the field was developed at the corresponding authors host institution and sterilised kits were shipped to Vanuatu where EK trained Oxfam staff and community members in aseptic water sampling. (b) Gene abundance of bacterial orders, based on 16S rDNA amplicon sequencing. The bars shown are from the 30 most abundant bacterial orders in all the water samples that were investigated in this study, each of which comprise > 0.05% of the total abundance amongst the identified sequences. The relative absolute abundance was assessed by spiking the DNA samples with DNA from Thermus thermophilus. Samples are named based on place (EP community: ETK - water TanK, ET - Tap, ER - River; BL community: BW - Well, BT - Tap, BR – River; LAG -Nambawan LAGoon; Negative control - Neg) and time (September 2017, November 2017, January 2018, MARch 2018, MAY2018).Orders typically found in faeces Bacteroidales and Clostridiales are shown in brown (dark and pale, respectively). (c) Ordination of sample clustering is illustrated using Non-metric multidimensional scaling (NMDS) based on Bray Curtis dissimilarity, using the same samples and abbreviations as in (b). (d) Example pie chart (for the BL river sampled in September 2017) used to communicate results of microbial sampling campaign with community members. The chart simply illustrates the relative abundance of microbial contamination as a function of origin (namely bacteria associated with soil, seawater and freshwater habitats, bacteria associated with faecal contamination, photosynthetic bacteria and others which could not be ascribed a specific niche).
The iPad camera under default conditions allowed the water sample to be brought into focus. This could be observed by the small group of people engaged in the facilitated workshops. Where available, the iPad images were projected on to a screen using a standard overhead projector. This allowed us to open up the demonstration to the wider community which attracted self-selecting audiences of 50–200 people.
Co-Produced Water Quality Monitoring Technology: Specification Acquisition
Building on conflict resolution methods deployed in the development sector (Taha et al., 2010), we employed a new participatory method, that we refer to as SHTEPS, that enables acquisition of the specifications (technical and institutional) for a potential, ‘imagined’ technology (Ensor et al., 2025). Community participants were first supported to analyse the impacts (positive and negative) of an existing and familiar technology (mobile phones) across the six SHTEPS categories: Social, Health, Technical/ financial, Environmental, Political/ institutional, and Sustainability. The SHTEPS approach was then deployed again, this time applied to a potential, hypothetical water quality monitoring technology from which technology specifications (both quantitative and qualitative) could be derived. Conversations were facilitated in relation to each category using a series of prompting questions e.g., What might the technology look and feel like? How will users interact with the technology and how will the result of a test be communicated and shared across the community? How will the sensor be powered, maintained and funded in the community? Questions were also posed that explore quantitative, technical attributes including, how fast should the test operate? How big/small should the sensor be? What is the acceptable power consumption? These conversations, supported by sketches, maps and role play, led to lists of positive and negative technical and institutional attributes, that would be maximised or minimised in the final design. It is important to note, the project scientists were not simply observers in the process. Rather, they were active participants, responding to questions raised by community participants and contributing their own knowledge and needs when there were clear technical opportunities or constraints. For example, one community (BA) raised questions about whether the technology could be used to not only indicate water quality but also to identify sources of contamination and to inform appropriate remediation measures. This led to detailed discussions of how the technology could be engineered to quantify microbial contamination and deployed to map spatial and temporal changes in contamination. These discussions demand attentive facilitation by individuals cognisant of local context and able to understand and bridge power imbalances and different bodies of knowledge that exist between the community and the project team.
Co-Produced Water Quality Monitoring Technology: Prototype Evaluation
Informed by the technology specifications co-developed through the SHTEPS process, prototypes of a water quality monitoring technology were designed, tested and refined in the laboratories at the University of York. While much of this work was performed away from Vanuatu, the communities remained engaged in the process and were given updates through a combination of videos recorded by the project scientists and through inspection of a physical prototype. Questions, comments and recommendations from the community were sent back to the project team by email, with responses shared by facilitators.
Culturing E. coli
E. coli W3110 was stored in 25% glycerol at −70 oC in the corresponding authors host institution. The strain was cultured on LB agar plates or in liquid culture in 5 ml LB in a 25 ml McCartney bottle shaken at 225 rpm. Selective growth of E. coli was carried out on solid or liquid MacConkey MUG agar (Sigma-Aldrich 63014) or MacConkey broth (VWR 84680). E. coli was routinely cultured at 37 oC, and selective culturing of faecal coliforms (including E. coli) could also be achieved at 44 oC.
Environmental Water Testing
Approximately 2 L of river water was collected from the River Ouse, York (53.945568, −1.081000). 450 mL samples were filter sterilised using a vacuum bottle-top filter unit and 0.22 µm filter (MF-Millipore 0.22 µm MCE Membrane GSWP04700). After filtering 100 mL of the sample, the filter was removed and pressed face-down onto MacConkey MUG Agar plate. This was repeated for 50 mL and 10 mL samples. The plates were incubated with filters at room temperature for 1 h, filters removed and plates incubated at 40 °C overnight. MUG Agar plates were incubated for 18 h and viewed under UV light (UVP UV Transilluminator, Low intensity). Blue colonies indicative of E. coli were counted (samples were also sequenced using 16S primers; see below for methodology). The remaining 290 mL water was filtered after these samples were taken. Broth was prepared by adding 1.75 g MacConkey Broth granules in each bottle. 100 mL bottles for the co-developed water quality monitoring technology (referred to as VBox) and caps were from Richmond Containers (BP4OZC, BR338EPE). The VBox ran overnight (approx. 16 h). The data was analysed using a custom python script (to convert the .LOG file to .CSV) and then in an R environment to evaluate the time taken for change in colour and turbidity signifying detectable growth of E. coli / faecal coliforms.
16S rRNA Sequencing from Bacterial Colonies
Bacterial colonies were picked into 100 µL PCR-grade water and lysed by boiling at 100°C for 5 mins. A 50 µL PCR was performed for bacterial 16S using Universal Primers 27F and 1492R (27F AGAGTTTGATCMTGGCTCAG 1492R CGGTTACCTTGTTACGACTT) and the Promega GoTaq G2 system (M7845). Final concentration of reagents in reaction: 1X colourless buffer, 1.5 mM MgCl2, 0.2 mM dNTPs, 0.2 µM forward primer, 0.2 µM reverse primer, 1.25U Taq Polymerase, 5 µL template, PCR water to 50 µL. PCR reaction was performed in a BioRad T100 Thermal Cycler with the programme consisting of 95°C for 5 min, 35 cycles: 95°C, 30 s; 53°C, 45 s; 72°C, 1 min, final extension 72°C for 10 mins, hold 4°C. PCR purification was performed using Qiagen QIAquick PCR Purification Kit (28106), DNA eluted in 50 µL PCR water. The DNA concentration was determined by Nanodrop (ND_1000) and diluted in accordance with Source Bioscience requirements for Sanger sequencing.
Results and Discussion
A variety of participatory and creative methods were employed to generate a shared understanding of the use, access and quality of community water sources, and to co-develop the requirements for a socio-technical solution for sensing water contamination in Vanuatu. These methods allowed us to move beyond the power inequalities that routinely prevent joint knowledge production in technology development (Almekinders et al., 2019). The conceptual framework underpinning our participatory approach to innovation and the full range of associated methods are described by us elsewhere (Ensor et al., 2025). Here, we focus on three, interlinked methods that allowed us to develop a set of technical (quantitative and qualitative) specifications for a device to measure contaminated water, and the associated institutions required to provide a functional and sustainable solution for water quality monitoring.
Assessing the Microbiological Quality of Drinking Water Sources in Vanuatu
To assess the microbiological quality of drinking water sources in two communities in Vanuatu that formed part of this study, we undertook a longitudinal sampling and analysis campaign. In addition to providing key information on the quality and variability of water (by source, and over time), this activity allowed us to (i) explore the challenges and hurdles of carrying out field analysis in these settings, (ii) engage communities in a conversation about water quality and sensing technologies, (iii) introduce communities to microbiological concepts through the campaign itself and via discussion of the key findings. These conversations were critical to inform a shared understanding of the social and technical specifications for water sensing technologies that would be appropriate for use in the context of communities in Vanuatu.
Oxfam in Vanuatu facilitators (MD) and community members were trained in water sampling methods by a post-doctoral researcher (EK) during field visits to BL and EP (Figure 1a). Water samples, alongside control samples, were collected from six drinking water sources, from the two different communities over the course of 9 months, using sterilised sampling kits shown in Figure 1a) that were prepared at the University of York, UK. Particulate material was collected on filters, then stored and transported to the UK for total DNA extraction. DNA sequencing, following amplification of 16S rDNA and inclusion of a control bacterial DNA (Thermus thermophilus) revealed spatio-temporal variations in prokaryote abundance and diversity. We used abundance of bacteria from the orders Bacteriales and Clostridiales as an indicator of faecal contamination. In river water from the periurban informal BL community, up to 30–40% of the bacteria present were from these taxa at one particular time point, indicating intense contamination by faeces. Elevated contamination was especially observed at the September sampling point which took place shortly after a period of heavy rainfall. Sequences from the archaeon Methanobrevibacter which is typically associated with mammalian gut microbiome, were also identified in BL river at this time. Other drinking water sources tested had > 100× fewer Bacteriales and Clostridiales and no Methanobrevibacter consistent with variable, but frequently low-level faecal contamination.
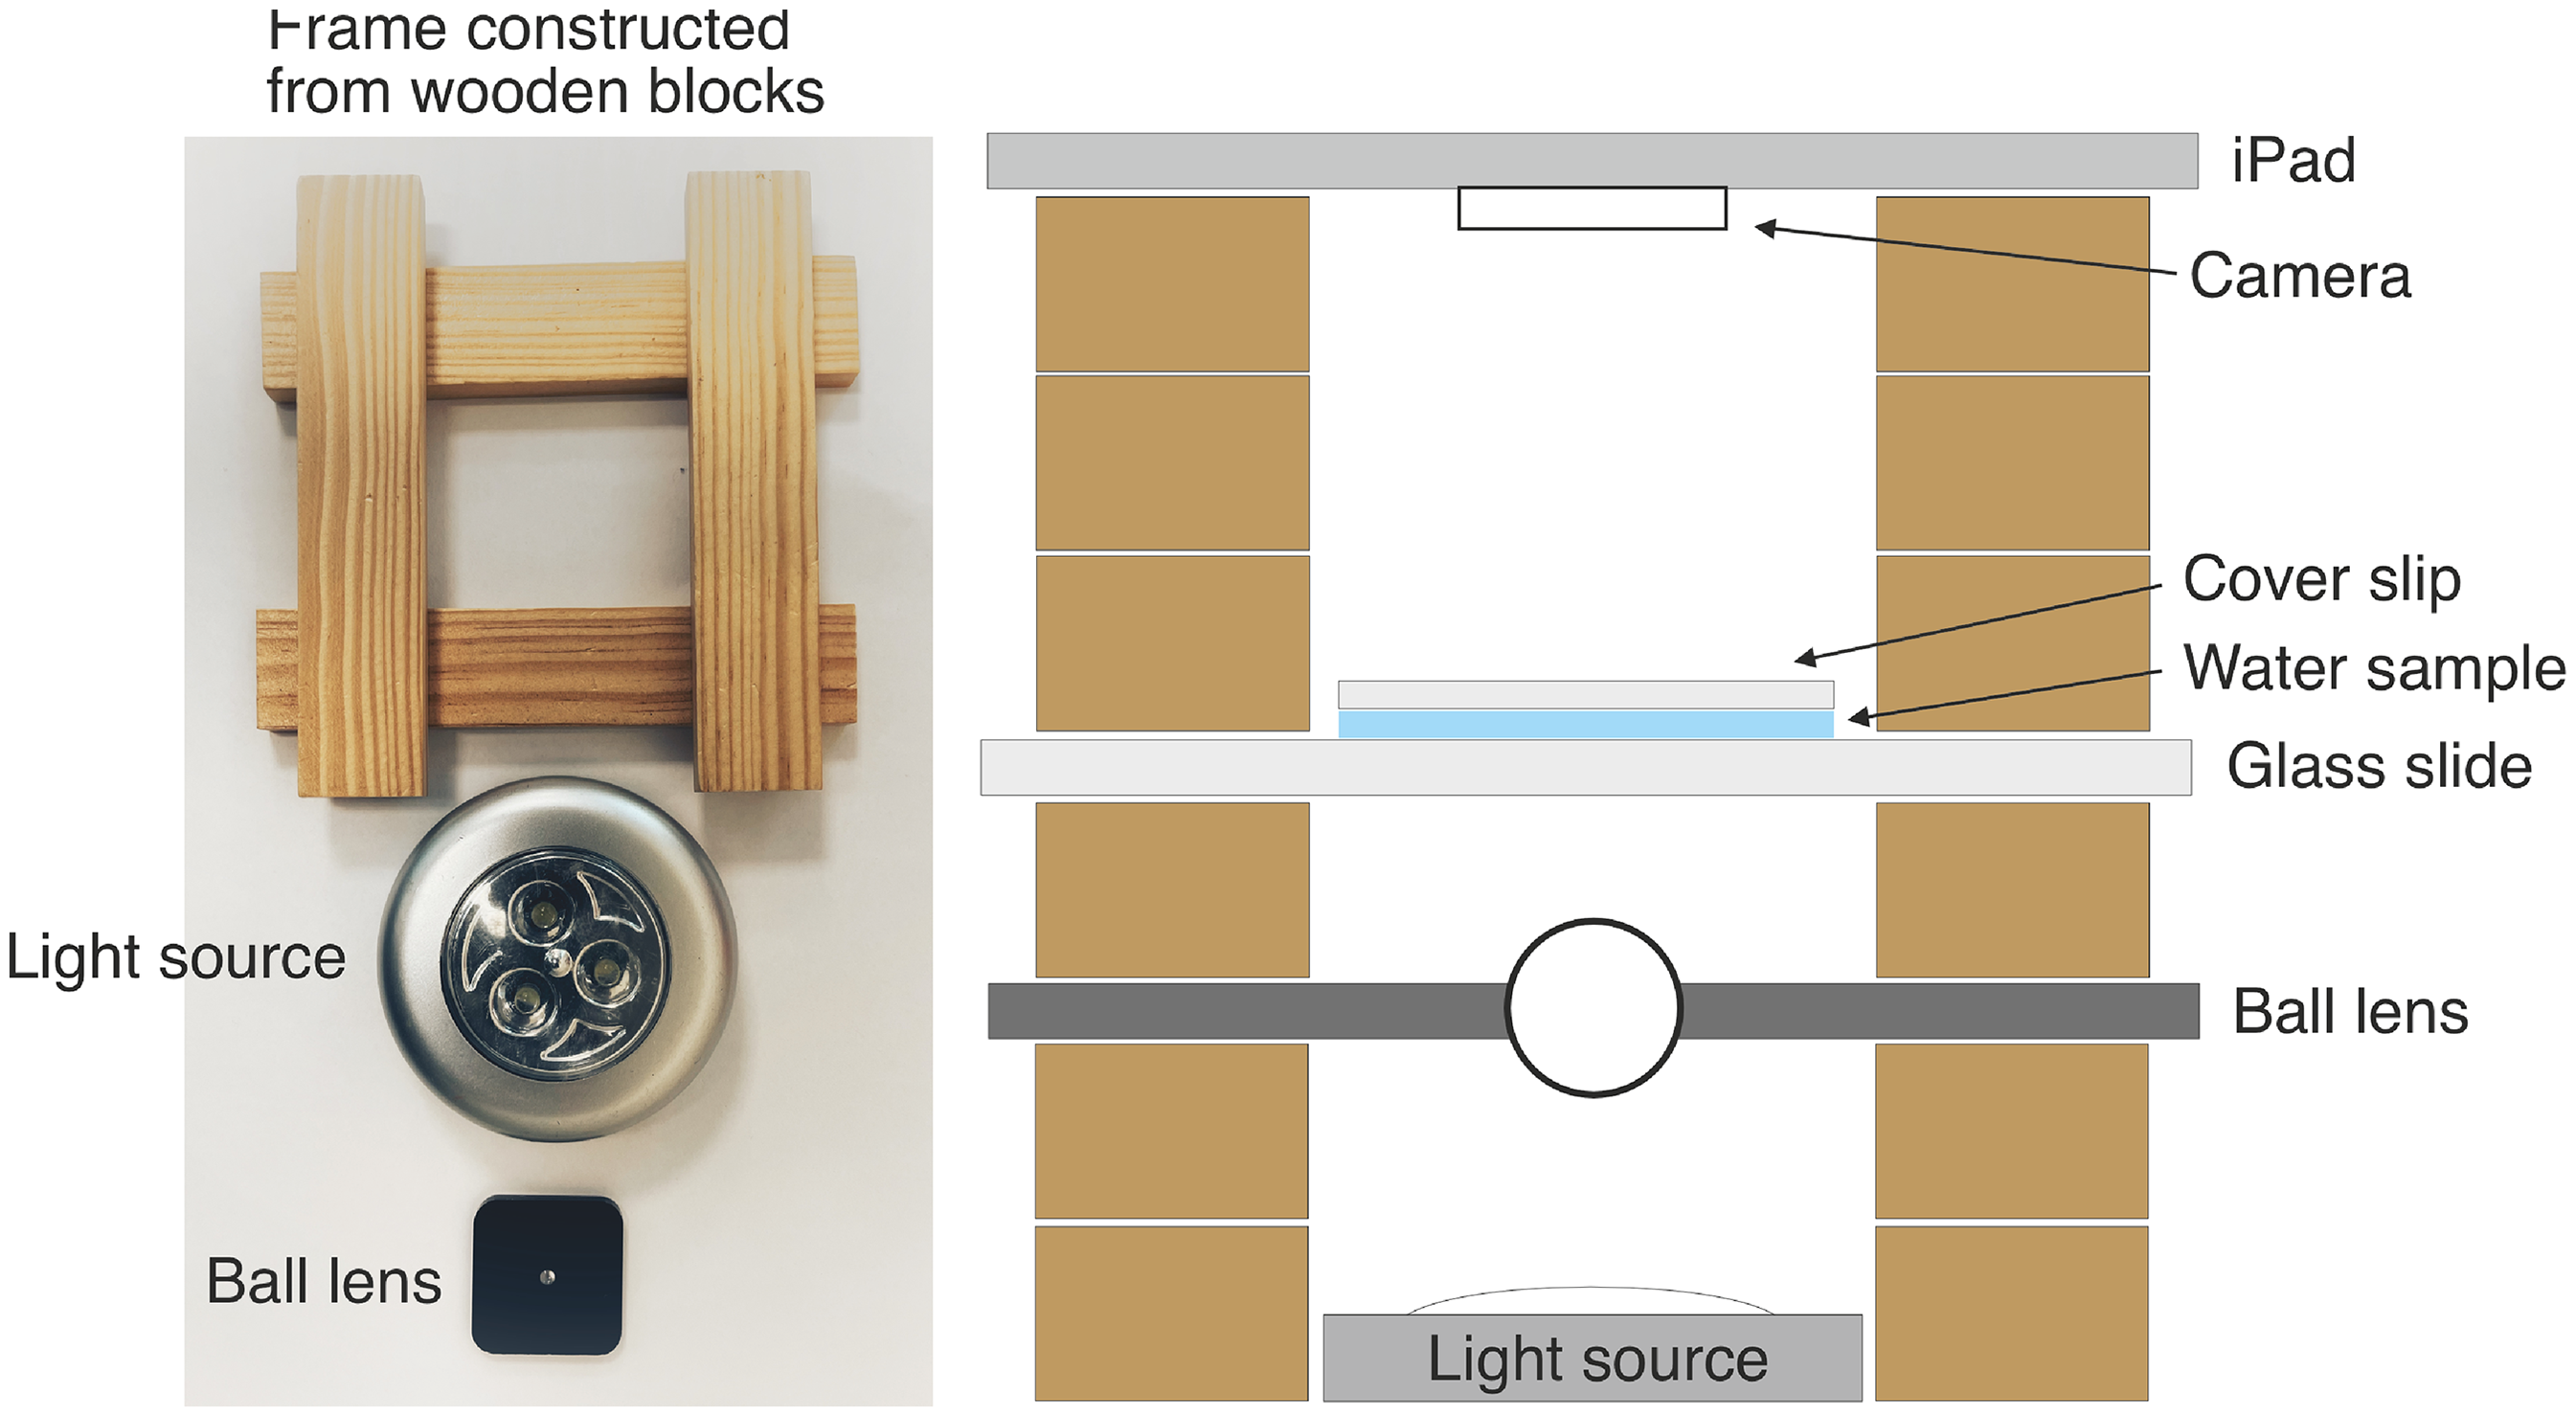
A field microscope. Diagrammatic representation showing the features of a simple field microscope that could be constructed using wooden blocks, a battery-operated LED light source and a simple ball lens in a plastic housing, as shown in photograph.
Figure 1b shows the distribution of prokaryotic sequences at Order level across sampling sites between September 2017 and May 2018. The Figure includes data from the 30 most abundant orders, each comprising > 0.05% of the overall bacterial abundance sampled, and together representing > 90% of the total bacterial abundance measured. The Bacterial abundance and the distribution of taxa varies over time and location, but some key messages can be drawn out: (i) the municipal tap water in the WR community (BT) and the gravity-fed tap water in EP (ET) both have very low abundance of bacteria compared to other water sources, at all time points, (ii) bacterial abundance was highest in September 2017, a sampling period immediately after a period of heavy rain, (iii) taxa indicative of faecal contamination (Bacteroidales and Clostridiales, coloured brown in Figure 1b) were identifiable as a significant fraction of the bacteria in the BL river drinking water source, but only at one sampling point (September 2017) in the current campaign. Non-metric multidimensional scaling (NMDS) shows the clustering of microbial diversity within and between locations and over time (Figure 1c). There is typically consistency over time for a given site. BL community tap water (municipal water system) and negative controls cluster well, as do the two river water sources in EP and the BL community. The gravity-fed tap water system in EP is the least consistent water source over time.
A summary illustration in the form of simple, comprehensible pie charts was generated to show the key features for a discussion with the communities (examples shown in Figure 1d). These charts stimulated conversations about the seasonal and spatial variation in water quality in communities, detailed and nuanced discussions about the origins of microbial contamination and indicator species, and concepts associated with sensor technology, such as sensitivity, specificity and false positives/negatives. The microbial quality data for the two communities was also shared with the Department of Water Resources (DoWR) in Vanuatu. At the request of the DoWR, we included in our analysis an amplicon sequence analysis of water samples from Nambawan (No. 1) Lagoon; a marine water course close to the capital city, Port Vila, where concerns had previously been raised about water quality. The lagoon showed no sign of significant faecal contamination (Figure 1b), and the samples cluster most closely with river water samples (Figure 1c).
A Field Microscope
To further build a shared understanding of the microbiology of water and the value of sensor technology to reveal microbiological contamination, we designed a simple microscope that could be constructed in situ, in a community setting in Vanuatu, to allow visualisation of microbes in local water samples. The direct construction of the microscope in front of a community audience demystified the technology, whilst allowing us to directly view magnified microbial components from water samples on an iPad screen (and subsequently for a larger audience on a projector screen).
The microscope, constructed using wooden blocks, a ball lens, white LED light source and an iPad camera, allowed water samples collected in the community to be viewed and microorganisms identified on the screen (Figure 2). With the support of skilled facilitators, this opened up wide and deep conversations about contamination, the role of technologies to reveal apparently ‘invisible’ contaminants and the nature of bacteria (including their positive functions for humans and the environment). Community members found this activity highly engaging and, for the most part, entirely new and surprising. In half of the communities, the scientists were invited to construct the microscope for a second time to allow more community members to view the samples.
Considerable time was invested in this process as a shared understanding of microbial contamination alongside concepts associated with sensor technology was critical for subsequent technology co-development. Moreover, the performative and interactive nature of the demonstration helped build cooperation and trust between the participants and scientists. We note, while the aim was to exchange knowledge about contamination of drinking water, engagement in this process led to a wider appreciation of sanitation and hygiene. For example, in one community, the participants independently linked concepts of microbial contamination to the need for hand washing prior to eating or preparing food. This highlights an important observation; while knowledge exchange should adopt methods that are culturally sensitive and delivered at an academic level appropriate for the audience, with careful design and the support of skilled facilitators, these activities can support exchange of complex scientific or technological concepts and deliver new experiences and opportunities for learning both within the community and between community members and the research team.
Specifications for an Appropriate Technology: SHTEPS
The field microscope and molecular analysis of water quality provided an arena in which the scientists and the communities could share their respective knowledge about water and water quality. This was subsequently built upon through structured workshops to define the specifications (quantitative and qualitative, technical and institutional) for potential water quality monitoring technologies. This was achieved through the SHTEPS participatory method introduced in Section 2.4, in which community participants explored the potential impacts (positive and negative) of a water sensor technology across the six SHTEPS categories (Social, Health, Technical/ financial, Environmental, Political/ institutional, and Sustainability). This led to lists of positive and negative technical and institutional attributes, that would be maximised or minimised in the final design. A summary list of technical and institutional specifications for a single community is shown in Table 1.
Specifications for Water Monitoring Technology, Derived from SHTEPS Analysis.
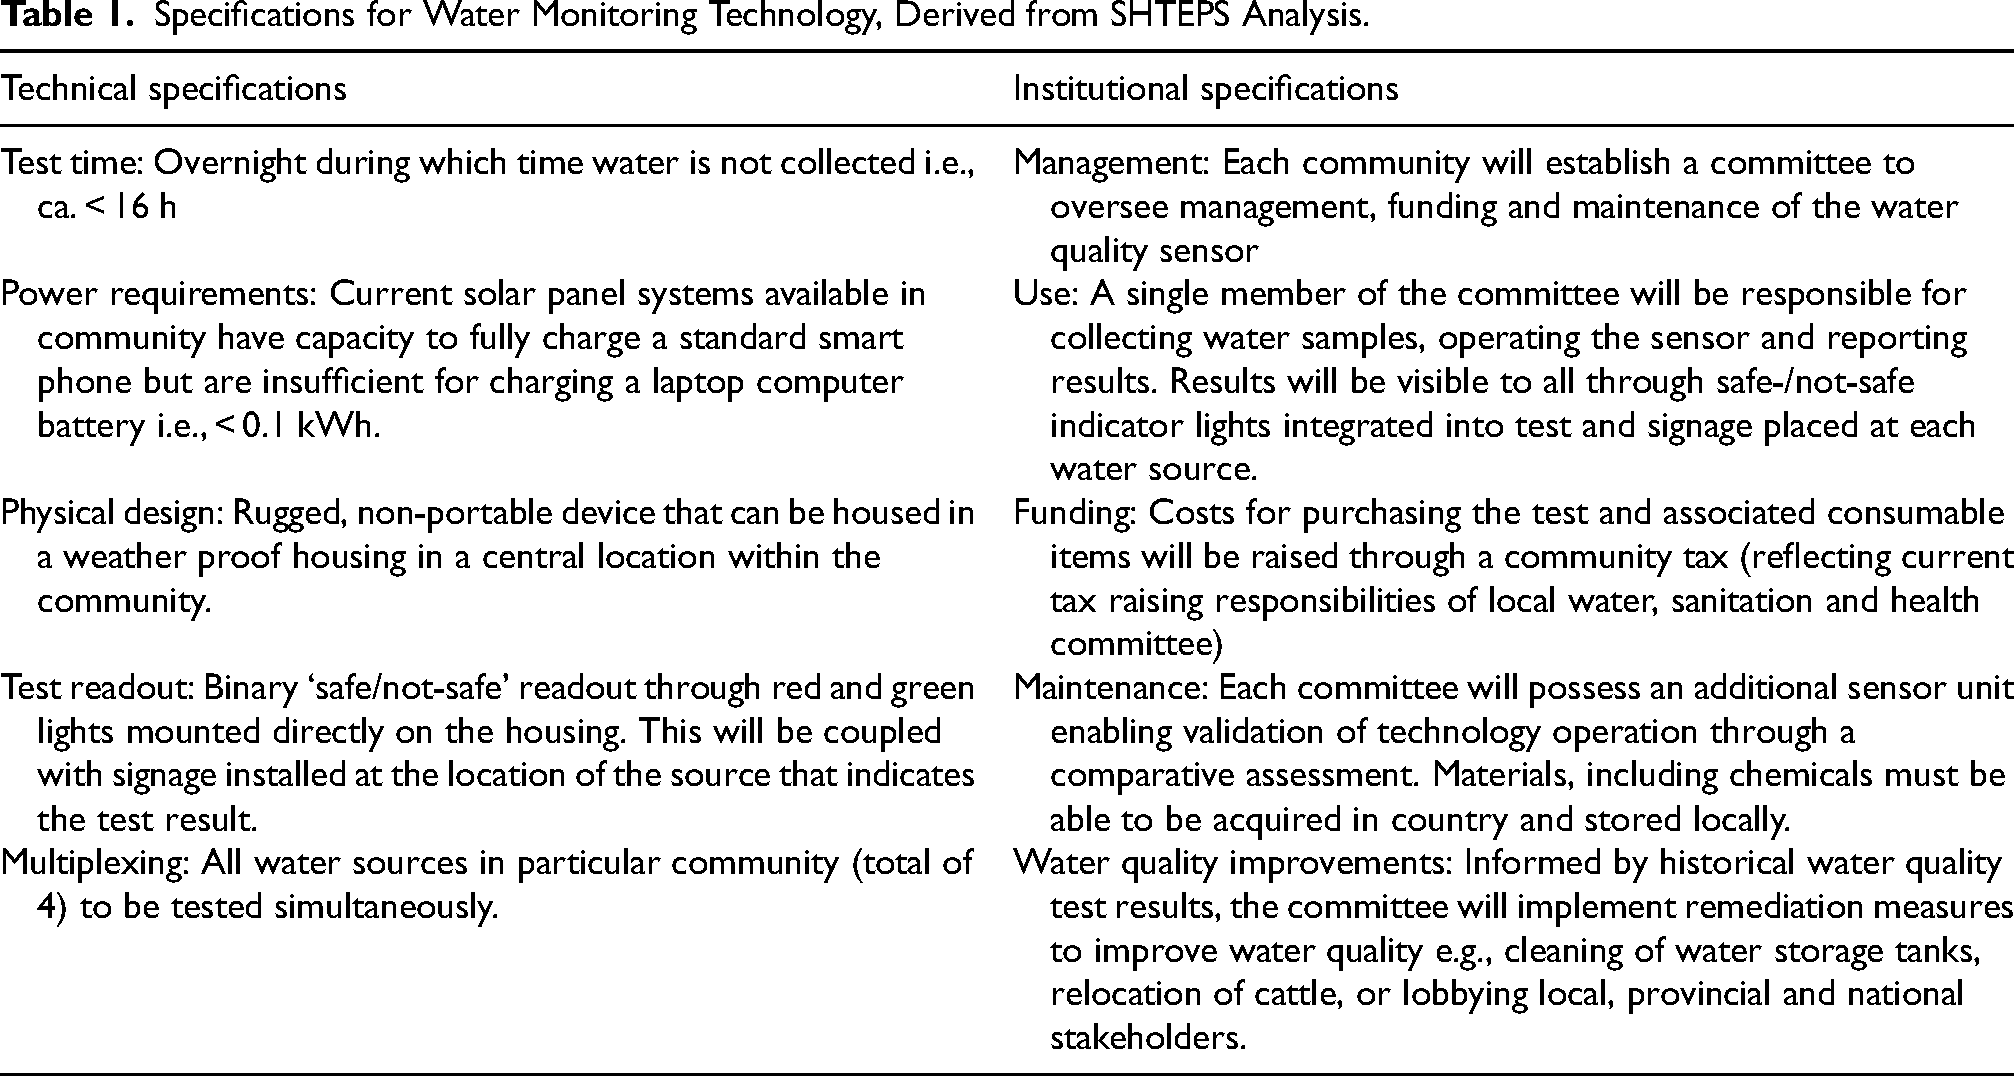
Prior to community engagement activities, the scientists and engineers associated with the project had perceived potential concepts for the water quality monitoring technology. The specifications and mode of operation of these systems was informed by academic expertise, WHO water quality standards and by peer reviewed literature on water quality testing in resource-limited settings. This literature widely emphasises the need for portable devices that are low cost, rapid and simple to use with minimal user training (for example Choi et al., 2016; Zheng et al., 2019). At first sight, this list of characteristics appears reasonable and appropriate, if lacking in quantitative detail. As shown in Table 1, it is striking that our approach to technology co-development revealed a set of characteristics that were quantifiable (e.g., time-to-result <16 h,) and aligned with local technical infrastructure and experience (e.g., powered using widely available 100 W solar panel coupled with 65 Ah dry cell battery).
Table 1 also reveals that in some cases, the co-developed specifications contradicted the accepted view. For example, communities engaged in this project expressed a preference for a centralised, rugged and fixed sensor technology, in stark contrast to the established view of decentralised testing using portable water quality sensors. A fixed sensor would enable individual community members to see the results of a test for themselves, and thus address issues of trust, be more robust than a portable technology and less likely to create jealousy and discontent within and between communities where ownership of a portable technology could vary between households.
We stress, the preference for a centralised model of water quality testing emerged from communities reflecting their social context. It is likely this would have been neglected without a participatory approach to technology co-design. Furthermore, this preference not only informs the engineering and technological choices but also the institutional arrangements that shape the acceptance, use and long-term impact of a technology. For example, a centralised system enables the cost of the technology and associated consumables to be spread across the community, and simplifies training needs as only those individuals nominated by the community require training in the use and maintenance of the technology. This emphasises the need to understand technology as a socio-technical object in which both the technical solutions and institutional design are interlinked and need to be considered together in an iterative process of co-development.
Development of a Physical Technology to Detect Faecal Contamination
Informed by the co-developed technology specifications shown in Table 1, the final technology (referred to as VBox and shown in Figure 3) was based on colorimetric sensing of a solution-based culture using MacConkey Broth that is used widely for the enrichment of Enterobacteriaceae. The broth contains lactose as a carbon and energy source for Gram-negative, lactose-fermenting bacteria, such as E. coli. Bacteria degrade the lactose to lactic acid resulting in a pH change which is detected through a colorimetric pH indicator, here bromocresol purple which changes the colour of the media from violet to yellow. To increase the specificity and selectivity of the test, the broth was heated to 44 oC to select for thermotolerant bacteria, including the so-called faecal coliforms. The colour change can be observed directly by eye (inset of Figure 4a) however to increase the sensitivity and speed of the test and to explore quantification of the faecal coliform concentration, an electronic colorimetric read-out was designed and tested. A narrow angle (viewing cone angle 15°), LED operating at 590 nm (bandwidth 13 nm, HLMP-EL1A, Broadcom) corresponding to the maximum absorption wavelength of bromocresol purple was used as the light source. The LED was powered via a driver circuit to provide a stable current of ca. 50 mA. The LED was mounted such that the emitted light was incident on a 100 mL capacity bottle (WHO standards for water quality are measured in terms of cfu/100 mL) and the light transmitted through the water sample was detected using a silicon photodiode with built in transimpedance amplifier (OP101, Texas Instruments) mounted at 180° to the LED optical path. The output of the photodiode was connected to an analogue input of a microcontroller platform (Hercules RM46x LaunchPad Development Kit, Texas Instruments). A PID control loop implemented on the microcontroller regulated the temperature of the 100 mL sample using resistive heating foil (THERM12V3W, Thermo Technologies) and a temperature sensor IC (LMT86, Texas Instruments), both mounted on the bottle holder using thermally conductive tape. Four identical systems (consisting of separate LEDs, photodiodes, heaters and temperature sensors), all controlled independently by a single microcontroller, were implemented in a single polypropylene, waterproof housing (2717.B, Explorer Cases) enabling simultaneous measurement of four separate water samples. The housing was thermally insulated using foam allowing each chamber to be maintained at 44 °C suitable to selective growth of thermotolerant bacteria such as those associated with the mammalian gut microbiome.
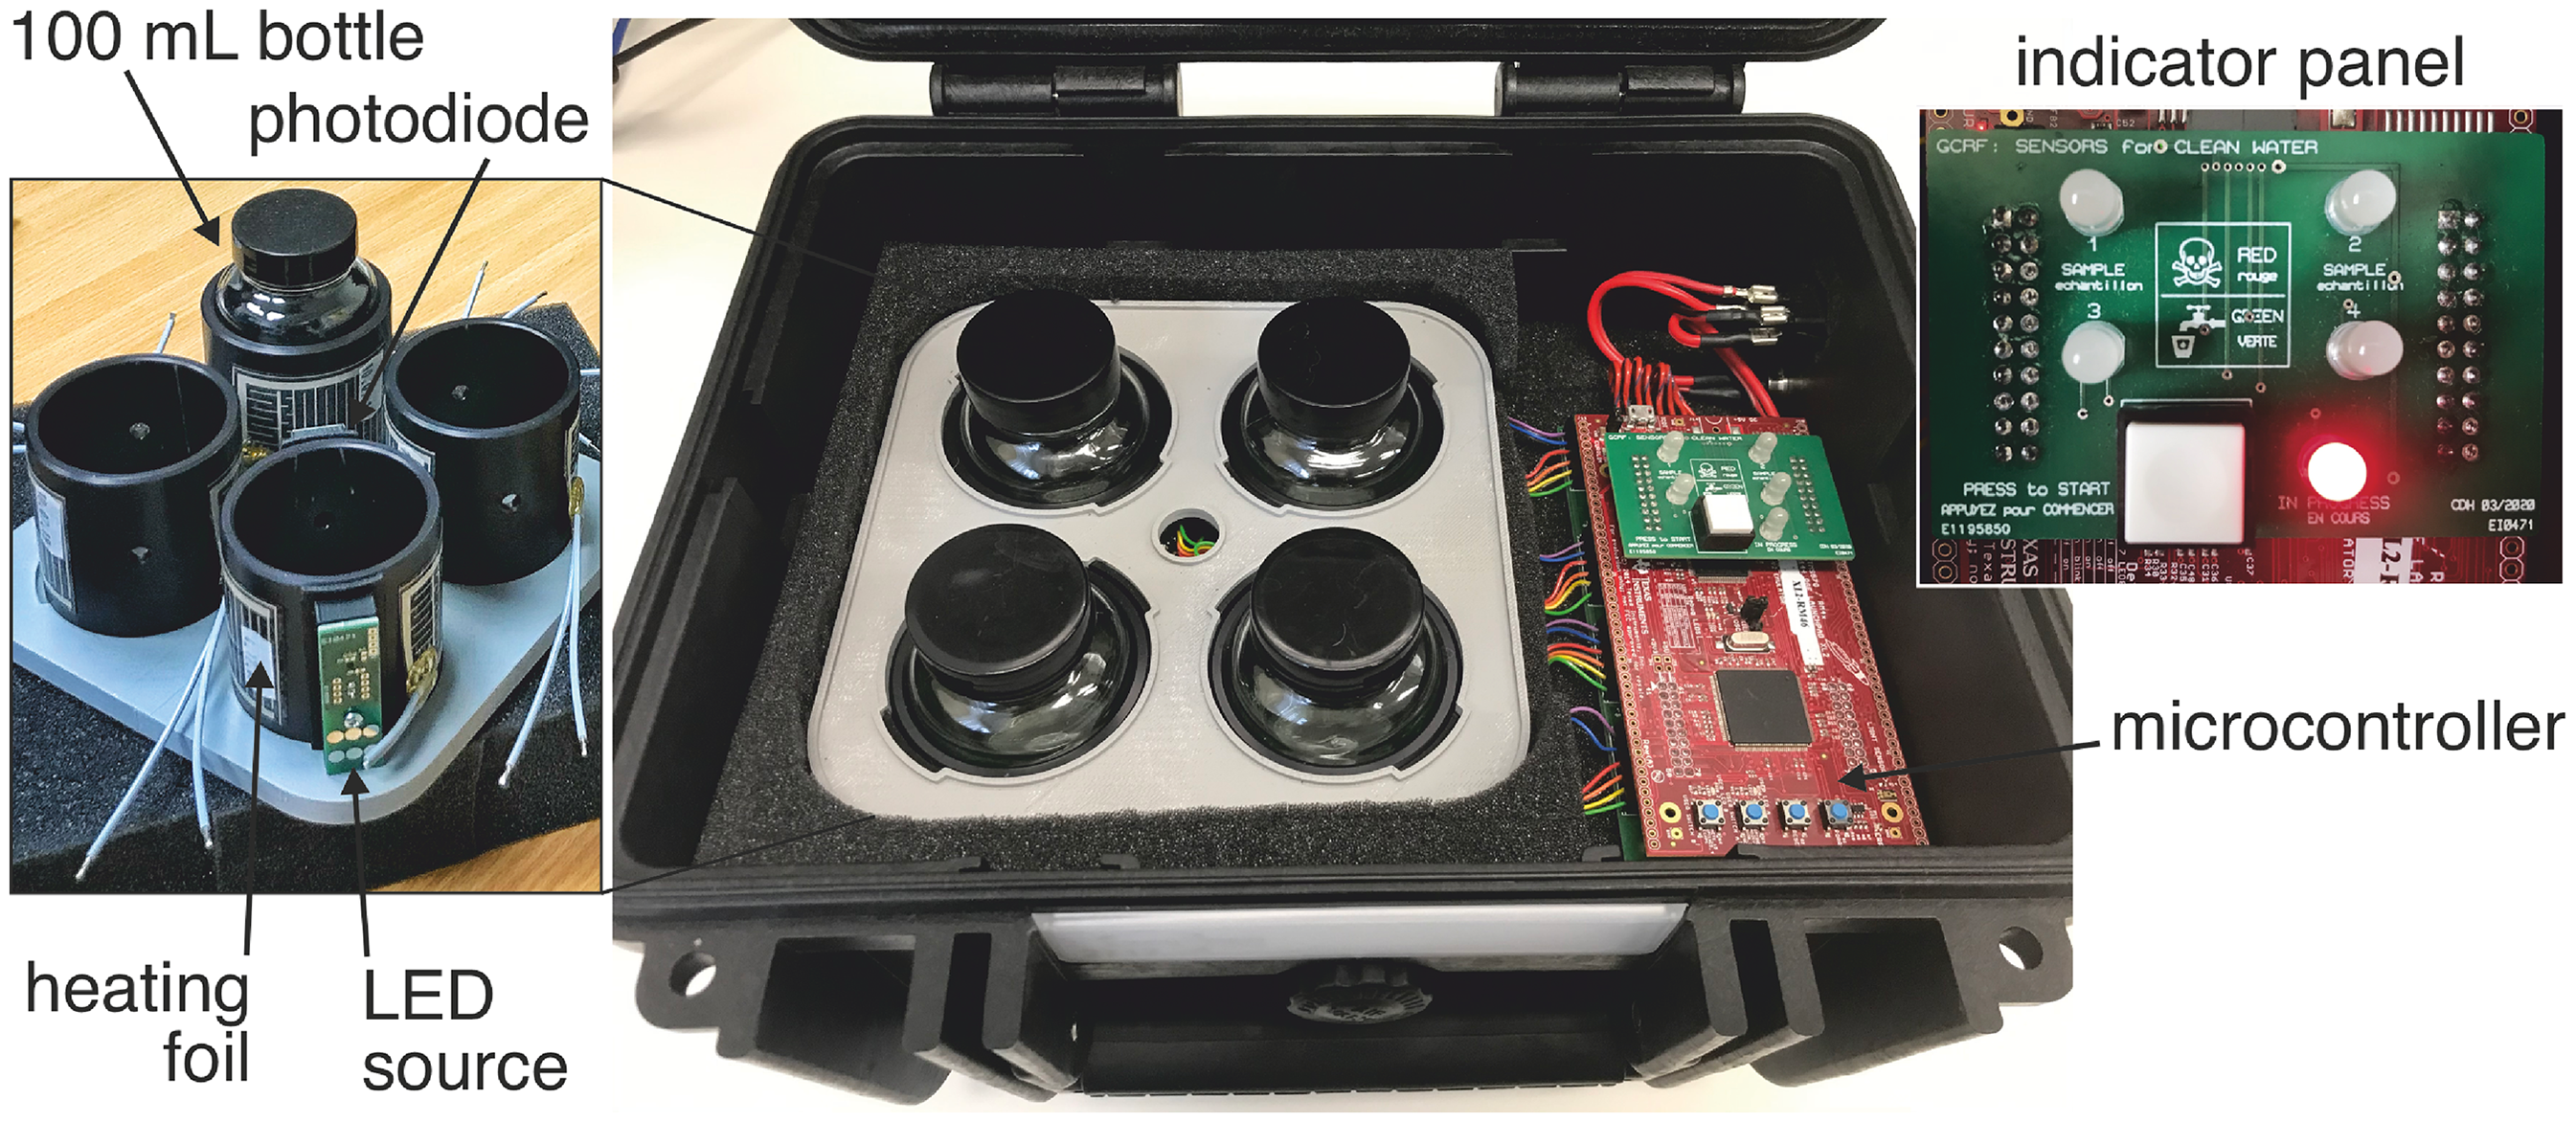
Complete, four channel VBox system. The VBox consists of four separate colorimetric sensors that are operated independently using a single microcontroller. Each channel includes a 100 mL sample bottle containing the MacConkey broth and an LED and photodiode to monitor the colour and turbidity change resulting from bacterial growth. The broth in each bottle is heated to 44 oC using heater foil to select for thermotolerant bacteria. An indicator panel reports the operational status of the system (on/off) and communicates the test result via a bi-colour (red/green) LED providing a comprehensible, binary read-out.
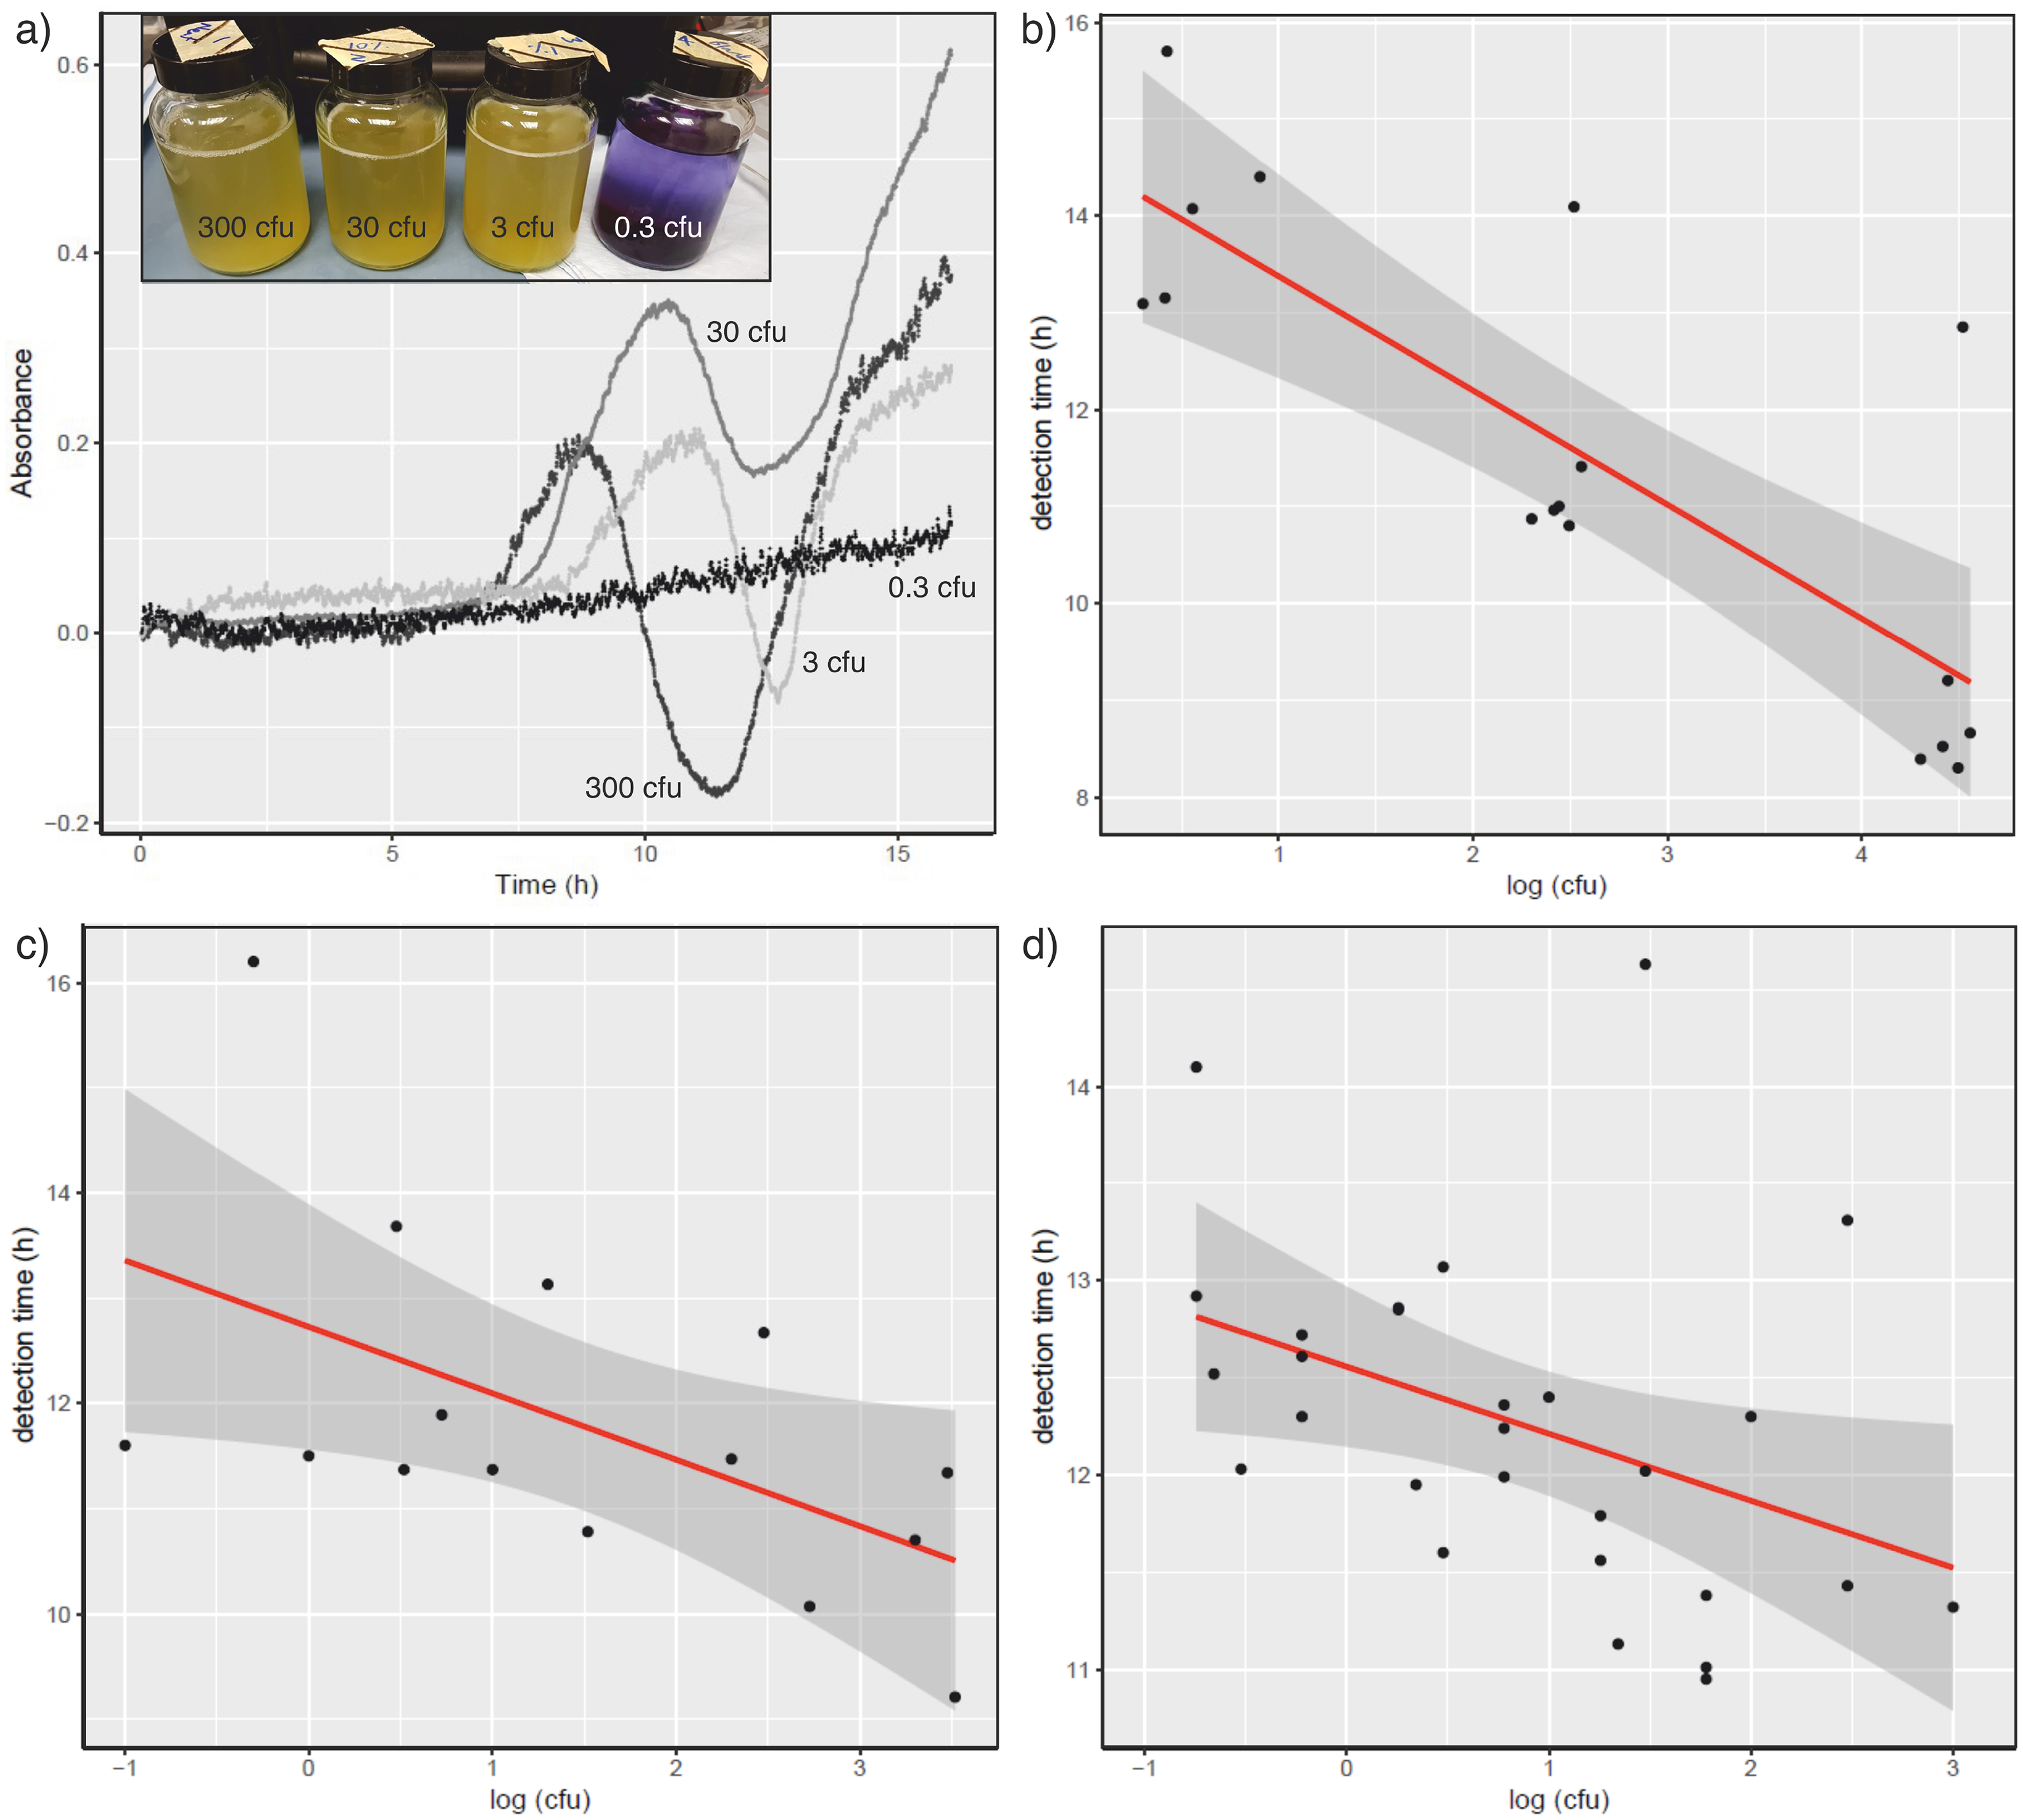
Detection of E. coli growth in VBox. (a) E. coli was inoculated into 100 mL vessels in the VBox device and absorbance measured over 16 h. The biphasic change in absorbance is readily observed following inoculation with 300 (dark grey), 30 (mid-grey) or 3 (pale grey) cfu E. coli W3110. Inoculation with an estimated 0.3 cfu E. coli W3110 (black line) revealed no observable growth of E. coli or absorbance change features. Inset: Visual observation after 16 h growth of E. coli cultures used in the VBox. The vessels shown are MacConkey broth inoculated with (l-r) 300, 30, 3, 0.3 cfu E. coli W3110. (b) Relationship between time for detection of growth over time on inoculating E. coli W3110 into MacConkey media made using deionised water. (c) Relationship between time for detection of growth over time on inoculating E. coli W3110 into MacConkey media made using filter-sterilized river water as the aqueous matrix for the media. (d) Relationship between time for detection of growth over time using MacConkey media made using river water for both the aqueous matrix and the source of faecal coliform bacteria.
Detection of Faecal Indicator Species: Cultured E. coli
E. coli W3110 was cultured on LB agar plates for 24 h at 37 °C. Single colonies were picked from such plates and inoculated into 5 mL LB in McCartney bottles. After 3 h under agitation at 225 rpm, cultures were diluted to (i) quantify E. coli cfu/mL, and (ii) to inoculate into MacConkey broth in the VBox to assess the capacity of the device to measure E. coli growth. The four chambers of the VBox were inoculated with different concentrations of E. coli, in order to assess the time taken to measure E. coli growth and the limit of detection of the method. Following inoculation, the device chambers were maintained at 44 °C, and the transmission of 590 nm light was measured for a period of 16 h. Inoculation with E. coli led to a distinctive biphasic change in optical density (Figure 4), due to (a) optical absorption by the pH dependent bromocresol purple chromophore and (b) optical scattering due to the change in turbidity caused by E. coli growth. In the presence of E. coli., the time taken for the optical response to shift from being dominated by chromophore absorption to optical scattering (inflection point labelled tc in Figure 4), was observed within 16 h of inoculation. Moreover, tc was seen to be dependent on the initial concentration of E. coli (Figure 4a). Figure 4b illustrates the relationship between E. coli inoculum and the time taken for the characteristic optical response. As would be predicted, there is a negative and linear correlation between the log of the number of E. coli cells inoculated and the optical response. The device was capable of detecting >3 cfu in 100 mL using laboratory-cultured E. coli in MacConkey broth generated using laboratory-grade RO water as the solvent. Inoculation with <1 cfu E. coli showed a nil response in the optical behaviour of the sample (which can be observed by eye at the end of the experiment, inset of Figure 4a).
To assess the potential to use this technology in a nearer to real world scenario, a series of tests were undertaken to measure the growth of E. coli in VBox in MacConkey broth using filter-sterilised river water (obtained from the River Ouse, York, UK). Freshly abstracted river water was sterilized and used as the matrix and made into culture media using powdered MacConkey broth. The optical response was monitored following inoculation with E. coli W3110. The relationship between log (cfu E. coli) and time remains linear and negatively correlated, and the VBox still maintains a capacity to detect E. coli to around the WHO expected standard of 1 cfu/100 mL (Figure 4c).
Detection of Faecal Indicator Species: E. coli. in Untreated Water Samples
To test further the capability of VBox to detect E. coli under real world conditions, we developed a method to assess the E. coli content of raw river water. We compared the ability of VBox to detect E. coli to a plate-based assay in which we concentrated the bacterial component of river water using 0.22 μm filter disks, as described in methods section 2.6. The filtration / plate method allowed us to identify faecal coliforms based on (i) acid production following growth on lactose (colour change on MacConkey plates), (ii) B-glucouronidase activity (conversion of substrate to fluorescent product) and (iii) thermotolerance (growth at 44 °C). Positive colonies were checked by colony PCR with 16S rRNA primers, and confirmed as E. coli. For the VBox, raw river water (or samples of raw river water diluted with paired samples of filter-sterilised river water) were supplemented with MacConkey broth powder. Following incubation, as for experiments with E. coli W3110, it was observed that there was a negative correlation between log (cfu of environmental E. coli) and incubation time in the VBox (Figure 4d).
It is clear that the VBox is able to detect any contamination of E. coli within the 100 mL media vessels used. This meets the expectations for faecal coliforms detection set out by the WHO (detection of 1 colony forming unit in 100 mL water). In our experiments a lack of detectable colour change in VBox was always consistent with no detectable colony forming units of E. coli. This was the case when inoculating deliberately with a laboratory strain of E. coli and when detecting naturally occurring E. coli from raw river water samples. In this latter case, the VBox was approximately 10× more sensitive than the culturing method, which we ascribe to the greater level of stress imposed on E. coli abstracted from the water due to the filtration process and the shock of exchange into a different medium, compared to the VBox in which the only shock was the introduction of nutrients via supplementation with MacConkey broth.
We also analysed the effect of bacterial quantity on detection time using a two-tailed Student's t-test with binned quantities of E. coli inoculum. Using pure water under conventional laboratory conditions, we were >95% confident in the distinction between 1–10 E. coli, 100–1000 E. coli and 10,000–100,000 E. coli. When using river water as the solute in media, we were unable to show >95% confidence between different concentrations of E. coli.
In summary, whilst we can confidently detect any quantity of E. coli in VBox, we cannot confidently quantify the level of contamination (at least between 1–1000 cells per 100 mL) when using raw river water, presumably due to the introduction of uncontrolled variables between different river water samples. We are thus in a position to use VBox to provide a presence / absence, red / green traffic light system for detection of faecal contamination based on this indicator species, in line with the preferences expressed through the community engagement processes undertaken.
Conclusions
In this project we have developed and implemented a set of participatory and creative methods to support the co-design of a new technology for water quality sensing, appropriate to the setting of the chosen remote and rural communities. The process provided us with specific qualitative and quantitative specifications for a technology, both in terms of the technical component of the water quality sensor and the institutions that need to be implemented to ensure access, use and benefits of the technology are distributed equitably across the community. These specifications were tangible but also surprising, cutting against conventional wisdom, such as the perceived need for handheld, rapid, mobile devices. Informed by these specifications, we were able to build and test a water quality monitoring device for detection of faecal coliforms in water. Work is still underway, engaging with community members and other stakeholders in Vanuatu around evaluation of the water quality monitoring technology in communities, user-led translation and widespread distribution of these socio-technical innovations into products that provide crucial and actionable information for some of the world's poorest and most marginalised communities.
The project has been eye-opening and inspiring for the scientists involved, and we would encourage other applied scientists and engineers to collaborate with social scientists and skilled facilitators to embed end-user and stakeholder engagement more thoroughly into technology innovation processes, from the outset and continuously throughout their projects. However, this is neither easily said or done. Analysis of our experience in Vanuatu has revealed a range of considerations of general significance for scientists and engineers with ambitions for participatory technology development. First, our framework challenges scientists and engineers to shift from traditional perceptions of technology as solely ‘devices’ constructed from nuts and bolts, algorithms, or reagents and instead view technology as socio-technical solutions that respond to the social, political and economic context in which they are developed and ultimately used. While this view has been widely discussed and analysed within the social science literature (Douthwaite & Hoffecker, 2017; Glover et al., 2019; Gomez-Marquez & Hamad-Schifferli, 2021), for scientists and engineers this requires a substantial reframing of what technology is and of how innovation should be done, and by whom. Our experience suggest that significant time and effort needs to be dedicated to supporting technology developers to examine these questions and to critique the pathways through which their work has impact. This leads to our second consideration; the need for methods capable of revealing and legitimising knowledge diversity. Transdisciplinary, participatory projects demand carefully designed processes of engagement that allow different stakeholders to build an appreciation for unfamiliar, overlooked or maligned forms of knowledge, be that between academic disciplines or between academics and wider stakeholders. Our experience suggests this requires an ongoing commitment to developing and reflecting on diverse and overlapping methods, both formal and informal, that recognise and reinforce the value and standing of differing forms of knowledge and that overcome the tendency to defer to identified experts and outsiders. Third, and finally, participatory technology development projects require sustained effort and cost, and adds layers of complexity that bring opportunities for ethical risk, for example through misinterpretation, inappropriate method selection, or poor implementation. However, we believe there are reasons for optimism and our hope is that our overarching framework will inspire a wider community of scientists and engineers and yield solutions that better address end-user needs, respond to local context and deliver long-term benefits that are distributed more equitably across.
Footnotes
Acknowledgements
This work was funded by the United Kingdom Research and Innovation (UKRI) under Engineering and Physical Sciences Research Council (EPSRC) grant EP/P027571/1 and an institutional award from the University of York. The research was performed with the approval and support of the Vanuatu Cultural Centre. We express our gratitude to all research participants for their time and willingness to participate in this research. We also thank our project partners Oxfam in Vanuatu and Wan Smolbag for their support. We would also like to thank Margarette Meto-Dick for her valuable assistance and cultural guidance during data collection.
Funding
This work was funded by the United Kingdom Research and Innovation (UKRI) under Engineering and Physical Sciences Research Council (EPSRC) grant EP/P027571/1 and an institutional award from the University of York.
Declaration of Conflicting Interests
The authors declared no potential conflicts of interest with respect to the research, authorship, and/or publication of this article.