
Abstract
Liver responses are the most common endpoints used as the basis for setting exposure standards. Liver hepatocytes play a vital role in biotransformation of xenobiotics, but non-parenchymal cells (NPCs) in the liver are also involved in certain liver responses. Development of in vitro systems that more faithfully capture liver responses to reduce reliance on animals is a major focus of New Approach Methodology (NAMs). Since rodent regulatory studies are frequently the sole source safety assessment data, mode-of-action data, and used for risk assessments, in vitro rodent models that reflect in vivo responses need to be developed to reduce reliance on animal models. In the work presented in this paper, we developed a 2-D hepatocyte monoculture and 2-D liver cell co-culture system using rat liver cells. These models were assessed for conditions for short-term stability of the cultures and phenotypic and transcriptomic responses of 2 prototypic hepatotoxicants compounds – acetaminophen and phenobarbital. The optimized multi-cellular 2-D culture required use of freshly prepared hepatocytes and NPCs from a single rat, a 3:1 ratio of hepatocytes to NPCs and growth medium using 50% Complete Williams E medium (WEM) and 50% Endothelial Cell Medium (ECM). The transcriptomic responses of the 2 model systems to PB were compared to previous studies from TG-Gates on the gene expression changes in intact rats and the co-culture model responses were more representative of the in vivo responses. Transcriptomic read-outs promise to move beyond conventional phenotypic evaluations with these in vitro NAMs and provide insights about modes of action.
Keywords
Introduction
Traditional toxicity testing has been conducted using intact animals with the goal of interpreting results to predict likely risks for human populations. The testing is expensive, time-consuming, exorbitant in the use of sentient animals, and not always predictive of human responses. Furthermore, regulatory studies use 3 dose test article experimental designs with a maximum tolerated top dose, up to 1000 mg/kg, with significant concerns surrounding risk assessment extrapolations from these dosage levels compared to environmental or therapeutic doses in the clinic. Due to these issues, there is pressure from regulatory agencies, the public, and the scientific community to develop in vitro alternatives for toxicity testing that can be utilized for dose response evaluation, hazard identification, and mode of action determination. These approaches, primarily designed to use human cells and human tissue surrogate platforms, are referred to as new approach methodologies (NAMs). NAMs are gaining traction in toxicity testing, especially for various forms of acute toxicity and irritation where general chemical properties affect biological tissues. A larger concern in moving forward with NAMs is securing evidence that the biological effects of compounds in human tissues/cells in vitro are predictive of toxicological responses in a living organism. An important step will be demonstrating that appropriately designed in vitro platforms from test animals recapitulate the observed in-life responses seen in these species.
The most common target organ for setting exposure standards from rodent regulatory studies is the liver; approximately 25% of all IRIS-registered chemicals are classified as hepatotoxicants. 1 Common liver responses include cytotoxicity, proliferation, carcinogenesis, steatosis, cirrhosis, and fibrosis, all of which are typically assessed with in vivo histological analyses after in-life exposures. To recapitulate these complex phenotypes in vitro, organotypic assays are required that contain relevant cell types in the liver, maintain cell-cell signaling, and remain viable for longer time periods to assess altered phenotype. To allow bridging of results with NAMs to extant toxicity studies, these organotypic assay systems should first be developed with cells from rodents where results can be compared to legacy in vivo data. Hepatocytes isolated from the liver of a single rat can be used to test several compounds (eg, 8) compared to the 80+ rats needed to test 8 compounds in a regulatory 28- day repeat dose toxicology study (employing OECD 407 guidelines) used in safety and risk assessments. There are several differences reported in the literature that should be considered when using data from rodent responses to predict human toxicity. For example, literature findings report that increased bile production, lower LDL and faster turnover of liver cells is observed in rodents as compared to humans. 2 However, despite these differences, studies have shown that several liver function genes have similar expression in both rodents and humans. 2
The liver has both parenchymal and non-parenchymal cells (NPCs). The parenchymal cells of the liver, the hepatocytes, constitute 70% of the total liver cell population. 3 The remaining 30% include liver sinusoidal endothelial cells (LSECs), Kupffer cells (KCs), stellate cells (HSCs), and cholangiocytes. 4 These NPCs play critical roles in vivo responses to xenobiotics. Approaches using various 2-D and 3-D in vitro models for assessing liver responses have been reviewed in some detail [5]. Chemical-induced injury, such as produced by acetaminophen (APAP), may activate KCs to generate an inflammatory response with downstream effects on HSCs and LSECs. 5 Depending on the extent of the damage, these cell-cell interactions can lead to hepatocyte death via apoptosis. 6 Alternatively, activated HSCs can cause fibrosis in the event of extensive damage, and activated LSECs secrete growth factors that trigger hepatocytes to proliferate and regenerate. 7 NPCs also are likely to play roles in nuclear receptor mediated liver responses. In vitro, purified hepatocytes from rats or mice do not proliferate in response to peroxisome proliferator-activated receptor alpha (PPARα) activation. 8 However, co-culture of hepatocytes with non-parenchymal cells (NPCs), as well as treatment of purified hepatocytes with conditioned media from treated NPCs or various growth factors, results in a proliferative response to PPARα activation,8,9 a behavior that is more consistent with in vivo responses in the rat. This complex interplay between the various cell types in the liver cannot be easily replicated in the hepatocyte mono-culture models. Improved in vitro models for assessing hepatotoxicity may include multiple cell types and support extended hepatocyte viability, phenotypic maintenance, and metabolic competence to support repeated exposures and longer-term dosing. A liver co-culture with multiple NPCs could serve as a bridging platform for confirming the value of an in vitro liver test platform for predicting in-life results.
In this present work, we developed a multi-cellular 2D rat liver co-culture model and compared apical and transcriptomics responses for acetaminophen and phenobarbital from the hepatocyte mono-culture and co-culture models. The transcriptomic responses with PB were also compared to results from the OPEN TG_GATES project that has both in vitro and in vivo gene expression studies. For these 2 prototypic hepatotoxicants the co-culture system appeared to more accurately model in vivo liver phenotypes than the hepatocyte alone culture. In this regard, the co-culture model may be useful for evaluating the hepatoxicity potential of compounds in vitro as an early-stage alternative to in-life studies and if coupled with dosimetry could bridge in vitro platform results to in-life studies in test animals.
Materials and Methods
Culture and Characterization of Cryopreserved Cells
Cryopreserved primary Sprague-Dawley hepatocytes and KCs were obtained from Thermo Fisher (Waltham, MA). Cryopreserved primary Sprague-Dawley LSECs were obtained from Cell Biologics (Chicago, IL). Cryopreserved primary Sprague-Dawley HSCs were obtained from iXCells Biotechnologies (San Diego, CA). Appropriate medias per manufacturers’ recommendations were used to culture the commercial cells. For preparation of co-cultures, hepatocytes, SCs, LSECs, and KCs were added with a hepatocyte: SC: LSEC:KC ratio at 10:1: 20:3 cells 10 Cells were characterized using bright field and fluorescence microscopy. Bright field images were taken after 24 h in culture to evaluate morphology. Cell tracker labeling was performed, and images were taken at 4, 24, 28 and 72 h to identify each cell type in the co-culture model. Immunostaining was performed 4 days after plating for NPC and hepatocyte markers (details are provided in the immunostaining section). The cryopreserved cells were only used for model optimization purposes. Once we demonstrated that the freshly isolated cells were the better model, all subsequent experiments were performed using the freshly isolated cell protocol below.
Culture and Characterization of Freshly Isolated Cells
Fresh primary hepatocytes and NPCs from the same isolation batch (Sprague-Dawley) were obtained from Lonza (Research Triangle Park, NC). The hepatocytes were spun at 50 x g for 10 min at 4°C. The supernatant was removed, and the hepatocytes were resuspended in Williams E Medium with no phenol red (Gibco, Gaithersburg, MD), 10% fetal bovine serum (FBS), and hepatocyte culture supplements (Gibco). The NPCs were spun at 50 x g for 10 min to remove any remaining hepatocytes. The supernatant was spun at 800 x g for 10 min at 4°C to pellet NPCs. The pellet was resuspended in 1 mL red blood cell lysis buffer (Sigma-Aldrich, St Louis, MO) on ice with agitation for 3-5 min. The solution was then diluted with 4 mL of Gey’s Balanced Salt Solution (GBSS) (Sigma-Aldrich, St Louis, MO) and spun at 800 x g for 10 min at 4°C. The NPCs were re-suspended in GBSS and fractionated over an OptiPrep density gradient (11.7% and 17.6% OptiPrep in GBSS; Sigma-Aldrich). The purified NPCs were recovered from the interface, re-centrifuged, and resuspended in culture media. Hepatocytes were either seeded alone (hepatocytes only) or with NPCs (co-culture) on collagen-coated PerkinElmer Viewplate 96-well black-walled plates (PerkinElmer, Akron, OH) (catalog # 6005182). Cells were characterized using brightfield and fluorescence microscopy similar to the cryopreserved cells. Brightfield images were taken every 24 h for 4 days. Immunostaining for hepatocyte markers was performed 24 h following plating (details are provided in the immunostaining section). After 4 days in culture, cells were stained with Desmin, Fluoresbrite® Polychromatic Red Microspheres, and LYVE1 to evaluate the presence of NPC’s. All details for staining are provided in the immunostaining section below.
CellTracker Dye Labeling
The plating protocol mentioned above for freshly isolated cells was followed until final centrifugation of both hepatocytes and NPC’s. Subsequently, hepatocytes, LSECs, KCs, and HSCs were resuspended in media with no serum and incubated with either 25 μM CellTracker Orange CMRA, 25 μM CellTracker Green CMDFA, 25 μM CellTracker Deep Red, or 25 μM CellTracker Blue CMAC (Invitrogen, Waltham, MA) for 30 min at 37°C. After incubation, hepatocytes were centrifuged at 50 x g for 5 min, and LSECs were centrifuged at 500 x g for 5 min. The dye was removed, and the labeled cells were resuspended in culture media and plated. Cells were imaged 4, 24, 48 and 72 h after plating.
Optimization of Media
Two media formulations were assessed in the optimization of the assays. Complete Williams E Medium (WEM) consisted of Williams E Medium with no phenol red (A12176; Gibco, Gaithersburg, MD), 10% FBS (Atlanta Biologicals, Flowery Branch, GA), and hepatocyte culture supplements (CM4000; Gibco) without the dexamethasone additive. Complete ScitoVation (SCI) is a mixture of 2 complete media selected to support hepatocyte and NPC cells: 50% WEM and 50% complete Endothelial Cell Medium (ECM). ECM consisted of Endothelial Cell Growth Media (CCM027; R&D Systems, Minneapolis, MN) with Endothelial Cell Growth Supplement (ECGS) (CCM027; R&D Systems) and 1% penicillin-streptomycin (Gibco). Cells were stained with LYVE-1, Desmin, and fluorescent microspheres 4 days after plating to evaluate viability of LSEC, Kupffer and stellate cells with SCI media. Cells were plated in mono and co-culture and supplemented with WEM or SCI media for 5 days. Brightfield images were taken at day 5 to evaluate morphology, and cells were stained with E-cadherin to evaluate hepatocyte polarity. Viability of cells was assessed after 3 and 5 days of culture using the RealTime-Glo assay, Alanine Aminotransferase assay and Aspartate Aminotransferase activity assays (details below).
Realtime Glo
To assess viability after 48 hours of treatment, the appropriate wells were incubated with 1X RealTime Glo reagent (Promega, Madison, WI) for 1 hour at 37°C. After incubation, the supernatants were transferred to a white-walled 96-well plate and luminescence activity was detected using the Molecular Devices (San Jose, CA) FlexStation 3 Plate Reader. This assay was used to assess cell proliferation of the hepatocytes only and co-culture models in the presence of WEM and the modified 50/50 media (SCI).
Alanine Aminotransferase Activity Assay (ALT) Assay
The ALT assay kit was purchased from Sigma Aldrich (St Louis, MO). In a 96 well plate 0, 2, 4, 6, 8, and 10 nmol of pyruvate were added per well as standards. Samples were homogenized with ALT assay buffer and centrifuged at 15,000 x g for 10 minutes. A master mix of ALT assay buffer, fluorescent peroxidase substrate, ALT enzyme mix and ALT substrate was made and added to each sample/standard. The sample was placed on a plate shaker for 2-3 minutes and the absorbance measurement at 570 was taken using a FlexStation3 Molecular Devices Microplate Spectrophotometer. The plate was incubated at 37°C and measurements were taken every 5 minutes until the most active sample was at the end of the linear range of the standard curve. The standard curve was used to calculate the amount of pyruvate generated between the initial and final measurements. Subsequently ALT activity was calculate using the formula ALT Activity= (B x sample dilution factor)/(T final- T inital) x V where B= nmol of pyruvate generated between T final and T initial, T final and T initial are the final and initial measurements in minutes and V=sample volume (mL) added to the well.
Aspartate Aminotransferase Activity (AST) Assay
The AST assay was purchased from Sigma Aldrich (St Louis, MO). In a 96 well plate, 0, 2, 4, 6, 8 and 10 nmol of Glutamate standard was added. Samples were homogenized in 200 μL of ice-cold AST buffer and centrifuged at 13,000 x g for 10 minutes. A master mix comprising of AST assay buffer, AST enzyme mix, AST developer and AST substrate was added to each sample/standard. The plate was incubated at 37°C for 2-3 minutes and the initial absorbance measurement at 450 nm was taken using a FlexStation3 Molecular Devices Microplate Spectrophotometer. Absorbance was measured every 5 minutes until the most active sample was near the end of the linear range of the standard curve. The standard curve was used to extrapolate the amount of Glutamate generated between the initial and final measurements. The AST activity was calculated by the formula AST = (B x sample dilution factor)/(Reaction Time) X V where B = nmol of glutamate generated between the final and initial measurements, reaction time = the total time of reaction in minutes and V = sample volume (mL) added to each well.
Albumin Assay
The Albumin assay was purchased from Sigma Aldrich (St Louis, MO). Standards ranging from 5, 4, 3, 2, 1.5, 1, 0.5 and 0 g/dL of BSA was made. Subsequently, 5 μL of standards or diluted samples was mixed with 200 μL of reagent and incubated at room temperature for 5 minutes. Absorbance measurements were taken at 620 nm using a FlexStation3 Molecular Devices Microplate Spectrophotometer.
Optimization of Hepatocyte to NPC Ratio
A 4:1 and 3:1 ratio of hepatocyte: NPC was used for optimization. Following optimization, a 3:1 ratio of hepatocyte: NPC was used for all subsequent experiments. Monoculture wells were seeded at 40,000 hepatocytes per well. The co-culture wells were either seeded at 32,000 hepatocytes plus 8,000 NPCs per well (4:1) or 32,000 hepatocytes plus 12,000 NPCs per well (3:1). Cells were stained for HNFα, EDU, Desmin, and LYVE-1 after 4 days in culture. Brightfield images of cells were also taken to evaluate morphology 4 days after plating.
EdU Proliferation Staining
Prior to incubating cells in secondary antibodies, cells were incubated with Click-IT Edu 555 Kit (Thermo Fisher, Waltham, MA) reagents per manufacturer’s specifications for 1 hour at RT. After 1 hour, cells were washed 3 times with 0.1% PBS-Tween 20 for 5 min each and then incubated with blocking buffer containing the above secondary antibodies and processed as described in the immunofluorescence section.
Fluorophore Bead Assay
Polysciences (Warrington, PA) Fluoresbrite Polychromatic Red Microspheres were used to detect the KCs. We added 1-2 drops of microspheres to 10 mL of media, and the media was added to appropriate wells and incubated for 1 hour at 37°C to allow for engulfment by the KCs. After incubation, the media was removed, and the wells were washed 3 times with 1X DPBS and either imaged live or fixed with 4% PFA. The microspheres were detected in the Alexa Fluor 488 channel on the Perkin Elmer Opera Phenix High-Content Imaging System.
Immunofluorescence
Cells were fixed with 4% paraformaldehyde for 1 h. After fixation, the cells were washed twice with 1X Dulbecco’s Phosphate Buffered Saline (Gibco, Gaithersburg, MD). The cells were incubated in blocking buffer (5% FBS and 10% NGS in 0.1% PBS Tween-20) for 1 hour at room temperature. After blocking, the cells were incubated overnight at 4°C with the following antibodies: Rabbit anti-Mouse HNF-4α (Abcam, Cambridge, MA) diluted 1:250 in blocking buffer; Mouse anti-Rat E-cadherin (Abcam, Cambridge, MA; diluted 1:100); Chicken anti-Rat Albumin (Abcam, Cambridge, MA; diluted 1:250); Rabbit anti-Rat Desmin (Abcam, Cambridge, MA; diluted 1:100); Rabbit anti-Rat Hepacam (Proteintech, Rosemont, IL; diluted 1:100); Rabbit anti-rat ABCB4 (Aviva Systems Biology, San Diego, CA; diluted 1:100); Rabbit anti-Rat PMP70 (Thermo Fisher, Waltham, MA; diluted 1:100). After overnight incubation, the cells were washed 3 times for 5 min each with 0.1% PBS-Tween 20. The cells were incubated with the following secondary antibodies: Goat anti-Mouse Alexa Fluor 488; Goat anti-Chicken Alexa Fluor 568; Goat anti-Rabbit Alexa Fluor 647 (all antibodies Thermo Fisher, Waltham, MA; diluted 1:500 in blocking buffer) and 1ug/mL Hoechst 33342 (Thermo Fisher, Waltham, MA) for 1 hour at room temperature. The cells were then washed 3 times with 0.1% PBS-Tween 20 for 5 min each before 100 μl of PBS was added to each well, and plates were stored at 4°C until analysis.
Image Acquisition and Analyses
All images were acquired using a 20X objective, and all image analyses were performed using the PerkinElmer Opera Phenix High-Content Imaging System and Harmony software.
Chemicals
The following chemicals were used to treat the mono- and co-cultures: acetaminophen (Sigma Aldrich, St Louis, MO, catalog #: A7085) CAS # 103-90-2; phenobarbital (Sigma Aldrich, St Louis, MO, catalog # P1636) CAS # 50-06-6.
Cell Treatment for Evaluating the effect of APAP on Hepatocytes in Mono- And Co-Culture
Hepatocytes and co-cultures were treated with 0, 5-, 10-, 15- and 20-mM APAP daily for 3 days (72 h) and cytotoxicity was measured using CellTox Green Assay. For the qRT-PCR hepatocytes and co-cultures were treated with 0, 5 and 10 mM of APAP daily for 72 h. For the immunostaining, hepatocytes and co-cultures were treated with 0- and 10-mM APAP daily for 72 h.
CellTox Green
To assess cytotoxicity after 72 hours of treatment, the appropriate wells were incubated with 1X CellTox Green reagent (Promega, Madison, WI) for 1 hour at 37°C. After incubation, the plate was assessed for fluorescent activity using the Molecular Devices (San Jose, CA) FlexStation 3 Plate Reader. This assay was used to assess the cytotoxicity of acetaminophen to the hepatocytes only and the co-culture models.
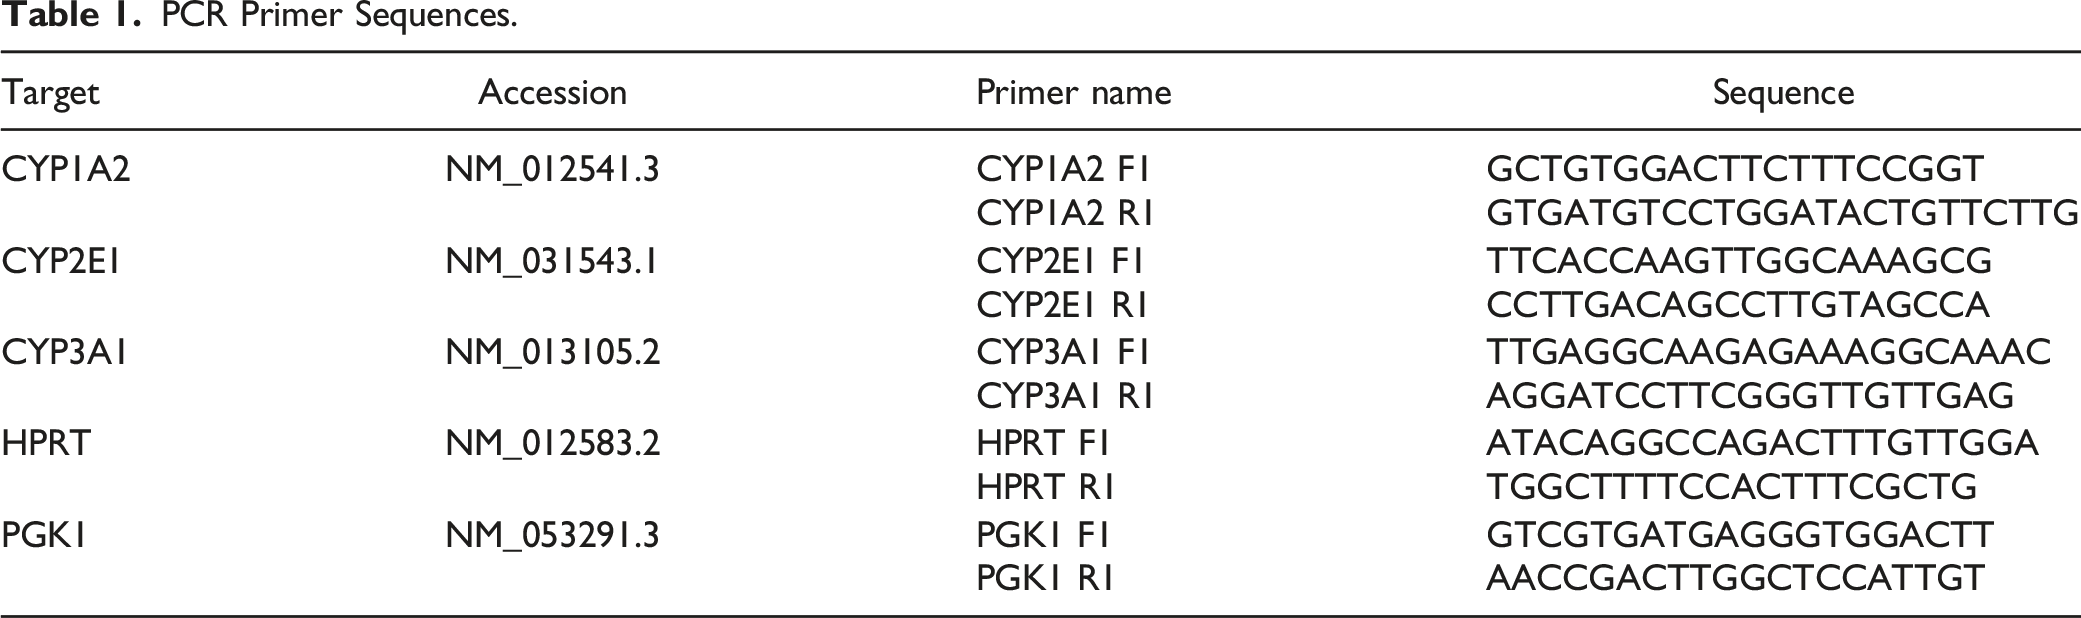
Quantitative Real-Time PCR
PCR Primer Sequences.
Transcriptomic Analysis
Freshly isolated male rat Sprague Dawley hepatocytes and NCPs were obtained from Lonza (Walkersville, MD) as described. The cells were cultured in either 2D monoculture or co-culture and treated with phenobarbital (0.1, 1, 10 mM). The cells were treated 24 hours prior to sample collection at 3 timepoints (days 1, 3, and 7 post-plating). After 24 hours, the cells were lysed in TempO-Seq buffer, and libraries were prepared for sequencing per manufacturer’s protocols (n = 4 biological replicates).
BioSpyder TempO-Seq analyses were performed by BioSpyder using their Rat Whole Transcriptome Panel. This panel contains oligonucleotides for the detection of 22,253 rat genome transcripts derived from the Rn6 annotations. Samples were sequenced to an average depth of ∼5.6 M reads in positive control samples. Relative transcript levels were determined using the BioSpyder TempO-Seq ligation platform for whole rat genome coverage, and differential gene expression was determined using conventional RNA-Seq analyses. The sequence read files and feature count matrix for these experiments are available in the NCBI’s Gene Expression Omnibus database under accession GSE133717.
Count data from RNAseq for each chemical and culture condition was analyzed in DESeq2 11 in R 3.5.1. Linear models of dose and time were fit to dispersion-corrected data, and Wald tests used for statistical significance of concentration response. Significance was evaluated using a Benjamini and Hochberg false discovery rate corrected P-value (FDR<0.05) 12 and a magnitude of change threshold of up- or down-regulated fold change (relative to untreated vehicle only samples) of at least 1.5-fold (|FC|>1.5), or both thresholds applied simultaneously.
OPEN TG-GATEs Affymetrix Rat_230-2 microarray data (CEL files) for single dose (300 mg/kg for 24 h) in vivo phenobarbital exposure was downloaded from the project website (https://toxico.nibiohn.go.jp/english/). These were normalized using the GCRMA algorithm and analyzed for differential gene expression using the LIMMA library in R-3.5.1.13,14
Ontology enrichment was performed using the ScitoVation in-house software tool, GOFigure Maps. This software performs a conventional over-representation analysis (Fisher’s exact test) from gene lists derived from the differential expression analyses and displays it in the form of a bubble-map with significant enrichment shown on a graphical representation of an ontology’s hierarchical structure.15,16
Results
Cryopreserved Cells
Cryopreserved rat hepatocytes were plated either alone as monoculture or in co-culture with NPCs and bright-field images were taken to evaluate morphology after 24 h. As shown in the images in Supplemental Figure 1, hepatocytes monoculture formed a confluent monolayer with little organization or structure
Freshly Isolated Cells
We also used freshly isolated hepatocytes and NPCs to evaluate any differences seen from the cryopreserved cells. Cells were purified by density gradient fractionation as described in the methods section. The cells were plated either as hepatocytes alone or in co-culture at a ratio of 4:1 (hepatocytes: NPCs). Bright-field images of the mono-culture show that in the mono-cultures, canonical morphology of hepatocytes was observed on days 1 and 2 (Figure 1(A) and (B)), while from day 3 onward there were noticeable disruptions to the monolayer with the appearance of rounded dead cells (Figures 1(C) and (D)). After 4 days (Figure 1(E)), the morphology of the hepatocytes was dramatically altered, and the cells appeared to have undergone epithelial to mesenchymal transition (EMT). In contrast, the hepatocyte: NPC co-cultures-maintained hepatocyte morphology up to day 5 with no disruption of the monolayer and fewer noticeable dead cells (Figures 1(F) to (J)). Based on these initial results, all subsequent studies used freshly isolated rat hepatocytes and NPCs. Comparison of hepatocyte morphology in mono- and co-culture over time. Freshly isolated rat hepatocytes plated as mono-cultures (A-E) or co-cultures with NPCs from same isolation (F-J). Bright-field images were taken every 24 hours for 5 days to study effect of co-culture on hepatocyte morphology. Hepatocyte morphology was observed to be maintained better in co-culture compared to mono-culture. 20X.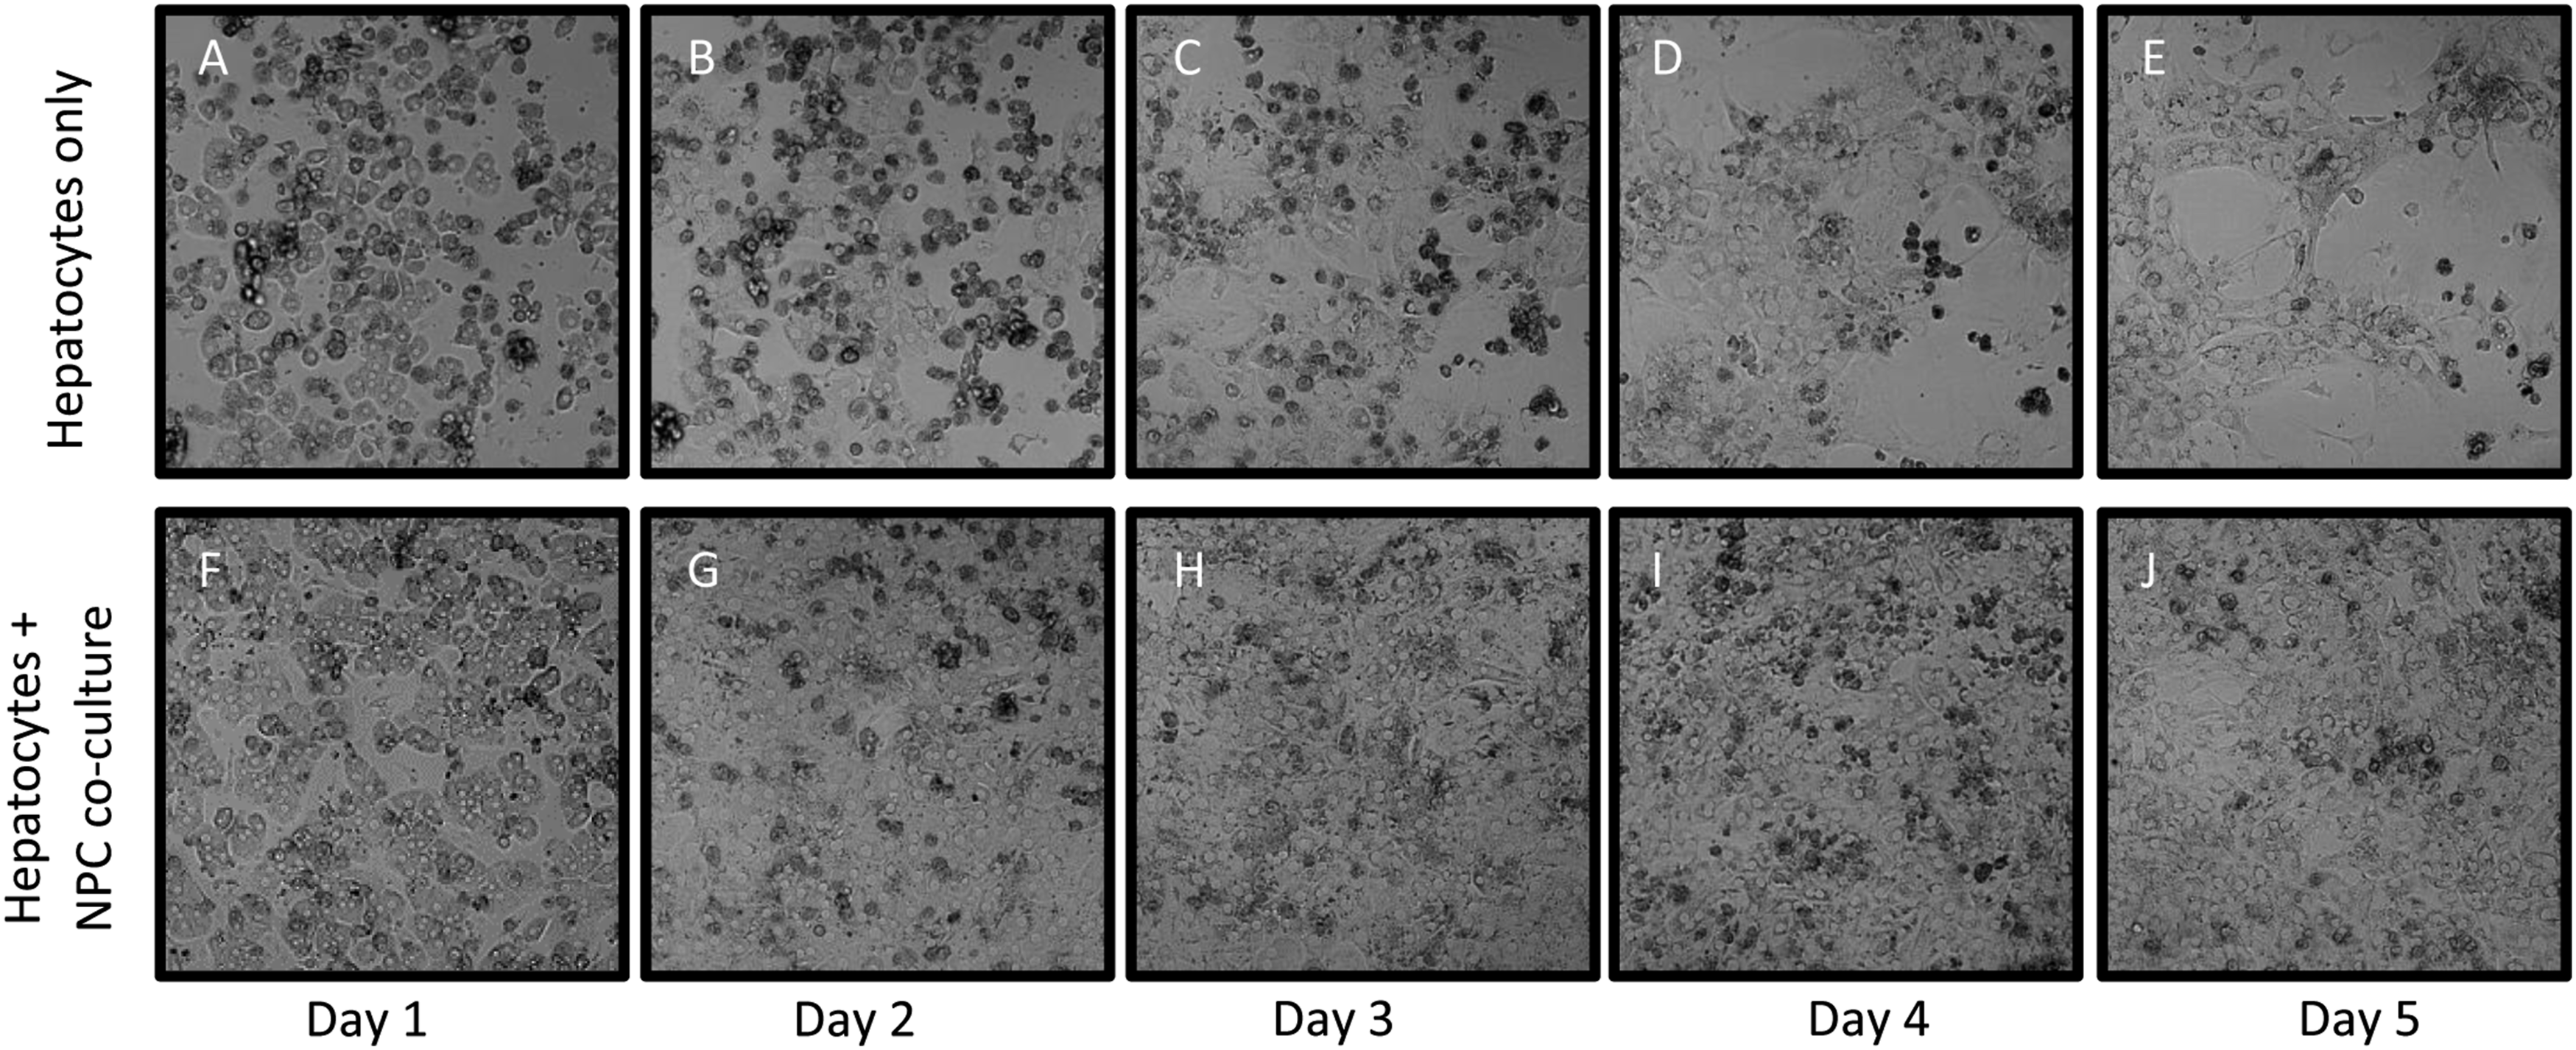
The mono- and co-cultures were next studied for the presence of NPCs. Cultures plated for 4 days were stained with antibodies for desmin to visualize stellate cells (Figures 2(A) and (D)). KCs were visualized by their ability to phagocytose Fluoresbrite® Polychromatic Red Microspheres (Figures 2(B) and (E)). Although there were more NPCs seen in the co-culture wells, both desmin-positive SCs and KCs were present in both mono- (Figures 2(A) and (B)) and co-culture wells (Figures 2(D) and (E)). This experiment indicated that freshly isolated and purified suspension of hepatocytes contain a small proportion of NPCs. Lymphatic vessel endothelial hyaluronan receptor 1 (LYVE-1) expression, a marker for LSECs both in vivo and in vitro,
17
was only observed in the co-culture wells on cells that morphologically resemble LSECs (Figure 2(F)). In contrast, LYVE-1 staining in the mono-cultures was non-specific and localized to cellular debris (Figure 2(C)). While there is red LYVE-1 staining for monocultures in Figure 2(C), that staining is non-specific as it is only present in random single cell regions. However, as shown in Figure 2(F), the LYVE-1 staining for in co-cultures indicated by the white arrows is present in clusters of cells that are more representative of the morphology of LSECs.
18
Identification of non-parenchymal cells in vitro. Four days post-plating freshly isolated hepatocytes as mono- and co-cultures, immunofluorescence for desmin was used to identify stellate cells (A, D, red). Kupffer cells were visualized by adding 1.0 μm Fluoresbrite® Polychromatic Red Microspheres to the wells to allow KCs to engulf the beads (B, E, dashed white arrows, green). Immunofluorescence for LYVE-1 was used to identify LSECs (C, F, white arrows, red). For all images, cells were counterstained with DAPI to visualize nuclei (blue), 20X.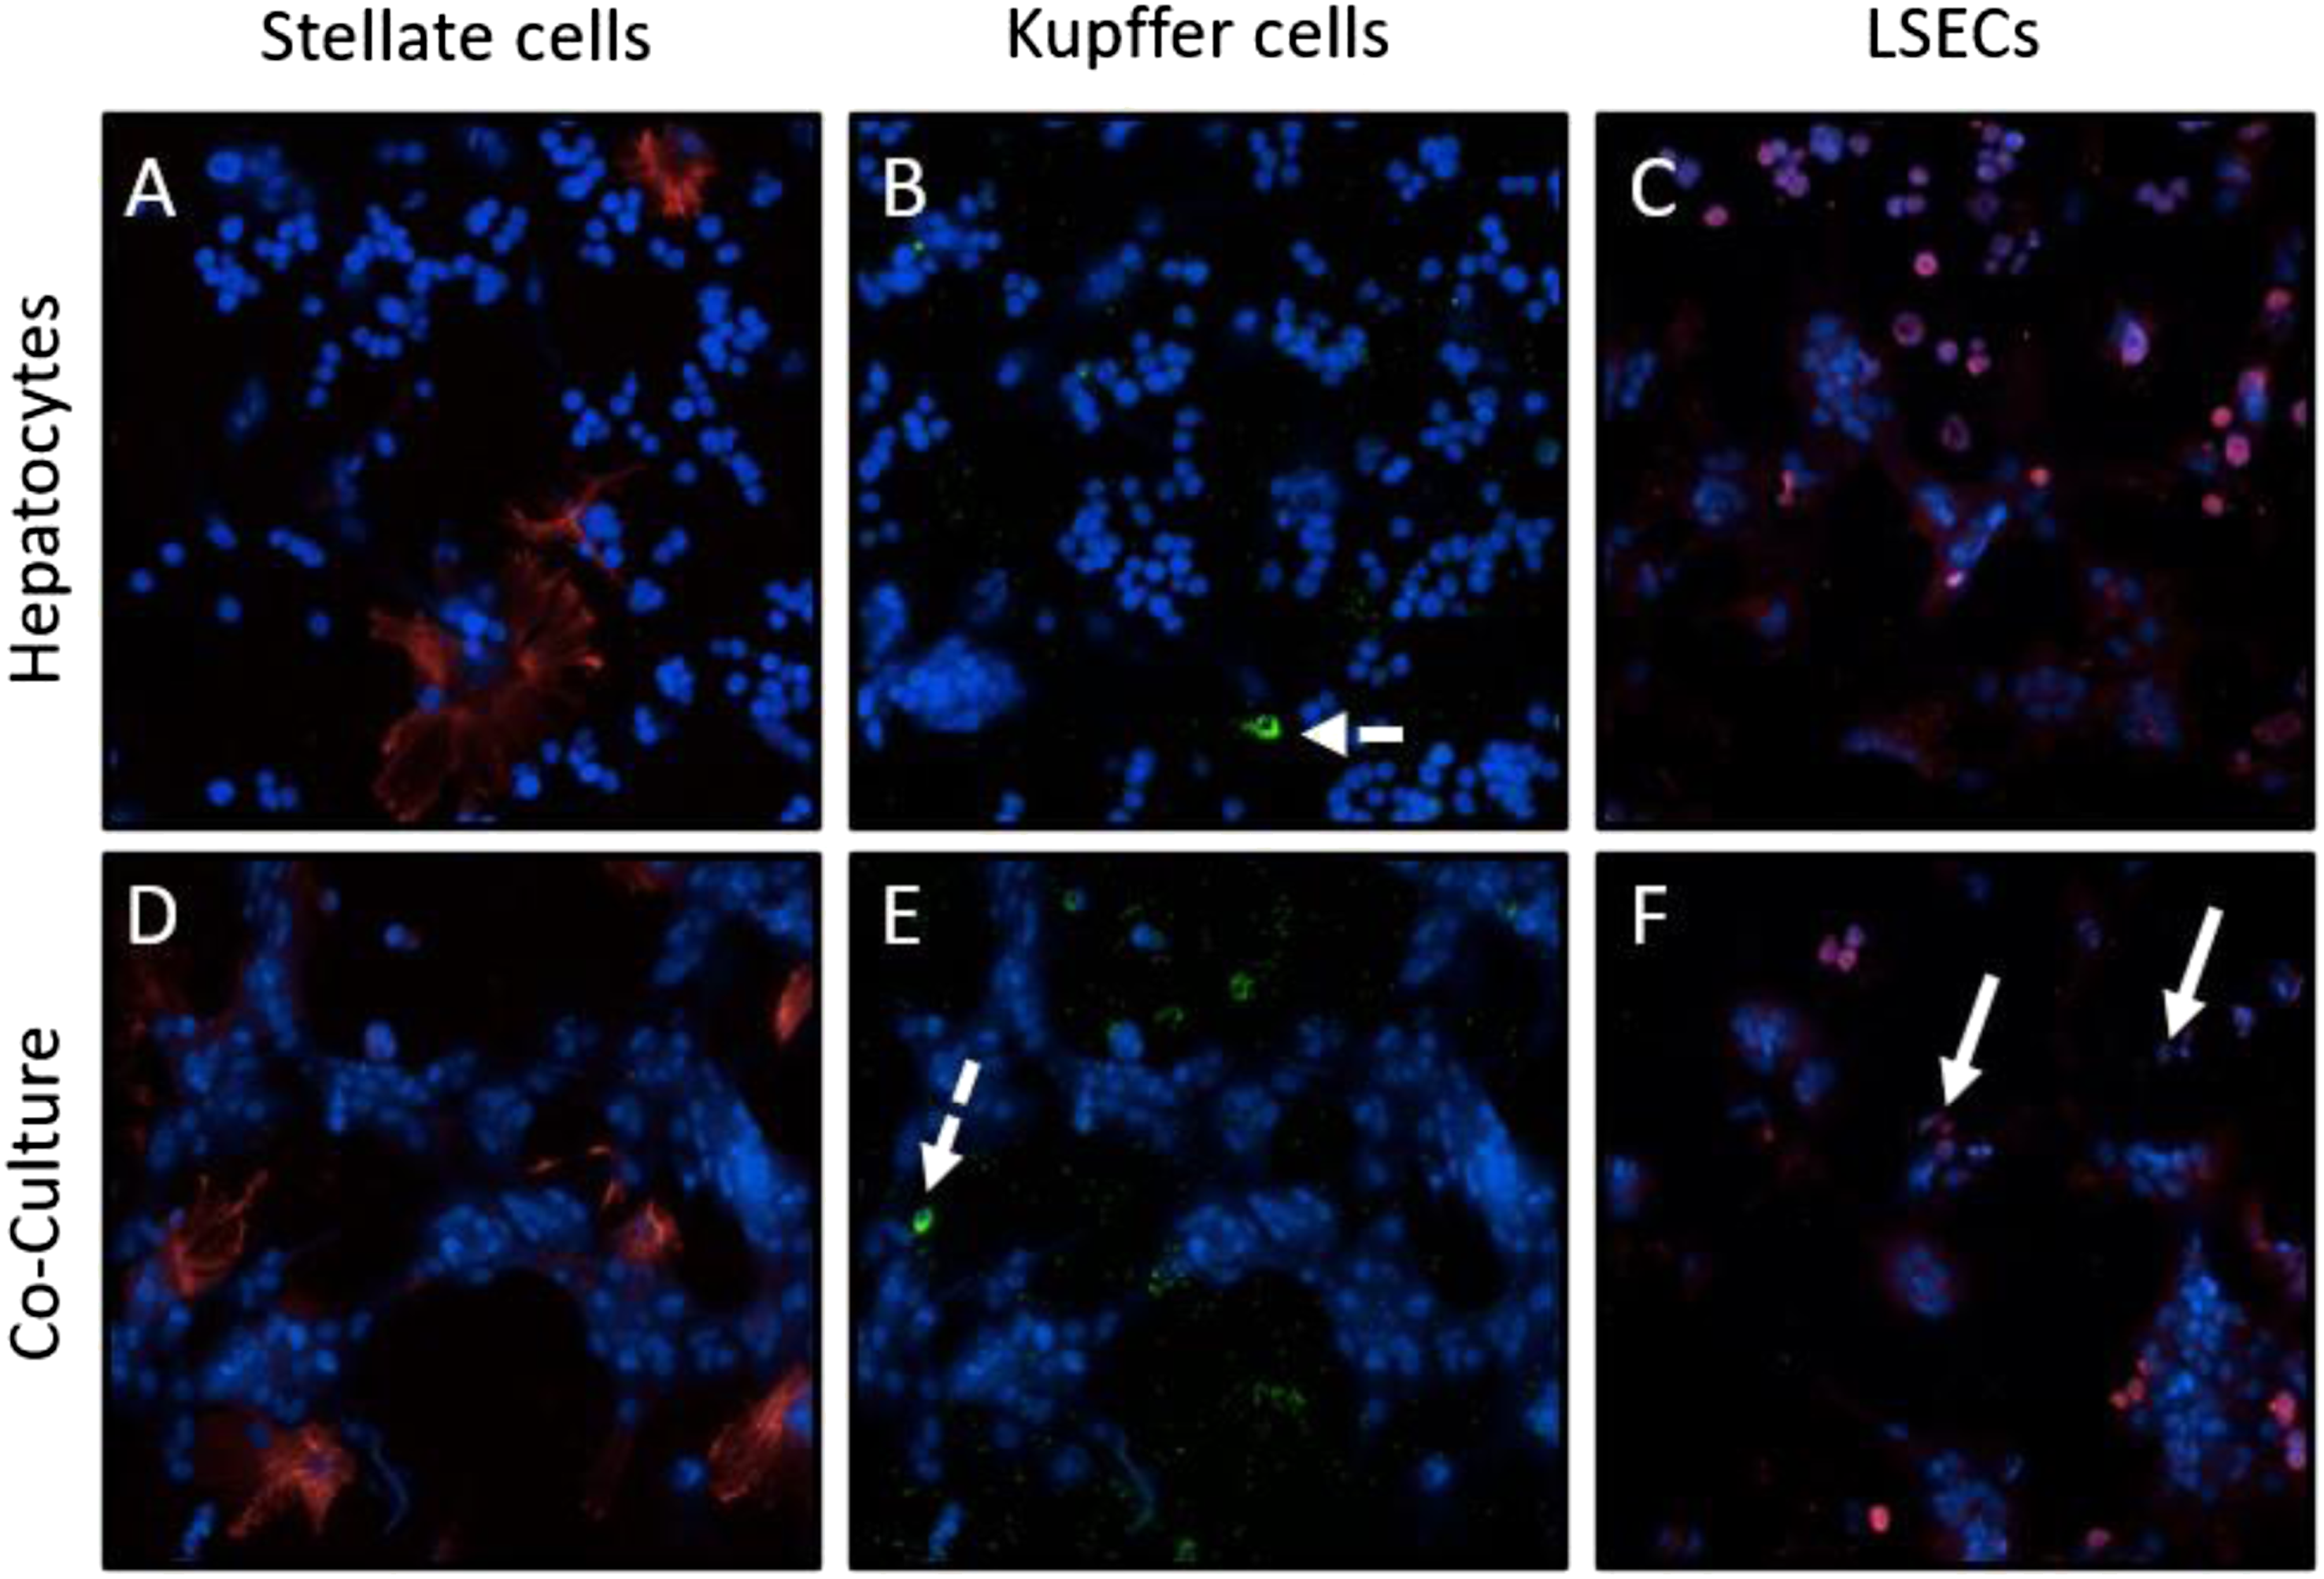
Immunofluorescence was performed on the hepatocytes alone and in co-culture for markers of hepatocyte differentiation and polarity. After 24 hours in culture, the hepatocyte mono-culture lost expression of hepatocyte nuclear factor 4 alpha (HNF4α), a canonical marker that is required for hepatocyte differentiation and usually localized to the nuclei (Figure 3(A)).
19
In contrast, as depicted in Figure 3(D), the co-cultured hepatocytes showed expression of HNF4α after 24 h in culture (Figure 3(D)). We also examined expression of the bile transporter protein ATP binding cassette subfamily B member 4 (ABCB4) to evaluate maintenance of hepatocyte polarity. ABCB4 is expressed on the canalicular membrane of polarized hepatocytes in vivo and is required for secreting phospholipids into the bile.
20
As shown in Figures 3(B) and (E), there was increased ABCB4 expression in the co-culture as compared to the mono-culture. E-cadherin, which is expressed on the lateral hepatocyte-to-hepatocyte cell junctions, was highly expressed on the hepatocytes in co-culture (Figure 3(F)) but was substantially diminished in the hepatocyte mono-cultures (Figure 3(C)). The expression of peroxisomal membrane protein (PMP70), which is expressed on peroxisome membranes,
21
was present in both mono-culture and co-culture and aided in identification of the hepatocytes (Figures 3(C) and (F)). Overall, our studies show that co-culture improved hepatocyte phenotypic maintenance. However, while the primary co-culture model demonstrated that primary rat hepatocytes, KCs, LSECs, and SCs could be maintained in co-culture, the cultures were often not viable past 4 days. In addition, while SCs and KCs were readily identifiable in co-culture, the LSECs were found in smaller numbers and not easily identifiable by immunostaining. These observations indicated the need for optimization of 2 other factors, media formulation and hepatocyte to NPC ratio in co-cultures. Hepatocyte markers are improved in co-culture. Freshly isolated rat hepatocytes were plated in mono-culture (A-C) or co-culture (D-F) with freshly isolated NPCs. After 24 hours, the cells were immunostained with markers of hepatocyte differentiation: HNF4α (A, D), ABCB4 (B, E), and E-cadherin and PMP70 (C, F). DAPI-stained nuclei were visualized in blue. All images were taken using a 20X objective.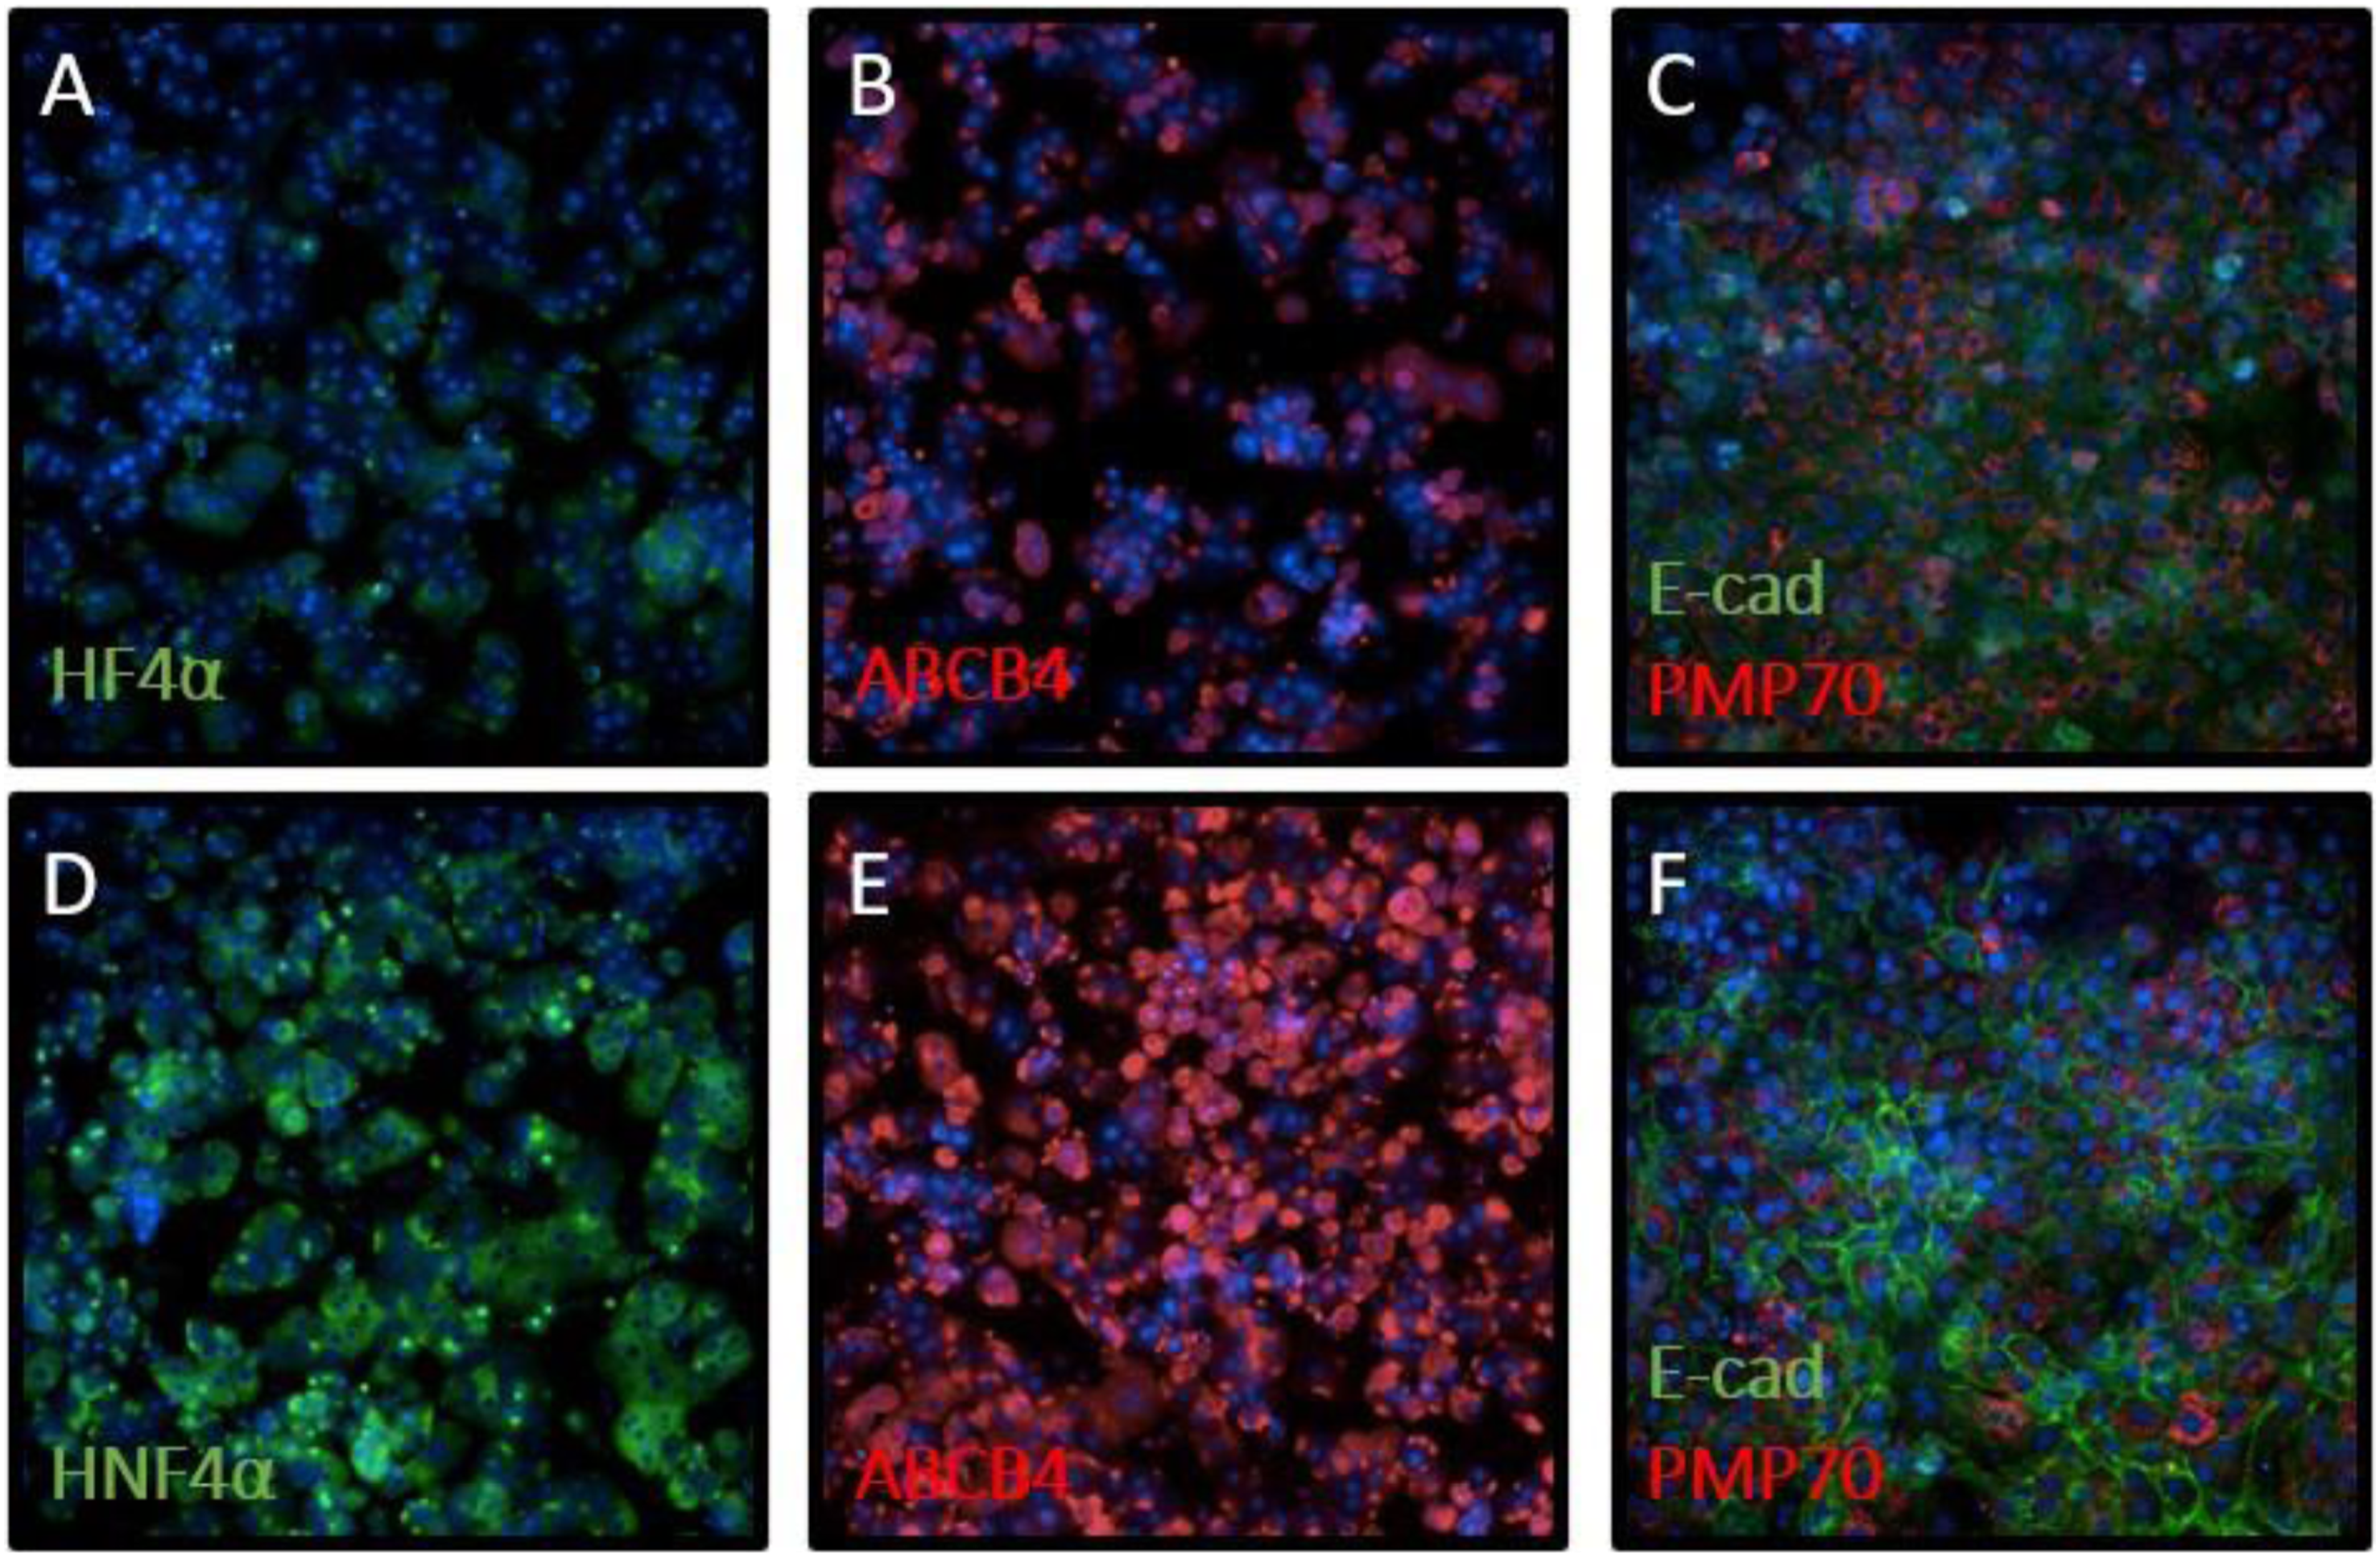
Media Formulation used for the Maintenance Of Hepatocyte: NPC Co-Cultures
We modified the WEM by supplementing it with media to support improved survival of the endothelial cell lineage (referred to as the SCI medium). To first determine whether the SCI media improved LSEC survival and attachment, the mono- and co-cultures were grown in either WEM or SCI growth media, and LYVE-1 expression was examined after 4 days in culture. As seen previously, there was no LYVE-1 expression in the hepatocyte mono-cultures in WEM (Figure 4(A)), and there was no noticeable increase in LYVE-1 expressing cells in the SCI media in mono-culture ((B)). In the WEM co-cultures, although overall LYVE-1 expression was low, cells showing morphological similarities with LSECs showed expression of LYVE-1 (Figure 4(C)). In the SCI media co-cultures, increased LYVE-1 expression was readily identifiable in the cytoplasm of a subset of the cells (Figure 4(D), white arrows). LYVE-1 expression is increased in SCI media. Representative fluorescent images of freshly isolated hepatocytes mono-cultures (A–B) or co-cultures with NPCs (C–D) in either WEM (A, C) or SCI media (B, D) after 4 days in culture. LYVE-1 expression is shown in red, and nuclei are visualized in blue with DAPI. White arrows note cytoplasmic LYVE-1 expression in LSECs. Images taken at 20X.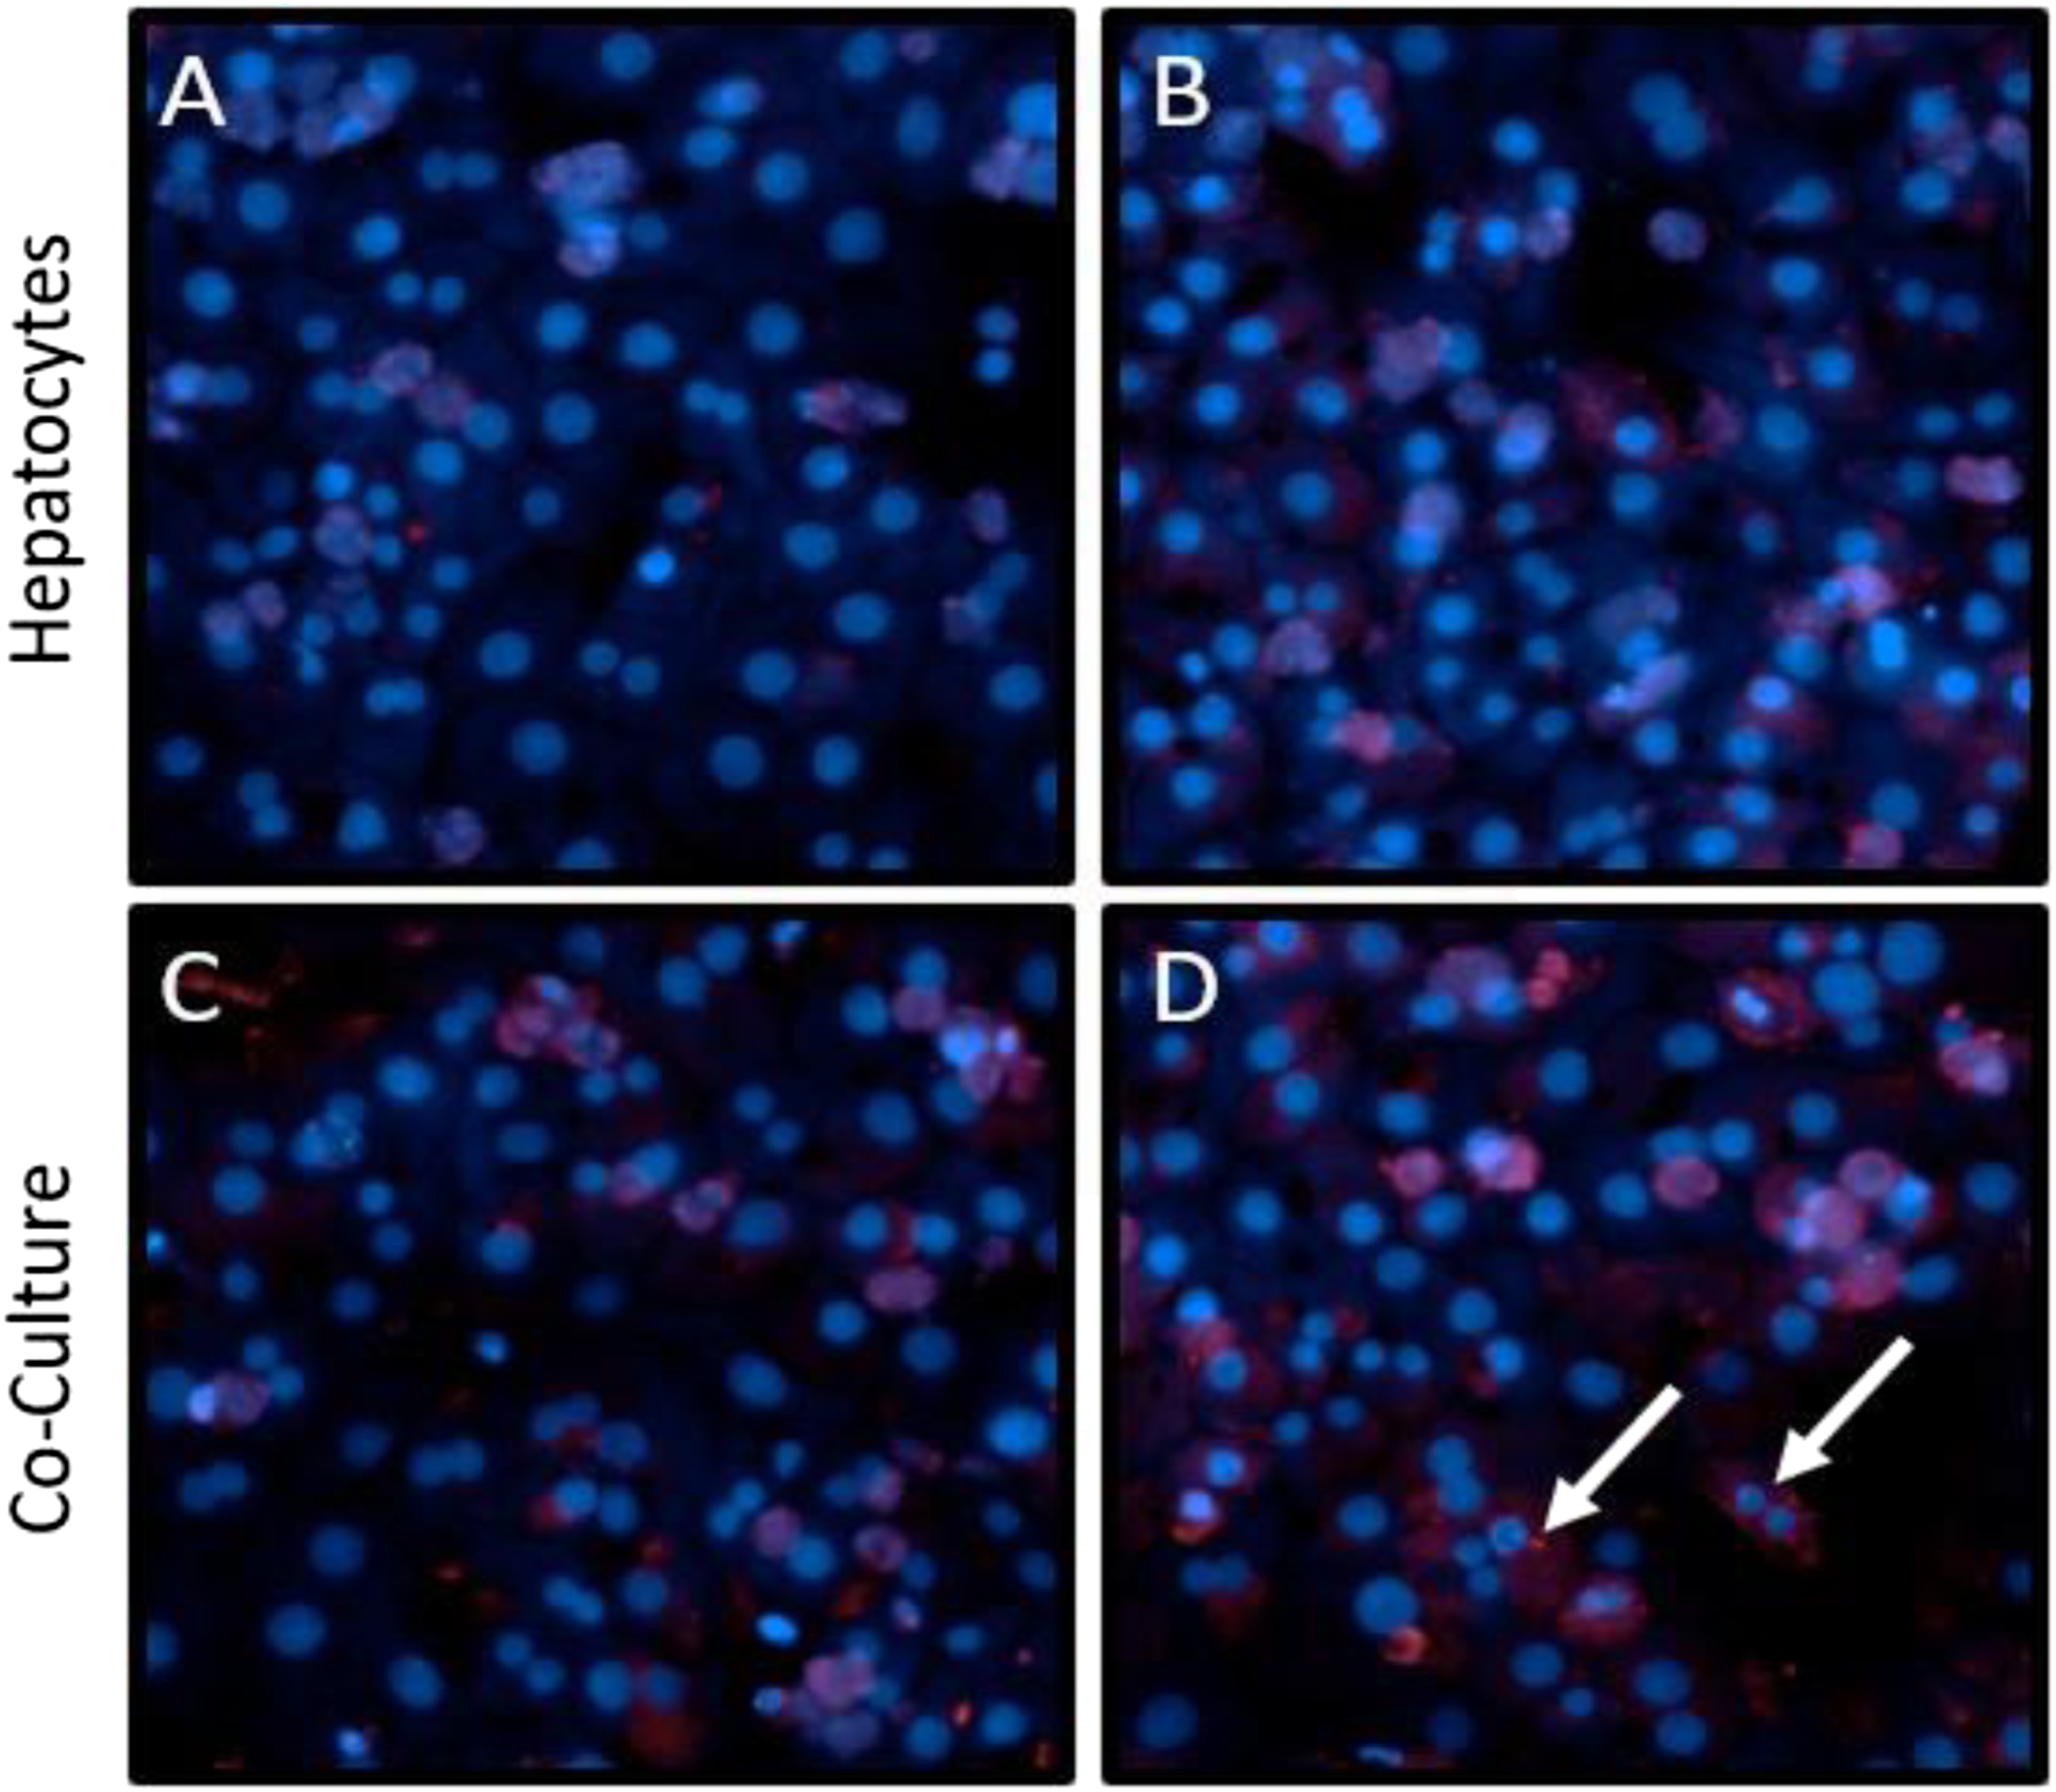
Neither the mono- or co-cultures, when plated in WEM, formed confluent monolayers of hepatocytes, and there were significant amounts of cellular debris (Figures 5(A) and (E), white arrows). When cultured in SCI media, both the mono- and co-cultures showed improved cellular morphology with fewer dead cells and less debris (Figures 5(C) and (G)). The morphology of the hepatocytes was most improved in the co-culture with the SCI media (Figure 5(G)), forming a confluent monolayer with large, well-defined nuclei. SCI media improves hepatocyte viability, morphology, and polarity. Freshly isolated rat hepatocytes and hepatocytes + NPCs were cultured in either supplemented WEM (A, B, E, F) or SCI media (C, D, G, H) for 5 days. Representative brightfield images of hepatocytes alone (A, C) or in co-culture (E, G) were taken. The mono- (B, D) and co-cultures (F, H) were stained with E-cadherin to visualize cell junctions (green) and nuclei were visualized with DAPI (blue). 20X.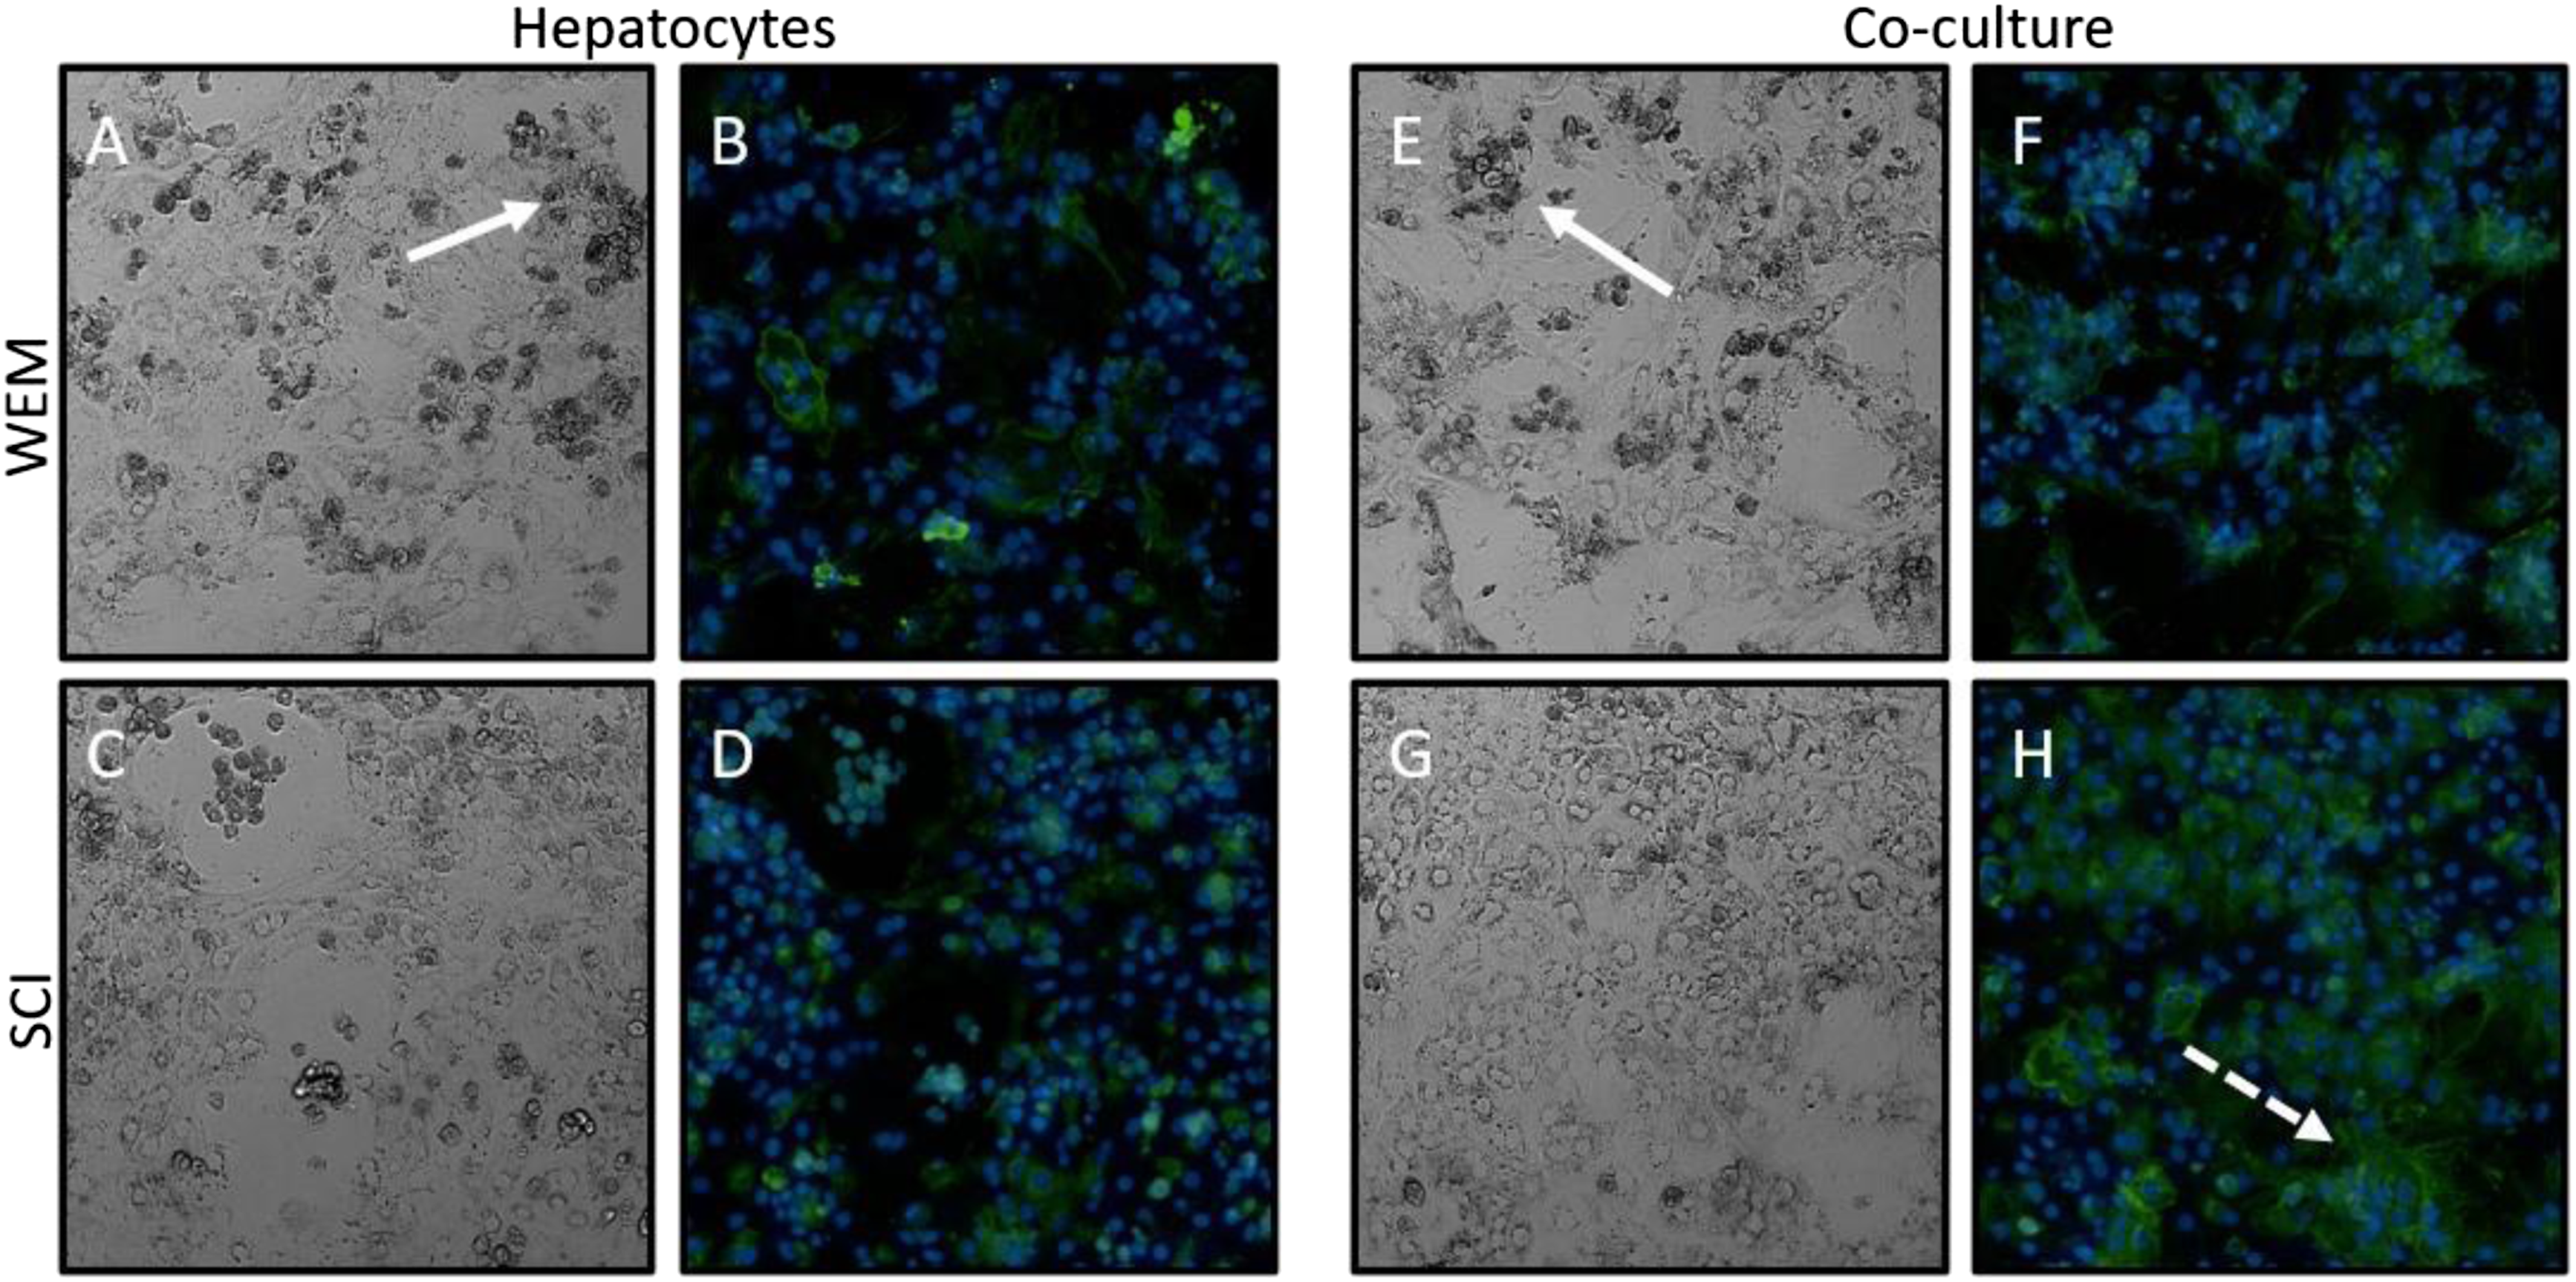
When WEM media was used, the expression of E-cadherin was largely absent in hepatocyte monocultures (Figure 5(B)) and diffusely present in co-cultures (Figure 5(F)) indicating that the cells were not polarized. There was increased expression of E-cadherin in the hepatocytes of the monocultures (Figure 5(D)) using the SCI media compared to hepatocytes in the WEM, although the expression was still not localized to the cell-cell interface. In the co-cultures in SCI media, the expression of E-cadherin was markedly increased with localization of E-cadherin to the hepatocyte cell-cell interface (Figure 5(H), dashed white arrow). Hepacam expression and albumin secretion were not markedly altered in either medium (Supplemental Figure 4).
The mono- and co-culture wells in WEM or SCI media were cultured for 3 and 5 days, and viability was assessed using the RealTime-Glo MT Cell Viability assay and by measuring aspartate transaminase (AST) and alanine transaminase 4 enzymatic activity. The co-cultures showed better viability (Supplemental Figure 5) and lower levels of ALT and AST enzymes compared to the hepatocyte monocultures in WEM or SCI media (Supplemental Figure 6). Compared to WEM, the SCI media showed a marked improvement in viability and culture health for both the mono- and co-cultures. The highest viability was seen in the co-cultures in SCI media.
To ensure that the SCI media had no effect on the SCs and KCs, the co-cultures in WEM or SCI media were stained for desmin and imaged for the presence of phagocytosed micro-beads to identify KCs. We found comparable numbers of SCs and KCs in WEM and SCI media (Supplemental Figure 7).
Ratio of Hepatocytes to NPCs
Initially we used a 4:1 hepatocyte: NPC ratio, a value chosen to phenocopy the in vivo hepatocyte: NPC ratio.
4
Although these co-cultures had improved survival and phenotypes compared to the hepatocyte monoculture, we found fewer NPCs than expected. We next compared hepatocyte monocultures with co-cultures at either a 4:1 or a 3:1 ratio of hepatocytes:NPCs. Less cellular debris and improved morphology of the hepatocytes were observed with the 3:1 ratio compared to the hepatocytes alone or the 4:1 co-culture (Figure 6(A), 6(E), 6(I)). The cultures were also immunostained for HNF4α. Either there was no HNF4α expression in hepatocyte monocultures, or the HNF4α was cytoplasmic (Figure 6(B)). The expression of HNF4α was comparable to hepatocyte monoculture in the 4:1 co-culture (Figure 6(F)), but HNF4α expression in the 3:1 co-culture was markedly increased and was more frequently found in the nucleus in many cells (Figure 6(J)). To examine the differentiated state of the hepatocytes more closely, the wells were pulsed with EdU to label proliferating hepatocytes and the cells were immunostained for desmin. The hepatocytes in the monoculture were highly proliferative, as evidenced by the large orange nuclei (Figure 6(C)). In contrast, in co-culture wells, at either NPC cell ratio, hepatocytes were more quiescent, with EdU incorporation largely restricted to the NPCs, rather than the hepatocytes (Figures 6(G) and (K)). Finally, to determine whether the increased ratio affected the LSECs, the cultures were immunostained with LYVE-1. LYVE-1 expression was increased in the 3:1 co-culture (Figure 6L) as compared to the hepatocytes alone (Figure 6(D)) or the 4:1 co-culture (Figure 6(H)). Based on these data, all subsequent experiments were performed using the freshly prepared hepatocytes and NPCs optimized primary cell culture model in SCI media at a 3:1 hepatocyte: NPC ratio. A 3:1 Hepatocyte:NPC ratio improves co-culture viability and phenotypic marker expression. Representative brightfield images of hepatocytes alone (A) or in co-culture at a 4:1 (E) or 3:1 (I) hepatocyte:NPC ratio. After 4 days in culture, mono- and co-culture wells were stained for hepatocyte marker HNF4α (green, B, F, J). EdU incorporation, orange staining, and desmin, red staining, was tested to examine differentiated state of hepatocytes. Cells were also stained with NPC marker LYVE-1 (red, D, H, L). All nuclei were counterstained with DAPI (blue), and all images are 20X.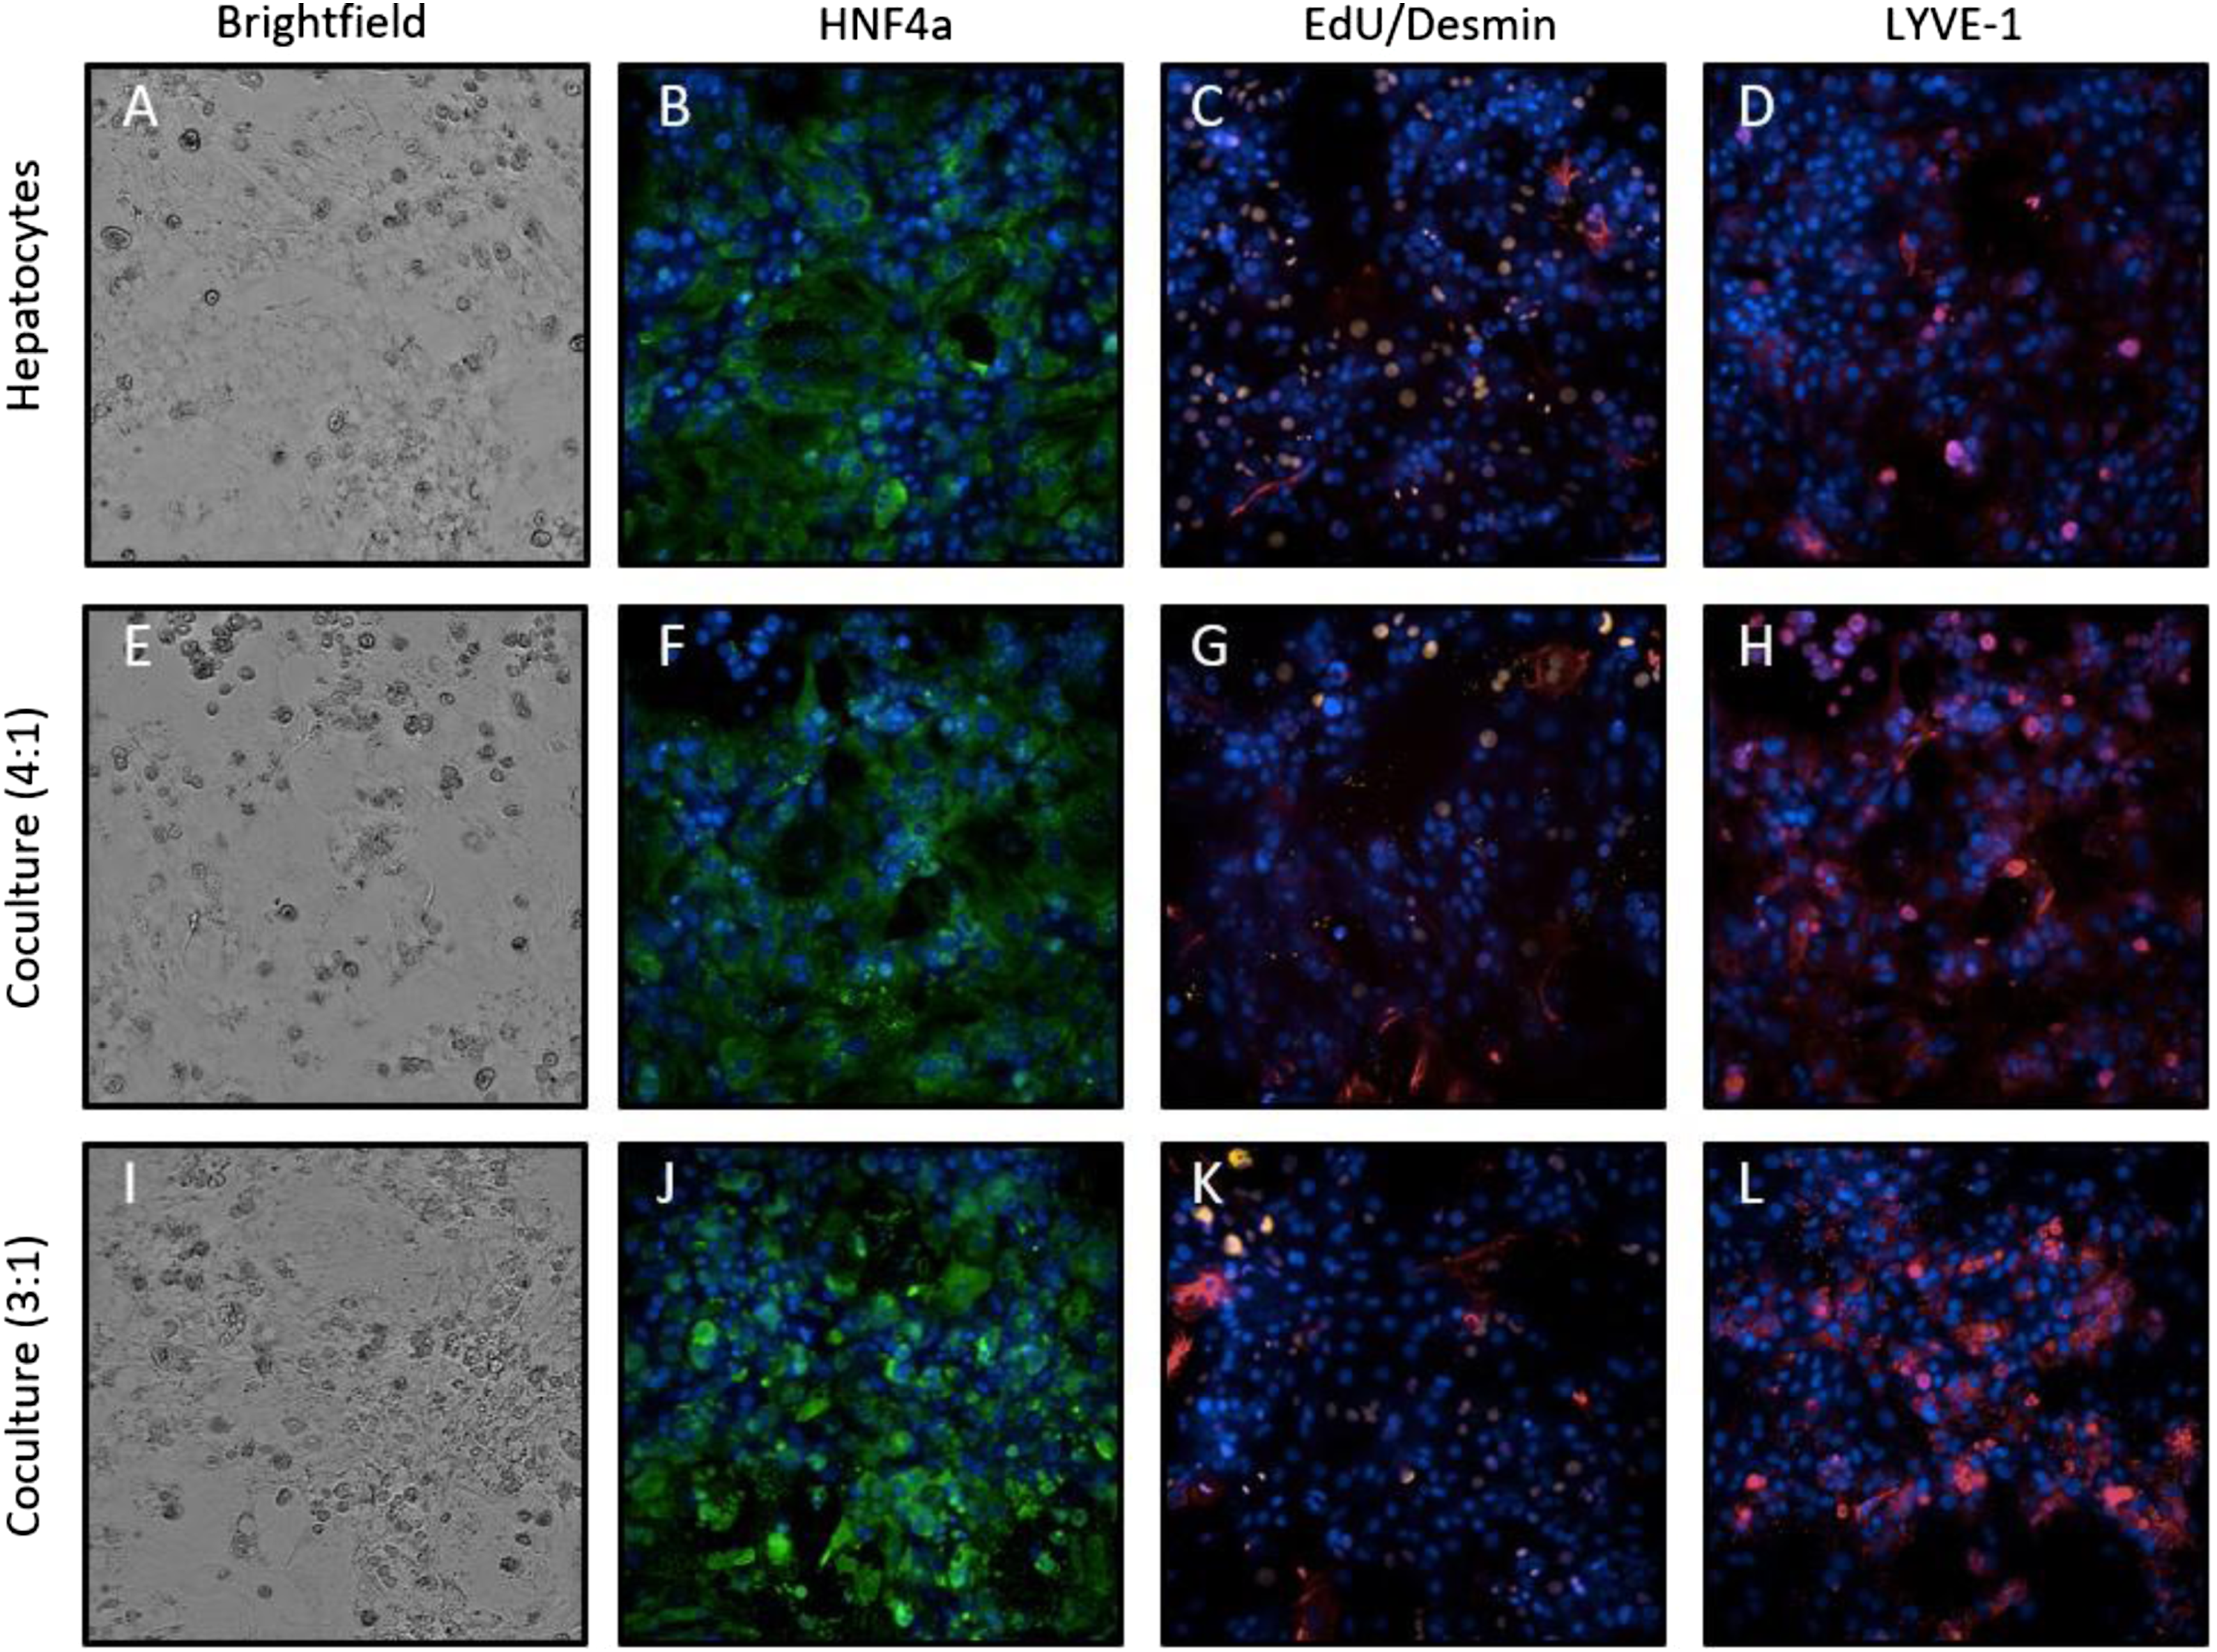
Examining Responses of the Mono-And Co-Cultures to APAP
We next examined the response of the co-culture and mono-culture models to APAP. This analgesic causes cytotoxicity in vitro and in vivo and is an inducer of cytochrome P450 enzymes (CYPs).
22
Hepatocytes in monoculture and co-culture were treated with repeat doses of APAP for 72 hours, and viability was assessed using the Promega CellTox Green assay (Figure 7(A)). Cytotoxicity was indicated with an increase in green fluorescence signal. In both the monoculture and co-cultures there was a dose-dependent increase in cytotoxicity. However, the co-cultured cells were significantly less sensitive to APAP treatment at both 10 and 20 mM APAP (P < 0.0001). To determine whether the hepatocytes maintained their metabolic response to APAP in vitro, CYP1A2, CYP2E1, and CYP3A1 gene expression were assessed using qRT-PCR at non-cytotoxic APAP concentrations. As shown in Figure 7(B), a significant induction of CYP1A2 (P < 0.05) was observed in response to APAP treatment. APAP treatment resulted in greater expression of CYP2E1 and CYP3A1 as compared to the untreated control in both the hepatocytes and the co-culture model; however, this difference was not statistically significant. Although there was not a statistical difference in the fold change of the CYP induction between the monocultures and co-cultures in response to APAP, the hepatocytes in monoculture in general showed higher induction of the CYPs than the hepatocytes in co-culture. The effect of APAP on hepatocytes in mono- and co-culture. Hepatocytes in mono- and co-culture were treated with a repeated dose response of APAP for 72 hours as indicated in the materials and methods section. A) Cytotoxicity was assessed using CellTox Green. (* is P < 0.0001 comparing mono-to co-culture at each corresponding dose). The RFU values were normalized to UT. B). CYP1A2, CYP2E1, and CYP3A1 gene expression was assessed for mono-cultures and co-cultures treated with 0-, 5- and 10-mM APAP qRT-PCR (n = 2). 2-Way ANOVA was performed to compare the untreated control and 5 and 10 mM in the hepatocyte and co-culture models (* is P < 0.05) Fold changes were calculated by normalizing to untreated mono-cultures for each CYP. C-F). Mono-culture (C-D) and co-culture wells (E-F) either untreated (C, E) or treated with 10 mM APAP (D, F) were immunostained for desmin, and nuclei are visualized with DAPI. Nine representative fields from each treatment were stitched together using Opera Phoenix image analysis software (each field is 20X).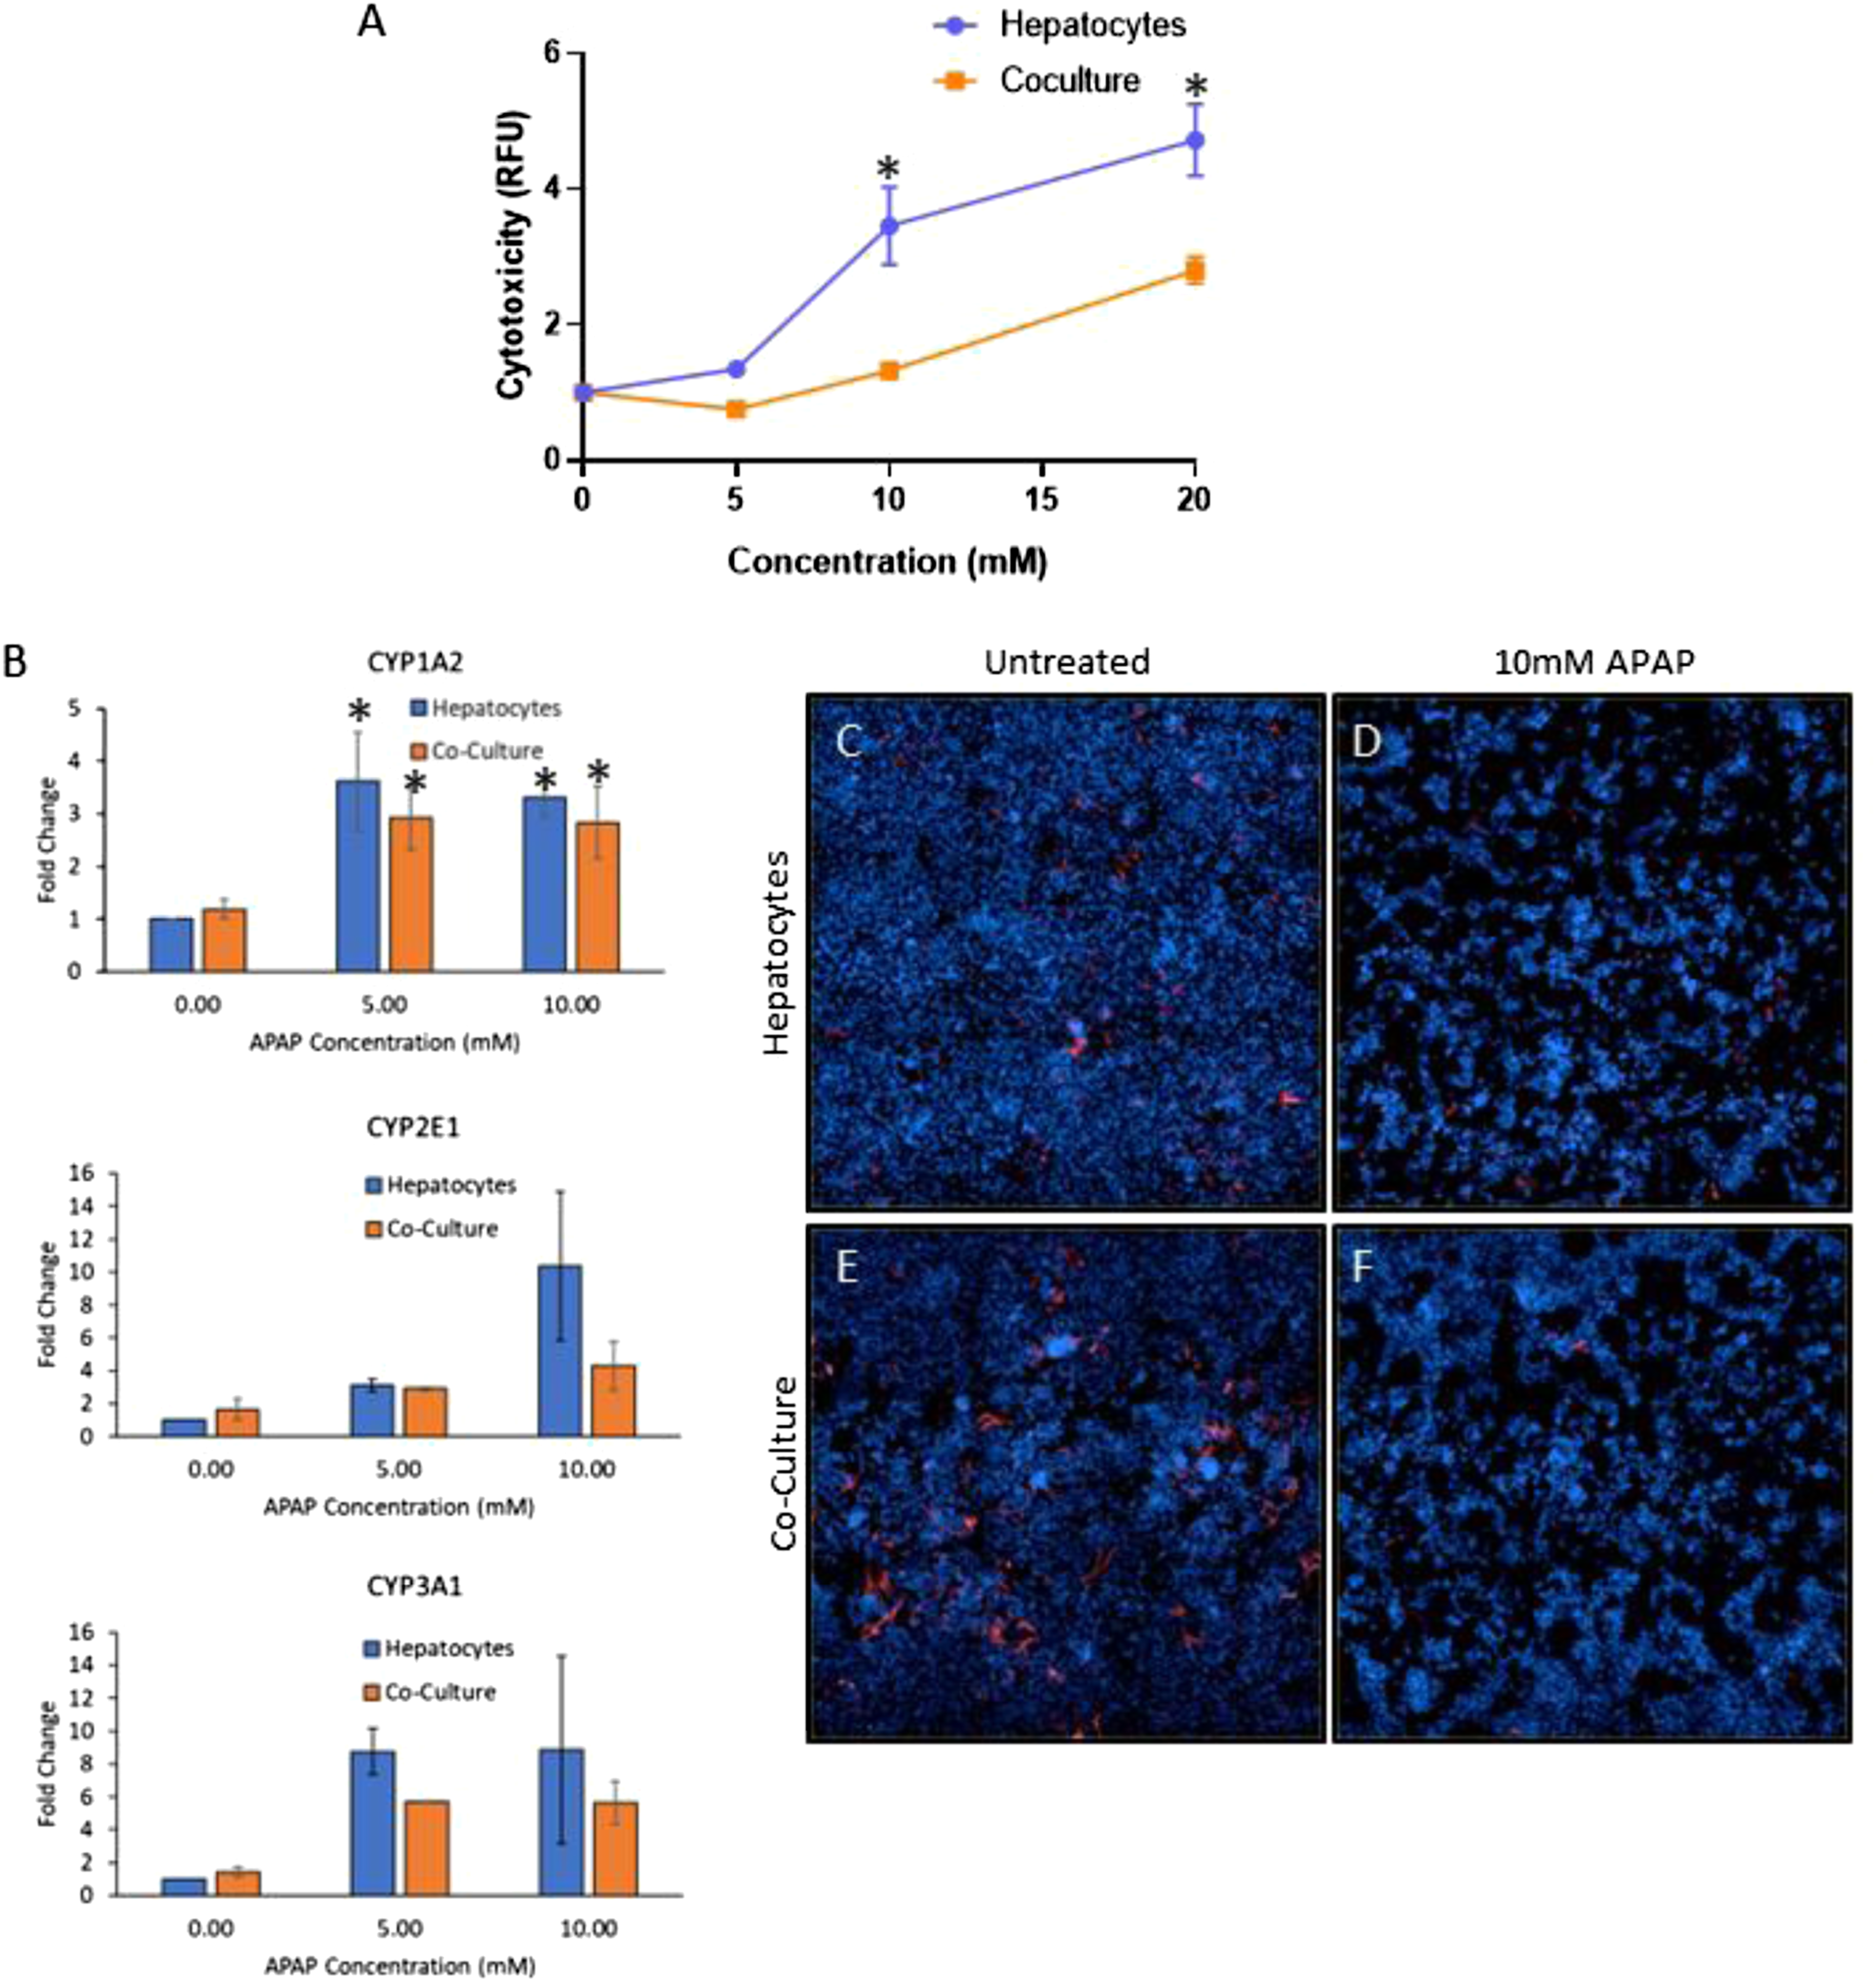
As observed both in vitro and in vivo [21-26], our studies indicate that the NPCs mitigated the response of the hepatocytes to APAP treatment.22-27 However, there is little data describing the effects of APAP on the NPCs. To visualize effects of APAP on SCs, the treated monocultures and co-culture models were immunostained for desmin. In the untreated wells, desmin staining was observed in both monocultures (Figure 7(C)) and co-cultures (Figure 7(E)). With APAP treatment there was a substantial reduction in desmin+ cells in both models, suggesting that SCs are also affected by APAP (Figures 7(D) and (F)).
Utilization of 2-D Culture Models for Transcriptomic Analysis
To assess the ability of the monoculture and co-culture models to model in vivo responses to chemical treatment, we assessed responses to phenobarbital, an agonist for the constitutive androstane receptor (CAR). 28 Short-term transcriptomic responses to phenobarbital have been reported in rat liver and primary hepatocytes. 29
Differential Gene Expression in Mono- and Co-culture Models.
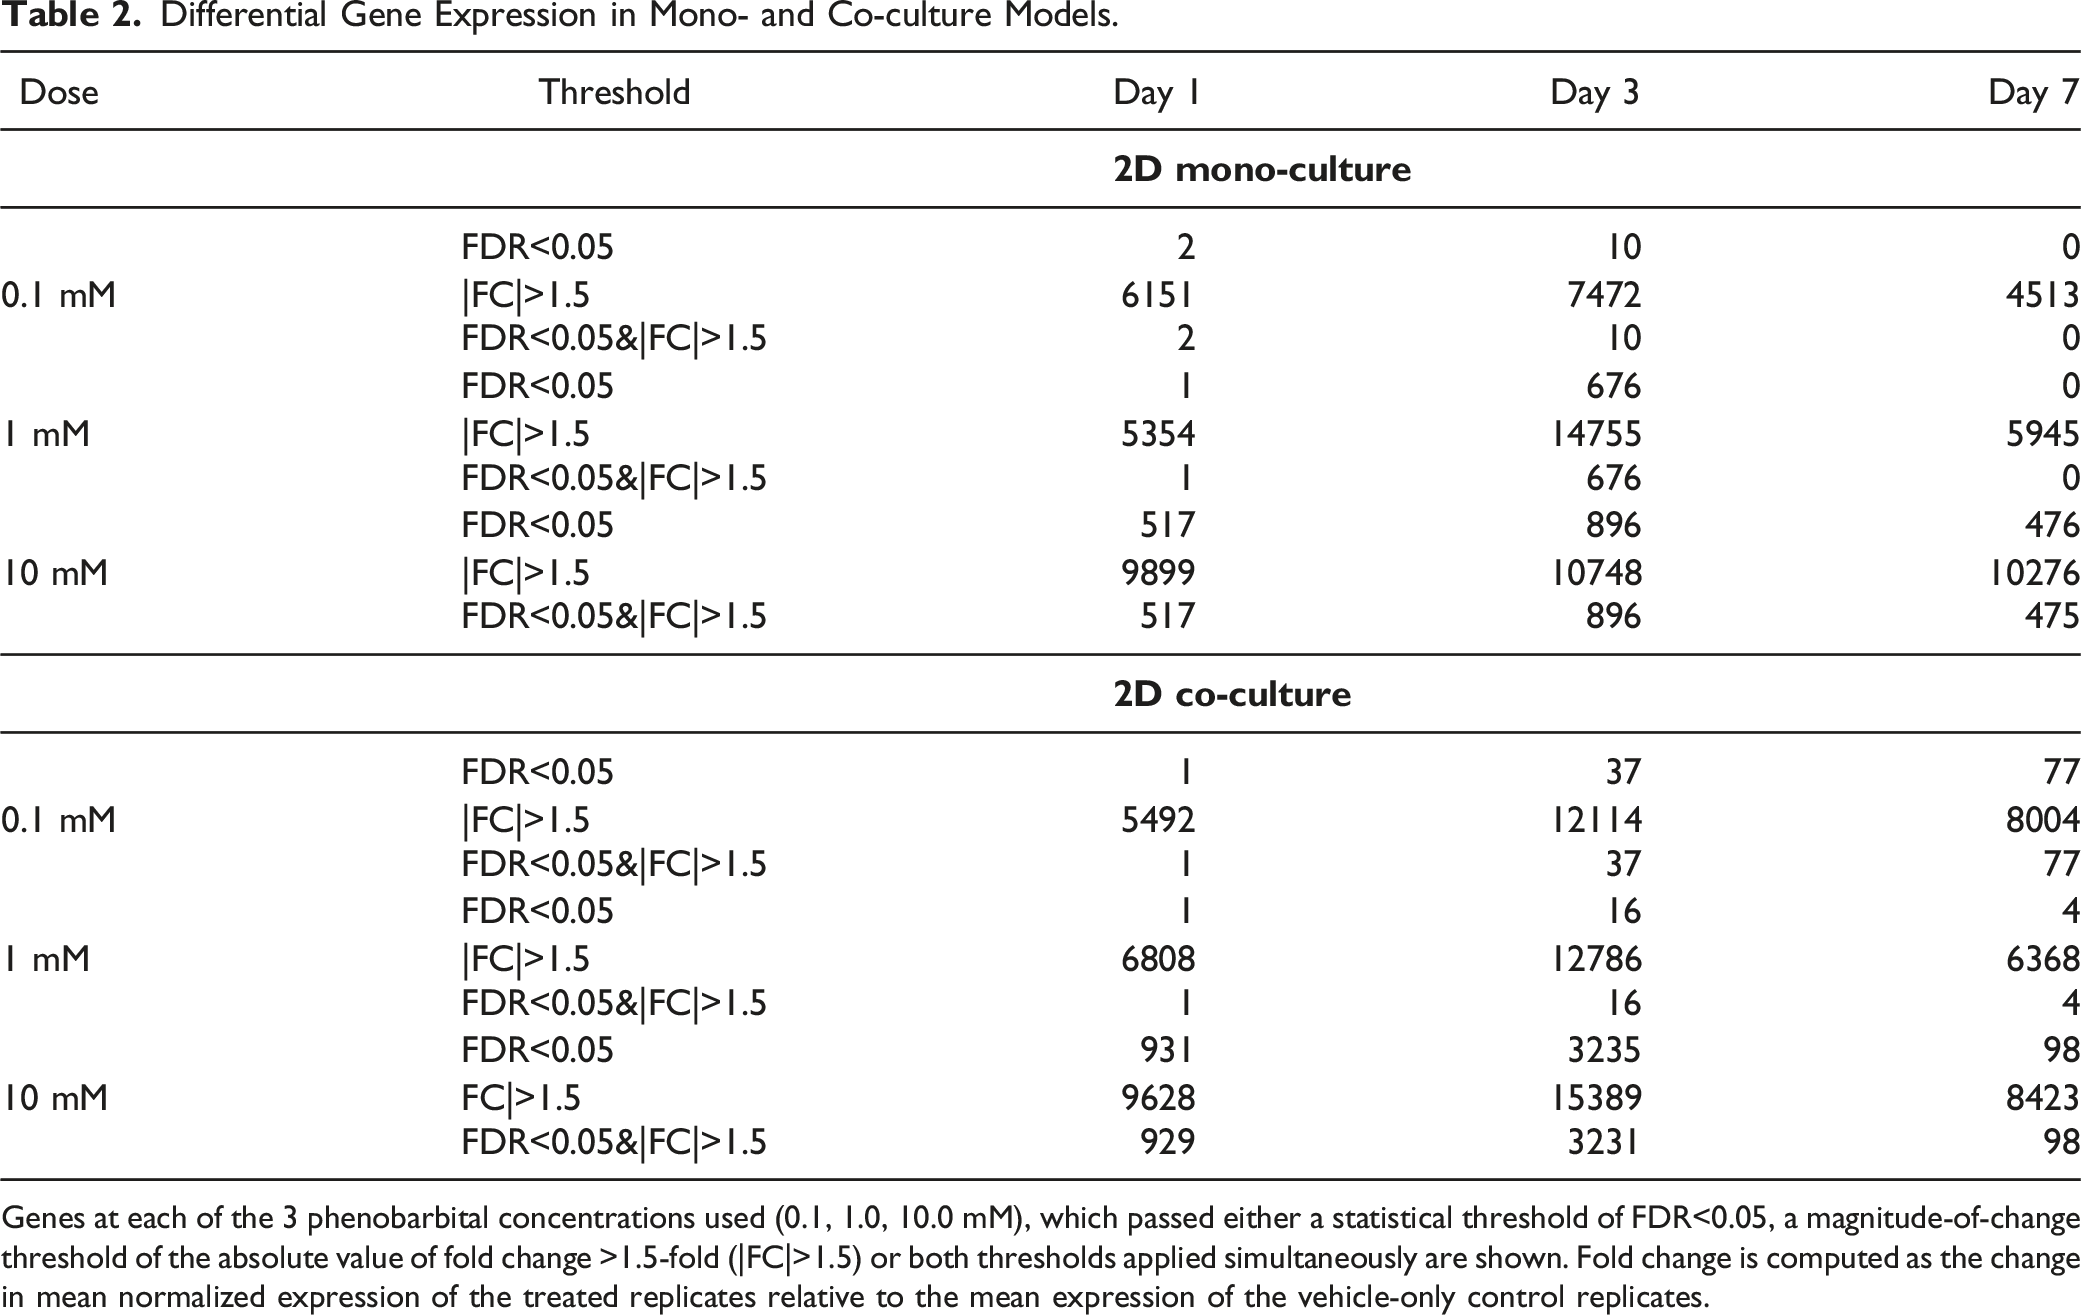
Genes at each of the 3 phenobarbital concentrations used (0.1, 1.0, 10.0 mM), which passed either a statistical threshold of FDR<0.05, a magnitude-of-change threshold of the absolute value of fold change >1.5-fold (|FC|>1.5) or both thresholds applied simultaneously are shown. Fold change is computed as the change in mean normalized expression of the treated replicates relative to the mean expression of the vehicle-only control replicates.
To determine the nature of the differential expression changes, we examined the response of both platforms to treatment with phenobarbital at the 3 concentrations (0.1, 1, and 10 mM). One of the characteristic changes in gene expression seen in liver exposed to phenobarbital is an induction in a number of Cytochrome P450 enzymes, particularly those in the CYP1a, CYP2b, CYP3a, and CYP4a families. The pattern of induction for CYP450s showed an upregulation for at least 1 dose and time point in either of the assays. Several of these showed maximal inductions in expression of 3-fold or greater (Figure 8). Additionally, 4 of the CYPs induced in vitro were also found to be significantly upregulated (FDR<0.05 and FC>+1.5) in OPEN TG-GATEs rat in vivo liver samples following a single exposure at 300 mg/kg and 24 hours. Gene expression induction in CYP450s upon exposure to phenobarbital. Shown are the collective group of CYP450s that demonstrated induction in gene expression for at least 1 of the doses and times in either assay system. CYPs marked with red asterisk (*) were also shown to be significantly induced in OPEN TG-GATEs in vivo rats exposed to a single dose (gavage) at 300 mg/kg for 24 hours. The 3 doses are shown for each time point as increasing, left to right (0.1, 1 and 10 mM).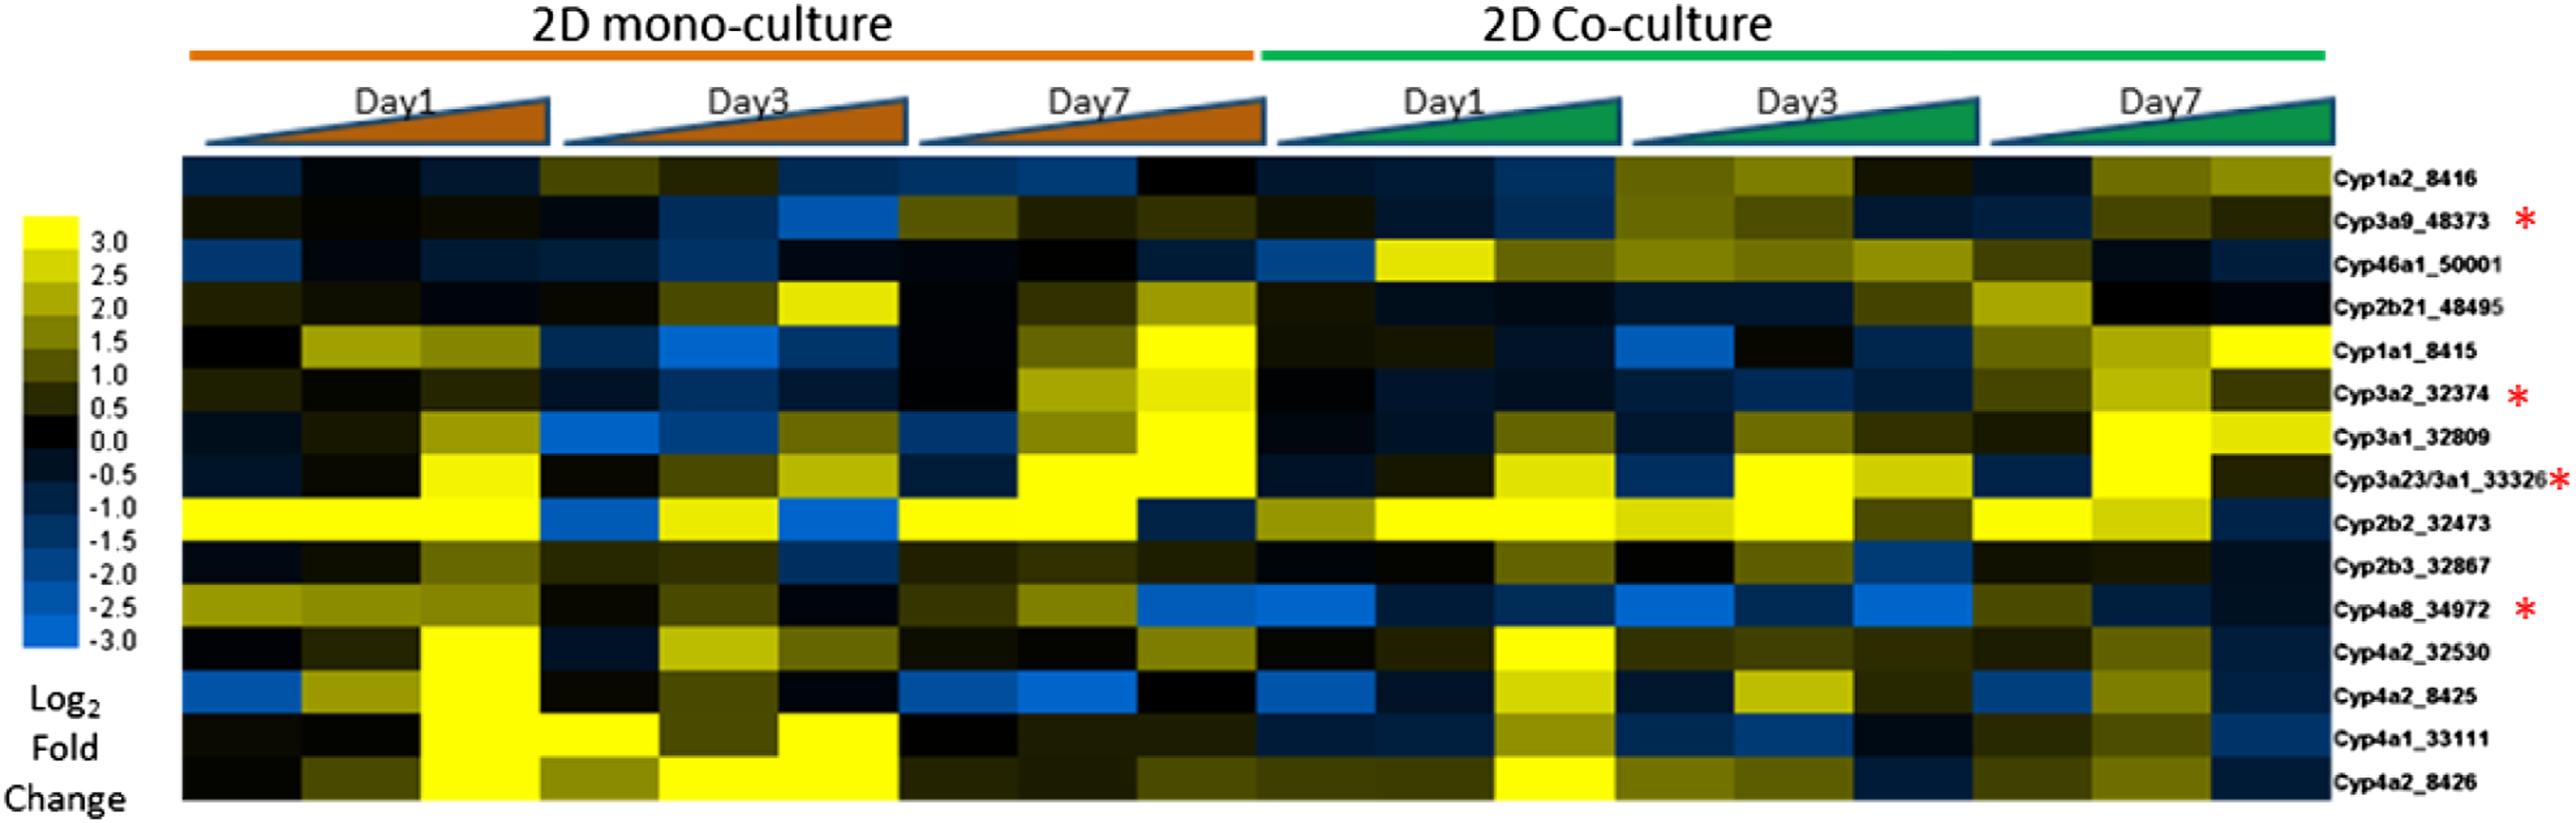
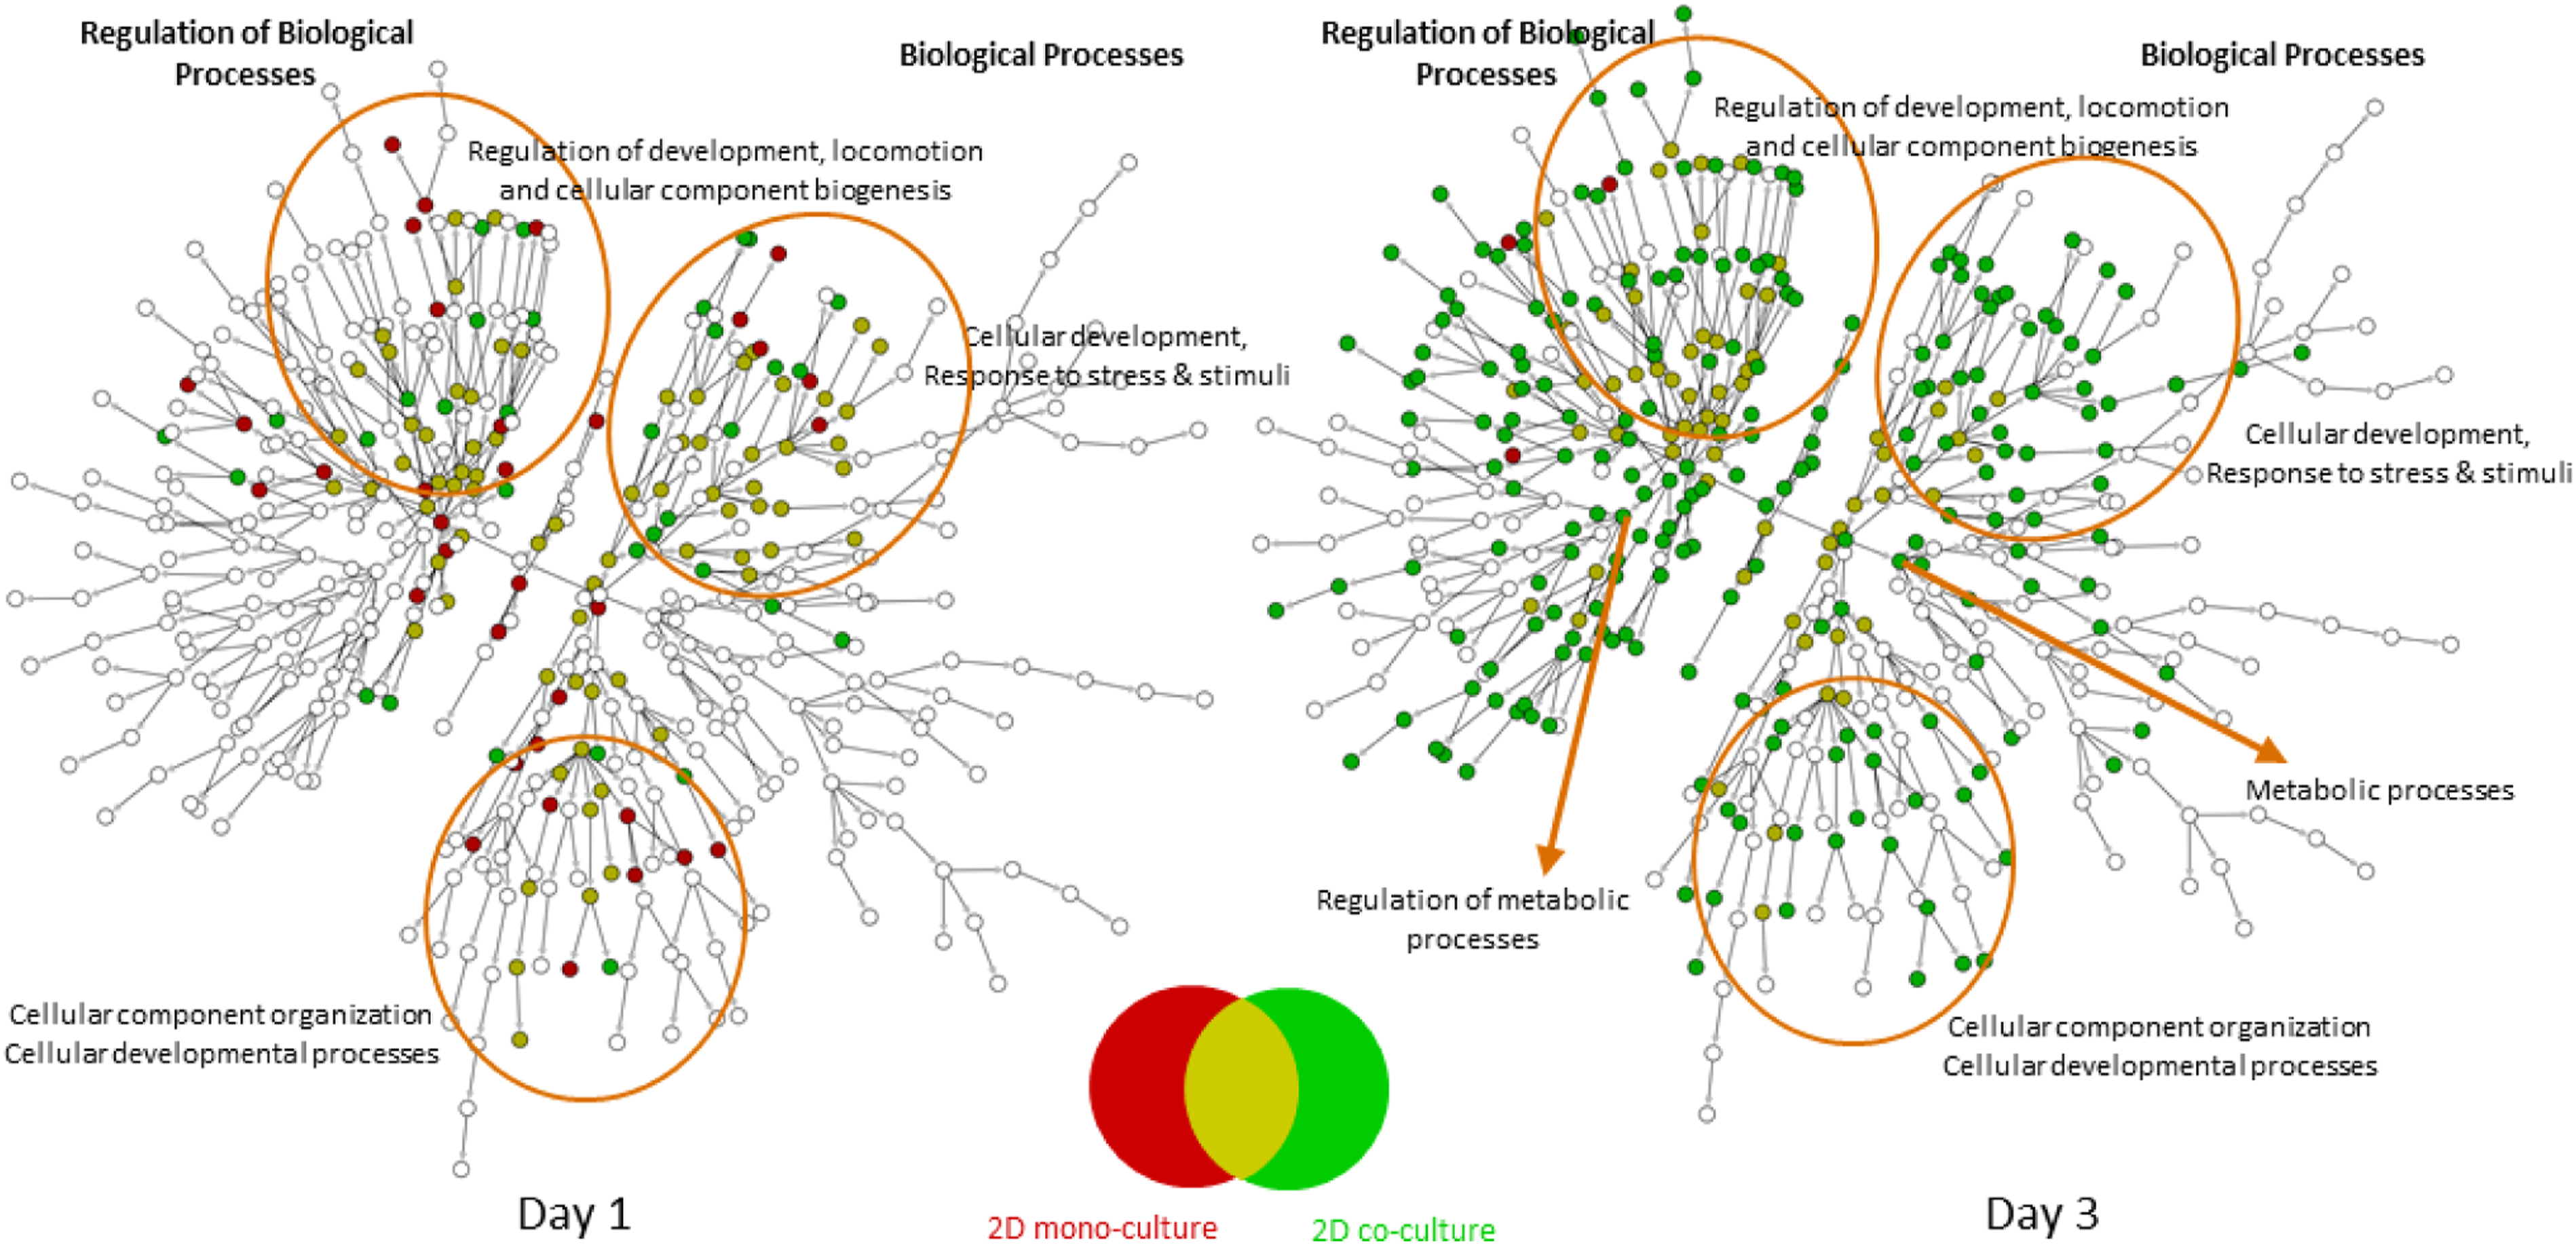
Figure 9 demonstrate the nature of the gene expression changes that were detected following phenobarbital exposure using significantly up-regulated genes (Figure 10) and significantly down-regulated genes (Figure 10). All genes used were statistically significant (FDR<0.05) and had a magnitude of change greater than 1.5-fold (either up- or down-regulated relative to vehicle samples). The ontology used for the pathway analysis was the public Gene Ontology Consortium (GO-BP - http://geneontology.org/), and the figures indicate a conventional over-representation analysis (Fisher’s exact test) overlaid on a graphical representation of the GO-BP hierarchical pathways. Up-regulation (Figure 10) had enrichment for primarily metabolic processes and the regulation of those processes. Ontology enrichment with either the mono- or co-culture system was minimal using day 1 gene lists but showed an increase in enriched pathways at day 3, particularly with the co-culture system. The co-culture treatments at day 3 also showed several pathways enriched for processes of cellular component organization that were not seen in the monoculture system. Overall, the monoculture system showed enrichment for pathways also enriched with genes from the co-culture system, but the reverse was not true. Looking at down-regulated genes (Figure 10), we see a similar pattern of increased ontology enrichment at day 3 relative to day 1. Down-regulation showed changes in pathways associated with regulation of developmental processes and cellular component biogenesis, as well as biological processes associated with those regulation pathways. There were also numerous enriched pathways related to response to stimuli, response to stress, and response to xenobiotics. None of these pathway groups were enriched with up-regulated genes. However, as seen with up-regulated genes, there is ontology enrichment for down-regulated genes in metabolic processes and cellular component organization and cellular developmental processes, and these pathway groups were enriched with down-regulated genes from both the mono- and co-culture assays. Ontology enrichment (GO-BP) using gene lists for significant up-regulated genes (FDR<0.05 and FC>+1.5) after exposure to phenobarbital at 10 mM for one and 3 days. Nodes in red are enriched using gene lists from the mono-culture assay, while those in green are enriched using gene lists from the co-culture assay. Mustard nodes indicate ontology categories enriched with both gene lists. Ontology enrichment (GO-BP) using gene lists for significantly down-regulated genes (FDR<0.05 and FC<−1.5) after exposure to phenobarbital at 10 mM for one and 3 days. Nodes in red are enriched using gene lists from the mono-culture assay, while those in green are enriched using gene lists from the co-culture assay. Mustard nodes indicate ontology categories enriched with both gene lists.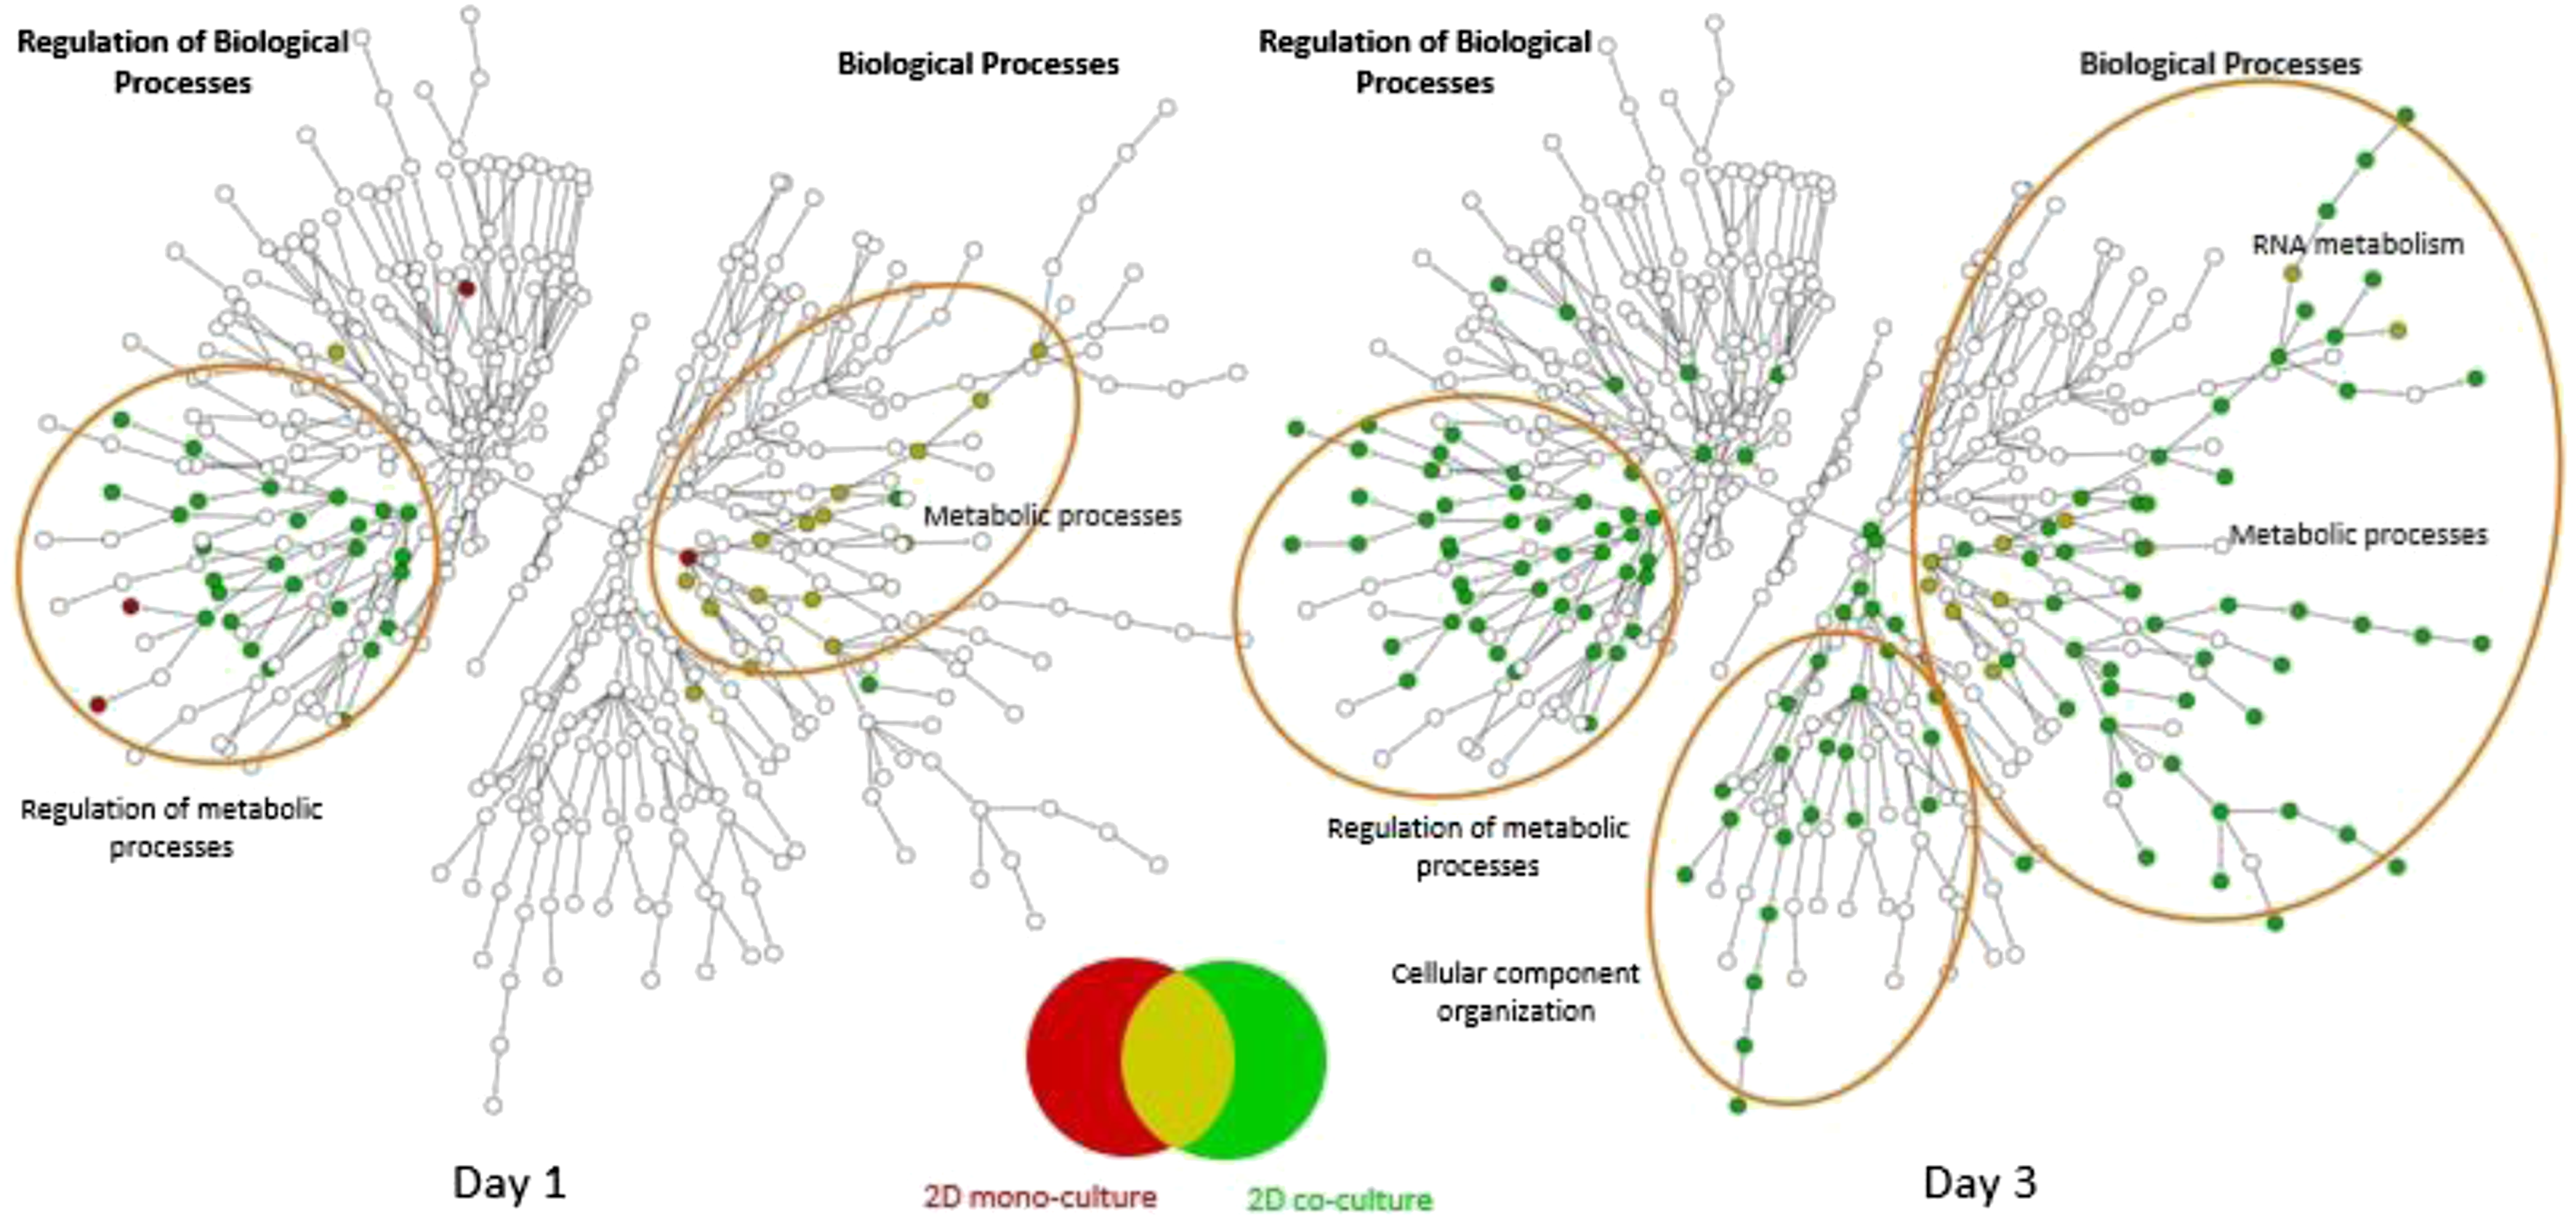
To compare the transcriptional response in the monoculture and co-culture systems to the in vivo transcriptomic response to phenobarbital, the OPEN TG-GATEs in vivo rat liver data for a single gavage exposure to phenobarbital of 300 mg/kg and 24hrs was used. Again, we selected significant genes (FDR<0.05 and |FC|>1.5) separated into up- and down-regulated lists for ontology enrichment, and the overlap between the in vitro and the in vivo response is shown (Figure 11). Although there was a small number of nodes enriched in all 3 models (gray circles, Figure 11), there was a high degree of concordance between the co-culture response and the in vivo response to phenobarbital (Figure 11, pale blue circles). In addition, those nodes enriched with gene lists from all 3 experimental groups (gray nodes) were in the very high-order ontology categories (eg, metabolic process enriched with hundreds of genes from each of the experiments) and are not highly informative of changes in cellular response, as they encapsulate more specific downstream processes associated with the parent category. The overlap of the co-culture system with the in vivo response was not observed in the monoculture model, with only 2 nodes showing commonality between only the monoculture and the in vivo response (Figure 11, purple circles). There were also a substantial number of nodes that were enriched only in the in vivo transcriptome (dark blue circles, Figure 11), which is unsurprising given the fact that our in vitro models are still two-dimensional surrogates and unlikely to fully capture the more integrated in vivo response. To quantify the degree of the ontology enrichment, overlap between the in vitro models and the in vivo signal, we used a Modified Jaccard Index (MJI), which is a measure of the similarity of the recovered ontology pathway information between 2 transcriptomic datasets.
30
The comparison of the monoculture in vitro system to the TG_GATEs in vivo yielded an MJI of 0.100, while the co-culture in vitro system compared to the in vivo yielded an MJI of 0.147. This represents a 32% increase in the similarity of the co-culture ontology information over that of the mono-culture, relative to the TG-GATEs in vivo ontology enrichment.
29
Once again, the co-culture model more faithfully recapitulated the breadth of transcriptional responses seen in vivo after a single dose of phenobarbital. This suggests that the co-culture model could be more useful for in vitro assessment of chemical response at both the phenotypic and transcriptomic levels. Overlap in ontology enrichment with 2D mono- and co-culture systems and OPEN TG-GATEs in vivo single dose exposure for phenobarbital. Red indicates enrichment using the union of up- or down-regulated genes from the 2D mono-culture system on days 1 and 3, while green indicates enrichment using the analogous lists from the 2D co-culture system. Blue indicates enrichment using genes from OPEN TG-GATEs microarray experiments from in vivo rat liver samples after exposure to a single dose (gavage) at 300 mg/kg and 24 hours. Up- and down-regulated genes were selected based on the same significance criteria used with the TempO-Seq count data (ie, FDR<0.05 and |FC|>1.5). Gray nodes indicate enrichment for gene lists from all 3 experiments. Mustard-colored nodes indicate enrichment with both in vitro assays only (ie, no enrichment with in vivo differentially expressed genes). Pale blue nodes indicate enrichment with both the 2D co-culture system and the in vivo differentially expressed genes (but not with genes from the 2D mono-culture system). Pale purple nodes indicate enrichment with both the 2D mono-culture systems and the in vivo experiment (but not enriched with genes from the 2D co-culture system).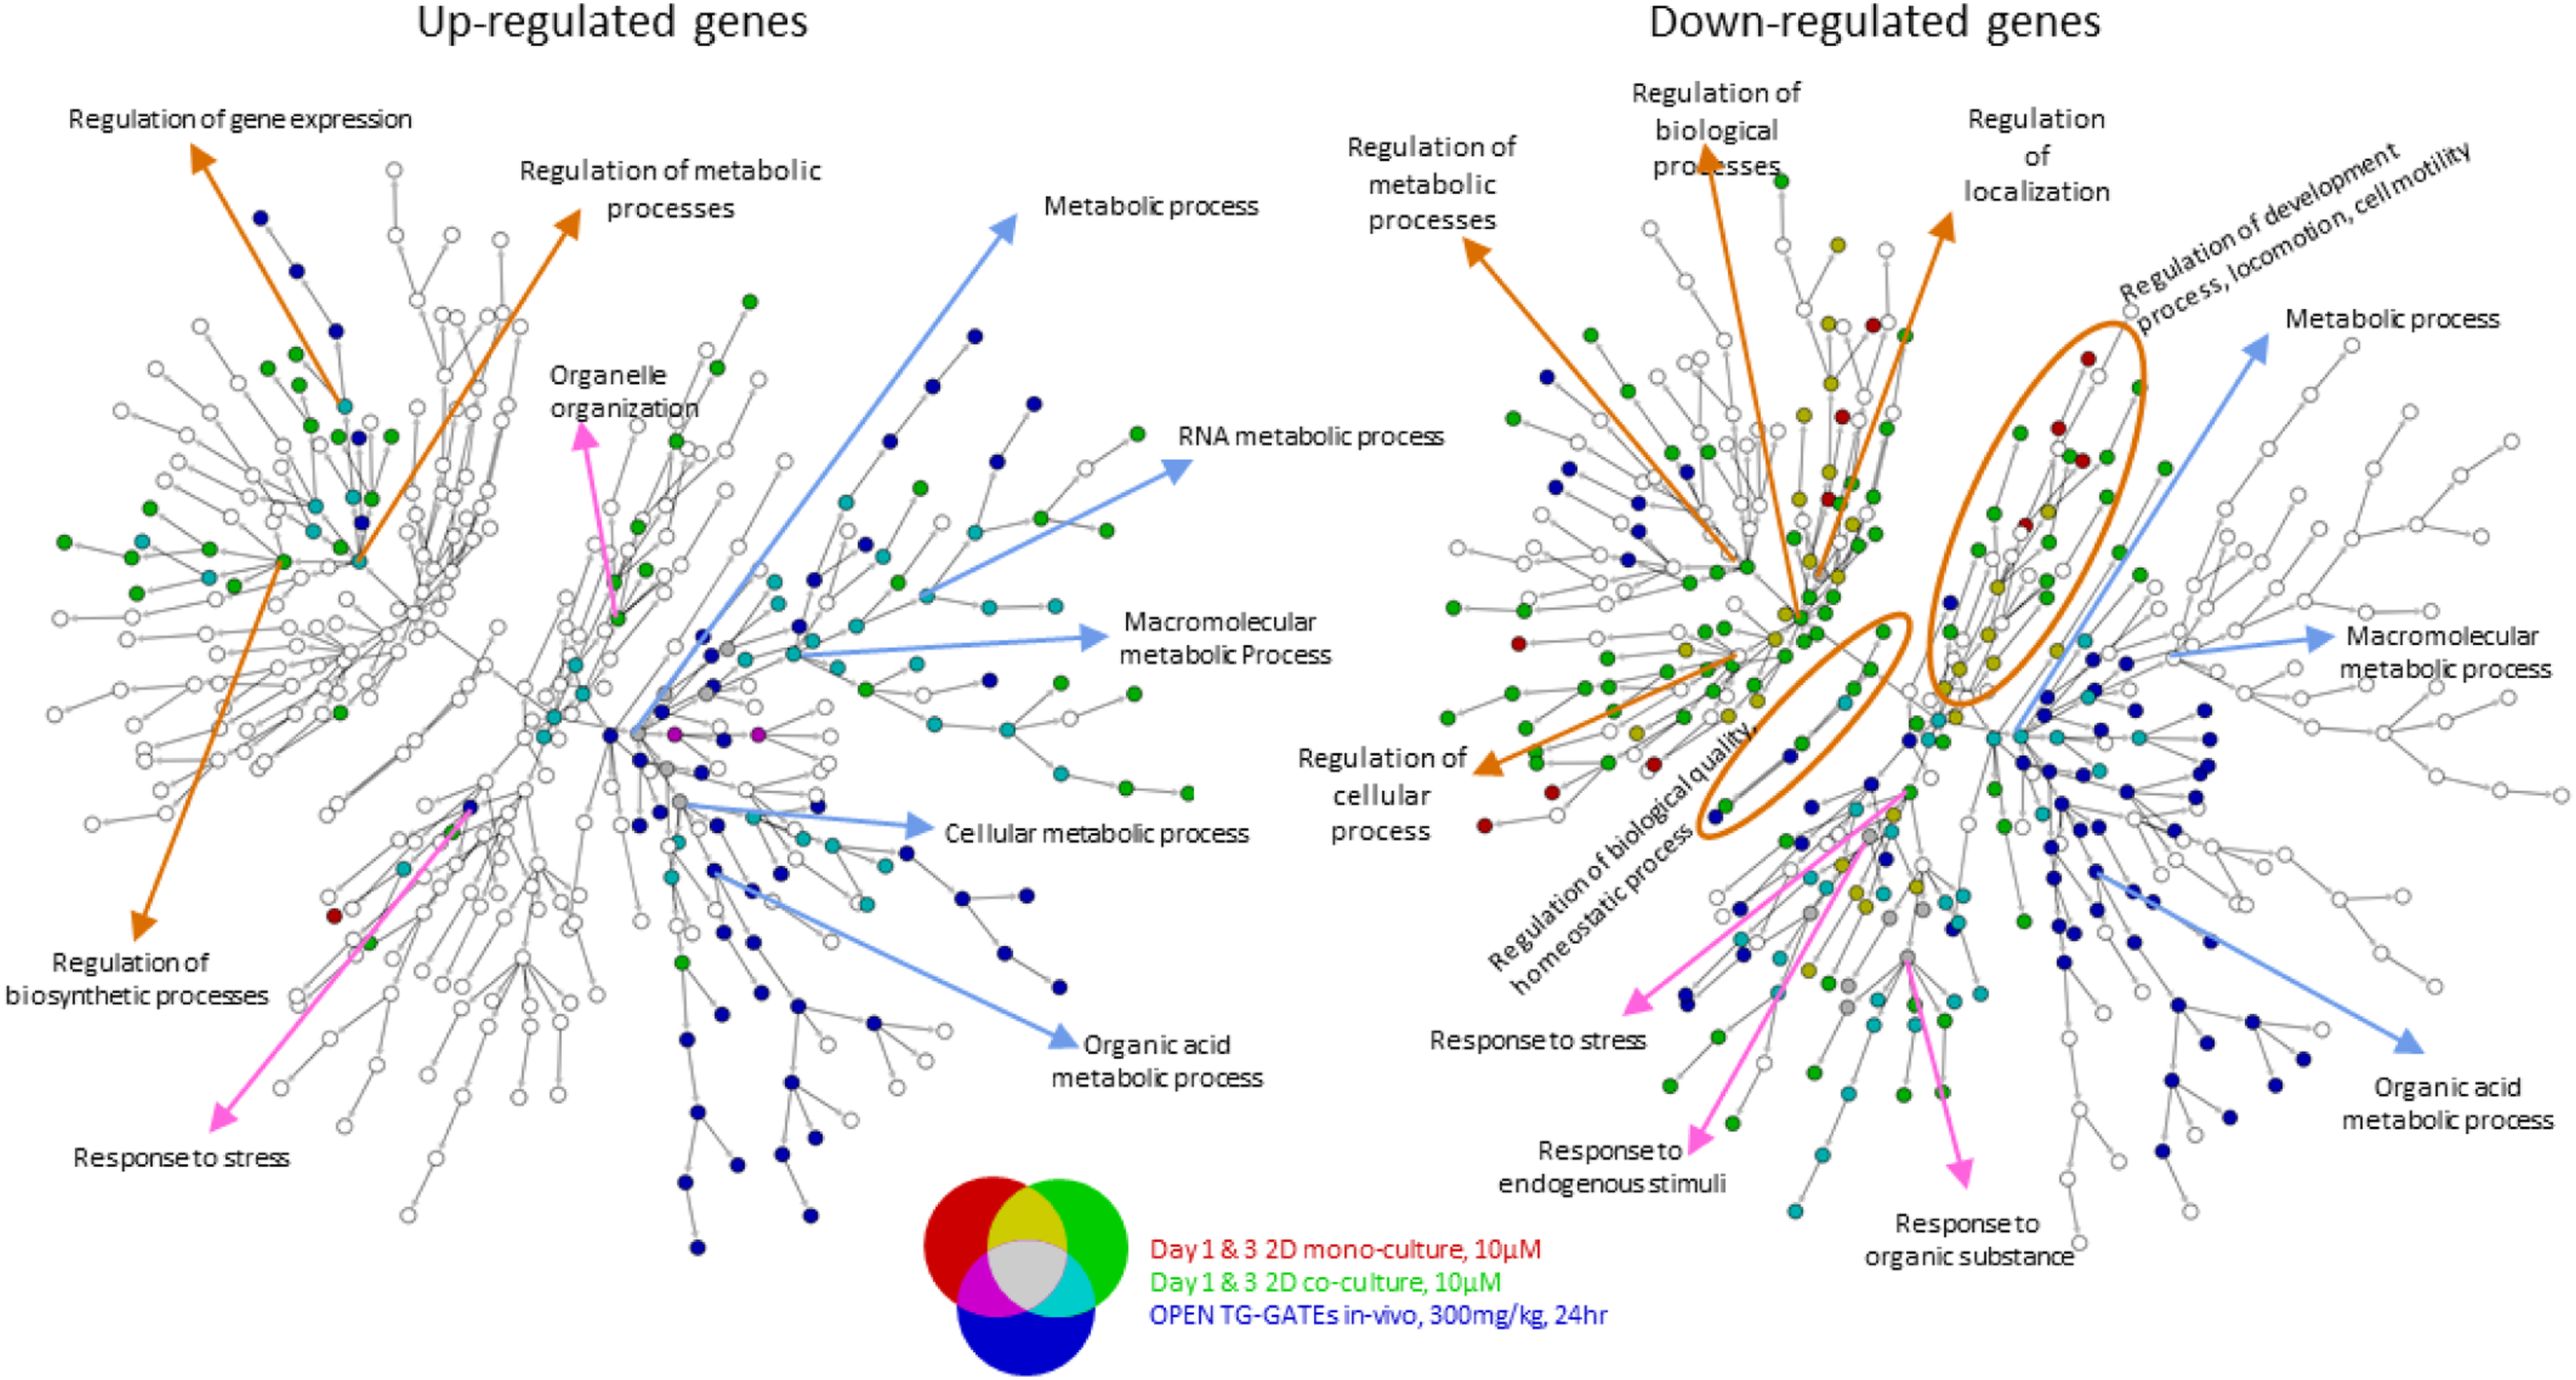
Discussion
Co-Culture of Primary Hepatocytes and NPCs Improves Hepatocyte Function
The goal of NAMs that we investigated in our studies is to use shorter-term, more mechanistically based assays to infer what doses would result in responses in humans and determine possible responses to expect in human tissues without the use of animal testing. However, existing regulatory decisions are principally based on rodent data. Key in vitro rodent models that re-capitulate in vivo responses would be valuable to establish confidence in NAMs for purposes of human health risk assessment. The development of a reliable co-culture model for assessing liver toxicity would allow bridging to the large body of data on in-life responses. Our attempts to culture primary rat hepatocytes with commercially available NPCs yielded organized in vitro cultures that appeared similar to the in vivo liver architecture. However, in this system the LSECs propagated in vitro, hepatocytes did not maintain viability; LSECs proliferated robustly in vitro and took over the co-culture well. In contrast to ordering commercial cryopreserved cells, freshly isolated of hepatocytes and NPCs are harder to get due to the time and expertise required for this technique. While we benefited from the proximity of Lonza to our location to commercially buy these freshly isolated cells, this technique is usually very time consuming and requires technical expertise in this field. Despite these disadvantages, however, we observed that the co-culture of these freshly isolated primary hepatocytes with the matched freshly isolated primary non-parenchymal cells from the same animal had normal hepatocyte differentiation, viability, and canonical marker expression. Clearly, in vitro culture conditions phenotypically alter the NPCs. Despite procuring functionally characterized LSECs and stellate cells that had been isolated from gender-matched Sprague Dawley rats, the commercial cells were unable to contact inhibit in culture or support hepatocyte survival. In addition, commercial SCs did not survive in the same culture conditions as the LSECs and primary rat hepatocytes. These commercial cells, which had been cryopreserved and adapted to growth on plastic, and in defined media, no longer behaved with an in vivo phenotype. However, we observed in our studies that both primary hepatocytes and primary NPCs isolated from the same rat survived in vitro under similar optimized media conditions. This suggests that freshly prepared cells from the same animal can maintain their in vivo phenotypic responses in co-culture conditions. This observation may either indicate the absence of phenotypic drift using freshly isolated cells or that cells isolated from the same animal are more capable of maintaining mixed cellular phenotype.
Maintaining Hepatocyte Differentiation in Vitro
The inclusion of primary NPCs was critical for maintenance of a differentiated hepatic morphology, including E-cadherin expression at cell-cell interfaces and minimal basal DNA synthesis. In vivo, hepatocytes are largely quiescent. 31 In response to a xenobiotic insult causing cytotoxicity and nuclear receptor activation, hepatocytes can be stimulated to proliferate. In vitro, hepatocytes rapidly de-differentiate, undergo EMT, and lose polarity, leaving them in a primed state to proliferate. Thus, testing the effects of unknown chemicals on de-differentiated hepatocytes does not accurately predict in vivo behavior. Our co-culture model more accurately represents the in vivo differentiated hepatocyte phenotype with low proliferation.
Assessment of Hepatotoxicity in Vitro
To be useful for hazard and/or risk assessment, an in vitro liver assay should recapitulate known responses to chemical insults. As an initial proof-of-concept, the monocultures and co-culture models were treated with APAP to induce cytotoxicity. Although APAP was cytotoxic at the highest dose in both models, the co-culture model demonstrated lesser toxicity at lower doses. These data are consistent with in-life studies showing that NPCs, particularly activated HSCs, and KCs, can attenuate the response of hepatocytes to APAP treatment.22-27 Both hepatocytes and SCs were sensitive to APAP treatment, as evidenced by the loss of SCs in response to APAP. Multiple cell types in the intact liver and the co-culture model are affected by APAP.
In addition to assessing the phenotypic effects of APAP treatment, increases in mRNA for several CYPs were also evaluated for the mono- and co-cultures. APAP is metabolized to form a highly reactive metabolite, N-acetyl-p-benzoquinone imine (NAPQI), by cytochrome P450 enzymes such as CYP2E1 and CYP1A2.32,33 In response to APAP treatment, the mono-cultured hepatocytes had a 10-fold upregulation of CYP2E1, suggesting that the hepatocytes in vitro are responsive to APAP and are metabolically competent. In comparison, the co-cultured hepatocytes showed only a 4-fold induction in CYP2E1, a reduction that is consistent with the decreased APAP-induced toxicity observed in co-culture compared to the monoculture. Overall, both the monoculture and co-culture models maintained hepatocyte functionality and could be useful for assessing hepatotoxicity in vitro. However, inclusion of the NPCs in the culture system appeared to model the in vivo response more accurately at both a phenotypic and metabolic level.
Transcriptional Response of Co-culture Model
To further evaluate the co-culture system, we used a whole transcriptome-based approach to examine the effects of the CAR-agonist phenobarbital on the mono- and co-culture models.
Changes in gene expression upon phenobarbital exposure were evident at 1 and 3 days with an abrupt increase in the number of significantly altered genes at the highest dose used. Large numbers of genes were affected using a criterion of at least a 1.5-fold change for both mono- and co-culture treatment. As a best practice, such a magnitude-of-change threshold is usually combined with a statistical threshold and genes selected by such a dual-threshold used in ontology-based MoA analyses. 34 The dispersion of the 4 vehicle replicates at day 7 (Figure 8) led to the inability to distinguish statistically significant changes in treated samples and may be the result of changes over days of treatment and with associated increases in the variance of the mean expression estimates. Thus, while the cells were clearly still viable at day 7 with large numbers of genes with altered gene expression levels, there was a loss of statistical confidence likely due to the confounding issues of cellular drift in culture. Further work to define with culture conditions needed to maintain function for 7-days should help to stabilize response and reduce the variance between samples.
Despite these technical challenges, the magnitude of the transcriptomic response was significantly greater in the co-culture model compared to the mono-culture model. When the models were treated with phenobarbital, the co-culture model showed a 32% greater enrichment in ontology overlap with the in vivo liver response to phenobarbital as compared to the mono-culture cells. The recovery of the ontology signal during a short culture period of just 3 days is also a promising sign as the field of toxicology seeks greater throughput for NAMs. Furthermore, when the ontology enrichments in response to phenobarbital of the in vitro monoculture and co-culture were compared to in vivo responses, there was significant overlap between the co-culture model and the in vivo response but not of the in vivo response with the monoculture. Thus, the co-culture model again appeared more representative of the transcriptional response observed in vivo. Although use of short-term exposures was useful here for proof-of-concept, we expect that these models may also be used for repeat dosing studies that could shed light on the effects of sustained exposure on the transcriptional response. The longer-term exposures will need even more attention to maintain phenotypic and transcriptomic measures of cellular stability.
Applications of in Vitro Liver Models for Toxicity Testing
The continual refinement of the co-culture model produced a more reproducible, long-lived in vitro culture system. Our detailed efforts to improve the co-culture model had the added benefit of also improving the monoculture model, significantly extending the viability and functionality of the hepatocytes whether in co-culture or in the monoculture. In both models, the hepatocytes were viable well beyond the typical 24-48 hours for primary hepatocytes. There are clear benefits to having both a mono- and co-culture model for in vitro chemical assessment, as it is important to consider the questions that need to be addressed when choosing a NAM for chemical safety testing. For example, an initial assessment of chemical toxicity and dosing would be unlikely to require an organotypic model, and the simpler 2D monoculture model would be sufficient. In contrast, a candidate chemical further along in a developmental pipeline or with higher anticipated human exposures could be examined with the 2D co-culture model with cellular, molecular, and transcriptomic read-outs. If long-term repeat dosing beyond 7 days is required for phenotypic development or to maintain metabolic competence, monoculture or co-culture 3D models could be next-line models for further mechanistic study.4,35 Although these complex, organotypic 3D models may be appealing for toxicity testing, these models are not without limitations. They are often significantly more expensive than simpler methods and can only be tested at a lower throughput than 2D models, with fewer compounds and doses. Our models, developed in a 96-well plate format, are amenable to interrogating multiple doses and replicates in the same plate. In addition, using both mono- and co-culture models in tandem could allow for direct comparisons of the effects of compounds in the presence or absence of NPCs.
In summary, we document the development of an in vitro rat multi-cell type liver co-culture assay. Initially, this NAM could have value in assessing dose response for compounds tested in rats and determine if the responses seen in the co-culture provide good predictions of doses leading to in-life responses.
Supplemental Material
Supplemental Material - Comparison of Rat Hepatocyte 2D-Monocultures and Hepatocytes Non-Parenchymal Cell Co-Cultures for Assessing Chemical Toxicity
Supplemental Material for Comparison of Rat Hepatocyte 2D-Monocultures and Hepatocytes Non-Parenchymal Cell Co-Cultures for Assessing Chemical Toxicity by Amy J Stefanowicz, Leslie Recio, Michael B Black, Tyler Beames, Melvin E Andersen, R Allysa Stern, Rebecca A Clewell, Patrick D McMullen, Jessica K Hartman, and Aarati Ranade in International Journal of Toxicology
Footnotes
Author Contributions
Stefanowicz, A. contributed to conception and design, contributed to acquisition, analysis, and interpretation, drafted manuscript, and critically revised manuscript; Black, M. contributed to conception, contributed to analysis, and drafted manuscript; Beames, T. contributed to acquisition and analysis and drafted manuscript; Anderson, M. contributed to conception, contributed to interpretation, drafted manuscript, and critically revised manuscript; Stern, A. contributed to analysis and drafted manuscript; Clewell, R. contributed to conception, contributed to interpretation, and drafted manuscript; McMullen, P. contributed to conception, contributed to analysis and interpretation and critically revised manuscript; Hartman, J. contributed to acquisition and analysis and drafted manuscript; Ranade, A. contributed to conception and design, contributed to acquisition, analysis, and interpretation, and drafted manuscript. All authors gave final approval and agree to be accountable for all aspects of work ensuring integrity and accuracy.
Declaration of Conflicting Interests
The author(s) declared no potential conflicts of interest with respect to the research, authorship, and/or publication of this article.
Funding
The author(s) disclosed receipt of the following financial support for the research, authorship, and/or publication of this article: This work was supported by the American Chemistry Council Long Range Research Initiative (contract #2323), and the Dow Chemical Company.
Supplemental Material
Supplemental material for this article is available online.
References
Supplementary Material
Please find the following supplemental material available below.
For Open Access articles published under a Creative Commons License, all supplemental material carries the same license as the article it is associated with.
For non-Open Access articles published, all supplemental material carries a non-exclusive license, and permission requests for re-use of supplemental material or any part of supplemental material shall be sent directly to the copyright owner as specified in the copyright notice associated with the article.