
Abstract
The 5-year relative survival rate estimate of treated patients with non-rhabdomyosarcoma soft tissue sarcomas (NRSTS) is ∼50% since they generally present with tumor progression, relapse, metastasis, and/or chemoresistance. The expression of cytochrome P450 (CYP) enzymes in malignancies can affect the pharmacology of drugs commonly used in chemotherapy or confer susceptibility to development of chemical carcinogenesis; in addition, their specific tumor expression can be used as a therapeutic target. Using qPCR and Western blot assays, the expression of CYP1B1, CYP2E1, CYP3A4, and CYP3A5 were analyzed in a cohort of tumor tissue paired with non-malignant adjacent tissue of patients with NRSTS. The mRNA and protein expression of CYP1B1, CYP2E1, and CYP3A4 were significantly increased in tumor tissue. We propose that the expression of these isoforms is related to carcinogenesis and chemoresistance frequently observed in these neoplasms.
Introduction
Non-rhabdomyosarcoma soft tissue sarcomas (NRSTS) represent a rare and heterogeneous group of mesenchymal malignancies with more than 50 histological subtypes that differ from one another in terms of their biology, clinical behavior, and treatment response.1,2 NRSTS account for approximately 8% of all childhood cancers and 50% of all sarcomas in children (defined as those occurring before 18 years of age). 3 Although its etiology remains unknown, genetic and environmental factors are known to contribute to the risk of NRSTS. It has also been shown that prenatal exposure to chemical carcinogens, such as petroleum derivatives and pesticides, is closely related to the development of NRSTS.4,5 Current treatment for childhood NRSTS involves multiple modalities including surgery, radiotherapy, and chemotherapy. However, in patients with metastatic and recurrent disease, these therapeutic strategies are still ineffective and plagued by disease resistance. Moreover, the 5-year survival rate for these patients is approximately 50%.4,6
Cytochromes P450 (CYPs) are a superfamily of genes encoding a large and diverse group of heme proteins involved in the metabolism of numerous xenobiotics and endogenous substrates in humans, with 57 functional CYP genes identified to date. 7 Although the majority of CYP reactions involve the introduction of polar groups to parent compounds to enable detoxification and excretion, some CYPs, such as CYP1B1 and CYP2E1, are involved in the activation of procarcinogens, leading to the formation of electrophilic reactive intermediates that can bind to DNA, giving rise to DNA adducts that eventually cause mutations and trigger carcinogenesis.8-11 Currently, the degree of expression of CYP enzymes has been analyzed in different malignancies such as cancer of the breast, ovary, prostate, liver, colon, stomach, Ewing’s sarcoma, and rhabdomyosarcoma (RMS), and it has been proposed that the increased expression of these enzymes in tumor tissues plays an important role in susceptibility to cancer.12-15 In tumors, different cytotoxic drugs can be inactivated by the action of CYPs, mainly by CYP3A4 and CYP3A5, both of which reduce the intracellular concentration of the active forms of anticancer drugs below their cytotoxic levels, resulting in variable responses to drug therapy. Therefore, local expression of CYP enzymes plays an important role in the etiology of cancers and as determinants of cancer therapy.7-9,16
Recently, we reported the overexpression of some CYP enzymes in a small cohort of patients diagnosed with infantile rhabdomyosarcoma (RMS) and soft tissue sarcoma (STS). 17 However, there is little information on the expression of CYP enzymes in the tumor and non-malignant adjacent tissues in NRSTS. Therefore, the aim of the present study was to investigate the expression profile of CYP1B1, CYP2E1, CYP3A4, and CYP3A5 isoforms in non-malignant surrounding tissues and tumor tissues of pediatric patients with NRSTS to clarify the role of CYP enzymes in the susceptibility of microenvironmental tissues to cancer development and response to anticancer therapy.
Patients and Methods
Patients and Tumor Specimens
This study was approved by the Research and Ethics Committees of the National Institute of Pediatrics (Instituto Nacional de Pediatría, INP), Mexico City, Mexico. Twenty-five patients with NRSTS were recruited from the Oncological Surgery Unit of the INP, from August 2010 to August 2016. Written informed consent was obtained from the parents or guardians and/or consent was obtained from the patients. None of the patients presented a history of previous neoplasms or a history of radiation therapy or chemotherapy.
During surgery for diagnosis or tumor resection, neoplastic tissue was obtained, which was paired with tissue adjacent to the tumor (approximately 5 cm from the tumor). Characterization of the tumor and non-malignant adjacent tissues was subsequently confirmed by histological tests. Immediately after removal, the tissues were placed in RNAlater® solution (Ambion, Foster City, CA, USA) and stored at −80°C until RNA extraction.
From the clinical records of the patients, information was collected, including gender and age, as well as the tumor location, histology, and grade. The criteria used to determine the response to treatment were defined based on new response criteria in solid tumors: Revised RECIST guideline (version 1.1). 18
Extraction of RNA and Total Protein
RNA and total protein from each of the biopsies were extracted with TRIzol reagent (Invitrogen, Gaithersburg, MD, USA) according to the manufacturer’s instructions. Approximately 100 mg of tissue was homogenized with 1 mL of TRIzol, and chloroform was added to extract the organic and aqueous phases. The aqueous phase was precipitated with isopropyl alcohol, and the RNA pellet was washed with 70% ethanol and resuspended in RNase-free water. The total RNA concentration was verified spectrophotometrically at 260 nm, and the integrity was verified on agarose gels stained with ethidium bromide.
Total protein was isolated from the organic phase, which was precipitated with isopropanol, and the pellet was washed with 0.3 M guanidine hydrochloride in 95% ethanol and subsequently resuspended in a 10 mM urea solution and 10% sodium dodecyl sulfate (SDS) and sonicated until it was solubilized. The total protein concentration was determined by the Lowry method. Finally, both the RNA and the total protein were stored at −70°C until analysis.
Reverse Transcription and Quantitative Polymerase Chain Reaction (qPCR)
cDNA was synthesized from 2 μg of total RNA, random hexamers, and the reverse transcriptase enzyme “MultiScribe” from the TaqMan Reverse Transcription Applied Biosystem commercial kit (Foster, CA, USA). The reaction was carried out according to the manufacturer’s instructions.
For the qPCR reactions, TaqMan probes (Applied Biosystem) specific for each CYP gene were used. The test IDs were as follows: CYP1B1 (Hs00164383_m1), CYP2E1 (Hs00559370_m1), CYP3A4 (Hs00430021_m1), CYP3A5 (Hs01070905_m1) and the reference gene β-actin (4333762F). A total of 2 μL of cDNA was mixed with 1x TaqMan PCR Master Mix® and 100 mM Taqman probe (Applied Biosystems) in a final reaction mixture volume of 20 μL. All the tests were performed in triplicate, and two controls without template were included in each run. The qPCR reactions were performed in the ABI PRISM 7700 detector system (Applied Biosystems) under the following conditions: 40 cycles of amplification (15 seconds of denaturation, 1 minute of alignment at 60°C, and 30 seconds of elongation). The levels of gene expression were normalized to the expression of the reference β-actin gene. Analysis of the relative mRNA expression of the CYP450 enzymes was performed by the 2-∆Ct method and is presented as mean ± standard deviation (SD). The change in expression related to non-tumoral adjacent tissues was determined using the 2-∆∆Ct comparative method. 19
Western Blot Analysis
Approximately 100 μg of total protein from the tumor and non-malignant adjacent tissues was separated by 7.5% SDS-PAGE and transferred to a PVDF membrane (Merck Millipore Corporation, Billerica, MA, USA). The membrane was blocked with a 5% skimmed milk-TBS (Tris-buffered saline) solution and incubated overnight at 4°C with the primary monoclonal antibody (Abcam, Cambridge, UK) corresponding to CYP1B1 (ab33586, polyclonal rabbit), CYP2E1 (ab28146, polyclonal rabbit), CYP3A4 (ab124921, monoclonal rabbit), and CYP3A5 (ab108624, monoclonal rabbit). Then, the membrane was washed and incubated with the secondary goat anti-rabbit antibody (ab6721, Abcam, Cambridge, UK) conjugated to horseradish peroxidase. Protein bands were visualized in the Amersham ECL Prime Western Blotting Detection chemiluminescence system (GE Healthcare, Chalfont St. Giles, Buckinghamshire, UK) on the ChemiDoc MP Imaging System (Bio-Rad Hercules, California, USA). Subsequently, the membranes were stripped for the detection of β-actin (ab115777, monoclonal rabbit, Abcam, Cambridge, UK), which was used as a loading control and reference control. Relative detection was determined by comparing the intensities of each CYP band with that obtained for β-actin.
Statistical Analysis
The results were analyzed using the statistical program Prism 5.0 (GraphPad Software, La Jolla, California, USA). Differences in gene and protein expression levels between tumor tissues and non-malignant adjacent tissues of the same individuals were evaluated using the Mann-Whitney U test. The associations of the levels of CYP mRNA with the clinical-pathological characteristics of the patients were analyzed by Mann-Whitney U test. The correlation between mRNA expression and protein levels for each CYPs investigated was performed using linear regression test. The Kaplan Meier method and log-rank test were used to analyze the correlation of overall survival (OS) with gene expression levels. Results are presented as mean ± SD. Values of P<0.05 were considered statistically significant.
Results
Characteristics of the Patients
Characteristics Patients Involved in the Present Studio.
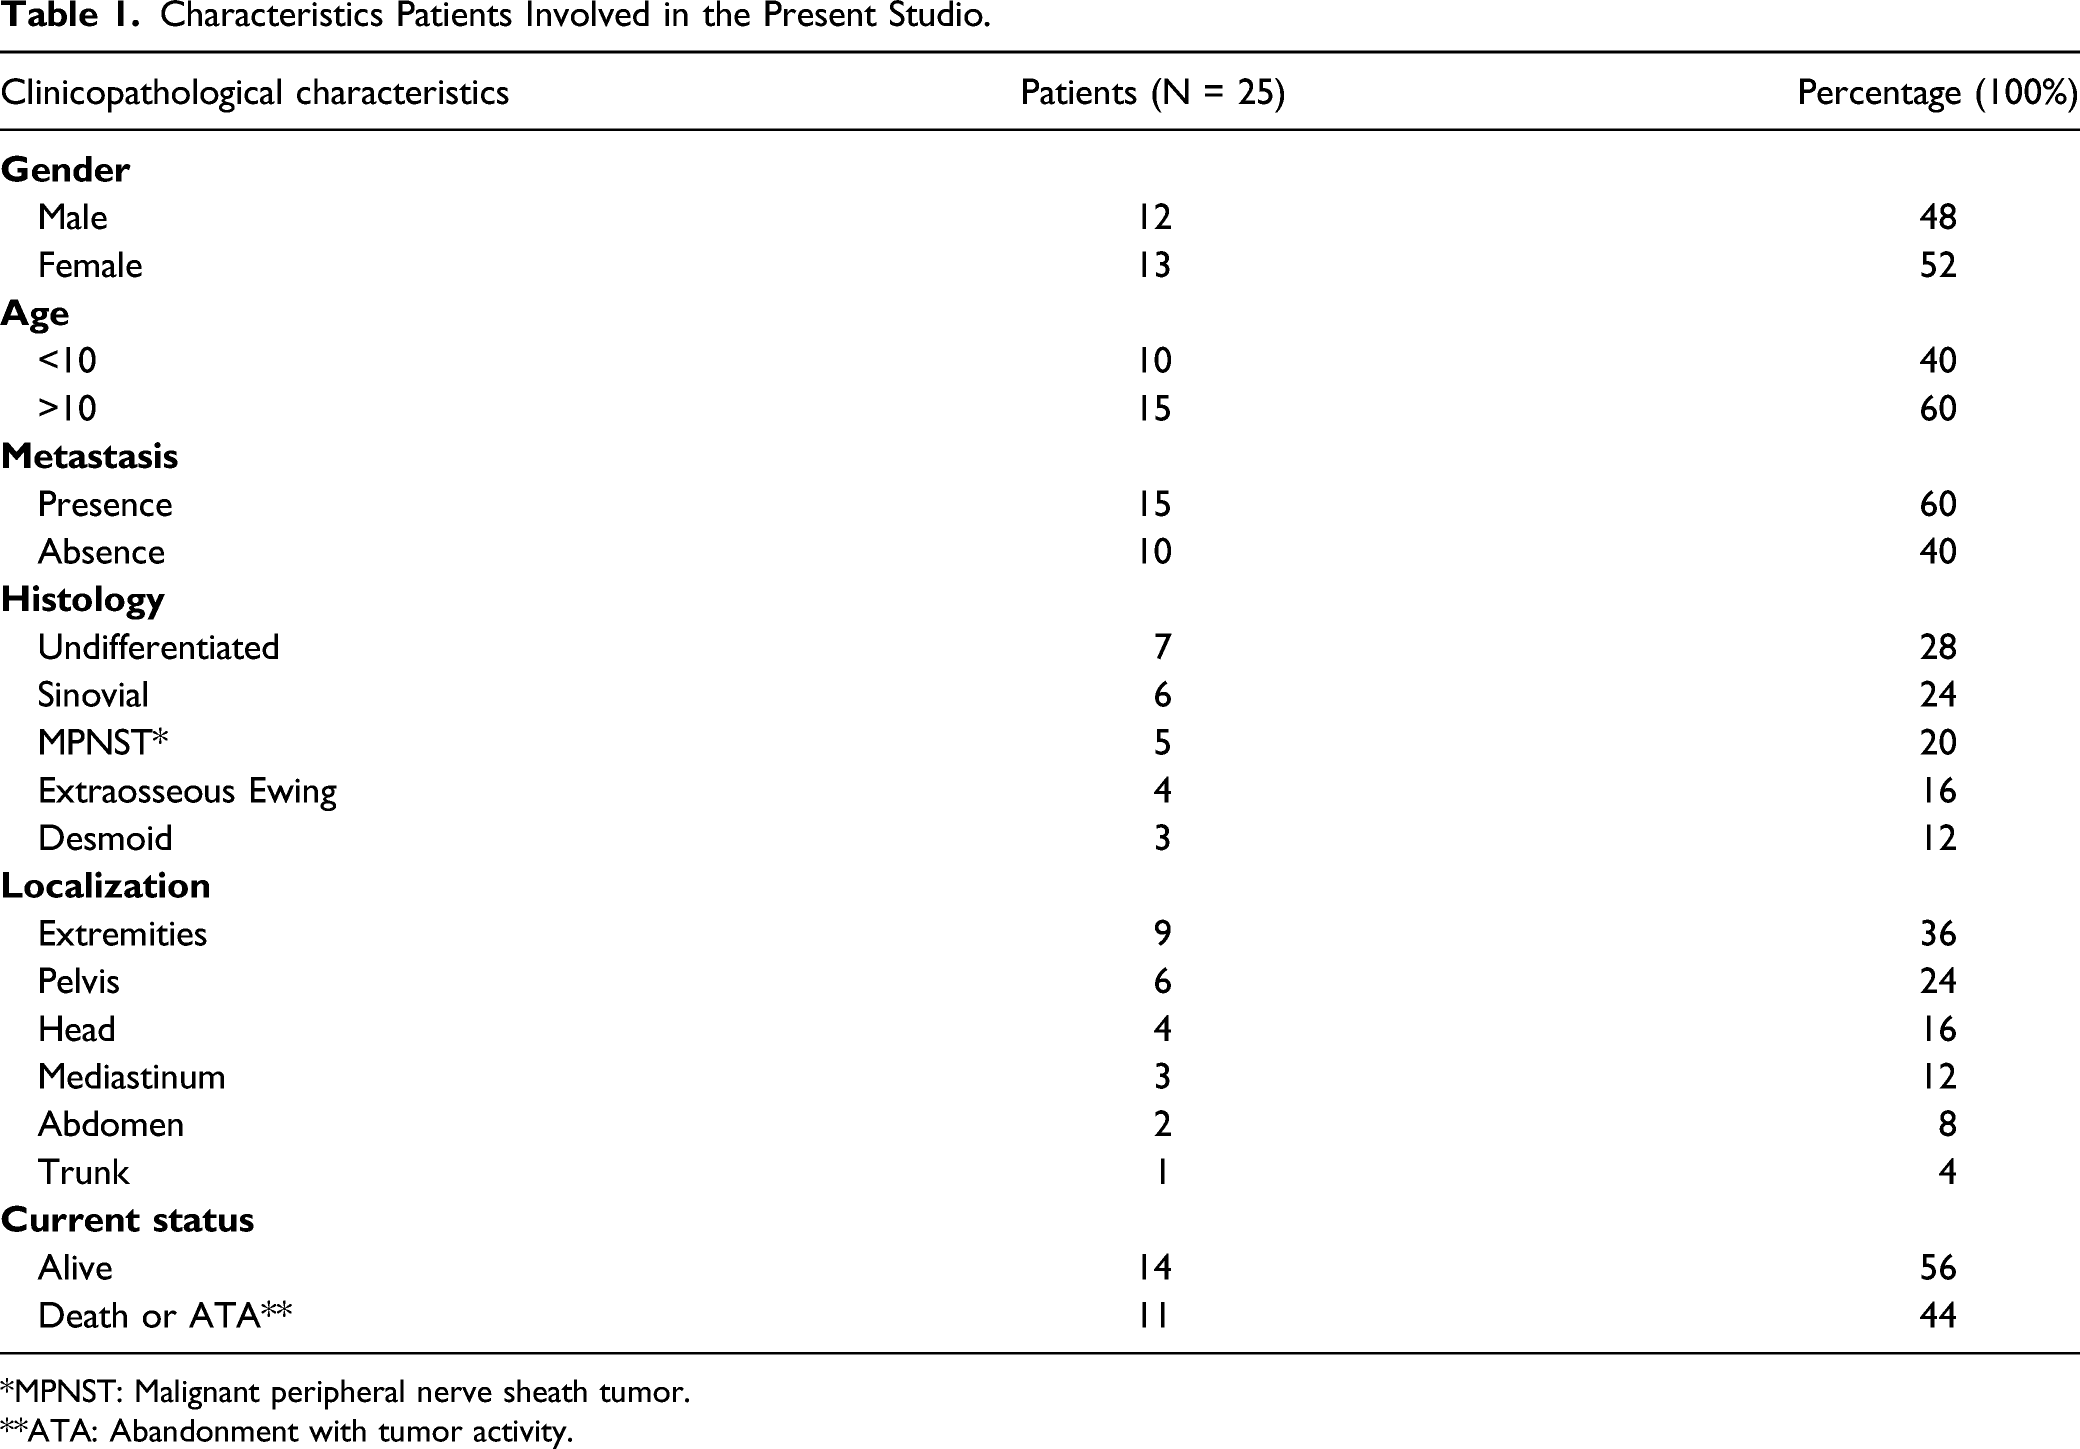
*MPNST: Malignant peripheral nerve sheath tumor.
**ATA: Abandonment with tumor activity.
Gene and Protein Expression of CYP in NRSTS
The mRNA and protein expression levels of a subset of CYP enzymes (CYP1B1, CYP2E1, CYP3A4, and CYP3A5) were analyzed by qPCR and Western blot analysis in 25 samples of tumor tissues paired with non-malignant adjacent tissues from patients diagnosed with NRSTS.
Levels of CYP1B1 Expression
The expression of CYP1B1 was evidenced in the tumor and non-malignant adjacent tissues analyzed. The expression of CYP1B1 mRNA was generally lower in adjacent tissue (7.25 × 10⁻⁴ ± 1.7 × 10⁻³) than in tumor tissue, in which increased levels were observed in 88% of cases (2.01 × 10⁻² ± 6.1 × 10⁻², P = 0.0079, Figure 1A). When comparing the expression of the CYP1B1 transcripts in the tumor tissue versus the non-malignant adjacent tissue of each patient, the magnitude of change in expression reached values 1000 times greater in 19 of the patients (Figure 1B). Consistent with the qPCR results, the expression of CYP1B1 protein was detected in both types of tissues, with almost two-fold increases in expression levels in the tumor tissue (P<0.001) (Figure 1C). Expression profile of CYP1B1 in NRSTS. (A) The expression levels of CYP1B1 mRNA analyzed by qPCR in 25 pairs of tissues. The relative expression levels of CYP1B1 in the tumor and adjacent tissues were determined by the 2-∆Ct method. (B) The changes in expression of the CYP1B1 gene in the tumor tissue with respect to its expression in the adjacent tissue of each patient were analyzed by the comparative 2-∆∆Ct method. Values greater than 1 (dotted line) indicate greater expression in the tumor. The data are presented as the average of 3 tests ± standard deviation (SD). (C) Protein expression of CYP1B1 was analyzed in the tumor and adjacent tissues of patients with NRSTS by Western blot assays. Each bar represents the mean ± SD of densitometric analyses, the number of patients (n) who showed positive expression of CYP1B1 is shown within each bar. Arbitrary units denote relative expression (AU). P values were evaluated by the nonparametric Mann-Whitney U test, ** P<0.005 and *** P<0.001.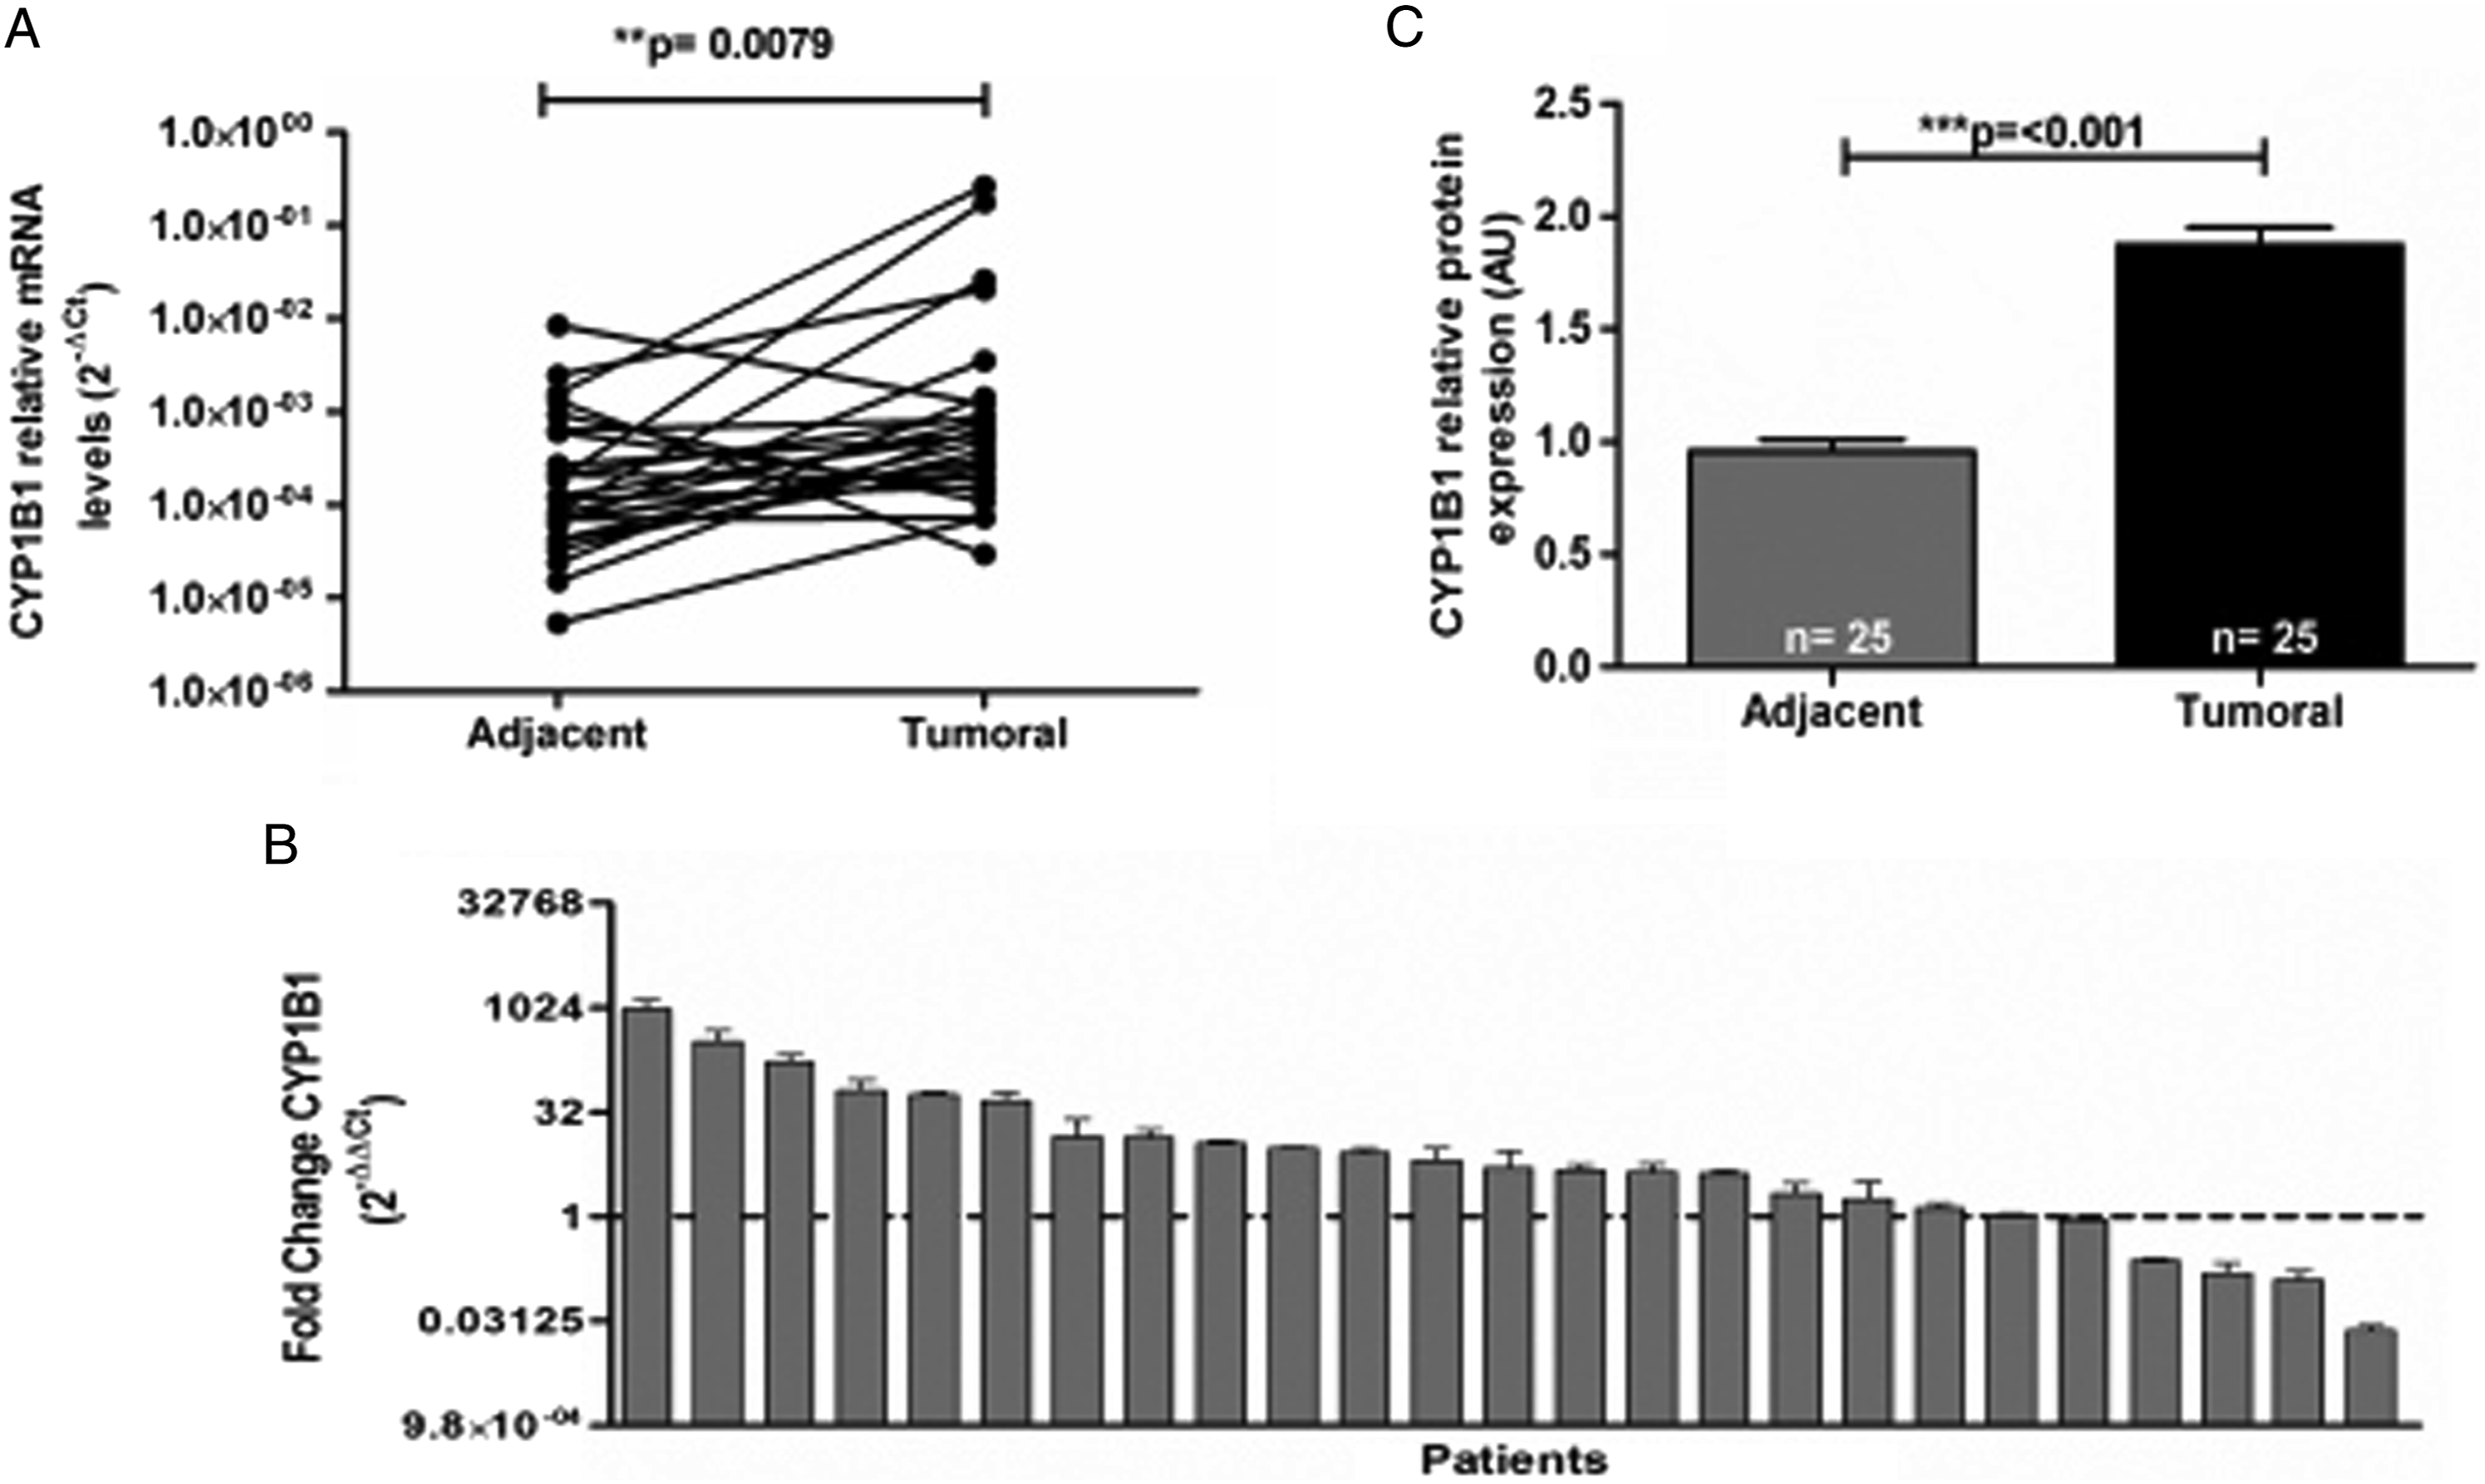
Levels of CYP2E1 Expression
CYP2E1 transcripts were detected in 18 (72%) of the non-malignant adjacent tissue samples and in 23 (92%) of the tumor tissue samples. In the analysis of relative expression, higher levels of mRNA were observed in tumor tissue (2.13 × 10⁻³ ± 7.4 × 10⁻³) than in the adjacent tissue (2.30 × 10⁻⁴ ± 5.2 × 10⁻⁴, P = 0.0313) (Figure 2A). When comparing the expression profile of the CYP2E1 gene in the tumor tissue with its expression in adjacent tissue, the gene was found to be overexpressed in the tumor tissue of 19 patients (76%), showing greater than 1000-fold increases (Figure 2B). In the analysis of protein expression, CYP2E1 was detected in 18 of the tumor tissues and 13 of the adjacent tissues, revealing a 2.4-fold increase in protein expression in the tumor tissue (P = 0.0008) (Figure 2C). Expression profile of CYP2E1 in NRSTS. (A) The expression level of CYP2E1 mRNA analyzed by qPCR in 25 pairs of tissues. The relative expression levels of CYP2E1 in the tumor and adjacent tissues were determined by the 2-∆Ct method. (B) The changes in expression of the CYP2E1 gene in tumor tissue with respect to its expression in the adjacent tissue of each patient were analyzed by the comparative 2-∆∆Ct method. Values greater than 1 (dotted line) indicated greater expression in the tumor. The data are presented as the average of 3 tests ± SD. (C) Protein expression of CYP2E1 was analyzed in tumor and adjacent tissues of patients with NRSTS by Western blot assays. Each bar represents the mean ± SD of densitometric analyses, the number of patients (n) who showed positive expression of CYP2E1 is shown within each bar. Arbitrary units indicate relative expression (AU). P values were evaluated by the nonparametric Mann-Whitney U test, * P<0.05 and *** P<0.001.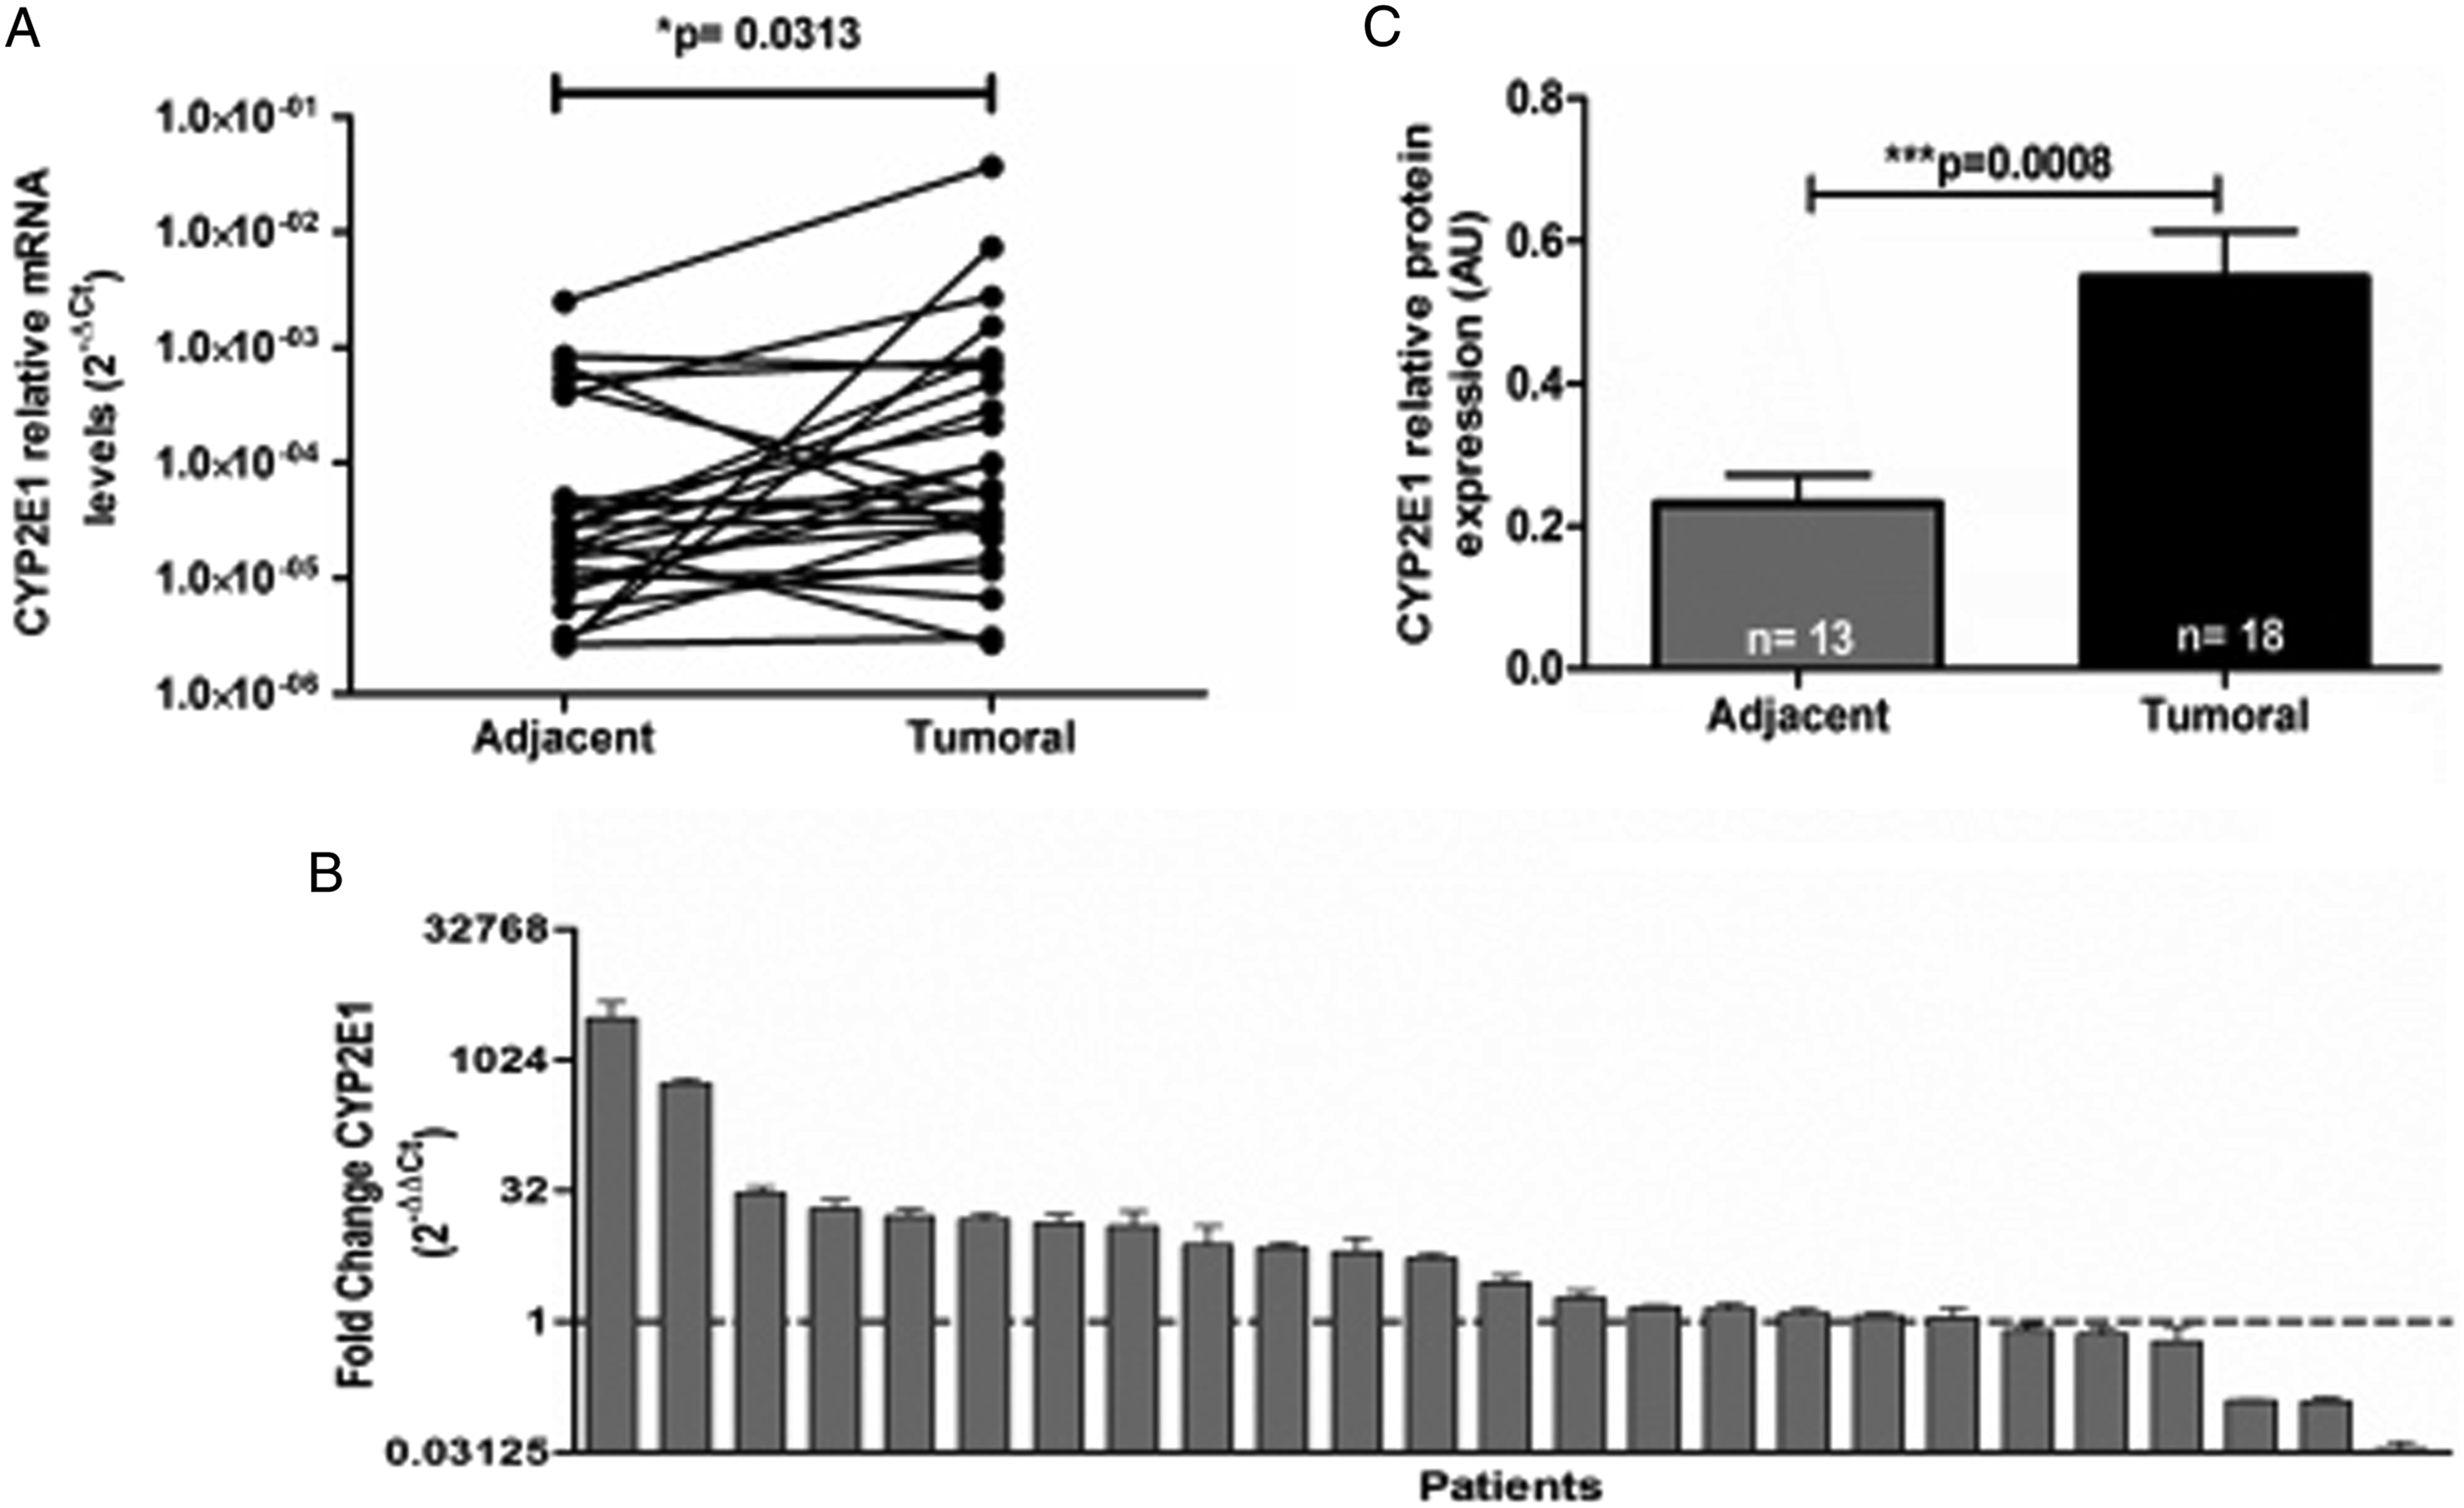
Levels of CYP3A4 and CYP3A5 Expression
CYP3A4 transcripts were detected in 17 (68%) non-malignant adjacent tissues and in 20 (80%) tumor tissues. Relative expression levels of CYP3A4 mRNA were higher in tumor tissue (6.9 × 10⁻⁴ ± 2.8 × 10⁻³) than in the adjacent tissue (1.5 × 10⁻⁴ ± 4.2 × 10⁻⁴) (P = 0.0382) (Figure 3A). Moreover, analysis of the changes showed increases in CYP3A4 expression in the tumor tissue of 18 (72%) patients and up to 1000-fold greater increases (Figure 3B). In 22 of the 25 tumor tissues, higher levels of protein expression were detected (2.5 times higher; P = 0.0147) (Figure 3C). Expression profile of CYP3A4 in NRSTS. (A) The expression level of CYP3A4 mRNA analyzed by qPCR in 25 pairs of tissues. The relative expression levels of CYP3A4 in the tumor and adjacent tissue were determined by the 2-∆Ct method. (B) The changes in expression of the CYP3A4 gene in the tumor tissue with respect to its expression in the adjacent tissue of each patient were analyzed by the 2-∆∆Ct comparative method. Values greater than 1 (dotted line) indicated greater expression in the tumor tissue. The data are presented as the average of 3 tests ± SD. (C) The protein expression of CYP3A4 was analyzed in the tumor and adjacent tissues of patients with NRSTS by Western blot analysis. Each bar represents the mean ± SD of densitometric analyses, the number of patients (n) who showed positive expression of CYP3A4 is shown within each bar. Arbitrary units show relative expression (AU). P values were evaluated by the nonparametric Mann-Whitney U test, * P<0.05.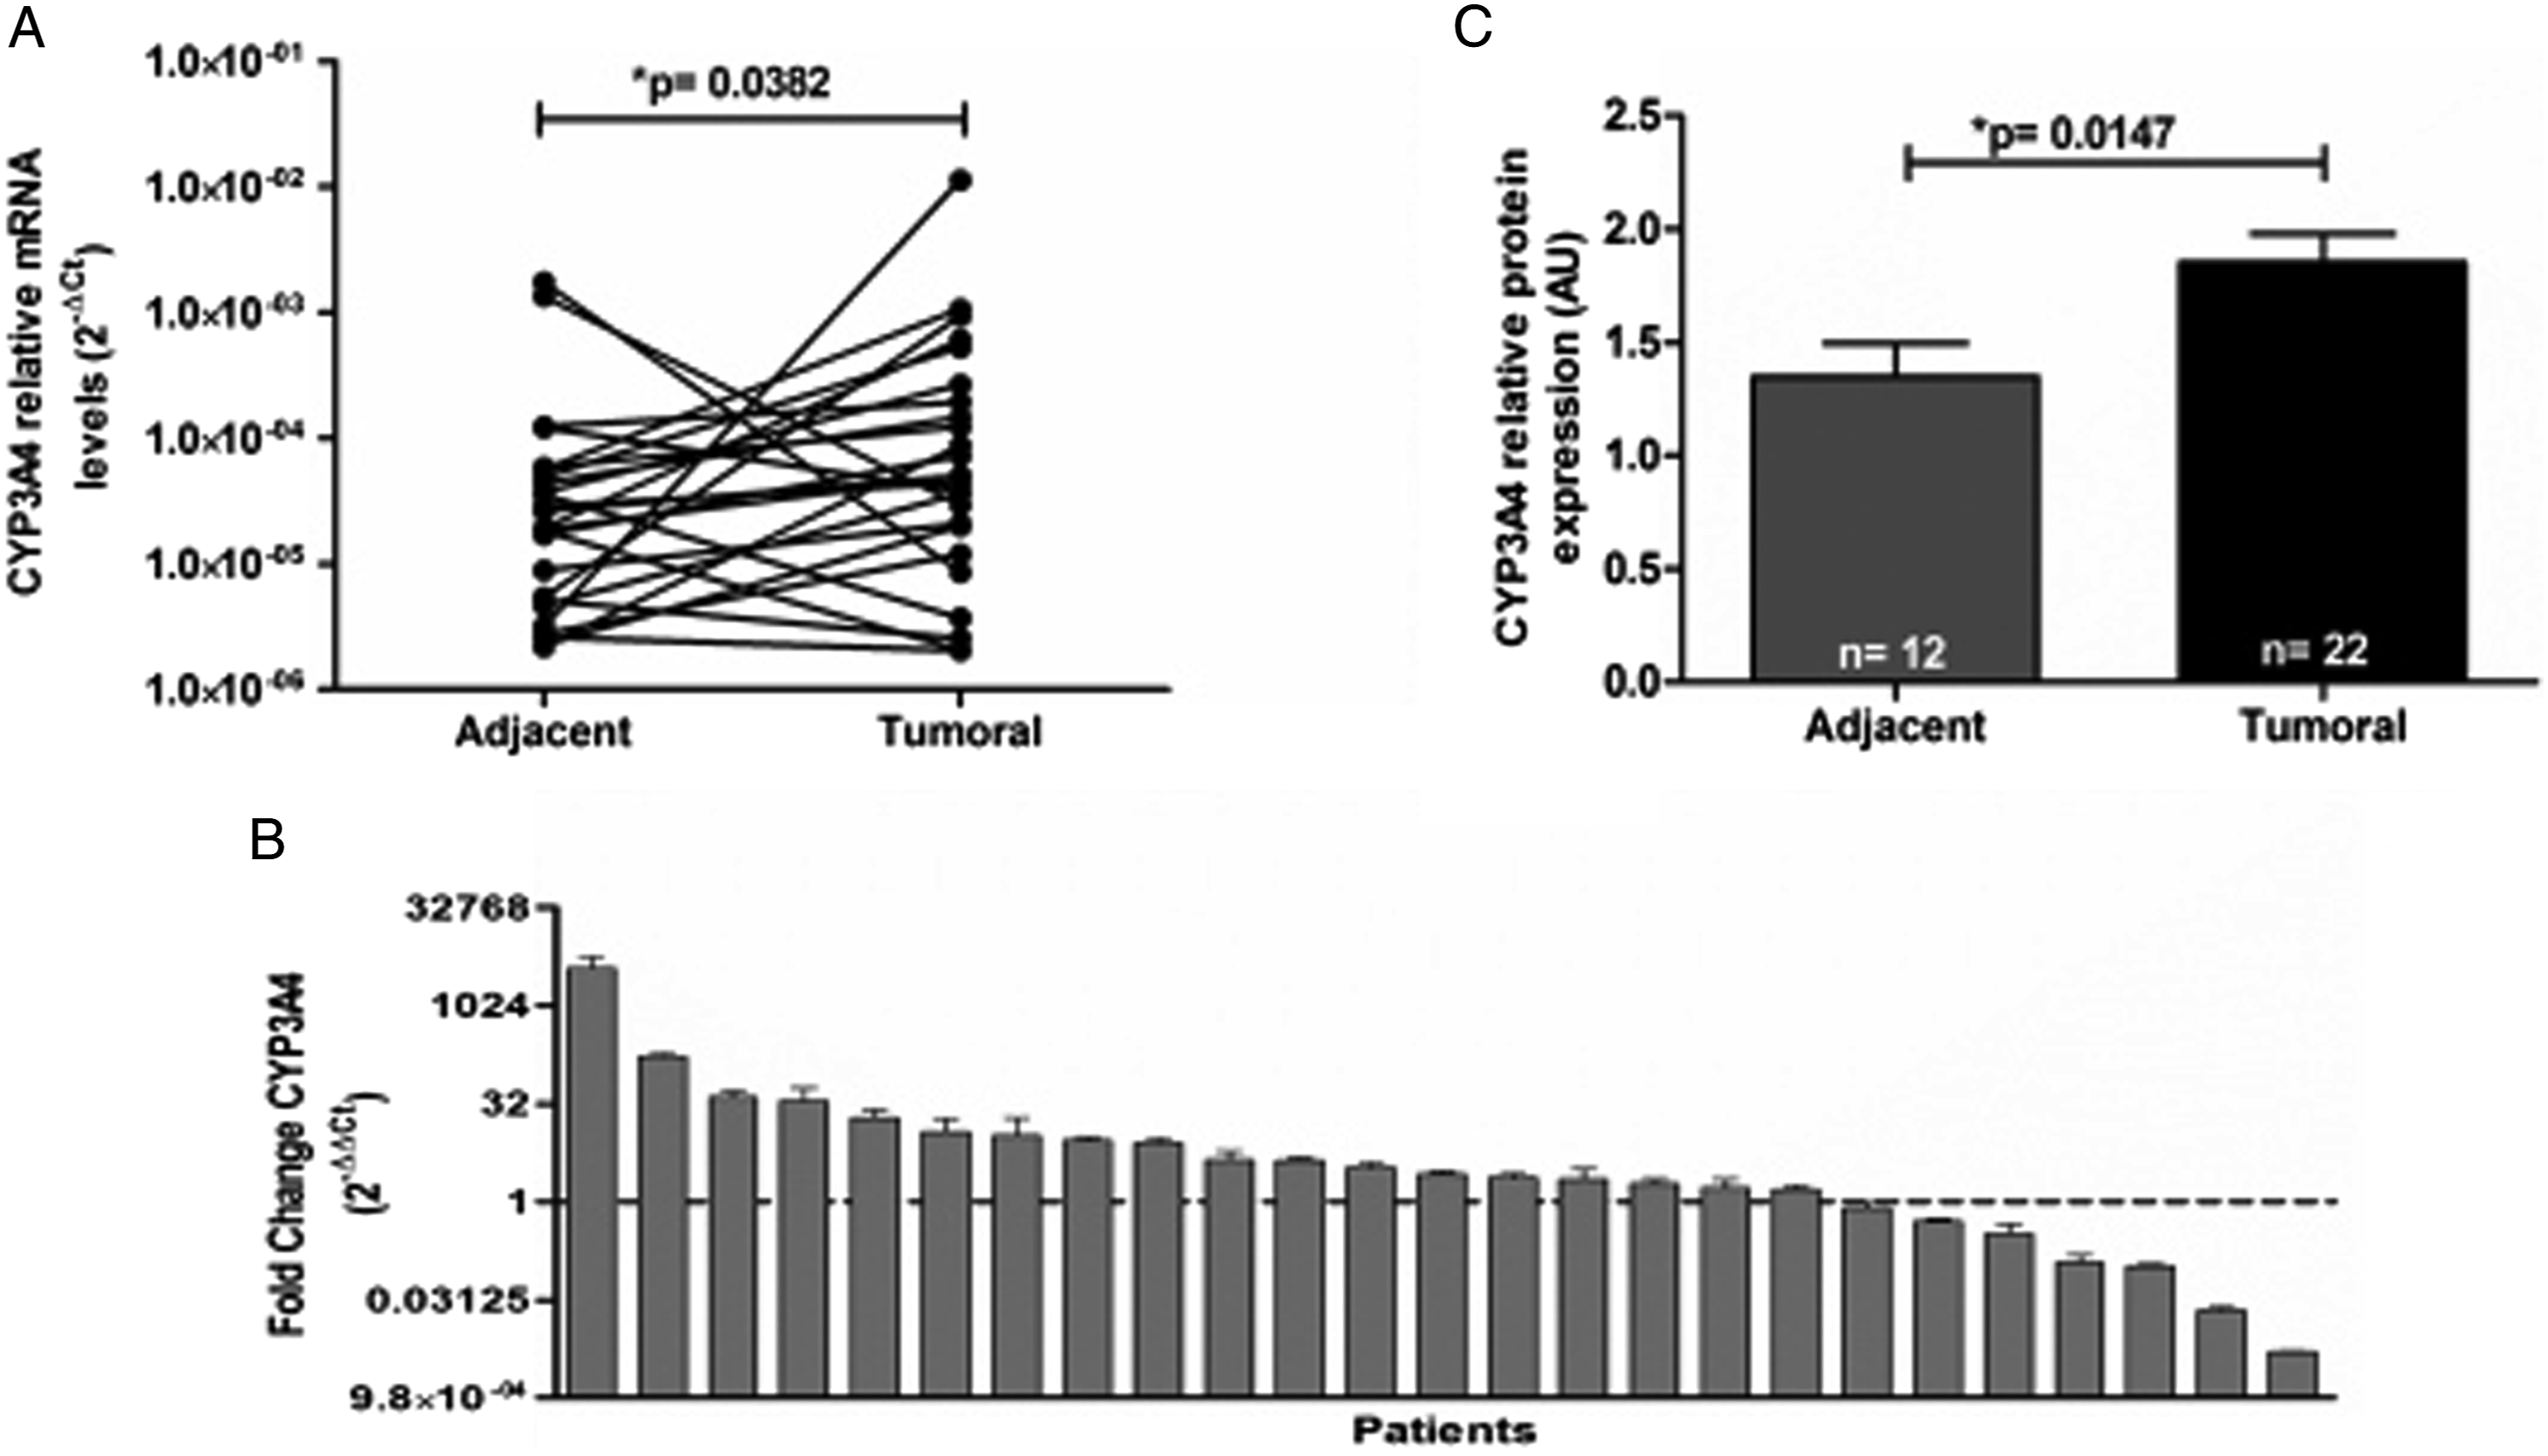
In contrast, the CYP3A5 isoform showed no significant expression differences between the tumor tissue (2.5 × 10⁻⁴ ± 8.1 × 10⁻⁴) and non-malignant adjacent tissue (8.9 × 10⁻⁵ ± 8.1 × 10⁻⁴) (Figure 4A). Evaluation of the expression changes showed greater expression of the CYP3A5 isoform in the tumor tissue from 11 patients (44%) than in the adjacent tissue, in which the levels were increased up to 1000-fold (Figure 4B). In tumor tissues, the expression of CYP3A5 protein showed a tendency to increase without becoming significant (Figure 4C). Expression profile of CYP3A5 in NRSTS. (A) The expression levels of CYP3A5 mRNA analyzed by qPCR in 25 pairs of tissues. The relative expression levels of CYP3A5 in tumor and adjacent tissues were determined by the 2-∆Ct method. (B) The changes in expression of the CYP3A5 gene in tumor tissue with respect to the adjacent tissue of each patient were analyzed by the 2-∆∆Ct comparative method. Values greater than 1 (dotted line) indicated greater expression in the tumor. The data are presented as the average of 3 tests ± SD. (C) Protein expression of CYP3A5 was analyzed in the tumor and adjacent tissues of patients with NRSTS by Western blot assays. Each bar represents the mean ± SD of densitometric analyses, the number of patients (n) who showed positive expression of CYP3A5 is shown within each bar. Arbitrary units indicate relative expression (AU). Not significant (ns). P values were evaluated by the nonparametric Mann-Whitney U test.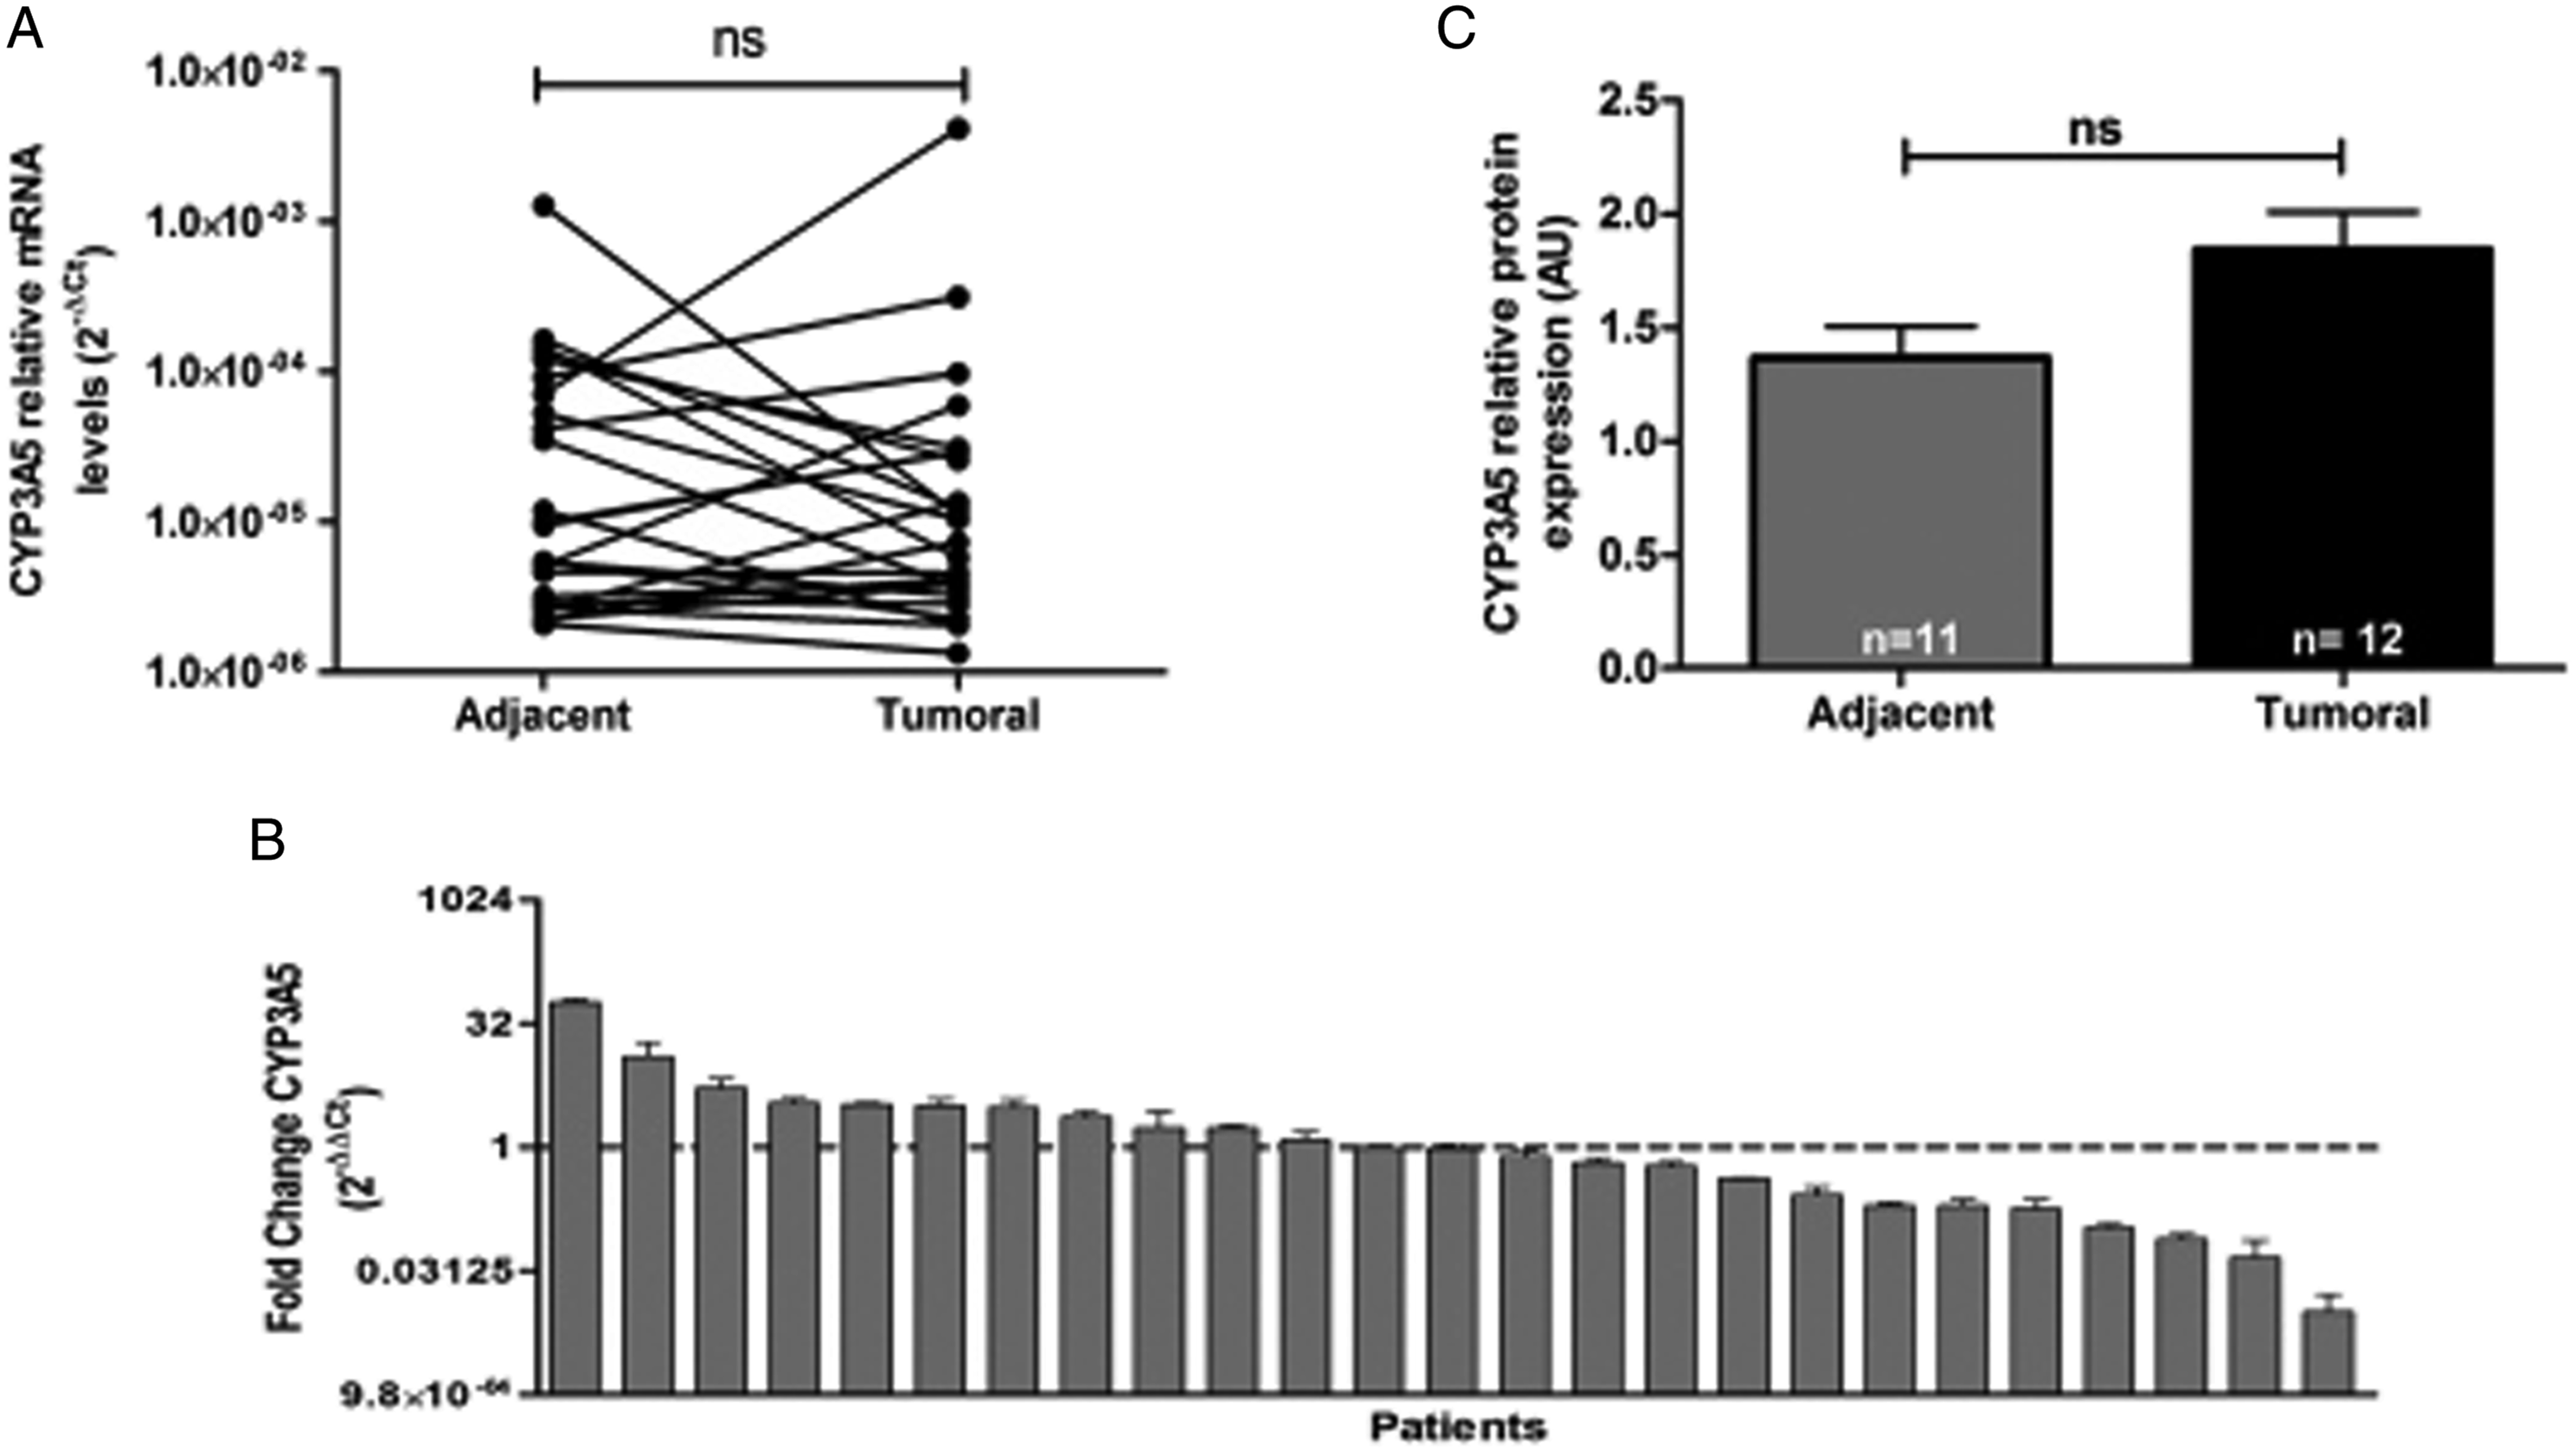
Correlations Between mRNA Levels of CYP450 Isoforms in Tumor Tissue and the Clinicopathological Characteristics of Patients with NRSTS
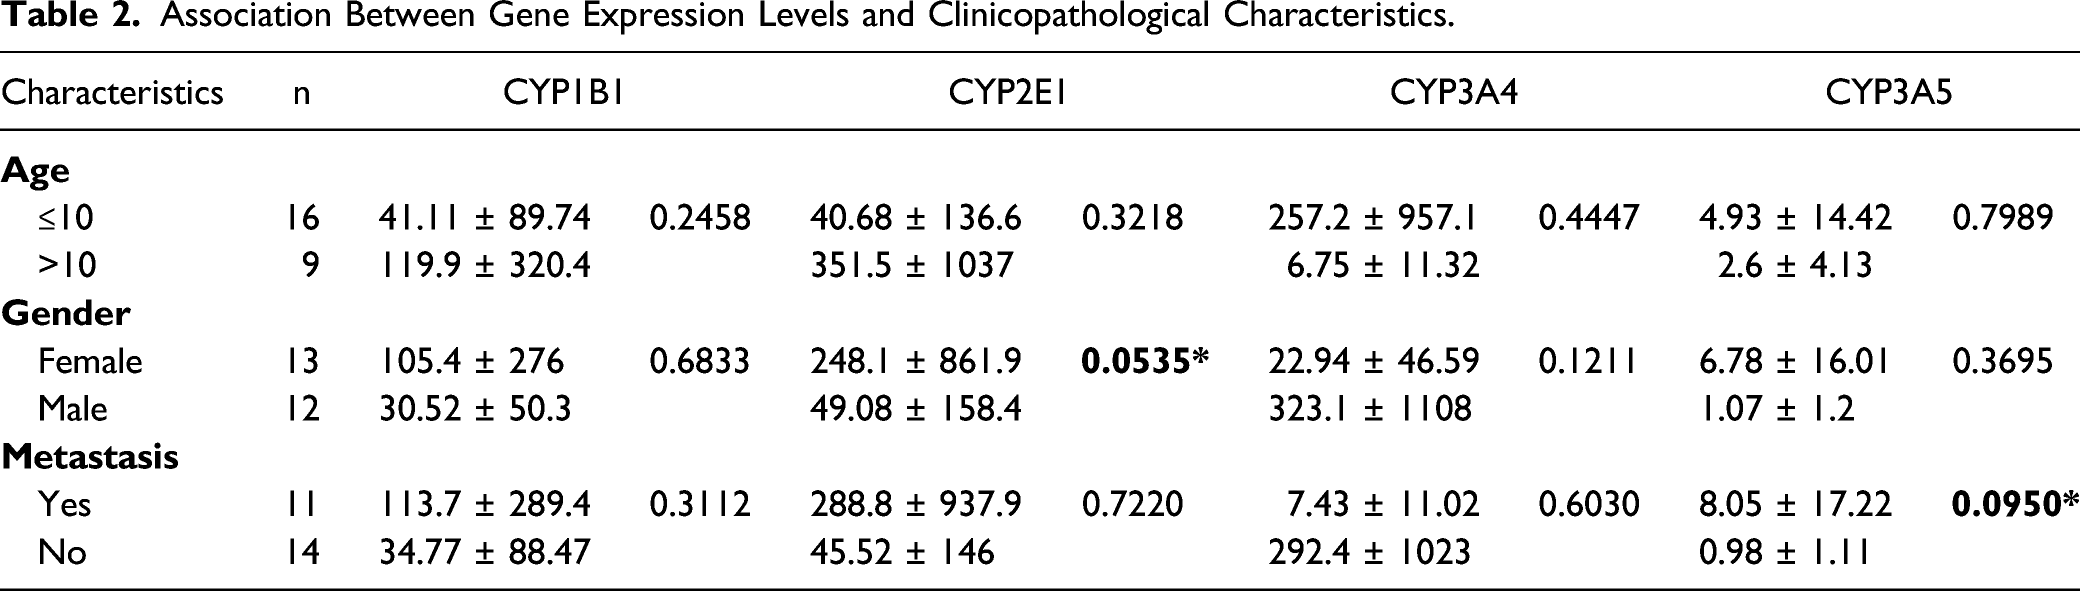
Association Between Gene Expression Levels and Clinicopathological Characteristics.
Discussion
CYPs are important enzymes involved in cancer development and treatment, as CYPs can mediate the biological activation of numerous procarcinogens and can also lead to the local inactivation or activation of antineoplastic agents.16,20 In this study, we defined the expression profile of CYP1B1, CYP2E1, CYP3A4, and CYP3A5 in NRSTS. To verify whether CYP isoforms were present in the pediatric NRSTS, we performed qPCR and Western blot analysis to probe mRNA and protein expression, respectively, in tumor and adjacent non-tumor tissue samples from 25 patients diagnosed with NRSTS.
We found that CYP1B1, CYP2E1, CYP3A4 mRNA and protein levels were increased in tumor tissues in NRSTS patients. This differential CYPs expression profile may be useful to design a personalized treatment but also to identify potential factors contributing to cancer susceptibility and chemotherapy resistance. In particular, CYP1B1 plays an important role in the metabolism of polyaromatic carcinogens such as polycyclic aromatic hydrocarbons (PAHs), aromatic and heterocyclic amines, and aflatoxin B1, with CYP1B1 metabolism recognized as the initial step in the carcinogenic action of these chemicals.20-23 CYP1B1 is expressed in tumor tissues at higher levels; however, we also detected both transcript and protein expression in adjacent cancer-free tissues, where CYP1B1 could play an essential role in carcinogenesis of NRSTS.
Our findings are consistent with previous studies in which CYP1B1 is expressed at much higher levels in tumor cells compared with surrounding normal tissue in different types of cancer such as colon, lung, renal, and bladder.9,23 Consequently, CYP1B1 could be considered as a potential tumor marker and a putative target for cancer therapy in NRSTS.
Like CYP1B1, CYP2E1 is an enzyme that plays an important role in the activation of several procarcinogens, such as industrial halogenated hydrocarbons, chloroform, benzene, and vinyl chloride, among others, generating toxic intermediates and excessive amounts of reactive oxygen species (ROS).24-26 Although the normal expression of CYP2E1 is mainly hepatic, its overexpression in extrahepatic tissues has been associated with the development of several types of tumors such as breast, prostate, lung, esophageal, and colorectal cancer.24,25 Consistent with these previous works, we detected gene and protein overexpression of CYP2E1 in NRSTS tumor tissues compared to non-malignant adjacent tissues. This differential expression profile suggests that CYP2E1 may be involved in the pathogenesis of NRSTS. However, in order to elucidate the role of CYP2E1 in soft tissue cancers, further research is needed to determine whether CYP2E1 activity in normal soft tissues contributes to carcinogenesis through procarcinogen activation and ROS production, or whether the tumor microenvironment triggers aberrant CYP2E1 expression in NRSTS that promotes tumor development, which has been seen in other types of cancer where CYP2E1 expression is regulated in a p53-dependent pathway to influence cell migration and invasion. 24
On the other hand, CYP3A isoforms are the most abundant in the liver and are considered the most important CYP subfamily in the biotransformation of xenobiotics, including anticancer drugs. Many chemotherapeutic agents are substrates for CYP3A and can also induce or inhibit its transcription in hepatic and extrahepatic tissues. Expression of CYP3A isoforms in cancer cells can also lead to local deactivation of chemotherapeutic agents, resulting in resistance and recurrence of metastatic disease. CYP3A is involved in metabolism of several antineoplastic agents used for the treatment of NRSTS, such as doxorubicin, vincristine, topotecan, and etoposide27-30; for this reason, alterations in CYP3A expression in NRSTS tissues could allow tumor cells to avoid the effect of chemotherapy and contribute to tumor progression.
In contrast, certain prodrugs used for the treatment of NRSTS, such as cyclophosphamide and ifosfamide, are activated by CYP3A enzymes. 20 Consequently, it would be ideal to know the CYP3A expression profile present in the tumor tissue of the NRSTS patient in order to provide an appropriate treatment and minimize drug resistance. However, we observed only modest mRNA and protein overexpression of CYP3A4 isoform in tumor tissue samples of NRSTS patients.
Although no significant differences were found in CYP3A5 expression between tumor tissue and adjacent samples from NRSTS patients in either transcript or protein levels, previous studies have pointed out the importance of CYP3A5 polymorphisms. Just as example, individuals with the CYP3A5*3/*3 genotype are considered non-expressors of CYP3A5, because CYP3A5*3 corresponds to an intron insertion that alters the reading frame and results in a premature termination codon and thus a non-functional protein. 31 This CYP3A5*3 variant has an allele frequency of 90%; therefore, most Caucasians are CYP3A5 non-expressors.32,33 A previous study in a Mexican population observed that 52.2% of the samples evaluated were CYP3A5*3*3, 34 however, a significant correlation was found between the level of CYP3A5 mRNA expression and presence of metastasis, so more studies are needed to show the relevance of this polymorphism in the Mexican pediatric population.
Overexpression of CYP isoforms was previously demonstrated to be associated with poor cancer outcomes. For example, CYP1B1 overexpression was associated with angiogenesis in a wide variety of tumors. 35 Evidence suggests that CYP3A4 overexpression associated with alcohol and tobacco consumption promotes the development of breast cancer and increases the risk of prostate cancer. Likewise, high CYP3A4 expression was significantly associated with distant metastasis of Ewing sarcoma.27,36,37 In contrast, low CYP3A5 levels were associated with a significantly worse prognosis in patients with lung adenocarcinoma and hepatocellular carcinoma 38 ; however, in the present study, we found no association with CYP expression levels and clinicopathological features of NRSTS patients.
It is important to note that a sample size of 25 patients was used in this study, and even though our data are consistent with previous reports of increased CYPs expression, studies with a large cohort of patients are needed to validate these findings. Furthermore, although the characterization of non-malignant adjacent tissues was performed by histopathological tests, we cannot rule out that their molecular characteristics and CYP expression mechanisms are influenced by the tumor microenvironment.
In conclusion, the present study was designed to determine the expression profile of CYP isoforms in tumor and non-tumor adjacent tissue samples from childhood patients with NRSTS. Our results suggest that increased expression levels of CYP genes and enzymes in NRSTS could play an important role in different pathways and, depending on their function and localization, participate in tumorigenesis and treatment response, as well as potential therapeutic targets and prognostic biomarkers.
Footnotes
Author’s Contribution
Torres-Zárate, C. contributed to acquisition, analysis, and interpretation and drafted manuscript; Vences-Mejía, A. contributed to conception and design and critically revised manuscript; Espinosa-Aguirre, J.J. contributed to conception and design and critically revised manuscript; Díaz-Díaz, E. contributed to acquisition and analysis and drafted manuscript; Palacios-Acosta, J.M. contributed to acquisition and critically revised manuscript; Cárdenas-Cardós, R. contributed to analysis and critically revised manuscript; Hernández-Arrazola, D. contributed to acquisition and critically revised manuscript; Shalkow-Klincovstein, J. contributed to interpretation and critically revised manuscript; Rodríguez Jurado, R. contributed to analysis and interpretation and critically revised manuscript; Santes-Palacios, R. contributed to acquisition and analysis and drafted manuscript; Molina-Ortiz, D. contributed to conception and design and drafted manuscript. All authors gave final approval and agree to be accountable for all aspects of work ensuring integrity and accuracy.
Declaration of Conflicting Interests
The author(s) declared no potential conflicts of interest with respect to the research, authorship, and/or publication of this article.
Funding
The author(s) disclosed receipt of the following financial support for the research, authorship, and/or publication of this article: This work was funded by the Sectoral Fund for Health and Social Security Research (Fondo Sectorial de Investigación en Salud y Seguridad Social SS/IMSS/ISSSTE-CONACYT No. 262423) and partially funded by the Instituto Nacional de Pediatría, SSA (Recursos Federales Destinados a la Investigación, grant INP 053/2015). The funders had no role in the study, design, data collection and analysis, decision to publish, or prepare the manuscript.