
Abstract
Introduction:
Corrected QT (QTc) interval is an essential proarrhythmic risk biomarker, but recent data have identified limitations to its use. The J to T-peak (JTp) interval is an alternative biomarker for evaluating drug-induced proarrhythmic risk. The aim of this study was to evaluate pharmacological effects using spatial magnitude leads and DII electrocardiogram (ECG) leads and common ECG confounders (ie, stress and body temperature changes) on covariate adjusted QT (QTca), covariate adjusted JTp (JTpca), and covariate adjusted T-peak to T-end (Tpeca) intervals.
Methods:
Beagle dogs were exposed to body hyper- (42 °C) or hypothermic (33 °C) conditions or were administered epinephrine to assess confounding effects on heart rate corrected QTca, JTpca, and Tpeca intervals. Dofetilide (0.1, 0.3, 1.0 mg/kg), ranolazine (100, 140, 200 mg/kg), and verapamil (7, 15, 30, 43, 62.5 mg/kg) were administered to evaluate pharmacological effects.
Results:
Covariate adjusted QT (slope −12.57 ms/°C) and JTpca (−14.79 ms/°C) were negatively correlated with body temperature but Tpeca was minimally affected. Epinephrine was associated with QTca and JTpca shortening, which could be related to undercorrection in the presence of tachycardia, while minimal effects were observed for Tpeca. There were no significant ECG change following ranolazine administration. Verapamil decreased QTca and JTpca intervals and increased Tpeca, whereas dofetilide increased QTca and JTpca intervals but had inconsistent effects on Tpeca.
Conclusion:
Results highlight potential confounders on QTc interval, but also on JTpca and Tpeca intervals in nonclinical studies. These potential confounding effects may be relevant to the interpretation of ECG data obtained from nonclinical drug safety studies with Beagle dogs.
Keywords
Introduction
The corrected QT (QTc) interval has been identified as an essential proarrhythmic risk biomarker in the International Conference on Harmonisation of Technical Requirements for Registration of Pharmaceuticals for Human Use (ICH) Guideline S7A. 1 However, recent clinical data have revealed potential limitations to its use, mainly due to a high rate of false positives. For example, drugs with balanced multi-ion channel inhibition, such as amiodarone, were shown to prolong QTc without increasing proarrhythmic risks. 2 Accordingly, research led by the US Food and Drug Administration has identified the J to T-peak (JTp) interval as an alternative to QTc as an electrocardiographic (ECG) biomarker used to evaluate drug-induced proarrhythmic risk for human clinical trials. The junction point (J) is the junction of the QRS and ST intervals and the start of the ST segment. Similarly, studies by the Health and Environmental Sciences Institute consortium have indicated that the JTp interval is also a suitable alternative to QTc in canines and nonhuman primates. 2,3
Acute stress, mediated (at least, partially) by blood epinephrine, is a common confounding factor known to affect ECG parameters in all species. In a large proportion of humans, epinephrine has been shown to prolong the QT interval. 4 Highlighting the close interaction between cardiac rhythm and stress, catecholaminergic polymorphic ventricular tachycardia (CPVT) is an arrhythmia associated with increased catecholamine levels and elevated heart rate (HR) in response to physical activity or emotional stress. 4,5 Hyper- and hypothermia have also been shown to alter ECG parameters. Hypothermia is generally induced in human to ensure neuroprotection following cardiac arrest due to ventricular tachycardia and ventricular fibrillation. Accidental or induced hypothermia has been observed to cause QTc prolongation. 6,7 Hyperthermia, induced by fever or external sources, has been known to cause QTc shortening and promotes more positive T waves. 8,9 Patients who presented with fever had a similar QTc shortening as noticed with external heat sources. 10 Change in body temperature or stress-induced increase in catecholamine levels might be observed in toxicology studies and can impact ECG results. Finally, proarrhythmic drugs have been associated with an increase in QT interval as well as JTp interval in human beings and preclinical animal models, such as Beagle dogs. 3,11
The study goal was to compare and evaluate the effects of common ECG confounding factors (ie, body temperature and catecholamine levels) on covariate adjusted QT (QTca), covariate adjusted JTp (JTpca), and covariate adjusted T-peak to T-end (Tpeca) intervals, using continuous ECG monitoring in telemetry implanted Beagle dogs. Spatial magnitude (sM) was assessed following administration of verapamil (calcium blocker), dofetilide (I Kr blocker), and ranolazine (late sodium channel blocker) using a 3 derivation ECG and monitoring the QT, JTp, and T-peak to T-end (Tpe) intervals.
In addition, a 3 derivation ECG was compared to sM-ECG following the administration of these cardiac ion channel active agents to conscious telemetered Beagle dogs with QT, JTp, and Tpe monitoring. 12 -14 Our hypothesis was that sM-ECG would minimize the incidence of biphasic T waves, as the T wave peak would be optimally assessed with a monophasic morphology.
Materials and Methods
Statement on Use and Care of Animals
All the procedures performed in this study were reviewed and approved by the Institutional Animal Care and Use Committee prior to initiation. The research facility where the study was conducted is accredited by the Canadian Council on Animal Care, the Guide for the Care and Use of Laboratory Animals published by the Institute of Laboratory Animal Resources, and Association for Assessment and Accreditation of Laboratory Animal Care. 15 All procedures were conducted as per standard operating procedures.
Animal Housing
Four telemetry implanted male Beagle dogs were used for the assessment of the core body temperature (age: 1.1-2.5 years old; weight: 8.3-11.0 kg). Eight Beagle dogs (5 males and 3 females) were used to assess the effect of epinephrine to mimic a stress response (age: 7 months old-2.5 years old; weight: 6.9-10.1 kg). Four male Beagle dogs were assigned to cardiovascular response monitoring and to assess sM ECG with pharmacological testing (age: 11 months old; weight: 11.4-12.0 kg). Sixteen dogs were used in total. The animal room environment was controlled (temperature 18-29 °C, relative humidity 50% ± 20%, 12-hour light–dark cycle, 10-15 air changes per hour), and temperature and relative humidity were monitored continuously. Animals were fed with 400 g of Envigo Teklad certified 25% Lab dog diet #8727C.
Animal Preparation: Telemetry for Cardiovascular Monitoring
Four male Beagle dogs were surgically implanted with telemetry transmitters for the assessment of the different drugs (easytel + L_EEEETA, EMKA). Characterization of temperature to ECG parameter relationships was undertaken with dogs implanted with TL11M3-D70-PCT transmitters (DSI). The 8 dogs that received epinephrine were instrumented with an external telemetry system and 3 ECG derivations (D1, D2, D3) while the animals were anesthetized. Surface ECG traces were obtained from all animals prior to surgery to ensure normal cardiac conduction was present.
For all animals that underwent surgical implantation of telemetry devices, the prophylactic antibiotics enrofloxacin (Baytril, Bayer; 50 mg/mL at 5 mg/kg) and penicillin G procaine (300,000 UI/mL at 30,000 UI/kg) were administered intramuscularly (IM) once before surgery and daily for 2 days following surgery. Opioid buprenorphine (0.3 mg/mL at 0.03 mg/kg) was administered IM, twice daily for 3 days starting at least 30 minutes prior to surgery. Meloxicam was administered subcutaneously (5 mg/mL at 0.2 mg/kg just after the surgery and 0.1 mg/kg the day following surgery). Intravenous (IV) fluid therapy (sterile lactated Ringer’s and 5% dextrose solution) was given during surgery using at a rate of 10 mL/kg/h or as needed. A mixture of bupivacaine (0.4 mL per dog, 2.5 mg/mL) and lidocaine (0.4 mL, 20 mg/mL) was given subcutaneously in 8 to 10 sites surrounding the (abdominal) surgical incisions.
Prior to surgery, animals were fasted overnight and anesthetized by IV injection of propofol (6 mg/kg, 10 mg/mL), followed by endotracheal intubation. An ophthalmic ointment was applied to both eyes, to prevent drying of the cornea, shortly after initiation of anesthesia and after end of anesthesia. The animals were placed on a heating pad to maintain adequate body temperature. Volatile anesthesia (isoflurane/oxygen mixture) was administered at a flow rate of approximately 200 mL/kg/min (around 2% isoflurane on vaporizer). A ventilator was used to maintain the respiratory rate between 8 and 20 breaths/min with a ventilation pressure of 18 to 25 cm·H2O. Hemoglobin oxygen saturation and HR were regularly monitored to ensure proper ventilation of the animals.
Surgical procedures entailed an abdominal midline skin incision followed by a longitudinal incision (length of approximately 4 cm) in the middle of the rectus abdominis muscle (parallel to muscle fibers). The telemetry transmitter was placed on the left side between the internal abdominal oblique muscle and the aponeurosis of the transversus abdominis muscle. The negative ECG electrode of D1 (easytel + L_EEEETA) was tunneled subcutaneously to a small skin incision at the level of the right thoracic inlet. A small loop (∼8 mm diameter) was created with the naked wire from both electrodes, and the negative electrode was sutured deep to the muscles. Once the negative electrode was in place, the positive electrode of D1 was opposed at the skin surface on the left lateral aspect of the thorax to locate the position of highest QRS amplitude. A small skin incision was made at the point of highest amplitude, and the electrode was tunneled and secured to the muscle using nonabsorbable sutures (polybutester 4-0, Novafil, Tyco Healthcare Group LP). The same was repeated for the negative lead D2, placed subcutaneously on the right side of the neck and the second D2 lead was placed in the jugular vein and sutured and the positive lead was placed in the same region as the D1 positive lead. A third derivation was placed in the Z axis to enable vectorcardiogram (VCG). The negative lead was tunneled subcutaneously between T11 and T13 (at the same level as the xyphoid process), and the positive lead was placed in the region of the xiphoid process. Surgical sites were rinsed with warm sterile saline and sutured in anatomical planes. Skin incisions were closed using absorbable buried sutures.
Rectal body temperature was monitored in the postoperative period. Once the body temperature was considered within an acceptable range and the animal was alert, the animal was returned to its cage. Nutritional support (156 g of canned food mixed with 244 g of regular food) was provided to the animals for at least 3 days postsurgery.
Cardiovascular monitoring
Cardiovascular function monitoring included ECG, body temperature, and physical activity (IOX 2.10.5.28 EMKA; DataQuest ART Version 3.1, DSI). The ECG analysis was conducted using semiautomated methods by a single analyst to minimize variability. The following parameters were evaluated: QT, JTp, Tpe, and HR (in beats per min, bpm). Three-lead ECG was used to record the data at 500 Hz.
Cardiovascular data analysis
Three orthogonal leads (D1, D2 subcutaneous, and Z axis) were used to create a single sM lead. 16 The ECG created with this method, sM-ECG = sqrt ([X 2] + [Y 2] + [Z 2]), was analyzed with ecgAUTO 3.5.1.8 (EMKA). 16 The data collected for temperature and epinephrine were analyzed with Ponemah 6.32 (DSI). Two-leads ECG (D1 and D2 SQ) was used to assess the effect of ranolazine, and the D1, D2 SQ, and Z axis were used to assess the drugs effect of verapamil and dofetilide.
Temperature modulation
Four telemetry implanted male beagle dogs were intubated and anesthetized as described above. The ECG parameters and core body temperature were monitored (DataQuest ART Version 3.1, DSI). Following the onset of anesthesia, the basal temperature was recorded for 15 minutes. Body temperature was then slowly increased using external heat sources (heating pad and heated air) until the animal reached a temperature of 41.5 °C. Ice bags were used to decrease the body temperature, while increasing oxygen flow, until a temperature of 34 °C was reached. At every temperature peak and nadir (ie, highest and lowest temperature), a 1-minute temperature recording was obtained. On the Beagle dogs (n = 8), the effect of the epinephrine on the different cardiovascular parameters was recorded for 16 minutes.
Test drugs
The effect of cardiovascular drugs selected to induce changes to QTca, JTpca, and Tpeca intervals (Table 1) was assessed in conscious telemetry implanted beagle dogs (n = 4). On each dog (n = 8), epinephrine (0.03 mg/kg) was injected intravascularly. Cardiovascular drugs were selected to induce changes to QTca, JTpca and Tpeca intervals and were given following a Latin square (Table 1). Cardiovascular parameters were recorded continuously for a period of at least 24 hours prior to and 12 to 24 hours following dosing (via gavage) with saline (sodium chloride 0.9% USP), dofetilide (vehicle, 0.1, 0.3, 1 mg/kg), verapamil (vehicle, 7, 15, 30, 43, 62.5 mg/kg), and ranolazine (vehicle, 100, 140, 200 mg/kg).
Drugs Tested in Conscious Telemetered Dogs for Effects on ECG Intervals (QTca, JTpca, Tpeca).
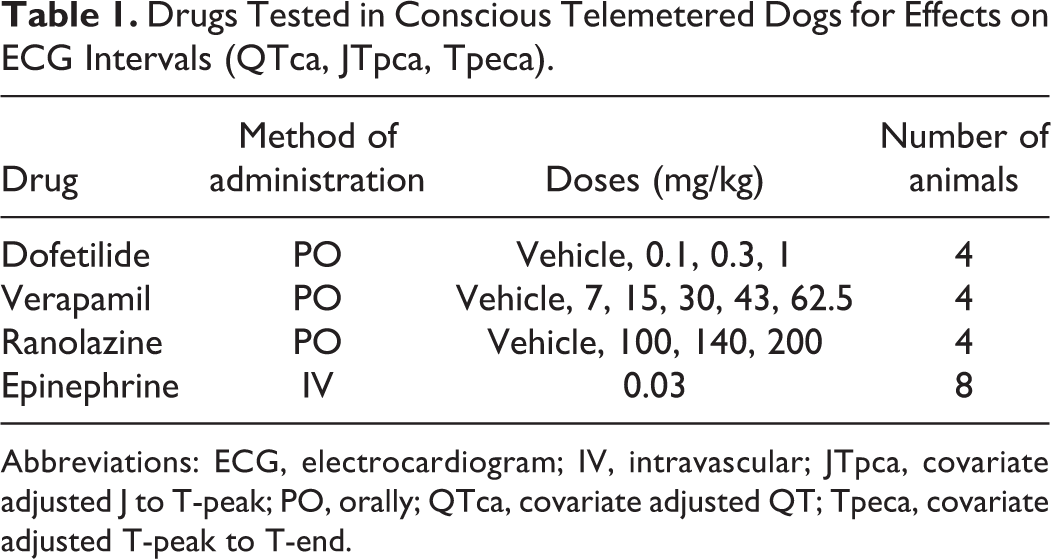
Abbreviations: ECG, electrocardiogram; IV, intravascular; JTpca, covariate adjusted J to T-peak; PO, orally; QTca, covariate adjusted QT; Tpeca, covariate adjusted T-peak to T-end.
Data Analysis
Statistical analysis was performed using SAS version 9.2 (SAS Institute). Individual HR correction was calculated for QTca, JTpca, and Tpeca as described previously. 17 Data are presented as mean ± standard error of the mean (SEM).
Pharmacological effects on ECG parameters were determined using a repeated measure analysis of variance (ANOVA) using averages of 15-minutes intervals, with super intervals on the percentage of change from the baseline (0-6, 6-12, 12-18, and 18-24 hours postdose). The super intervals were selected based on expected exposure to the selected drugs and included intervals when pharmacological effects were expected to resolve. Drug exposure levels were not available. Data are presented as mean ± SEM.
Temperature
Linear regression was performed to assess how much millisecond interval duration it will take to increase or decrease the temperature per Celsius degree.
Epinephrine
The individual postdose measurements following epinephrine administration were adjusted for possible inherent differences between individuals by expressing the values as percentage changes from baseline (predose). Inferential analysis was performed for the following parameters: QTca, JTpca, and Tpeca. The differences between posttreatment and baseline were analyzed for statistical significance using a repeated measures ANOVA.
To express the correlations across treatments, the compound symmetry and the heterogeneous compound symmetry were considered as possible covariance structures in the repeated measures ANOVA. Each repeated measure analysis was defined by using the treatment as a repeated factor, each one of the 2 covariance structures and by using the Kenward and Roger method when computing the denominator degrees of freedom for the test involving the fixed effects.
When the final Hessian was not positive definite, or computational limitation/convergence problems were encountered when fitting a covariance structure, the related model and its results were discarded. When both covariance structures converged and the final Hessian was positive definite, the one with the lowest corrected Akaike information criterion (AIC) was selected. When there was a significant treatment effect (P ≤ 0.05), the treatment effect was assessed for each individual treatment by determining whether the least squares mean was significantly different from zero using a t test. When there was no significant treatment effect, the treatment effect was assessed when the overall least squares mean was significantly different from zero using a t test.
Verapamil, dofetilide, and ranolazine
The individual predose and postdose measurements of each recording occasion were expressed as the means over 1-hour interval. Inferential analysis was performed on absolute values. The statistical analysis was performed for the following parameters: QTca, JTpca, and Tpeca.
The differences between the test and control items were analyzed independently for each defined time interval or time point using a repeated measure ANOVA. To express the correlations across treatments, the compound symmetry and the heterogeneous compound symmetry were considered as possible covariance structures in the repeated measures ANOVA. Each repeated measure analysis was defined by using the treatment as repeated factor, each one of the 2 covariance structures and by using the Kenward and Roger method when computing the denominator degrees of freedom for the test involving the fixed effects.
If the final Hessian was not positive definite or computational limitation/convergence problems were encountered when fitting a covariance structure, the related model and its results were discarded. If both covariance structures converged and the final Hessian was positive definite, the one with the lowest corrected AIC was selected. If there was a significant treatment effect (P ≤ 0.05), each test item dose level result was compared to the control using a Dunnett test on least squares means.
Results
Temperature Changes
Controlled changes in core body temperature in Beagle dogs (n = 4) were proportionally and negatively correlated with alterations in QTca (slope −12.6 ms/°C) and JTpca (slope −14.8 ms/°C; Figure 1). Interestingly, Tpeca was minimally affected by controlled body temperature variations (slope 1.50 ms/°C; Figure 1).
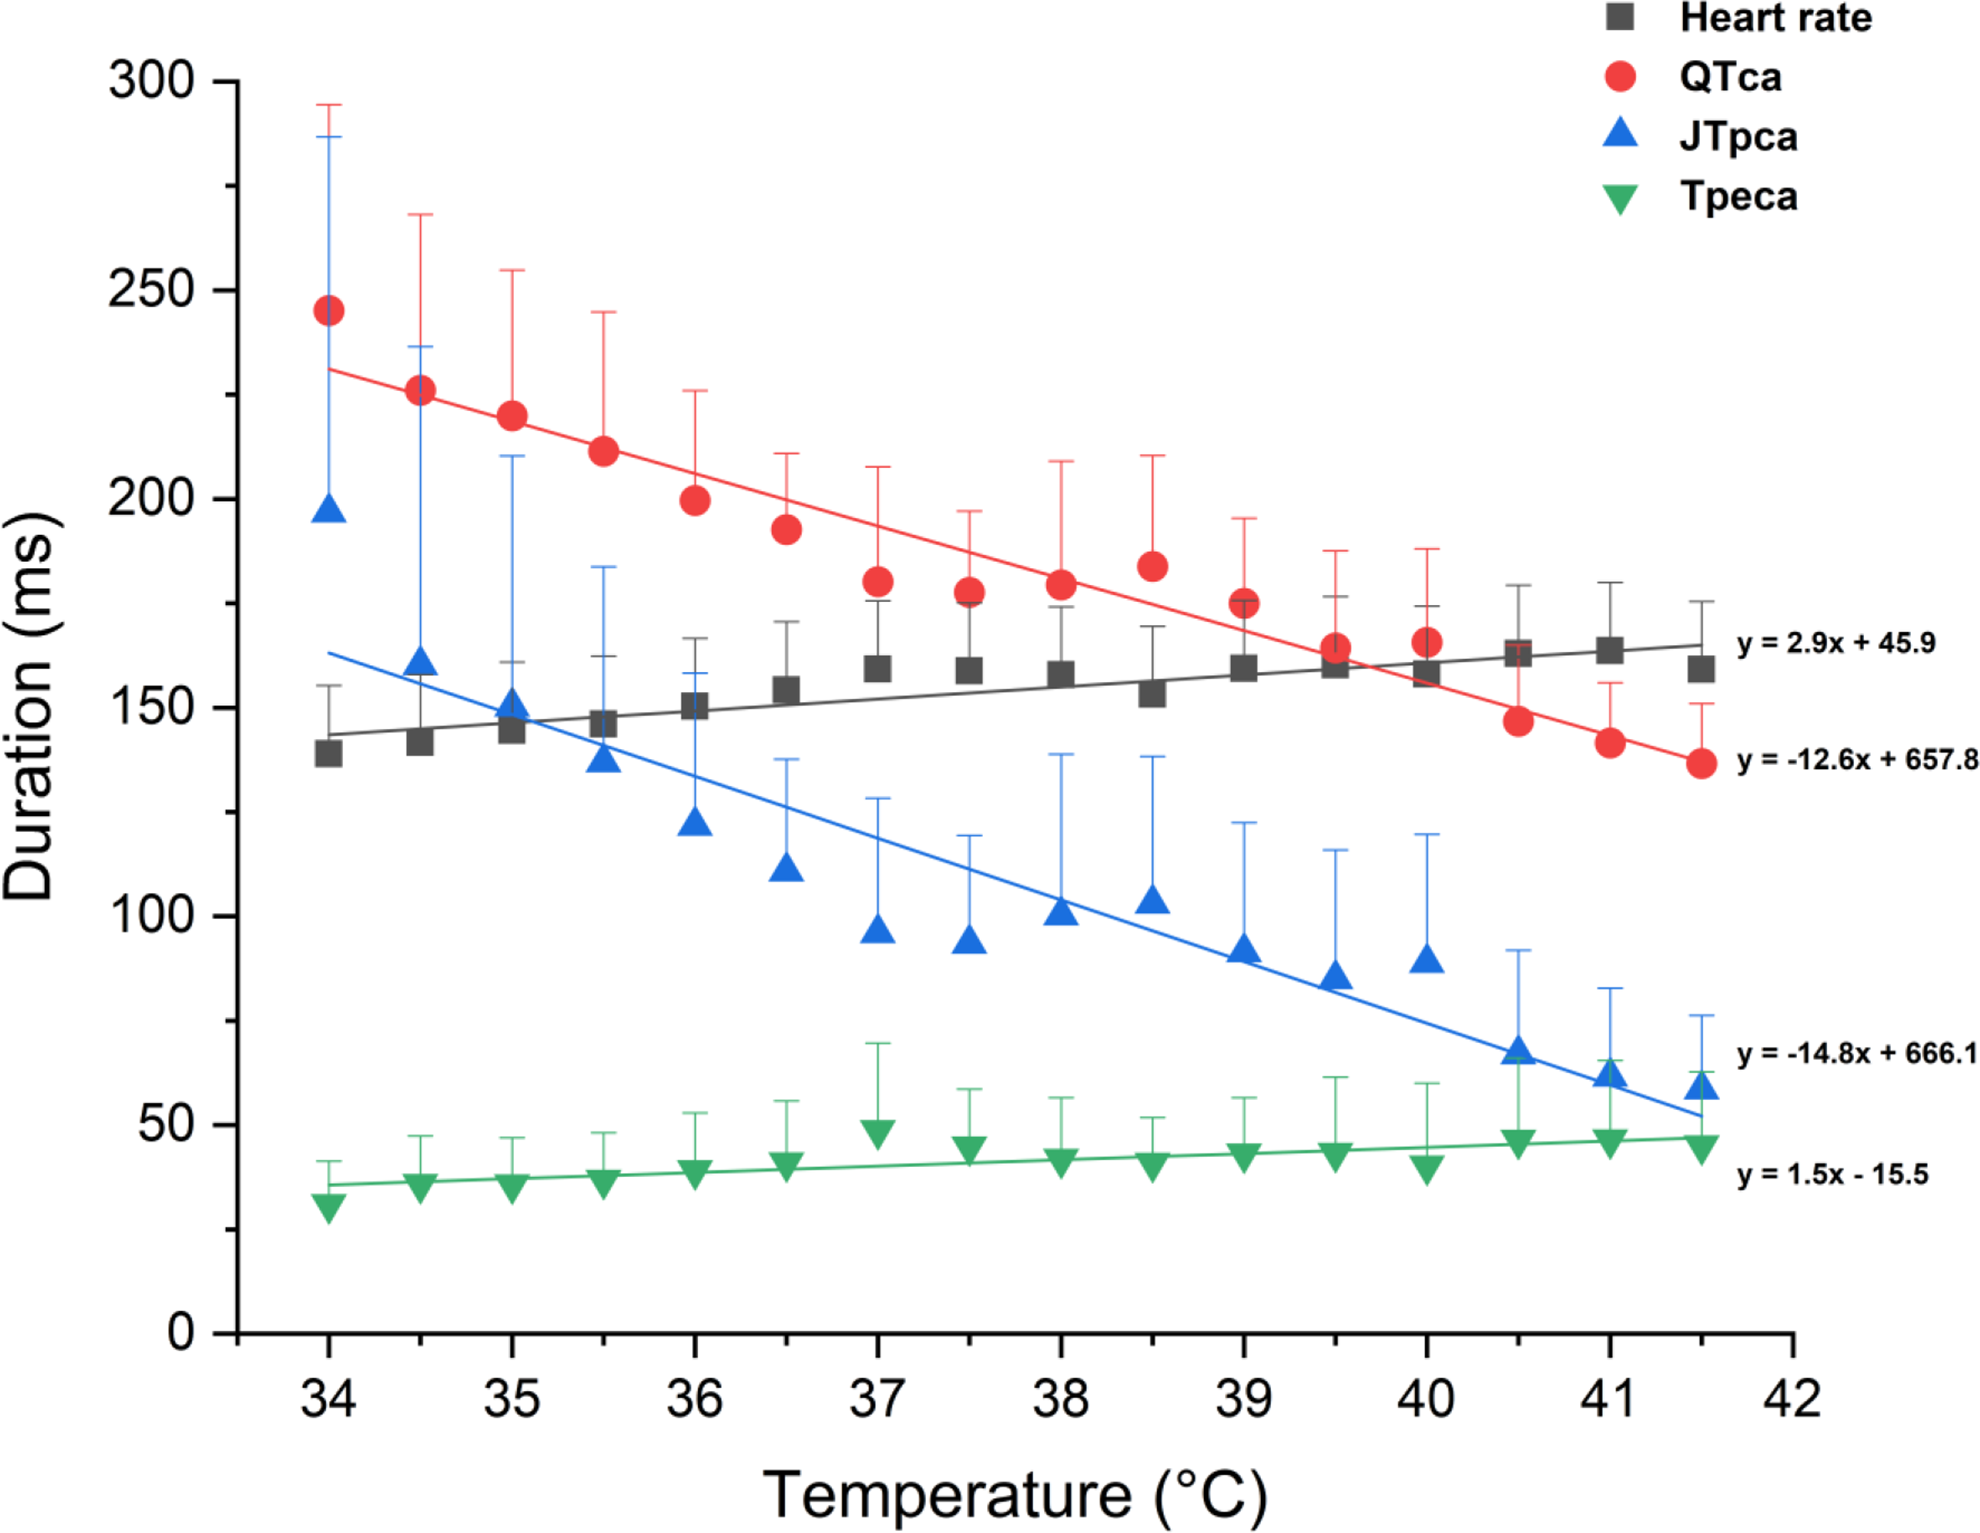
Core body temperature effect on QTca, JTpca and Tpeca in Beagle dogs (n=4) ▪ = Heart rate, ● = QTca, ▴= JTpca, ▾= Tpeca; each colour has a fitted Y (linear regression) and a 95% confidence band of the parameter that matches the colour of the parameter. JTpca indicates covariate adjusted J to T-peak; QTca, covariate adjusted QT; Tpeca, covariate adjusted T-peak to T-end.
Epinephrine Administration
Epinephrine was associated with shortening of the QTca and JTpca intervals followed by a progressive recovery (QTca: 247.4-183.9 milliseconds back to 261.8 milliseconds; JTpca: 215.9-145.5 milliseconds back to 228.5 milliseconds; Figures 2 and 3). The shortening of the intervals 1 and 4 minutes postadministration resulted in percentage changes from baseline that were beyond those observed in the saline control. These effects on the different parameters resolved within 5 to 8 minutes postepinephrine administration. This could be related to undercorrection in the presence of rapid changes in HR leading to QT-HR hysteresis. As with changes in body temperature, minimal effects were noted on Tpeca following administration of epinephrine (range of 29.9-44.4 milliseconds; Figure 3).
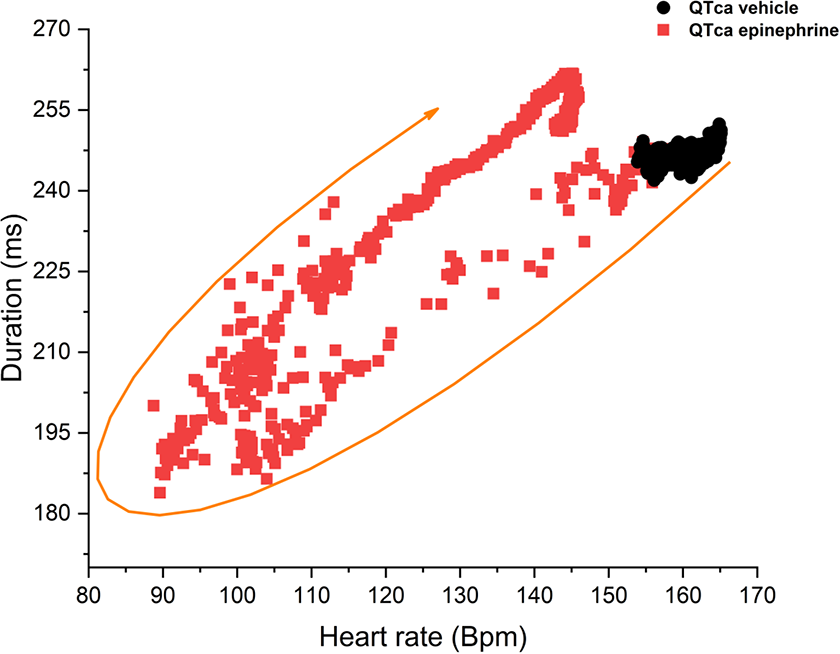
Epinephrine (0.03 mg/kg, IV) recorded over 11 minutes, QTca to heart rate relationship in Beagle dogs (n = 8). ▪ = QTca epinephrine, ● = QTca vehicles. IV indicates intravenous; QTca, covariate adjusted QT. IV indicates intravenous; QTca, covariate adjusted QT.
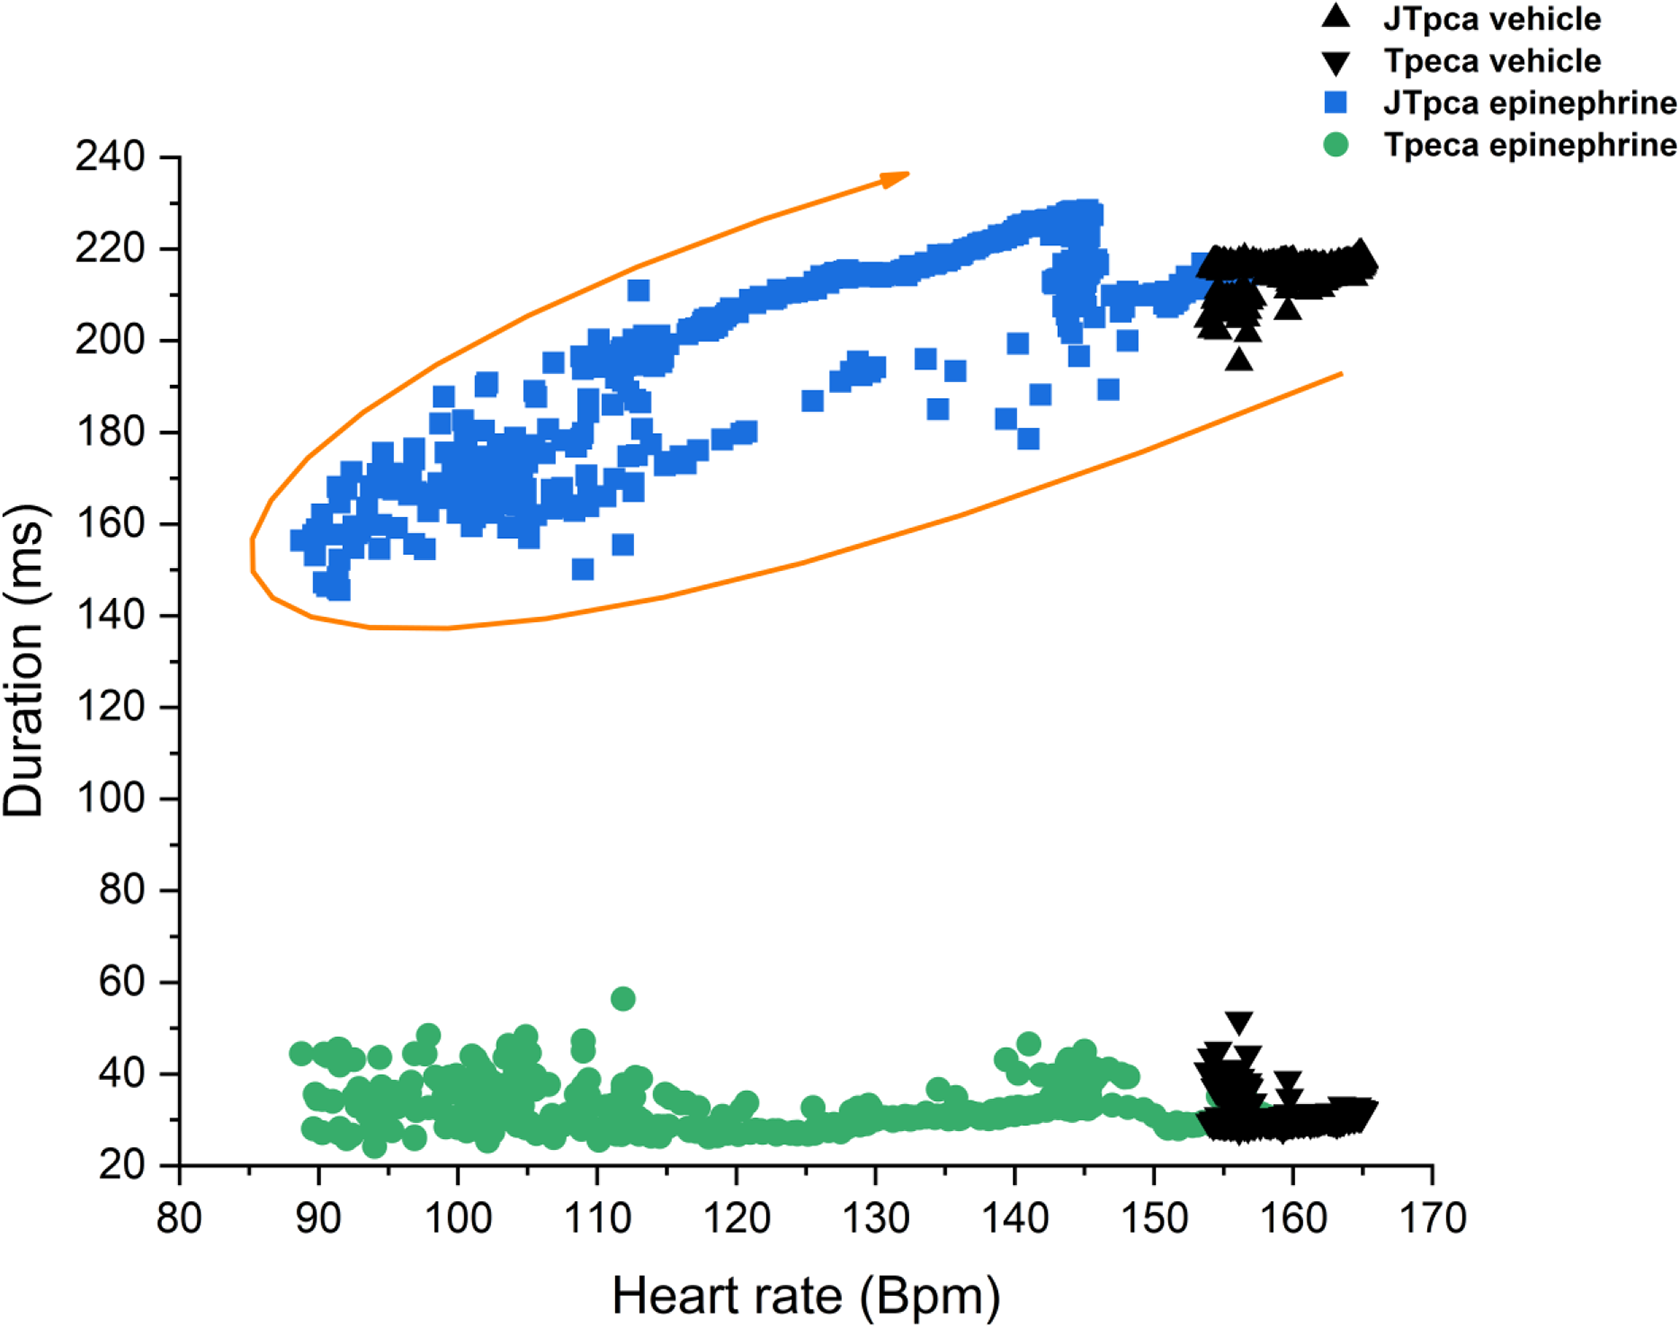
Epinephrine (0.03 mg/kg, IV) recorded over 11 minutes, JTpca and Tpeca relationship to the heart rate in Beagle dogs (n = 8). ▴= JTpca vehicle, ▾ = Tpeca vehicle, ▪ = JTpca epinephrine, ● = Tpeca epinephrine. IV indicates intravenous; JTpca, covariate adjusted J to T-peak; Tpeca, covariate adjusted T-peak to T-end.
Cardiovascular Drug Administration
Two-leads ECG (D1 and D2 SQ)
a. Ranolazine
The oral administration of ranolazine (100, 140, 200 mg/kg) to Beagle dogs was not associated with significant changes in QTca, JTpca, and Tpeca intervals (Figure 4A-C). Neurological clinical signs were noticed at the high dose (200 mg/kg) and included ataxia, gait abnormalities, and decreased activity levels. Statistically significant differences were occasionally observed (ie, 13-14 hours post-low dose [100 mg/kg, P < 0.05] and at 10-11 hours post-high dose [200 mg/kg, P < 0.05] for JTpca) but were deemed incidental since there was no correlation (temporal or otherwise) with dose level.

Time course of heart rate-corrected QTca, JTpca and Tpeca for 100 mg/kg (A), 140 mg/kg (B) and 200 mg/kg (C) due to the effects of ranolazine over 22.5h in telemetered Beagle dogs (n =4); ▪ = QTca control, ● = JTpca control, ▴= Tpeca control, = QTca 100, 140, 200 mg/kg,  = JTpca 100, 140, 200 mg/kg,
  = Tpeca 100, 140, 200 mg/kg,
  = QTca super interval,
  = JTpca super interval, □ = Tpeca super interval.
Spatial magnitude ECG
Spatial magnitude ECG (Figure 5A) represents a combination of multiple leads (Figure 5B-D) potentially attenuating artifacts related to a single derivation (indistinguishable T-peak on D2 subcutaneous; Figure 5C) for analyzing ECG.
a. Verapamil
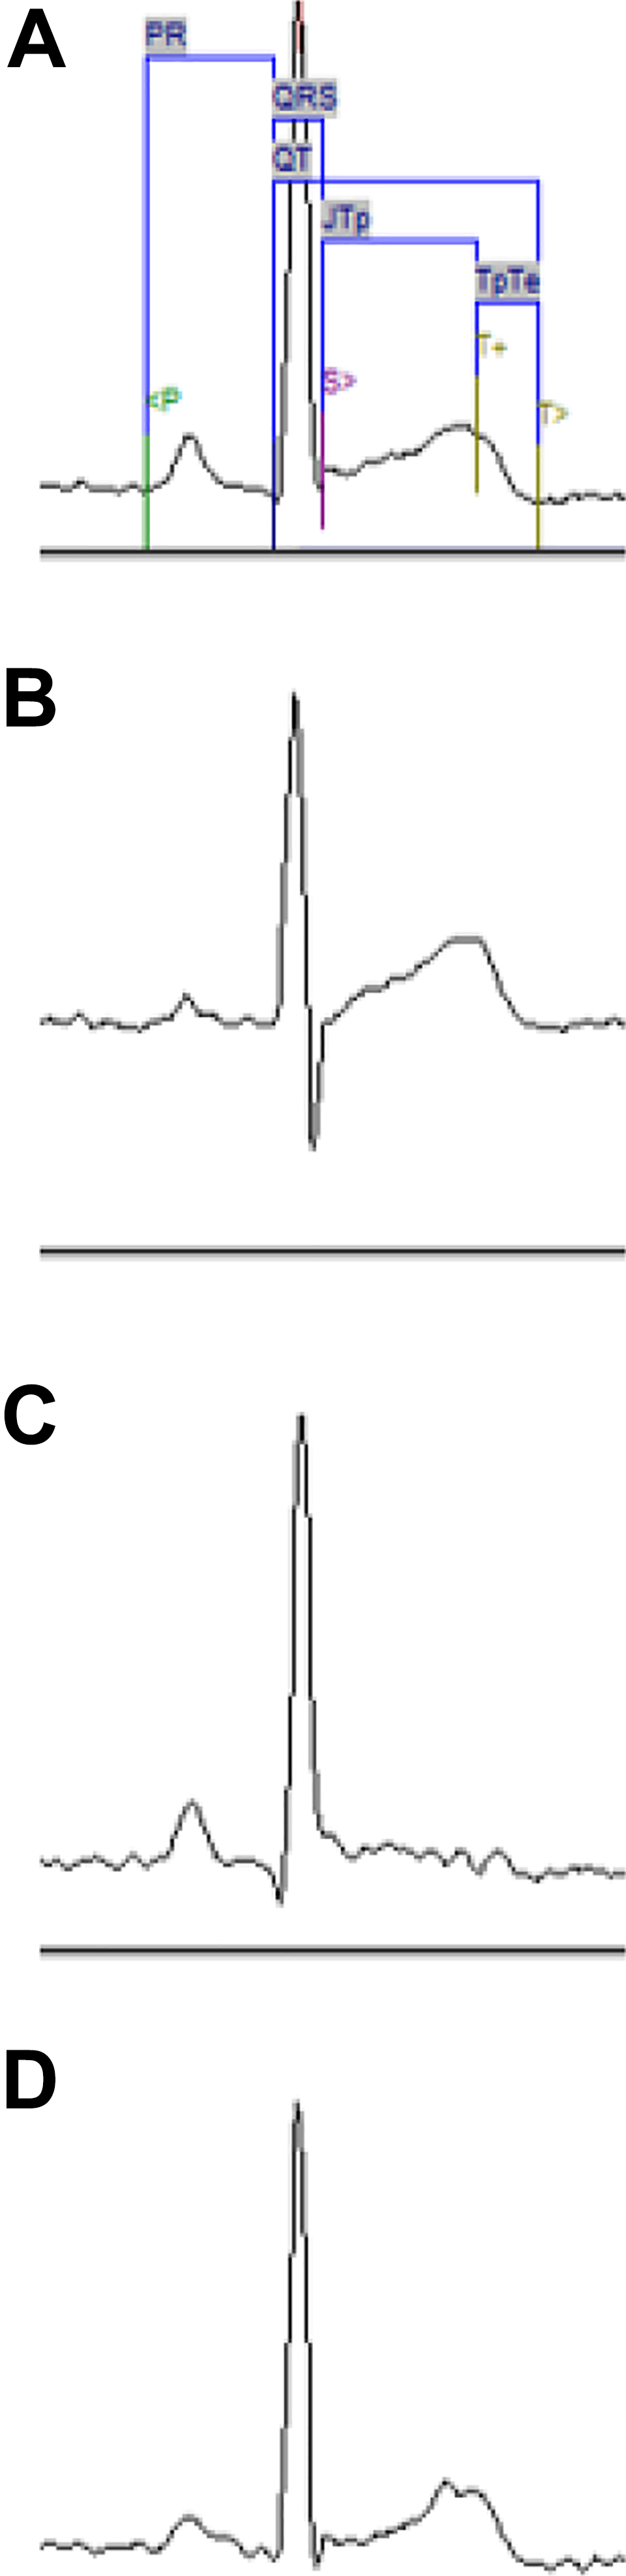
Representation of 1 beat on multiple lead of verapamil 62.5 mg/kg (PO) given to 1 beagle dog. A = spatial magnitude ECG, B = lead D1; C = lead D2 SQ, D = lead Z axis. ECG indicates electrocardiogram; PO, orally.
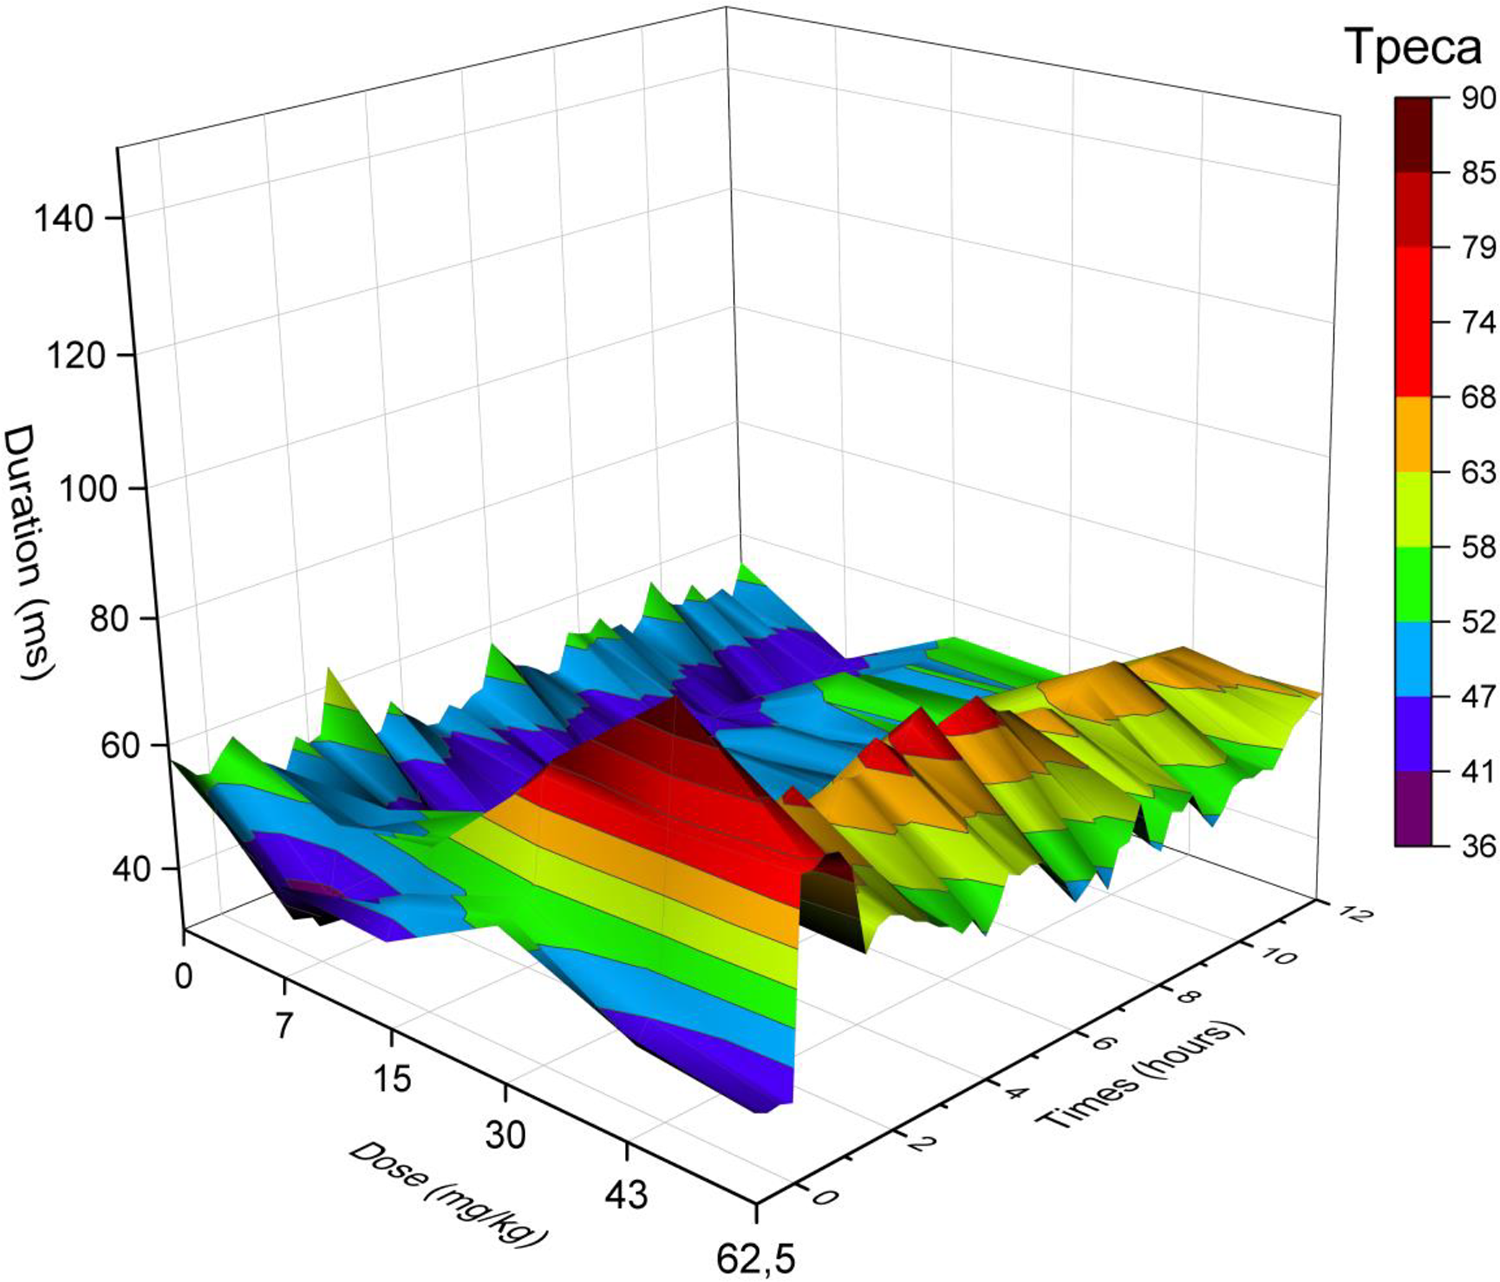
The oral administration of verapamil (0, 7, 15, 30, 43, 62.5 mg/kg) to Beagle dogs resulted in a decrease in QTca and JTpca intervals and an increase in Tpeca interval in a dose-dependent manner. The QTca at a dose of 62.5 mg/kg showed a decrease from 220 to 185 milliseconds at 0.75 hours followed by an increase from 185 to 231 milliseconds at 4.75 to 12 hours.
The mean of each parameter for each dose level from 0 to 3 hours postdose is presented in Table 2 and Figures 6 –8. Globally, verapamil was associated with a shortening of the QTca interval at all dose levels (maximum effect of −8.8% was observed at 43 mg/kg; Figure 9 and Table 3) in Beagle dogs. Statistically significant effects on the QTca interval (P < 0.05) were observed at 2 to 3 hours (15 mg/kg), at 6 to 7 hours (43 mg/kg), and at 0 to 1 hour (62.5 mg/kg; Figure 6). The JTpca interval was also significantly decreased at all doses (maximum effect of −26.5% at 43 mg/kg). Statistically significant changes in the JTpca interval were observed (P < 0.05) at 5 to 6 hours, 10 to 11 hours, and 14 to 15 hours (7 mg/kg); at 0 to 2 hours, 5 to 7 hours, 10 to 12 hours, and 14 to 15 hours (15 mg/kg); at 0 to 2 hours (30, 43, 62.5 mg/kg); and 4 to 5 hours (62.5 mg/kg; Figure 7). An increase in Tpeca was observed at all doses (the maximum effect was +78.7% at 62.5 mg/kg). Statistically significant differences were observed in the Tpe interval (P < 0.05) at 3 to 4 hours, 7 to 8 hours, 9 to 10 hours, and 18 to 21 hours for 15 mg/kg (Figure 8).
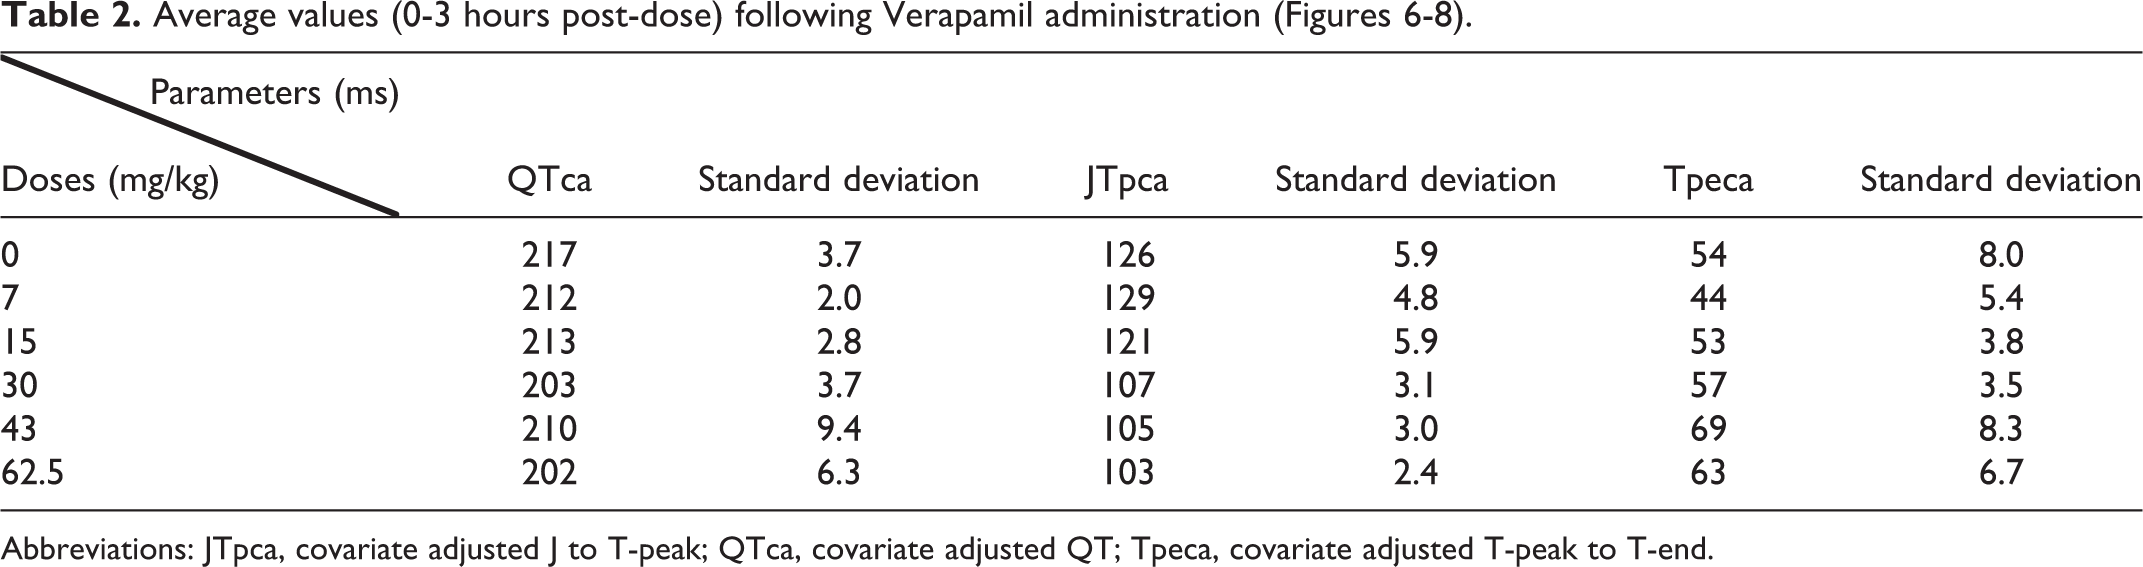
Abbreviations: JTpca, covariate adjusted J to T-peak; QTca, covariate adjusted QT; Tpeca, covariate adjusted T-peak to T-end.
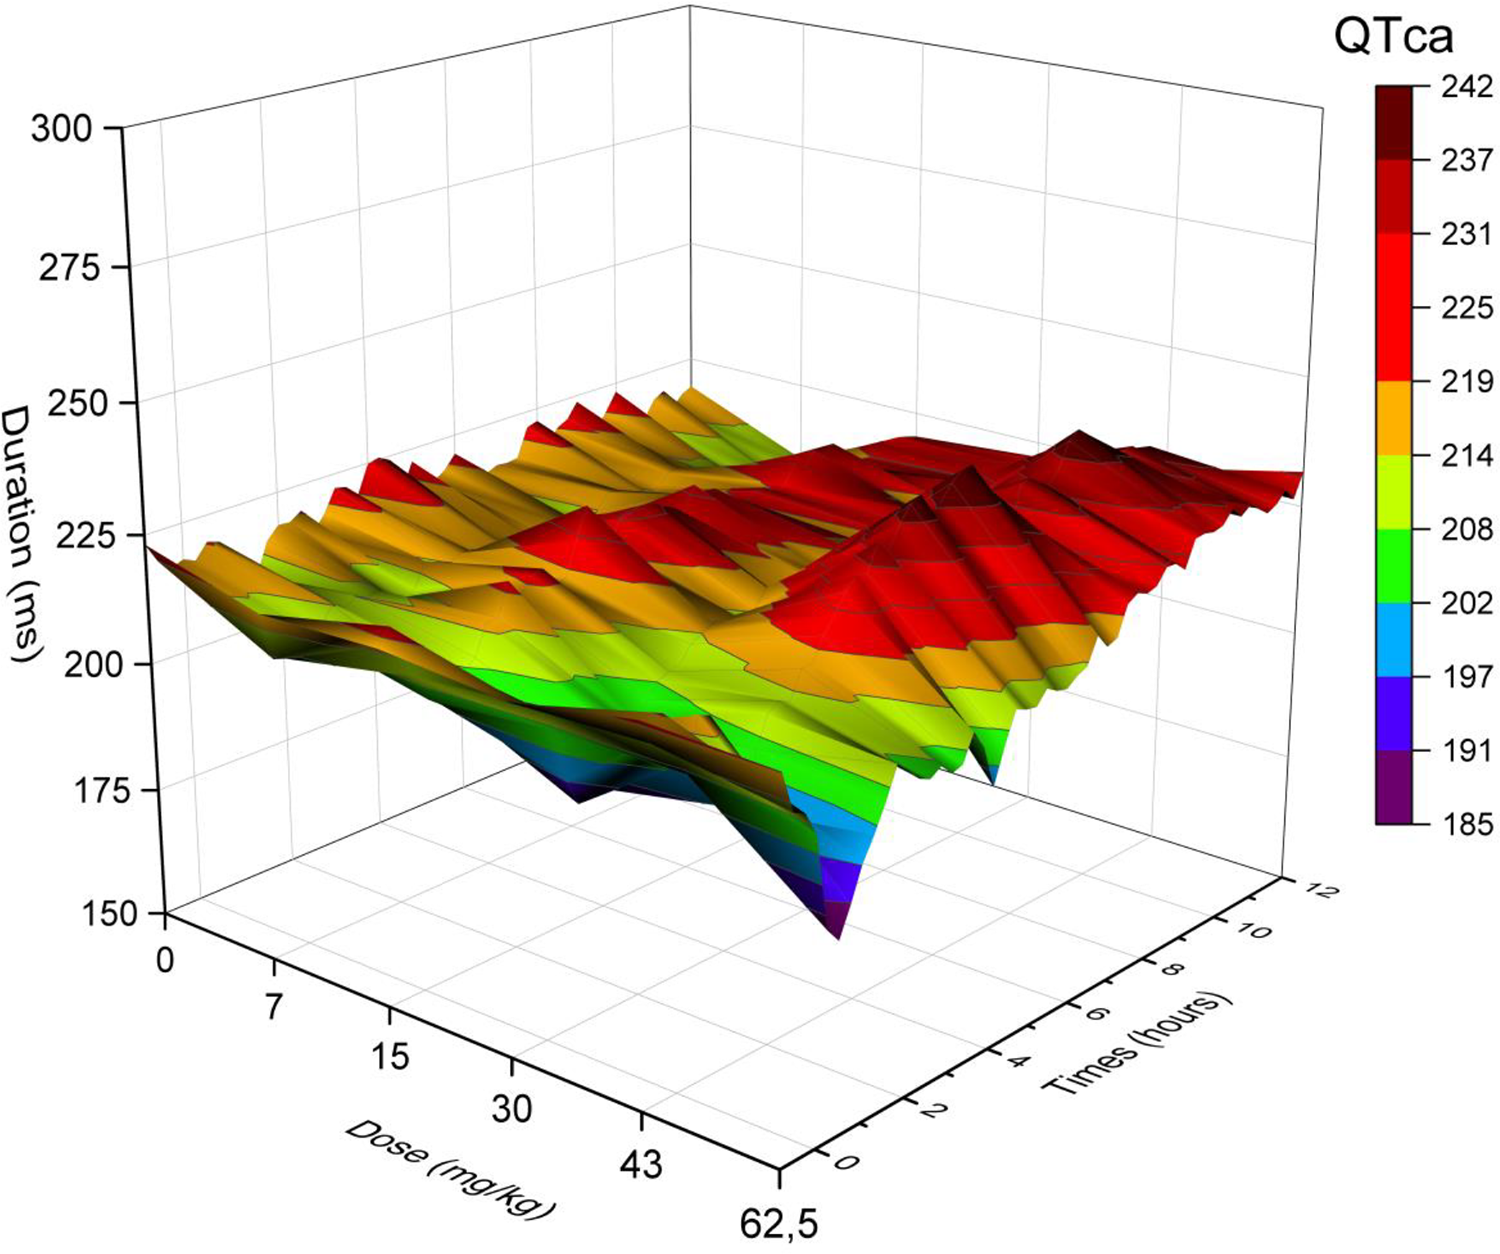
Three-dimensional representation of the effects of verapamil on QTca (0, 7, 15, 30, 43, 62.5 mg/kg, PO) over 12 hours in telemetered Beagle dogs (n = 4). The different colors (blue, orange, grey, yellow, light blue, green, and purple) represent the interval duration in milliseconds that is prolonged or shortened. QTca presented statistically significant data (P < .05) at 2 to 3 hours for verapamil (15 mg/kg), at 6 to 7 hours for verapamil (43 mg/kg), and at 0 to 1 hour for verapamil (62.5 mg/kg). PO indicates orally; QTca, covariate adjusted QT.
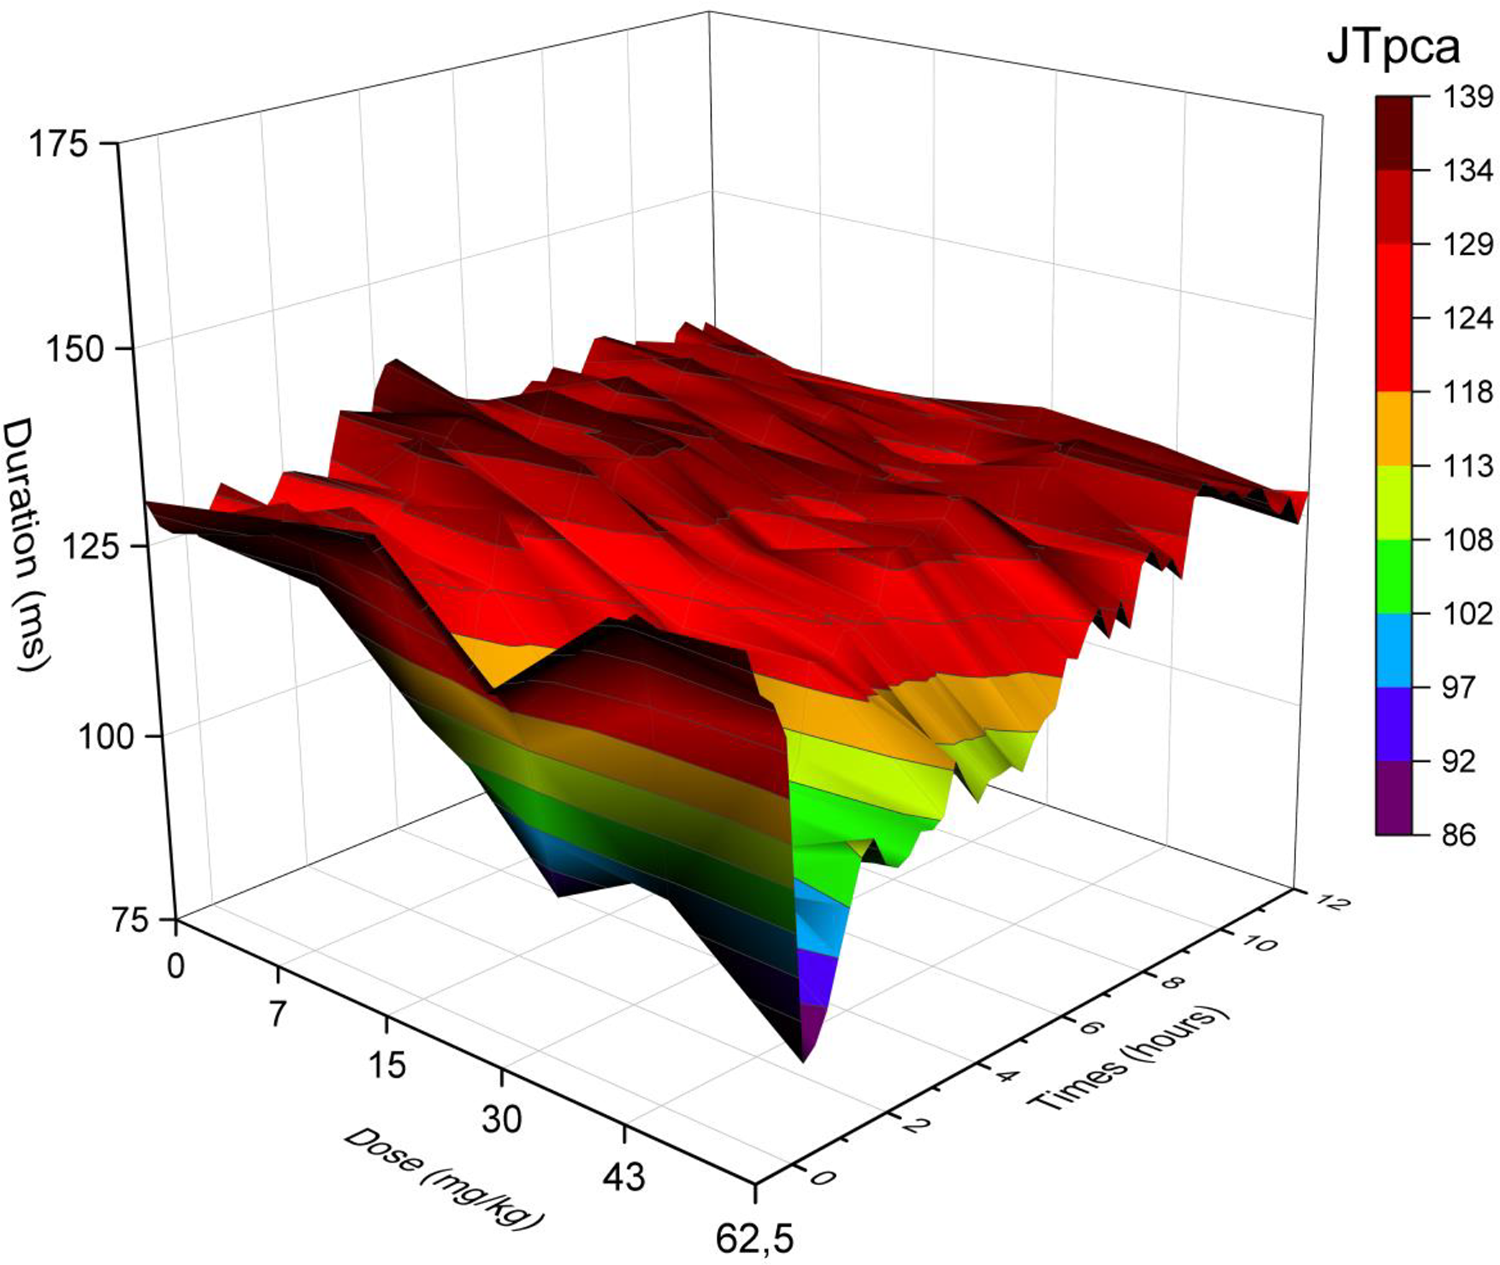
Three-dimensional representation of the effects of verapamil on JTpca (0, 7, 15, 30, 43, 62.5 mg/kg, PO) over 12 hours in telemetered Beagle dogs (n = 4). The different colors (blue, orange, grey, yellow, light blue, and green) represent the interval duration in milliseconds that is prolonged or shortened. JTpca presented statistically significant data (P < .05) at 5 to 6 hours, 10 to 11 hours, and 14 to 15 hours for verapamil (7 mg/kg); at 0 to 2 hours, 5 to 7 hours, 10 to 12 hours, and 14 to 15 hours for verapamil (15 mg/kg); at 0 to 2 hours for verapamil (30, 43, 62.5 mg/kg); and 4 to 5 hours for verapamil (62.5 mg/kg). JTpca indicates covariate adjusted J to T-peak; PO, orally.
Three-dimensional representation of the effects of verapamil on Tpeca (0, 7, 15, 30, 43, 62.5 mg/kg, PO) over 12 hours in telemetered Beagle dogs (n = 4). The different colors (blue, orange, grey, yellow, light blue, and green) represent the interval duration in milliseconds that is prolonged or shortened. Tpe presented statistically significant data (P < 0.05) at 3 to 4 hours, 7 to 8 hours, 9 to 10 hours, and 18 to 21 hours for verapamil (15 mg/kg). PO indicates orally; Tpeca, covariate adjusted T-peak to T-end.
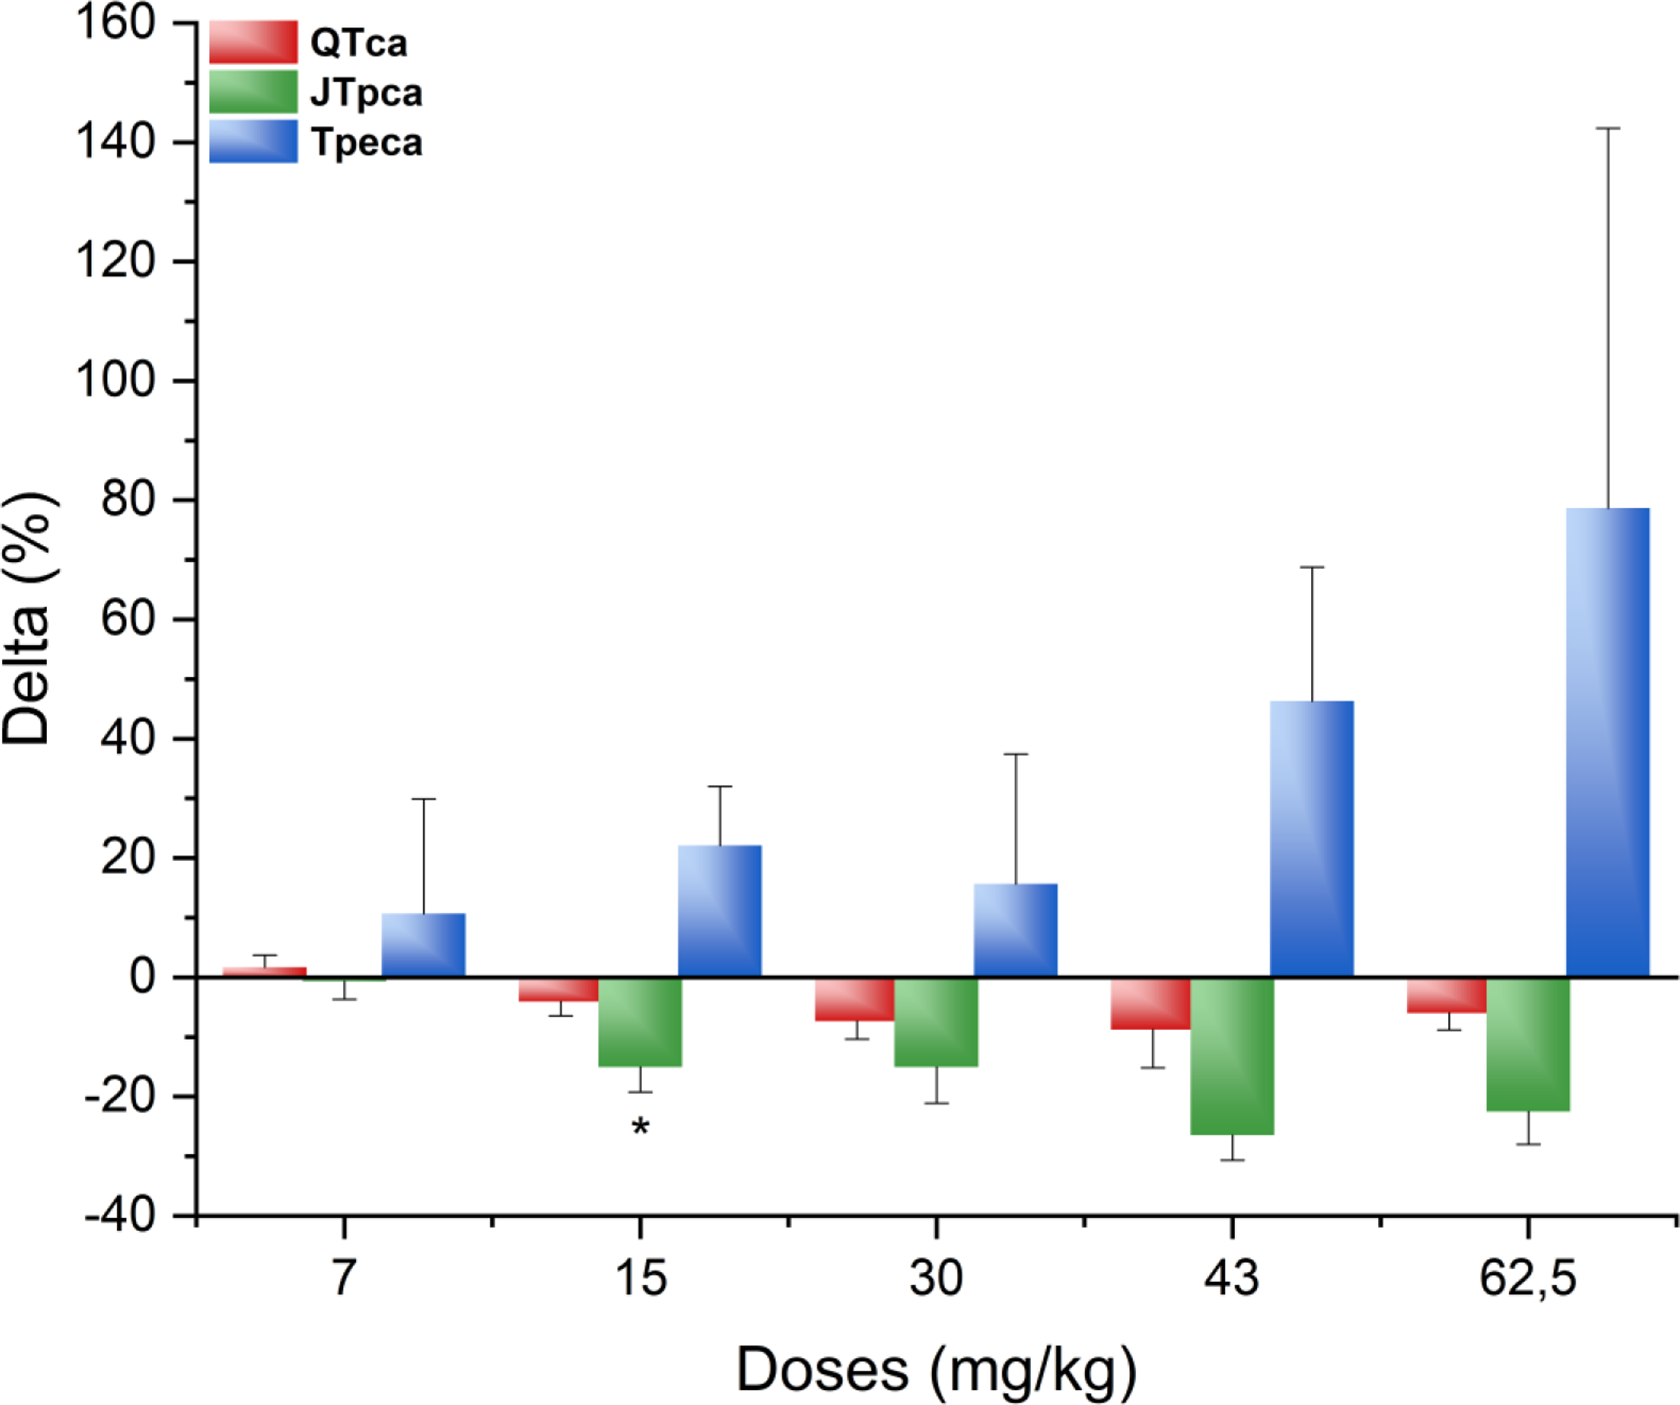
Percentage of change from the baseline at peak effect (1.25 hours) for verapamil (7, 15, 30, 43, 62.5 mg/kg, PO) for the different parameters: QTca (−8.78% to 1.67%), JTpca (−15.07% to −26.47%), and Tpeca (10.71%-78.66%). *P < 0.05 with standard error of the mean. JTpca indicates covariate adjusted J to T-peak; PO, orally; QTca, covariate adjusted QT; Tpeca, covariate adjusted T-peak to T-end.
Percentage Change From the Baseline at Peak Effect (1.25 hours) for Verapamil (7, 15, 30, 43, 62.5 mg/kg, PO) of QTca, JTpca, and Tpeca.
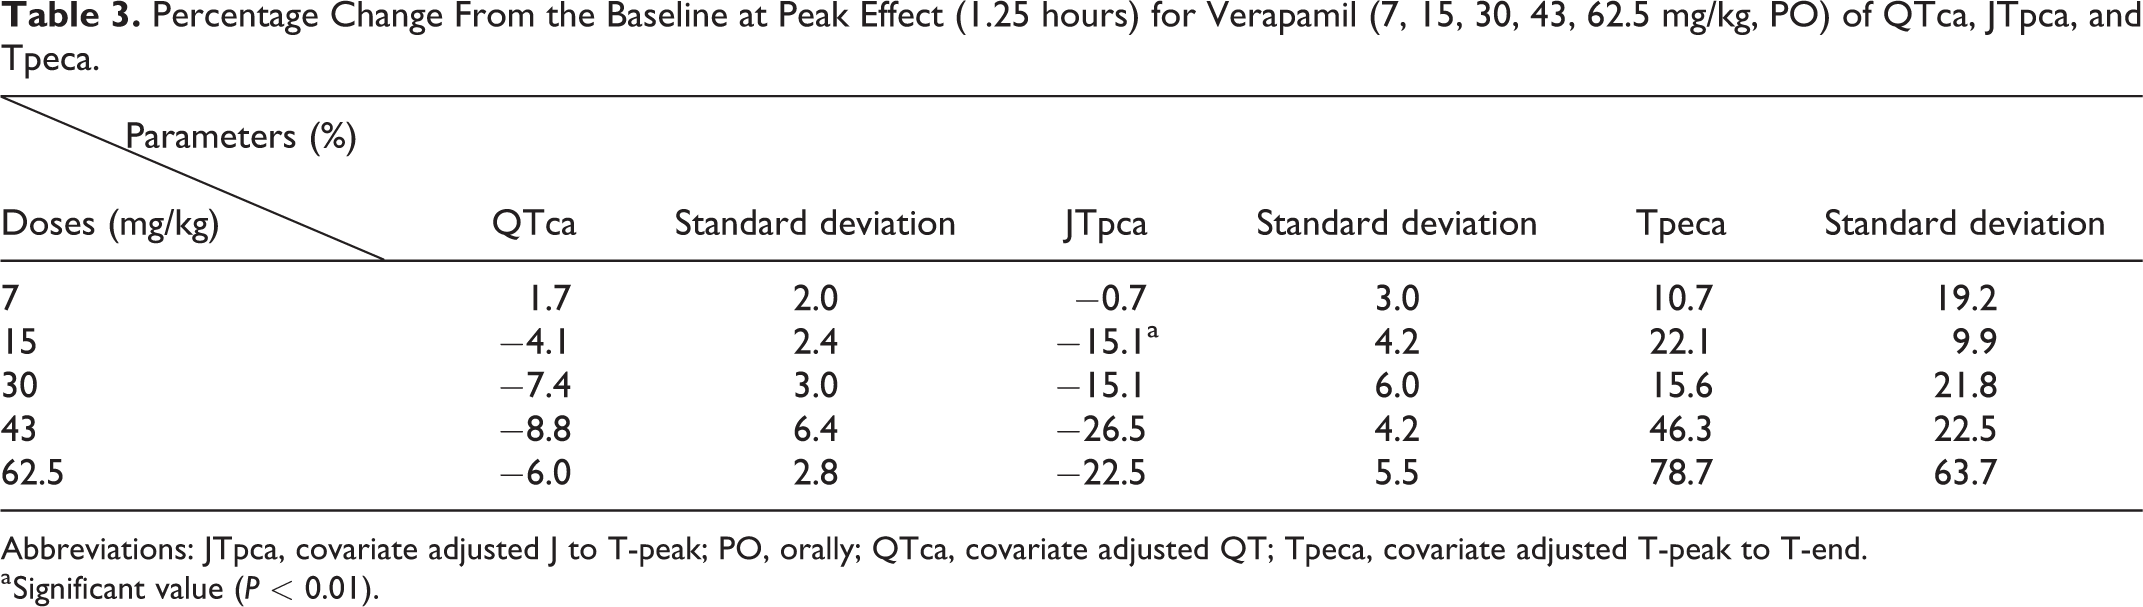
Abbreviations: JTpca, covariate adjusted J to T-peak; PO, orally; QTca, covariate adjusted QT; Tpeca, covariate adjusted T-peak to T-end.
a Significant value (P < 0.01).
b. Dofetilide
As expected, dofetilide (0.1, 0.3, 1.0 mg/kg, PO) was associated with a QTca interval prolongation at all dose levels (Figure 10A). The JTpca interval was also increased at all dose levels (Figure 10B), while the Tpeca interval was decreased at higher dose levels of 0.3 and 1.0 mg/kg (Figure 10C).
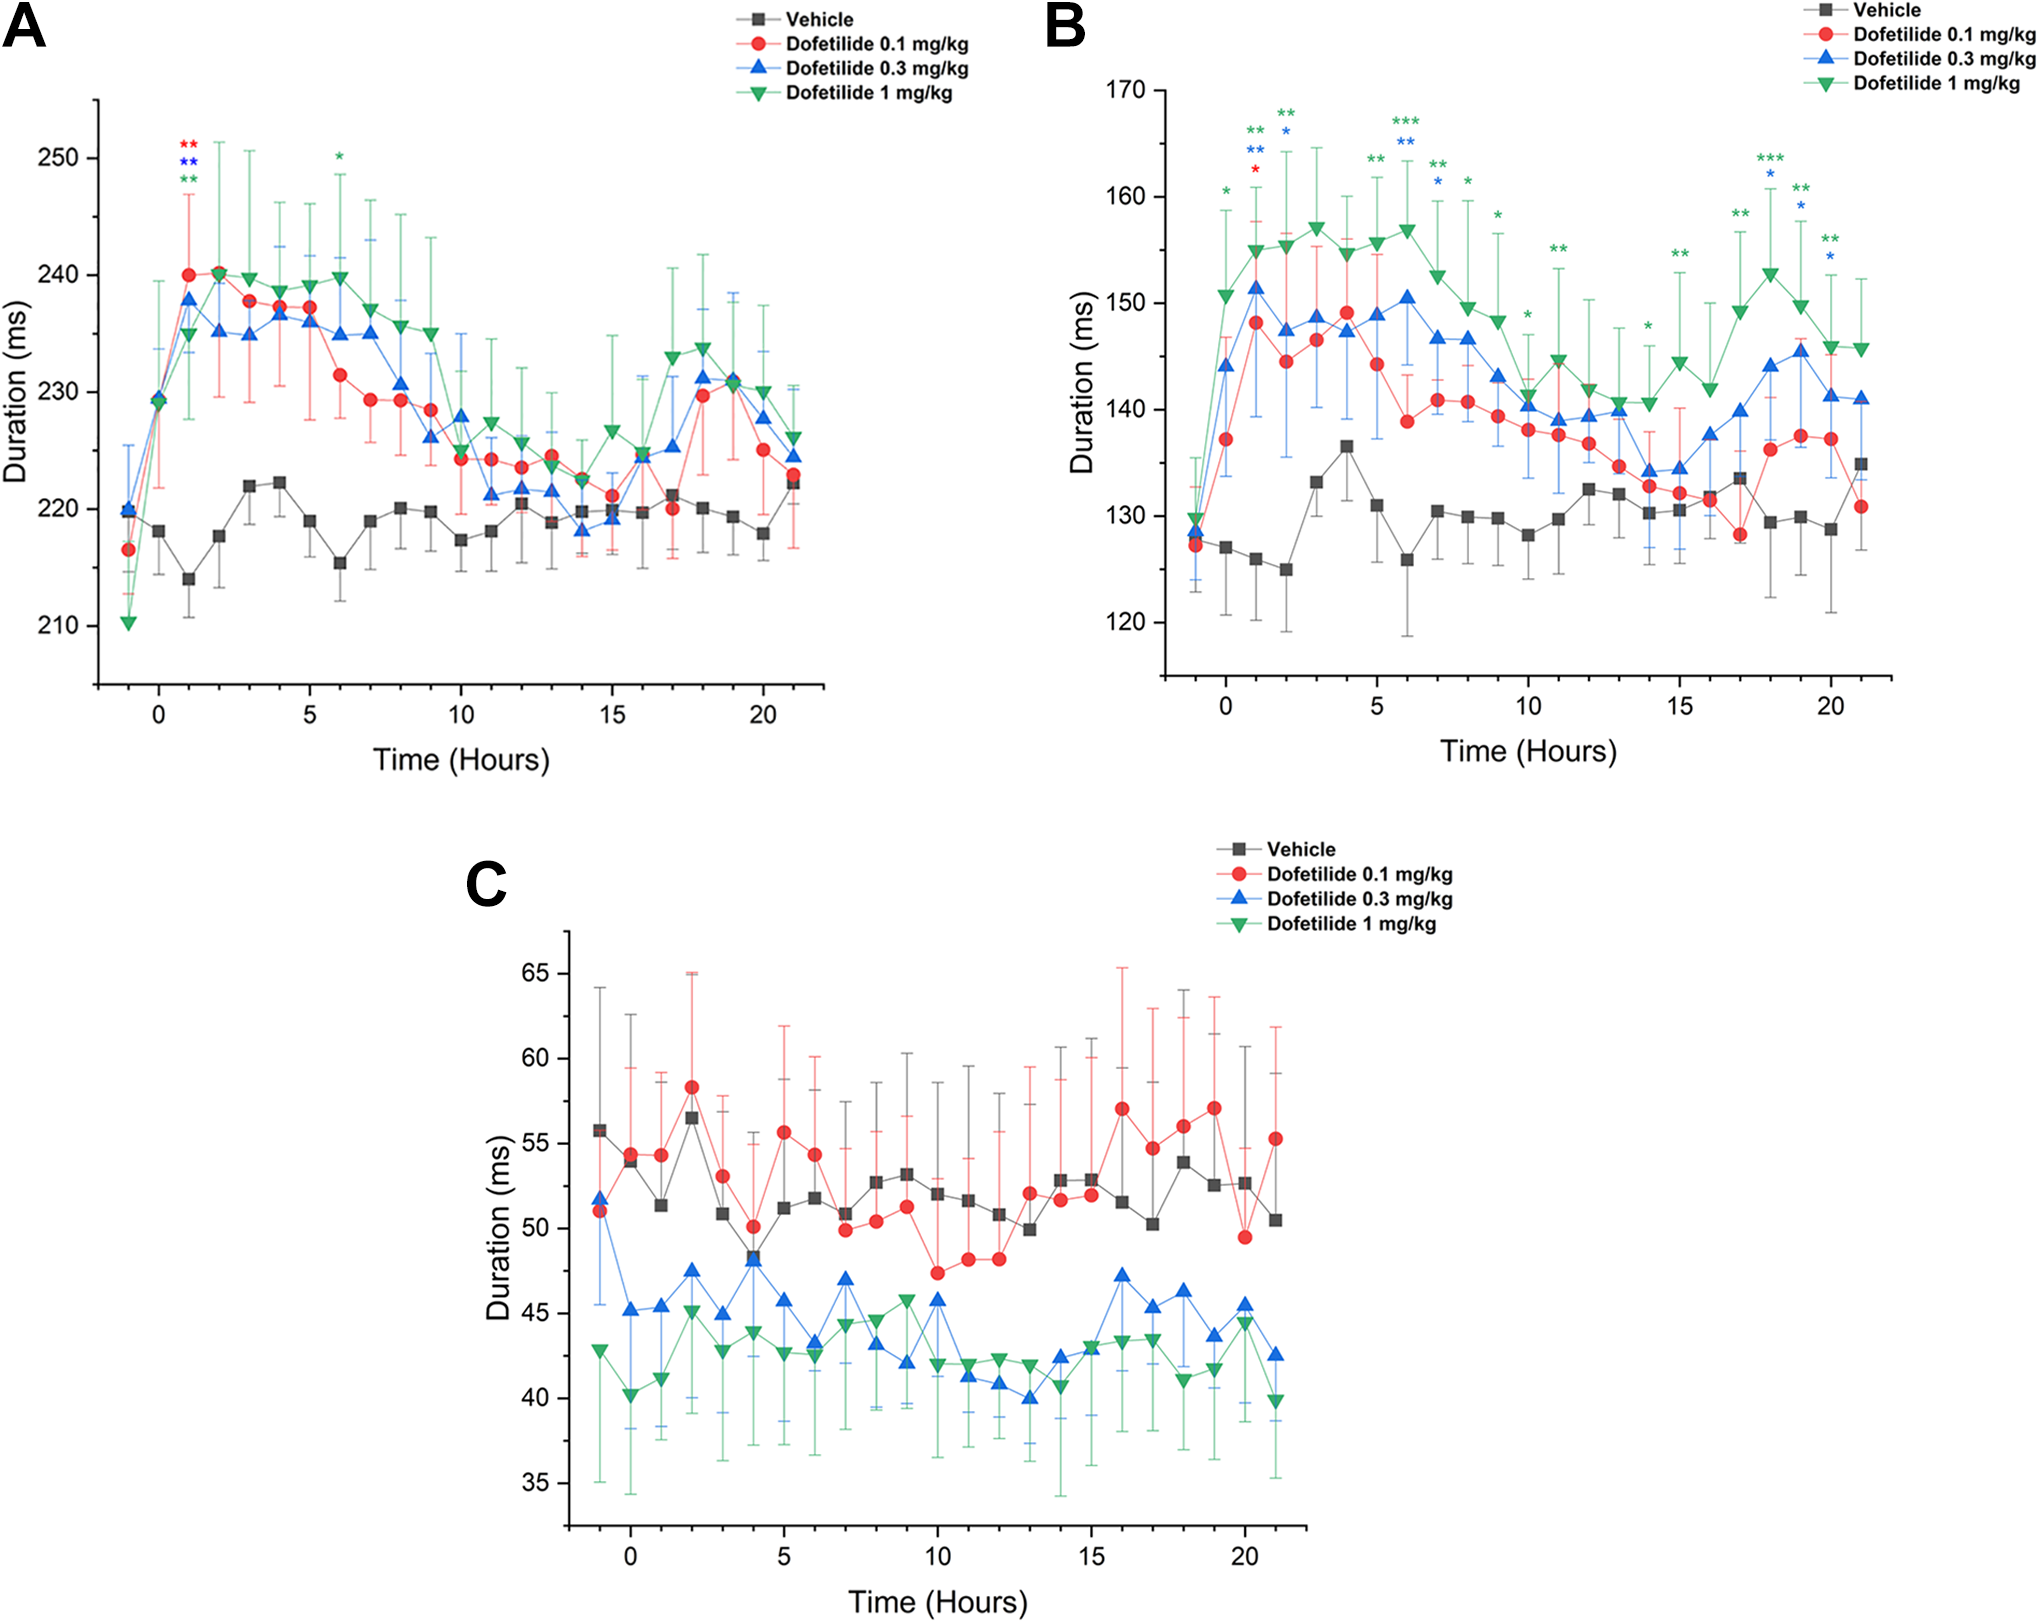
Absolute value over 22 hours of dofetilide for QTca, JTpca, and Tpeca at different dose levels ▪ = control, ● = 0.1 mg/kg (A), ▴= 0.3 mg/kg (B) ▾ = 1.0 mg/kg (C) that were given PO. The duration of milliseconds changes between the different dose levels and the different parameters. For all the dose levels, the interval duration is different for the parameters QTca, JTpca, and Tpeca. *P < 0.05, **P < 0.01, and ***P < 0.001 with standard error of the mean. JTpca indicates covariate adjusted J to T-peak; QTca, covariate adjusted QT; Tpeca, covariate adjusted T-peak to T-end.
Significant increases in the QTca interval were observed at all dose levels 1 to 2 hours postdose (P < 0.01). An increase was also noticed 6 to 7 hours (P < 0.05) following the highest dose (1.0 mg/kg; Figure 10A). The JTpca interval was increased at all dose levels and reached statistical significance 1 to 2 hours following administration of dofetilide at 0.1 mg/kg (P < 0.05). An increase in the JTpca interval was also observed at 0.3 and 1.0 mg/kg from 1 to 21 hours postdose (Figure 10B).
Discussion
The above results confirm that body temperature and epinephrine not only alter the QTc interval but also the JTpca and Tpeca intervals. These potential confounding effects may be important for interpretation of ECG data in nonclinical studies. The QT and JTp intervals were inversely proportional to body temperature whereas the Tpe interval showed no significant change over a wide range of body temperatures. Although the inverse correlation of the QTca interval with core body temperature has previously been reported in Beagle dogs, 8 the present study describes for the first time a similar correlation for the JTpca interval.
Potential mechanisms for the negative temperature effect to QT or JTp interval duration may involve a potassium shift from an extracellular to an intracellular location or to the extravascular spaces, as observed during hypothermia. 18 The resulting hypokalemia lowers the resting membrane potential in cardiomyocytes, ultimately leading to a reduced T-wave amplitude and QT interval prolongation. 19 In humans, hypothermia was reported to increase the QTc interval but had no significant effect on the Tpe/√RR. An increased QTc interval without an accompanying Tpe interval increase is not considered arrhythmogenic in humans. 20 Chronic hypothermia is also associated with more severe disturbances, including pH, electrolyte, and fluid imbalances, which alter ECG parameters. 21 For example, large QRS complexes may form as a result of hypothermia indicative of a slowing of myocardial conduction. 22 At the cellular level, these ECG changes correlate with prolongation of action potential duration (due in part to the delayed activation of the efflux potassium current), slowed inactivation of sodium current, and delayed inactivation of the inward calcium current. 22,23 Hypothermia-induced QTc prolongation may persist well after (eg, hours to days) core body temperature returns to its basal state, suggesting the potential involvement of other cellular alterations. 24 Once core body temperature returns to normal, an increased incidence of second or third degree atrioventricular block can still occur days after the original hypothermic insult. 22 Conversely, hyperthermia is also known to cause an increase in serum potassium concentrations with opposite effects to those described above for hypothermia. 8,25 This, in turn, results in high T wave amplitudes with peaked morphologies and shortened QTc as shown previously 26 and in the present study.
Epinephrine administration was associated with QTca and JTpca shortening followed by a slow recovery. Minimal effects were noted on Tpeca. Epinephrine can have different consequences on serum electrolytes. 27 High doses of epinephrine can mimic plasma concentrations observed during physiological or pathophysiological stress (such as during acute myocardial infarction). 27 Epinephrine injected in humans, for example, can produce an increase in systolic blood pressure and HR, a decrease in diastolic blood pressure, altered ECG associated with decreased T wave amplitude, QTc prolongation, and also cause hypokalemia. 27,28 Hypokalemia can prolong QT interval duration 27 and induce abnormal repolarization that could increase the risk for arrhythmias. 28 Epinephrine infusion is known to cause ventricular arrhythmias including CPVT in a small proportion of patients. 4 Ventricular arrhythmias in normal patients are rare occurrences with few arrhythmias detected in a large control group. 29 For example, in a control group, 3 (7%) of 44 patients had an isolated premature ventricular contraction and 1 (2%) of 44 presented a bigeminy (a premature ventricular contraction). 4,30
One explanation for epinephrine action on the repolarizing channel, possibly leading to QT interval prolongation, is stimulation of the β-adrenergic receptor, resulting in the slowing of the inactivation of cardiac calcium currents 31 and stimulation of the α-adrenergic receptor, resulting in reduced transient outward K+ current (I to). 32 Calcium ions, at certain concentrations, may exhibit cardiotoxic properties 33 and have an important role in the genesis of cardiac arrhythmias. 34 Darbar, et al. (1996)Infusion of epinephrine has previously been associated with an increase in QTc interval, 27 conflicting with our results that showed a decrease in QTc duration following IV bolus administration. This discrepancy may result from mechanistic differences between the longer exposure to epinephrine during infusion and rapid IV bolus administration. Further comparison and characterization of the administration methods would be required to elucidate these mechanistic differences.
As previously demonstrated, JTp and Tpe intervals both require HR correction similar to the QT interval. 3 Long RR can lead to overcorrection and short RR can lead to under correction when using the Bazett correction formula. 35,36 The Spence correction formula 17 was shown to efficiently model the QT, JTp, or Tpe interval to HR relationship enabling an individual linear correction similar to the formula created by Holzgrefe et al. 37 A high vagal tone or a low sympathetic tone results in a longer QT interval, indicating that both the sympathetic and parasympathetic tones influence the QT interval. 35 The autonomic system is believed to modulate the QT interval by direct effects on the ventricular myocardium, independently from HR, but also indirectly via changes to HR. 38 The mechanisms responsible for autonomic effects on ECG parameters are not completely elucidated, but data suggest the involvement of calcium. The administration of phenylephrine (via infusion) enhances intracellular free calcium concentrations in anesthetized dogs and increases the incidence of early after depolarization in the presence of drug-induced QT prolongation. 39 -41 Early after depolarization-induced extrasystoles promote premature cardiac depolarizations that, in turn, facilitates the onset of Torsades de Pointe (TdP), which is maintained by the re-entry mechanism for arrhythmia maintenance. 42 Overall, vagal activity plays a significant role in cardioregulation with potential implications in drug-induced QT prolongation and subsequent TdP. 43
Ranolazine is a late sodium channel blocker and an I Kr (hERG) blocker. Ranolazine administered to conscious dogs had no significant effect on QTca and JTpca. The absence of ECG effect might reflect interspecies differences, as ranozaline is known to alter sodium currents regulating cardiac action potential. While consistent ECG effects have been reported in clinical studies following ranolazine administration, 2 a lack of effect on ECG has also been previously reported in mongrel dogs. 44 Ranolazine is an allosteric modulator of the sodium channel and the observed inconsistencies between the 2 species may be related to differences in drug affinity at the binding site. Although plasma exposure was not measured, the neurological effects that were observed at high dose levels of ranolazine suggest that elevated systemic exposures were obtained.
Verapamil is an L-type calcium channel blocker and an I Kr (hERG) blocker. 45 Verapamil was associated with a dose-dependent decrease (with ceiling effect at 43 mg/kg dose) in QTca and JTpca combined with an exponential increase (more marked at higher doses) in Tpeca. No consistent effects have been observed on QTc, JTpc, and Tpec following verapamil administration, 2 possibly due to the strong calcium block that may offset the effects on the hERG channel. Electrophysiological effects of verapamil have been reported and are concentration dependent. Low concentrations of verapamil are reported to block hERG in vitro and are associated with action potential duration prolongation due to a reduction in repolarizing currents (increase refractory period) that can be visualized by a QT prolongation. 46,47 Conversely, high verapamil concentrations have been shown to shorten the action potential duration, 47 resulting in QT shortening. This particular dose–response profile could explain the differences that were observed in the current study, but additional investigations would be required to establish a complete concentration-to-effect relationship and would possibly involve in vitro and ex vivo assays. The results presented here highlight the complexity of evaluating the effects of mixed ion channel blockers such as ranolazine and verapamil.
Dofetilide, a specific I Kr (hERG) blocker, was associated with an increase in QTca and JTpca intervals whereas inconsistent effects were observed on the Tpe interval. Clinical data are similar to the canine results presented here, with concentration-dependent increases in QTca and JTpca intervals, however, unlike dogs, a significant concentration-dependent increase in Tpe interval has also been observed in humans. 2
The composite ECG data obtained in this study suggest that a combination of multiple leads can provide an accurate alternative to single-lead ECG to measure JTp and Tpe intervals as previously demonstrated by Brockway and colleagues. 48 The use of composite ECG in the current study resulted in reduced variability of both the JTp and Tpe intervals as well as an attenuation of artifacts that affect a single derivation. Although single-lead ECG can produce adequate PR, RR, QRS, and QT results, it also produces more variable results when assessing QT, JTp, and Tpe in comparison to composite ECG. Furthermore, JTp and Tpe measured with sM are less susceptible to T-wave morphology changes induced by posture and respiration. 48 In a recent clinical study, a VCG was used to represent the cardiac activation across the whole heart TdP. 2 This technique measures the early and late repolarization intervals (JTp, Tpe). 2 The cardiac electric signal was then transformed to a 3 orthogonal Frank leads 49 followed by the creation of computer-generated sM of the orthogonal Frank leads. Spatial magnitude ECG was previously used in Beagle dogs in veterinary medicine but its use remained limited clinically. 16 Nevertheless, multiple-lead ECG has been used to produce less variable QT intervals compared to the single-lead ECG normally used in preclinical studies. 48
Clinically, VCG representations simplify the description of space-time cardiac pathological patterns and enhance the automatic evaluation of cardiovascular diseases. 50 The advantage of the VCG over ECG is that VCG provides three-dimensional information on the electrical activity of the heart, allowing for improved spatial and temporal representation of cardiac depolarization and repolarization. 51 Vectorcardiogram has better sensitivity for detecting atrial enlargement and greater specificity and sensitivity in the diagnosis of left ventricular enlargement. 51
Conclusion
In conclusion, the current study investigated potential confounding factors (particularly body temperature and acute catecholamine exposure) on QTca, JTpca, and Tpeca intervals in beagle dogs. In addition, a composite multilead ECG was used to reduce morphology variability in the context of pharmacological assessments in telemetered dogs. While the use of a composite ECG showed promising results, further investigations would be required for a definitive characterization of this modality in the context of nonclinical proarrhythmia assessments.
Footnotes
Author Contributions
Emmanuel Boulay contributed to conception, contributed to analysis, and drafted manuscript; Michael V. Accardi critically revised the manuscript; Eric Troncy contributed to conception and critically revised the manuscript; Michael Pugsley, Lois Miraucourt, and Hai Huang critically revised the manuscript; Ariane Menard contributed to acquisition and critically revised the manuscript; Wendy Tan contributed to acquisition and critically revised the manuscript; Michelle Dubuc-Mageau contributed to acquisition and critically revised the manuscript; Audrey Sanfaco contributed to acquisition and critically revised the manuscript; Mireille Guerrier critically revised the manuscript; Simon Authier contributed to conception and design; contributed to acquisition, analysis, and interpretation; and critically revised the manuscript. All authors gave final approval and agree to be accountable for all aspects of work ensuring integrity and accuracy.
Declaration of Conflicting Interests
The author(s) declared no potential conflicts of interest with respect to the research, authorship, and/or publication of this article.
Funding
The author(s) received no financial support for the research, authorship, and/or publication of this article.