
Abstract
Aim:
Aflatoxin B1 (AFB1) is hepatotoxic. Numerous studies have shown that mitochondria play an essential role in AFB1-induced steatosis. However, the mechanisms of AFB1-induced steatosis via mitochondria are still obscure. The present study aimed to confirm that AFB1 causes hepatocyte steatosis regulated by cyclooxygenase-2 (COX-2)-induced mitophagy, both in vivo and in vitro.
Methods:
Adult male C57BL/6 mice were randomly divided into control group with the same volume of peanut oil and exposure group administered 0.6 mg/kg AFB1 once in 2 days for 1 month. HepG2 and Cas9-PTGS2 cells were treated with 5 μM AFB1 for 48 hours. Then, various indicators were evaluated.
Results:
Aflatoxin B1 causes liver injury and steatosis with increased alanine aminotransferase, aspartate aminotransferase, total cholesterol, total triglyceride levels in vivo and in vitro, and elevated lipid droplets in HepG2 cells. Cyclooxygenase-2 and mitophagy pathway were induced by AFB1 in both liver tissues and cultured HepG2 cells. Further studies have shown that knockout of COX-2 with the CRISPR/Cas9 system inhibited the AFB1-induced mitophagy and steatosis in HepG2 cells. Also, the inhibition of PTEN-induced putative kinase with RNA interference attenuated the AFB1-induced steatosis.
Conclusions:
The results of the current study suggested that AFB1 increases the expression of COX-2, which, in turn, elevates the level of mitophagy, thereby disrupting the normal mitochondrial lipid metabolism and causing steatosis. Thus, this study implies that COX-2 may be a potential target for therapy against AFB1-induced steatosis.
Introduction
Aflatoxin B1 (AFB1) is one of the highly toxic environmental pollutants. 1 Both in vitro and in vivo experiments and population epidemiological studies have shown that acute and chronic exposure to AFB1 targets the liver and exhibits toxic effects. 1 The results of an epidemiological survey showed that when the human body ingests AFB1 acutely, it induces acute hepatitis, hepatocyte steatosis, 2 liver necrosis, and bile duct hyperplasia. Reportedly, AFB1 induces hepatic cytotoxicity mainly due to oxidative stress, 3 nuclear DNA damage, 4 cell cycle arrest, proliferation inhibition, and lipid accumulation. 5
Cyclooxygenases (COXs) are the rate-limiting enzymes of arachidonic acid metabolism and synthesis of prostaglandins 6 and divided into 2 subtypes: COX-1 and COX-2, 7,8 based on the coding by PTGS1 and PTGS2 genes, respectively. Cyclooxygenase-2 is an inducible enzyme, which is related to various pathological processes, such as inflammatory reaction, cell proliferation, and apoptosis, and participates in the regulation of hepatocyte lipid accumulation. 9 -11 Previous studies have shown that autophagy can attenuate the nonalcoholic fatty liver by reducing the intracellular lipid and increasing the mitochondrial β-oxidation level in hepatocytes, 6,12 while selective COX-2 inhibitor celecoxib reduces the nonalcoholic fatty liver by degenerating the fatty acid and inflammation caused by high-fat diet (HFD) via inhibition of nuclear factor-kappa B signaling pathway and COX-2 protein. Therefore, we hypothesized that COX-2 might be involved in liver inflammation and lipid accumulation in hepatocytes.
Fatty acids mainly participate in energy supply via the β-oxidation pathway. 13 A key player in lipid oxidation is the rate-limiting enzyme carnitine palmitoyltransferase 1 (CPT1), which works by transferring long-chain fatty acids into the mitochondria for oxidation. 14 Previous studies have shown that mitochondrial dynamics play a pivotal role in cellular lipid metabolism. In alcohol-induced liver injury, alcohol was found to inhibit the PTEN-induced putative kinase 1 (PINK1)-Parkin-mediated mitochondrial autophagy in mouse liver, resulting in liver steatosis in mice. 15 Gene knockout technology rendered Parkin−/− mice resistant to HFD-induced liver fat accumulation. 16 Cyclooxygenase-2 regulates mitochondrial homeostasis by transporting drp1 in the cytoplasm to the mitochondria to promote mitochondrial division. 17 In this study, we aimed to confirm that AFB1 activates COX-2, which induces mitophagy and ultimately triggers hepatic steatosis.
Methods
Chemicals
Dimethyl sulfoxide (DMSO) and AFB1 were purchased from EnzoLife Sciences. Aflatoxin B1 was solubilized in DMSO and stored at −20 °C.
Animals
Adult male C57BL/6 mice (25-30 g, 6-week-old) were randomly categorized into control and AFB1 exposure groups (n = 5 each) and housed in a ventilated animal room at 22 °C ± 2 °C with a 12-hour light/dark cycle. The AFB1 exposure group was intraperitoneally injected with a dosage of 0.6 mg/kg bodyweight (bw) AFB1 once in 2 days for 1 month. On the other hand, the control group was injected with the same volume of peanut oil. At 24 hours after the last injection, the animals were sacrificed, and liver tissues excised. Any experiments involving animals were conformed to relevant national or institutional guidelines for animal usage, and this study was approved by the Ethics Research Committee of SDU (No. 19012).
Histology and Immunohistochemistry)
The tissue sections from the livers of wild-type mice were cut into continuous slices. Hematoxylin and eosin (HE) staining and immunohistochemistry (IHC) were carried out according to the method described previously. 17 Images were acquired by an inverted microscope (Nikon). Brown-stained areas indicated immunoreactivity.
Cell Culture
HepG2 cells were cultured in HyQ RPMI-1640 medium (Life) with 10% fetal bovine serum (FBS; Thermo Fisher Scientific). HEK293T cells were used for lentivirus packaging and maintained in Dulbecco’s minimum essential medium (Thermo Fisher Scientific) with 10% FBS. All culture media were supplemented with 1% (vol/vol) penicillin–streptomycin (Thermo Fisher Scientific). The cells were cultured in a humidified incubator with 5% CO2 at 37 °C.
Carnitine Palmitoyltransferase 1 Activity assay
HepG2 cells (10 × 106) were seeded in 15-cm dishes and treated for 48 hours with AFB1. Then mitochondrion-enriched cell fractions were obtained. 18 Carnitine palmitoyltransferase 1 activity was determined by the radiometric method as previously described. One unit (IU) of enzyme activity was defined as 1 μmol of product formed per minute per milligram of protein at 25 °C. 19
Establishment of Stable PTGS2-Knockout Cell Line
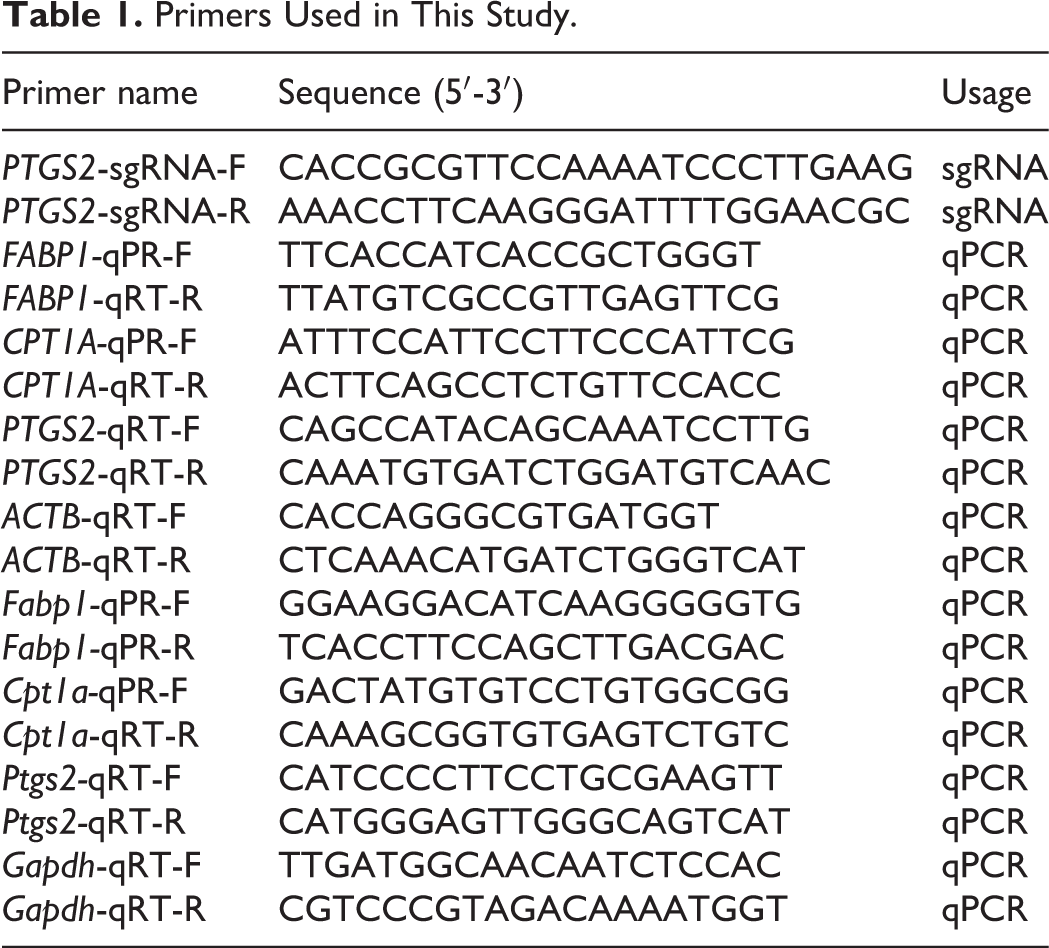
CRISPR/Cas9 plasmid lentiCRISPR v2 20 was obtained from Addgene (Cat. No. 52961), and Stbl3 bacteria were purchased from Sangon Biotech. The plasmid map is available at http://www.addgene.org/52961/. The sgRNA primer (Table 1) for PTGS2 was designed on http://crispr.mit.edu. The ligation of the large fragment of the plasmid and sgRNA was carried out according to the manufacturer’s instructions 21 and the study by Chen et al. 22 Subsequently, the ligated lentivirus plasmid was transformed into Stbl3 competent cells, which were then plated and incubated at 37 °C overnight. Then, the plasmids were used to construct stable PTGS2-knockout HepG2 cell lines, as confirmed by Western blotting and quantitative reverse transcription–polymerase chain reaction. The PTGS2-knockout cell line was termed as Cas9-PTGS2, while the corresponding control was Cas9-NC.
Primers Used in This Study.
Quantitative Polymerase Chain Reaction
Total RNA was collected from the tissues or cells using TRIzol reagent (TaKaRa). RNA was reverse transcribed to complementary DNA by reverse transcriptase (TaKaRa), according to the manufacturer’s protocol. Quantitative polymerase chain reaction was performed using specific primers for PTGS2, Ptgs2, FABP1, Fabp1, CPT1A, and Xpt1a as described previously. 22 All primers are listed in Table 1. The expression of the target gene was evaluated using the 2− △△Ct relative quantification method against that of ACTB and Gapdh. Each reaction was repeated at least 3 times independently.
Western Blotting
The proteins were extracted from tissues and whole cells, as described previously. 22 The total protein of HepG2 cells was extracted, separated using 8% and 10% sodium dodecyl sulphate–polyacrylamide gel electrophoresis (SDS-PAGE) gel at 110 V for 80 minutes, and transferred from the SDS-PAGE gel to a polyvinylidene difluoride membrane using a membrane transfer device. After incubation at 4 °C for 8 to 12 hours and washing with Tris-HCl-Tween (TBST) buffer, a primary antibody was added. Replenish the secondary antibody and allow it to stand at the room temperature for 1 to 2 hours after TBST cleaning and gel imager detection. The antibodies to PINK1 and Parkin were purchased from Cell Signaling Technology. The antibodies against COX-2 and LC3B were obtained from Abcam. Anti-GAPDH and the peroxidase-conjugated affinipure secondary antibodies, goat anti-rabbit IgG and anti-mouse IgG, were purchased from Thermo Fisher Scientific. The blot intensities were analyzed by ImageJ 1.8.0 software and the relative expression values were calculated over each control.
Immunofluorescence
HepG2 cells were grown on coverslips and treated with AFB1 to study the colocalization of different proteins. After labeling the cells with MitoTracker (100 nM) probe in the medium at 37 °C for 30 minutes, the cells were fixed in 4% paraformaldehyde (pH 7.4) for 30 minutes and permeabilized with 0.5% Triton X-100 for 5 minutes. Then, the cells were blocked with 1% bovine serum albumin for 30 minutes and treated with anti-COX-2 or anti-LC3B for 8 hours, followed by incubation with the corresponding fluorescent secondary antibodies for an additional 1 hour. Subsequently, the cell images were captured by a laser-scanning confocal microscope (Zeiss).
Lipid Droplets Staining, Total Triglyceride, and Cholesterol Measurement
HepG2 cells were stained by Oil-Red-O (Nanjing Jiancheng Bioengineering Institute) to visualize the liquid droplets (LDs) by microscope (Leika). Also, lipids in the liver of mice and HepG2 cells were extracted. Hepatic total triglyceride (TG) and total cholesterol (TC) were measured using commercial kits (Nanjing Jiancheng Bioengineering Institute), according to the manufacturer’s protocol, and normalized to the protein content by BCA assay (Thermo Fisher Scientific).
Estimation of Alanine Aminotransferase and Aspartate Aminotransferase
For liver tissues, 9 times volume of phosphate-buffered saline (PBS) were added to the tube according to the weight (g):volume (mL) = 1:9 ratio. Then mechanically homogenize them under ice-water bath conditions, centrifuge at 2,500g/min for 10 minutes, and take the supernatant for later measurement. For cell samples, the prepared suspension was centrifuged at 1,000g/min for 10 minutes, then we discarded the supernatant, and washed the cells with PBS for 1 to 2 times, continuing to centrifuge at 1,000g/min for 10 minutes and discard the supernatants. A 0.2 to 0.3 mL of PBS were added to the tubes and sonicated under ice-water bath (power: 300 W, 3-5 seconds per time, 30 seconds interval, repeat 3-5 times). The prepared homogenate was made for later measurement. The levels of aspartate aminotransferase (AST) and alanine aminotransferase (ALT) in liver tissues and HepG2 cells were measured according to the manufacturer’s (Nanjing Jiancheng Bioengineering Institute) instructions.
Statistical Analysis
All data are expressed as the mean ± standard deviation. The statistical analyses were conducted using SPSS version 18.0 software, and the differences in data among the groups were analyzed using an unpaired Student t test or one-way analysis of variance test. Value of P < 0.05 (2-tailed) indicated a significant difference.
Results
Aflatoxin B1 Causes Liver Injury and Steatosis
The body weight of mice in the AFB1 group had no change compared to control group (Figure 1A) after 0.6 mg/kg AFB1 exposure once in 2 days for 30 days. Figure 1B depicts the histological changes as detected by HE staining. The vacuoles in the liver tissue and the nucleus were intensely stained, suggesting lipid accumulation and inflammation in the liver after AFB1 exposure. Also, the levels of ALT and AST were elevated in AFB1-treated HepG2 cells and liver tissues (Figure 1C). Moreover, hepatic TG and TC contents were increased in the AFB1-exposed mice and AFB1-treated HepG2 cells as compared to the corresponding controls (Figure 1D), which indicated that AFB1 induces liver steatosis in vivo and in vitro. In order to investigate whether lipid accumulation by AFB1 is due to increased lipid synthesis or reduced metabolism, we measured the messenger RNA (mRNA) levels of lipid synthesis-related protein fatty acid-binding protein 1 (FABP1) and lipid metabolism-related protein carnitine palmitoyltransferase 1A (CPT1A; Figure 1E). The results showed that the FABP1 and Fabp1 level was not altered, while CPT1A and Cpt1a level decreased after AFB1 treatment both in vivo and in vitro. Furthermore, we measured CPT1A protein level and enzyme activity in HepG2 cells with AFB1 treated. As we can see, the CPT1A protein level and enzyme activity decreased after AFB1 treated in HepG2 cells (Figure 1F).
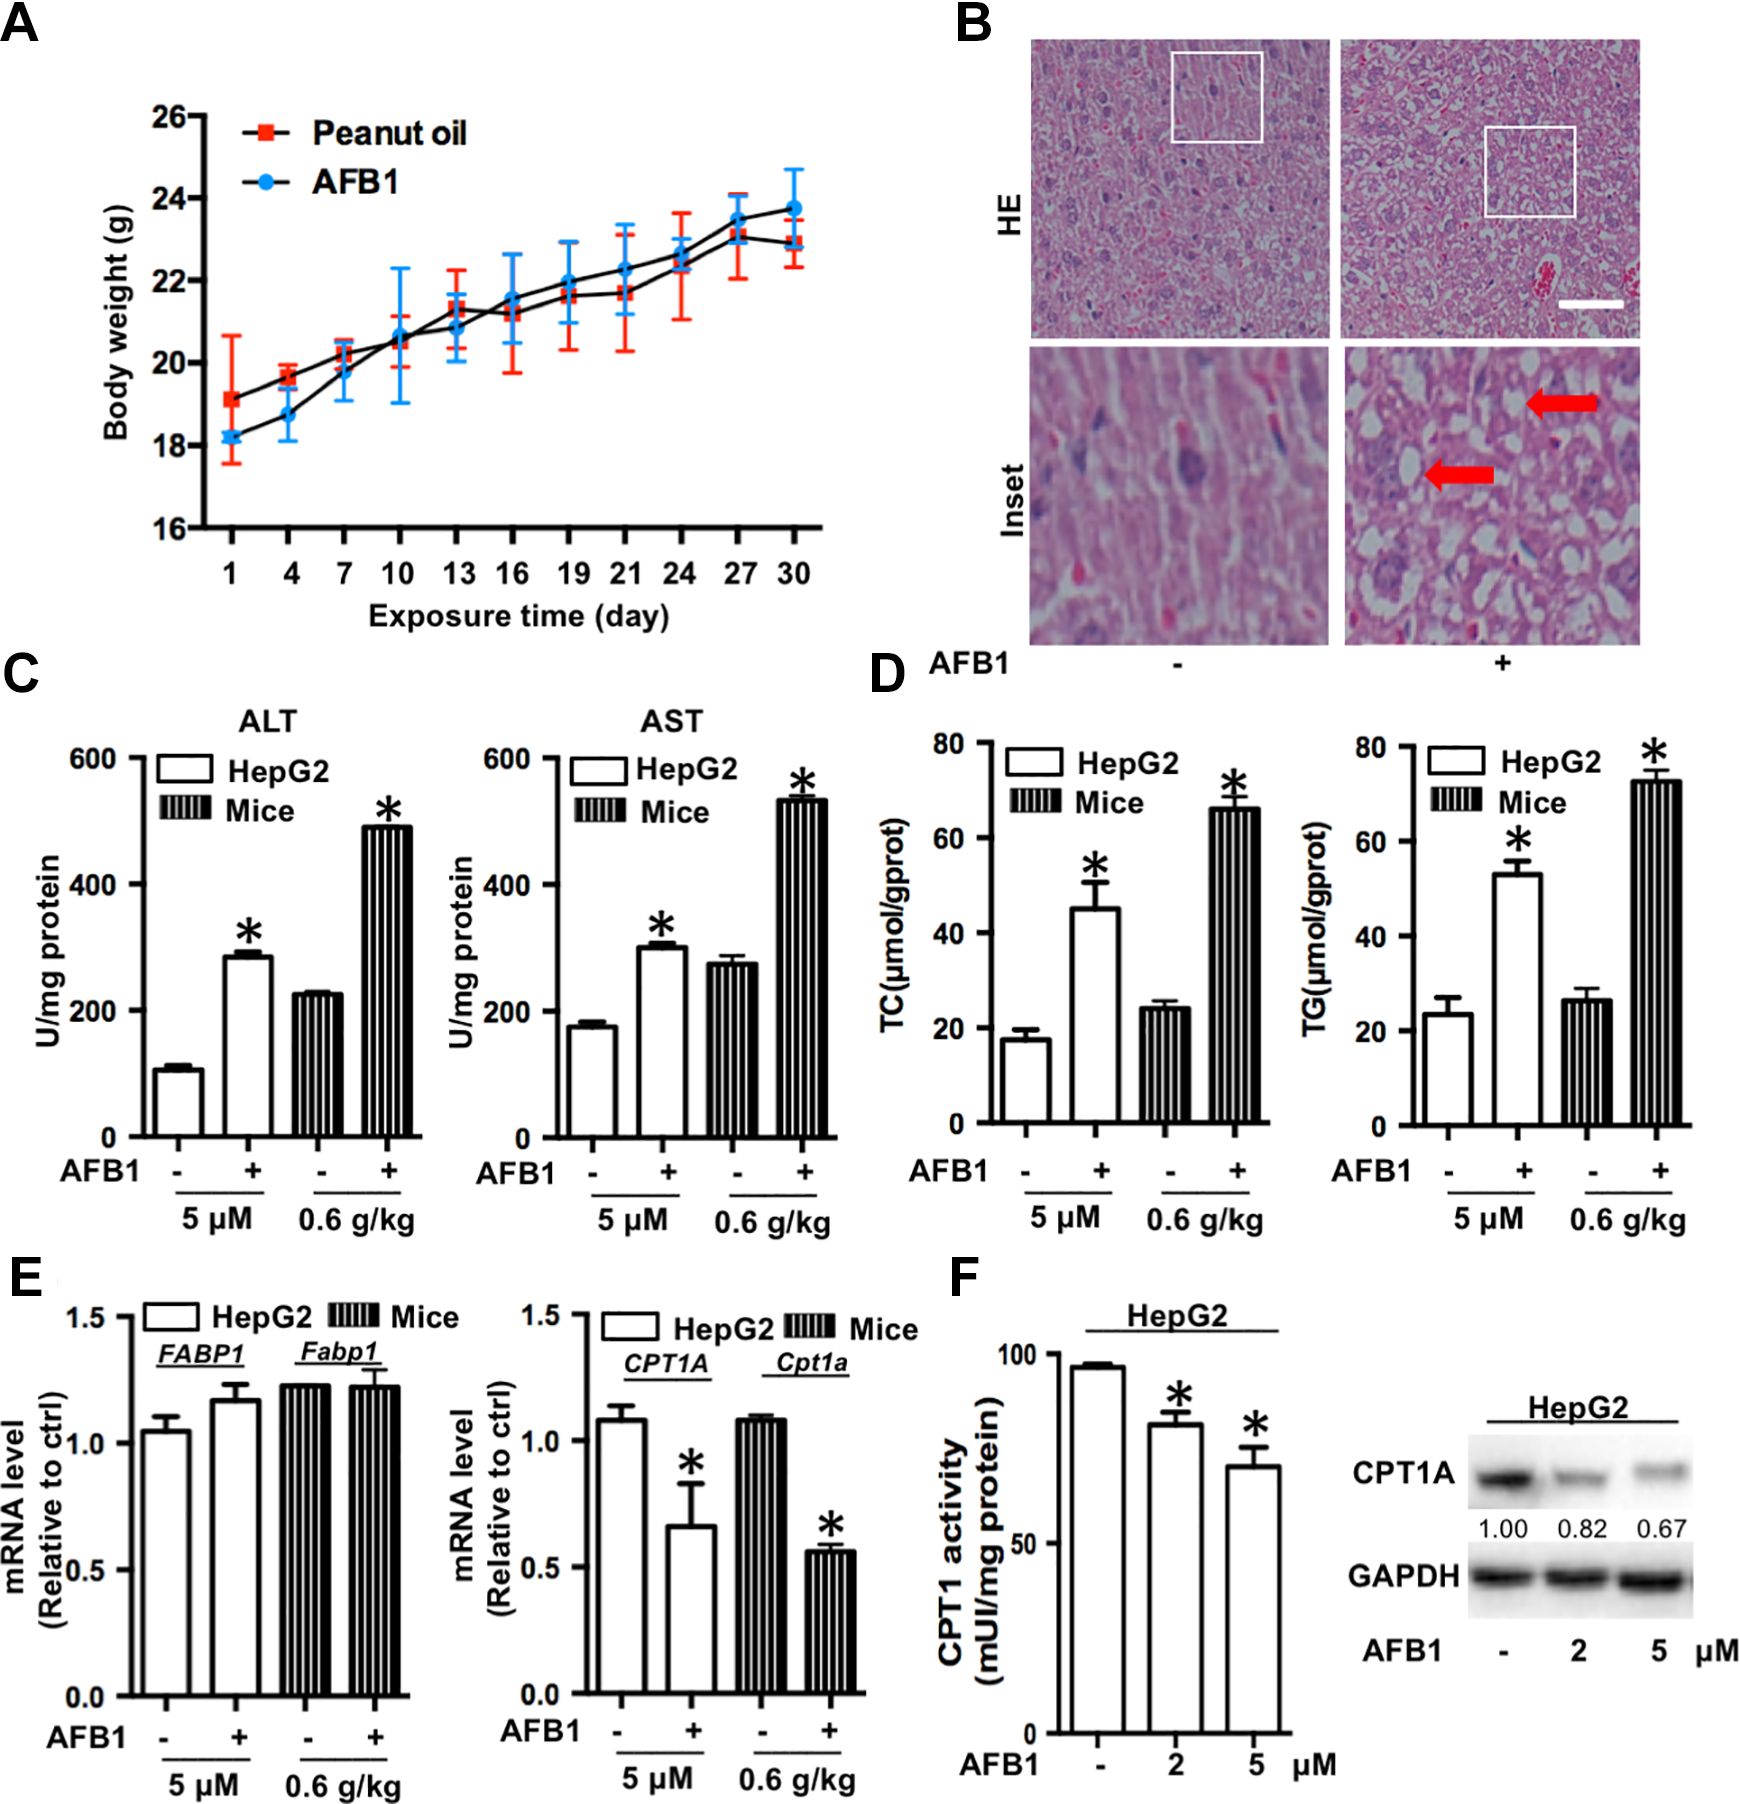
Aflatoxin B1 (AFB1) causes liver injury and steatosis in vivo and in vitro. A, Body weight curve. B, Hematoxylin and esosin staining of the livers after AFB1 exposure to mice for 30 days (magnification, ×400). The scale bar is 50 μm. C, Alanine aminotransferase (ALT) and AST levels after AFB1 treated in HepG2 cells for 48 hours and livers for 30 days. D, Levels of TC and TG in HepG2 cells and livers after 48 hours and 30 days. E, FABP1 and CPT1A mRNA levels after AFB1 treatment in HepG2 cells for 48 hours and Fabp1 and Cpt1a mRNA levels after AFB1 treatment in livers for 30 days. F, CPT1A protein level and enzyme activity after AFB1 treated in HepG2 cells. * P < 0.05 as compared to HepG2 or liver control. AFB1 indicates aflatoxin B1; AST, aspartate aminotransferase; mRNA, messenger RNA; TC, total cholesterol; TG, total triglyceride.
Aflatoxin B1 Upregulates COX-2 Expression Both In Vivo and In Vitro
To explore the role of COX-2 in AFB1-induced liver steatosis, the expression of COX-2 was assessed after AFB1 exposure both in vivo and in vitro. As shown in Figure 2A and B, AFB1 increased the PTGS2 mRNA level and protein expression in AFB1-treated HepG2 cells as well as Ptgs2 mRNA levels and protein expression in AFB1-treated mice’s livers. And COX-2 protein levels are in an AFB1 dose-dependent manner in HepG2 cells. Furthermore, IHC confirmed that COX-2 was significantly induced in liver tissues by AFB1 exposure (Figure 2C). Also, immunofluorescence analysis confirmed that COX-2 was significantly induced in HepG2 cells after AFB1 treatment (Figure 2D). These results indicated that COX-2 plays a putative role in AFB1-induced steatosis.
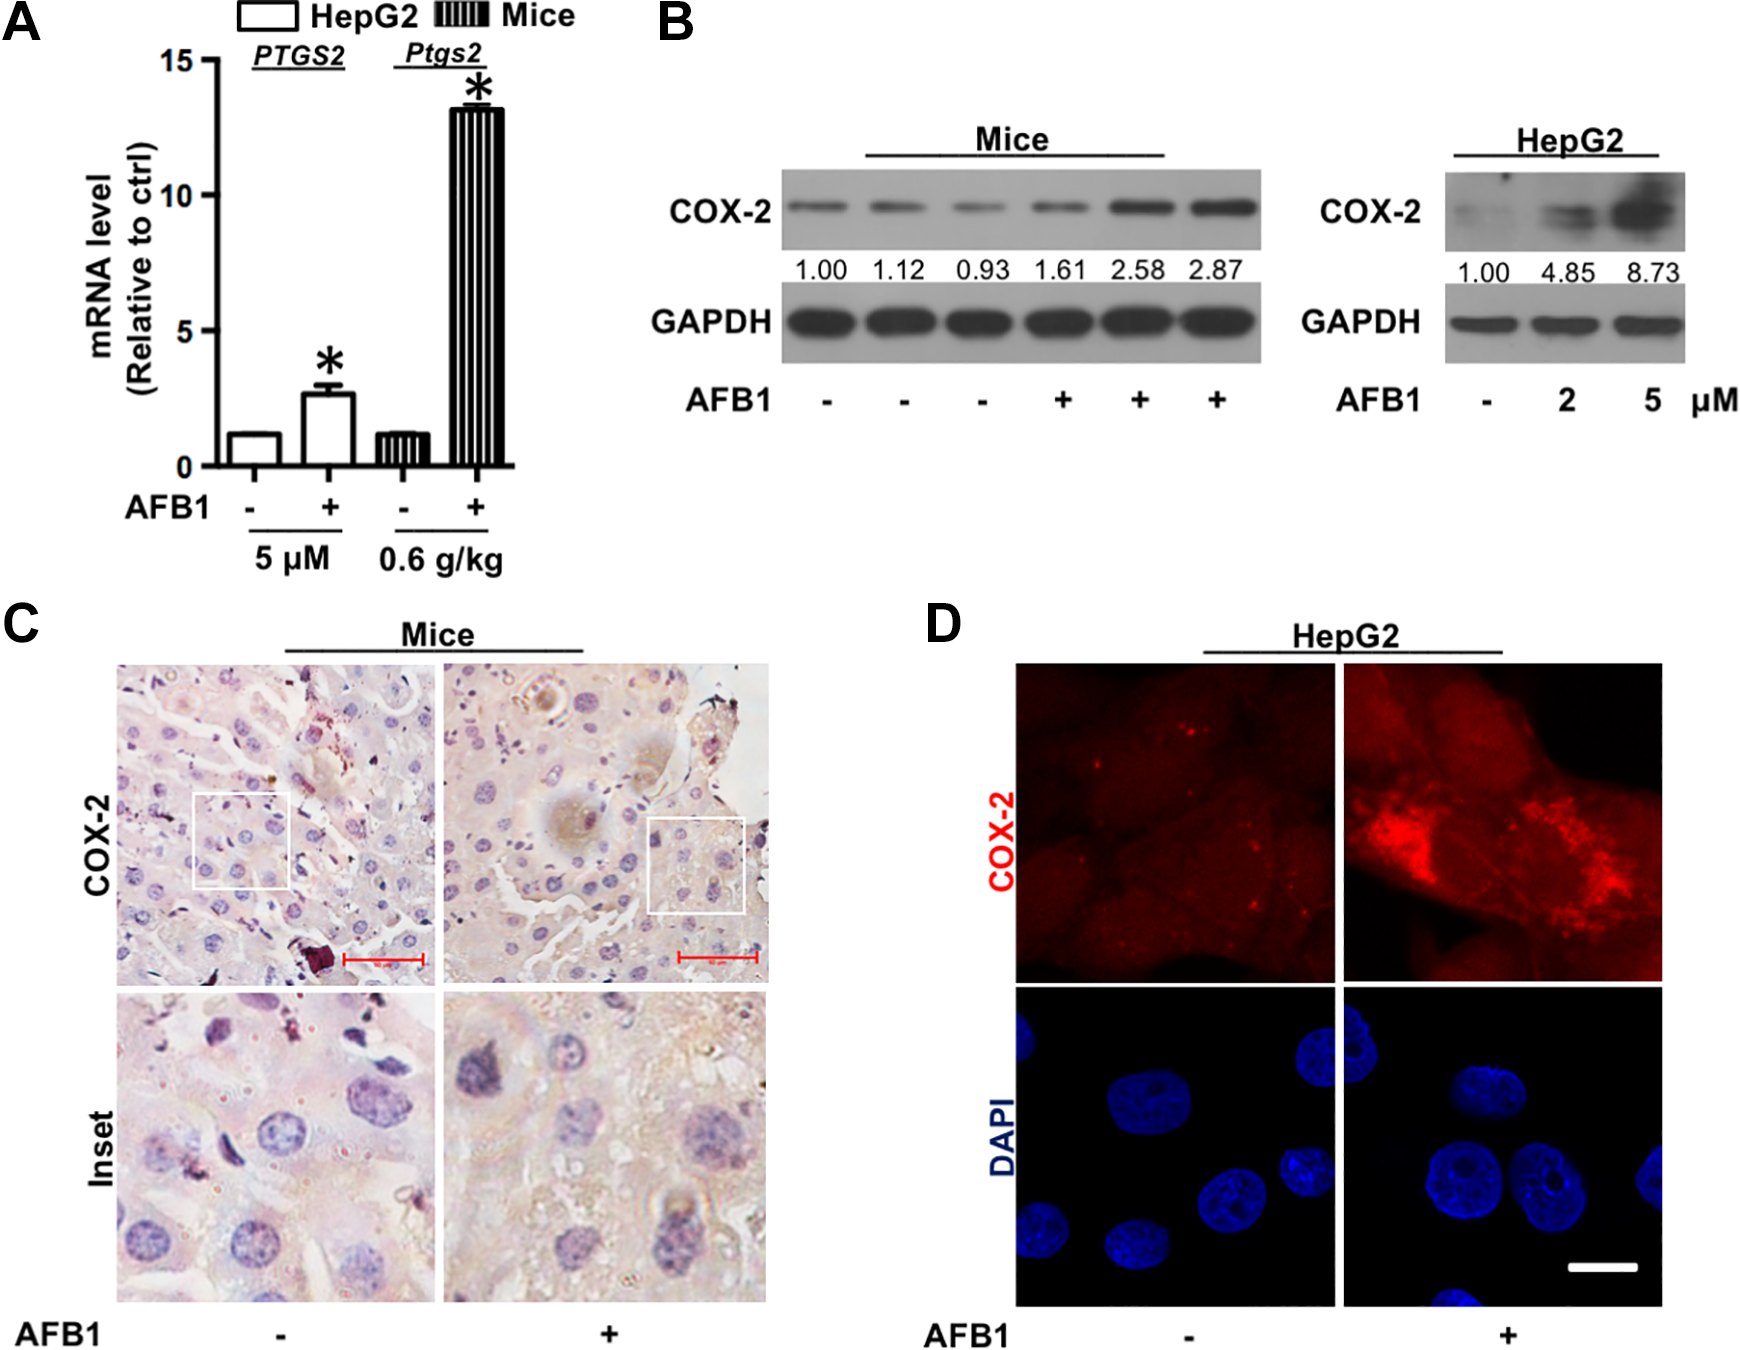
Aflatoxin B1 (AFB1) upregulates COX-2 expression both in vivo and in vitro. A, PTGS2 and Ptgs2 mRNA. B, COX-2 protein levels after AFB1 treatment in HepG2 cells for 48 hours and livers for 30 days. C, Immunohistochemistry (IHC) for COX-2 in the liver tissues of AFB1-exposed mice for 30 days (magnification, ×400). Scale bar is 50 μm. D, Representative images of the immunofluorescence staining for COX-2 (red) in HepG2 cells. Nucleus was stained with 4′,6-diamidino-2-phenylindole (DAPI) (blue). Scale bar represents 10 μm. AFB1 indicates aflatoxin B1; COX-2, cyclooxygenase-2; DAPI, 4′,6-diamidino-2-phenylindole; mRNA, messenger RNA.
Inhibition of COX-2 Expression Attenuates AFB1-Induced Steatosis
To confirm whether COX-2 mediates AFB1-induced steatosis, we established COX-2 knockout-HepG2 cell lines using the CRISPR/Cas9 system: Cas9-NC and Cas9-PTGS2. First, the PTGS2 mRNA and COX-2 protein levels were detected in Cas9-NC and Cas9-PTGS2 cell lines after AFB1 treatment for 48 hours. The results showed that in comparison to the Cas9-NC cell line, the PTGS2 mRNA and COX-2 protein levels were significantly lower in the Cas9-PTGS2 cell line, whereas AFB1 still elevated the mRNA and protein levels (Figure 3A). The FABP1 mRNA levels did not alter in both cell lines after AFB1 treatment. The CPT1A mRNA level decreased after AFB1 treatment in the Cas9-NC cell line but remained unchanged in the Cas9-PTGS2 cell line (Figure 3B), thereby indicating that COX-2 regulates fatty acid metabolism in AFB1-treated hepatocytes. Furthermore, we discovered that in comparison to the Cas9-NC cell line, the TC and TG levels (Figure 3C) and the density of LDs (Figure 3D) were significantly lower in Cas9-PTGS2 cell line after AFB1 treatment. These findings indicated that the inhibition of COX-2 expression attenuates AFB1-induced steatosis.
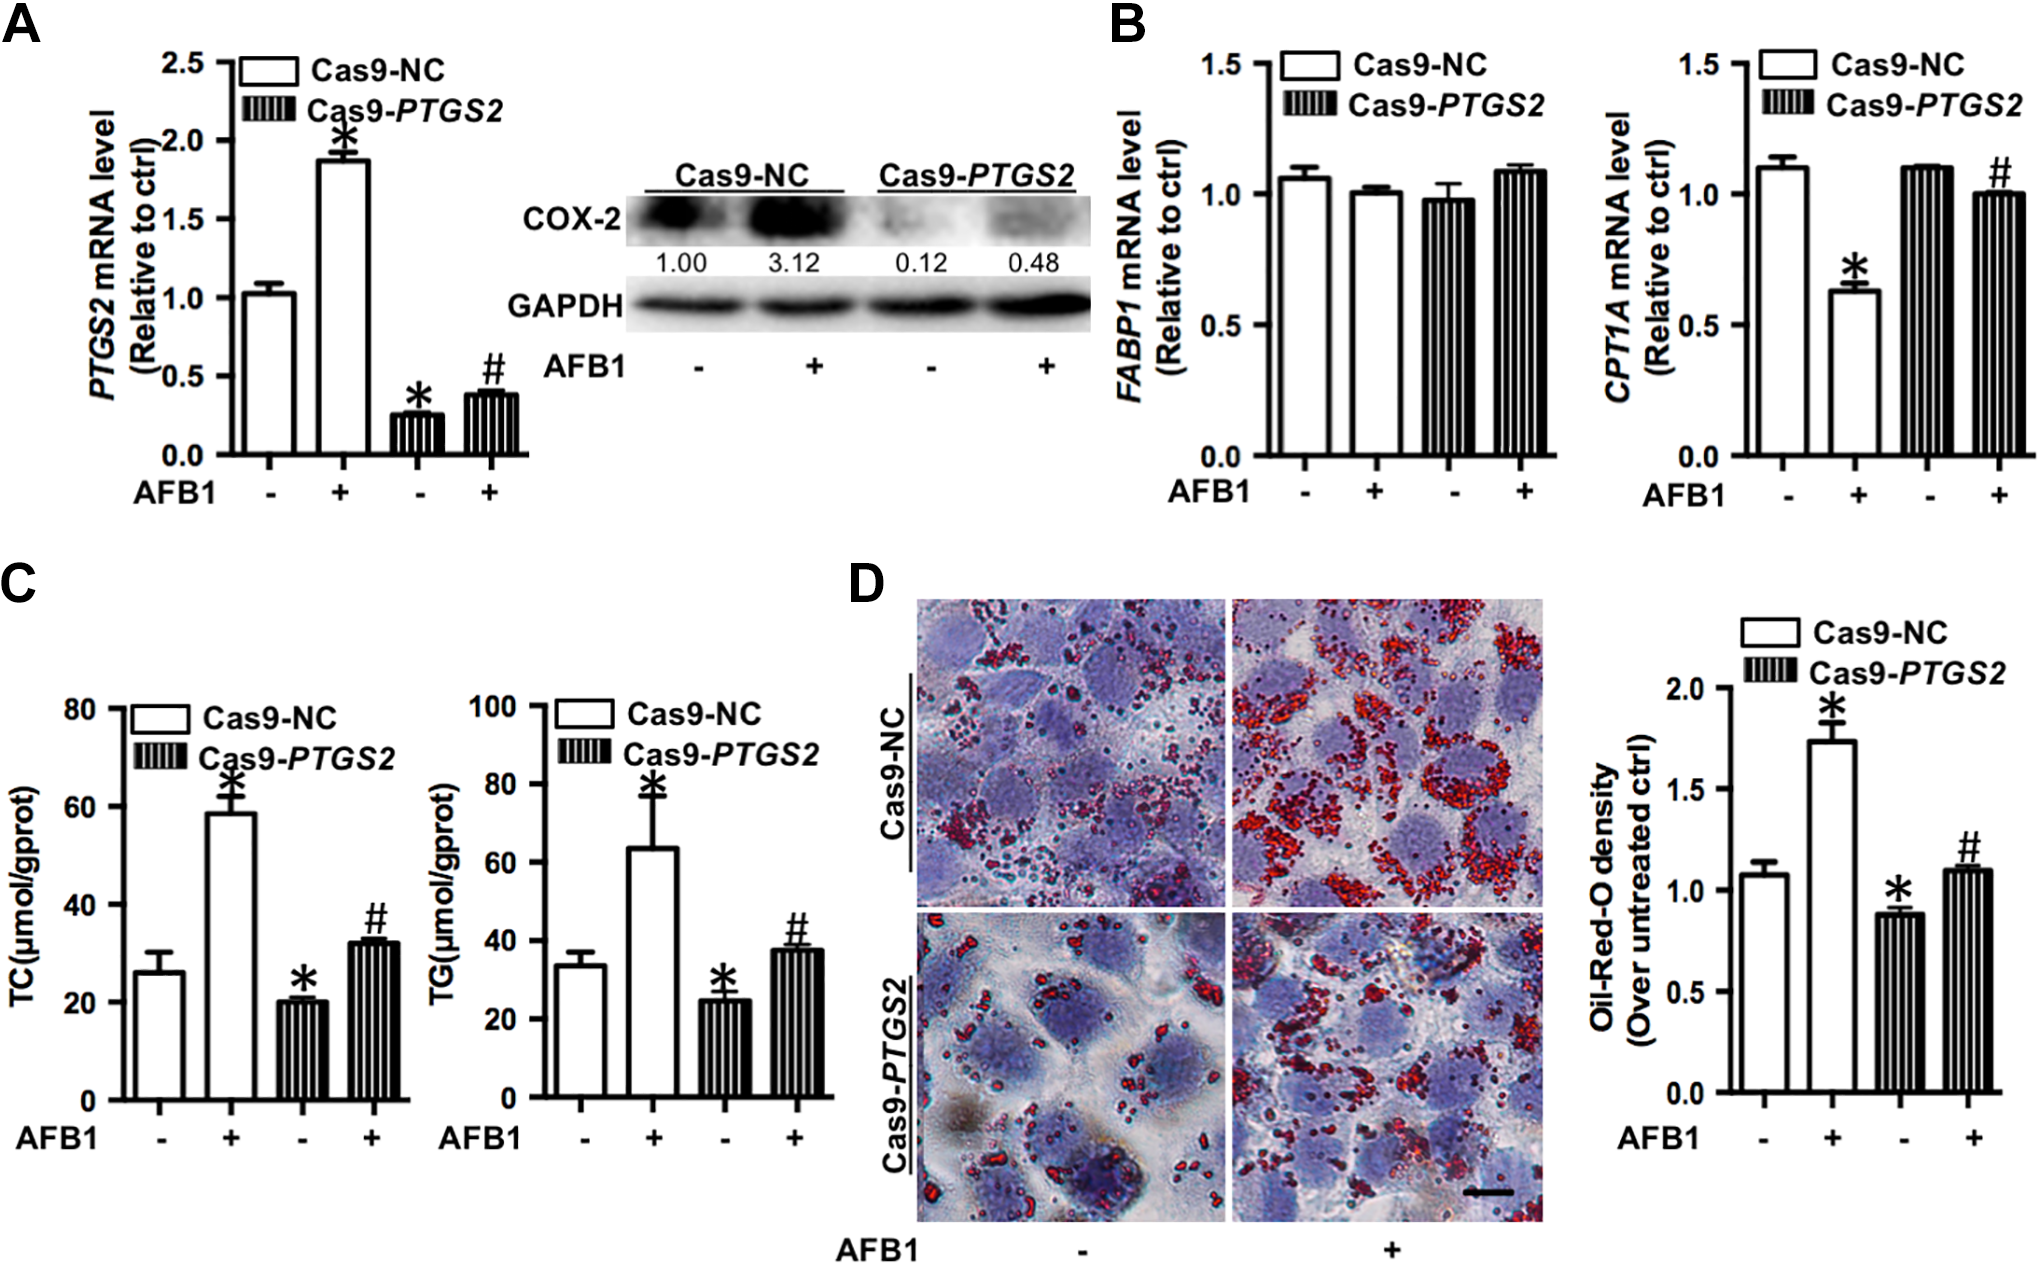
Inhibition of COX-2 expression can attenuate AFB1-induced steatosis. COX-2-knockout HepG2 cells were generated via the CRISPR/Cas9 system. A, Cas9-PTGS2 mRNA and protein levels after AFB1 treatment in Cas9-NC and Cas9-PTGS2 cells for 48 hours. B, FABP1 and CPT1A mRNA levels after AFB1 treatment in Cas9-NC and Cas9-PTGS2 cells for 48 hours. C, Total cholesterol (TC) and TG levels after AFB1 treatment in Cas9-NC and Cas9-PTGS2 cells for 48 hours. D, Representative images and spectrophotometric quantification of LDs in Cas9-NC and Cas9-PTGS2 cells with AFB1 treatment for 48 hours. AFB1 indicates aflatoxin B1; COX-2, cyclooxygenase-2; LD, liquid droplet; mRNA, messenger RNA; TG, total triglyceride.
Aflatoxin B1 Induces Liver Mitophagy both In Vivo and In Vitro
Since mitochondrial dysfunction is a vital inducer of hepatic steatosis, and dysregulation of mitophagy 22 is a major cause of mitochondrial dysfunction, we detected the level of mitophagy in AFB1-exposed mice liver and AFB1-treated HepG2 cells. The major characteristics of mitophagy are increased expression of PINK1 and Parkin, the formation of autophagosomes, and induction of autophagy marker protein LC3. To explore whether AFB1 induces liver mitophagy, we examined the level of PINK1, Parkin, and LC3B expression in mice liver and HepG2 cells after AFB1 treatment. As shown in Figure 4A, the expression of PINK1, Parkin, and LC3B increased in AFB1-exposed mice and HepG2 cells in a dose-dependent manner as compared to the respective control. Also, IHC confirmed that LC3B was significantly induced in liver tissues by AFB1 exposure (Figure 4B). MitoTracker staining showed that the mitochondria fragmented into short rods or spheres and gathered around the nucleus, whereas LC3B accumulated in the mitochondria in AFB1-treated HepG2 cells (Figure 4C). Moreover, when HepG2 cells were transfected with PINK1 small interfering RNA, followed by AFB1 exposure, the levels of TC and TG (Figure 4D) and the density of LDs (Figure 4E) significantly decreased as compared to siNC. These results confirmed that AFB1 induces liver mitophagy, both in vivo and in vitro, thereby serving as a regulator of steatosis.
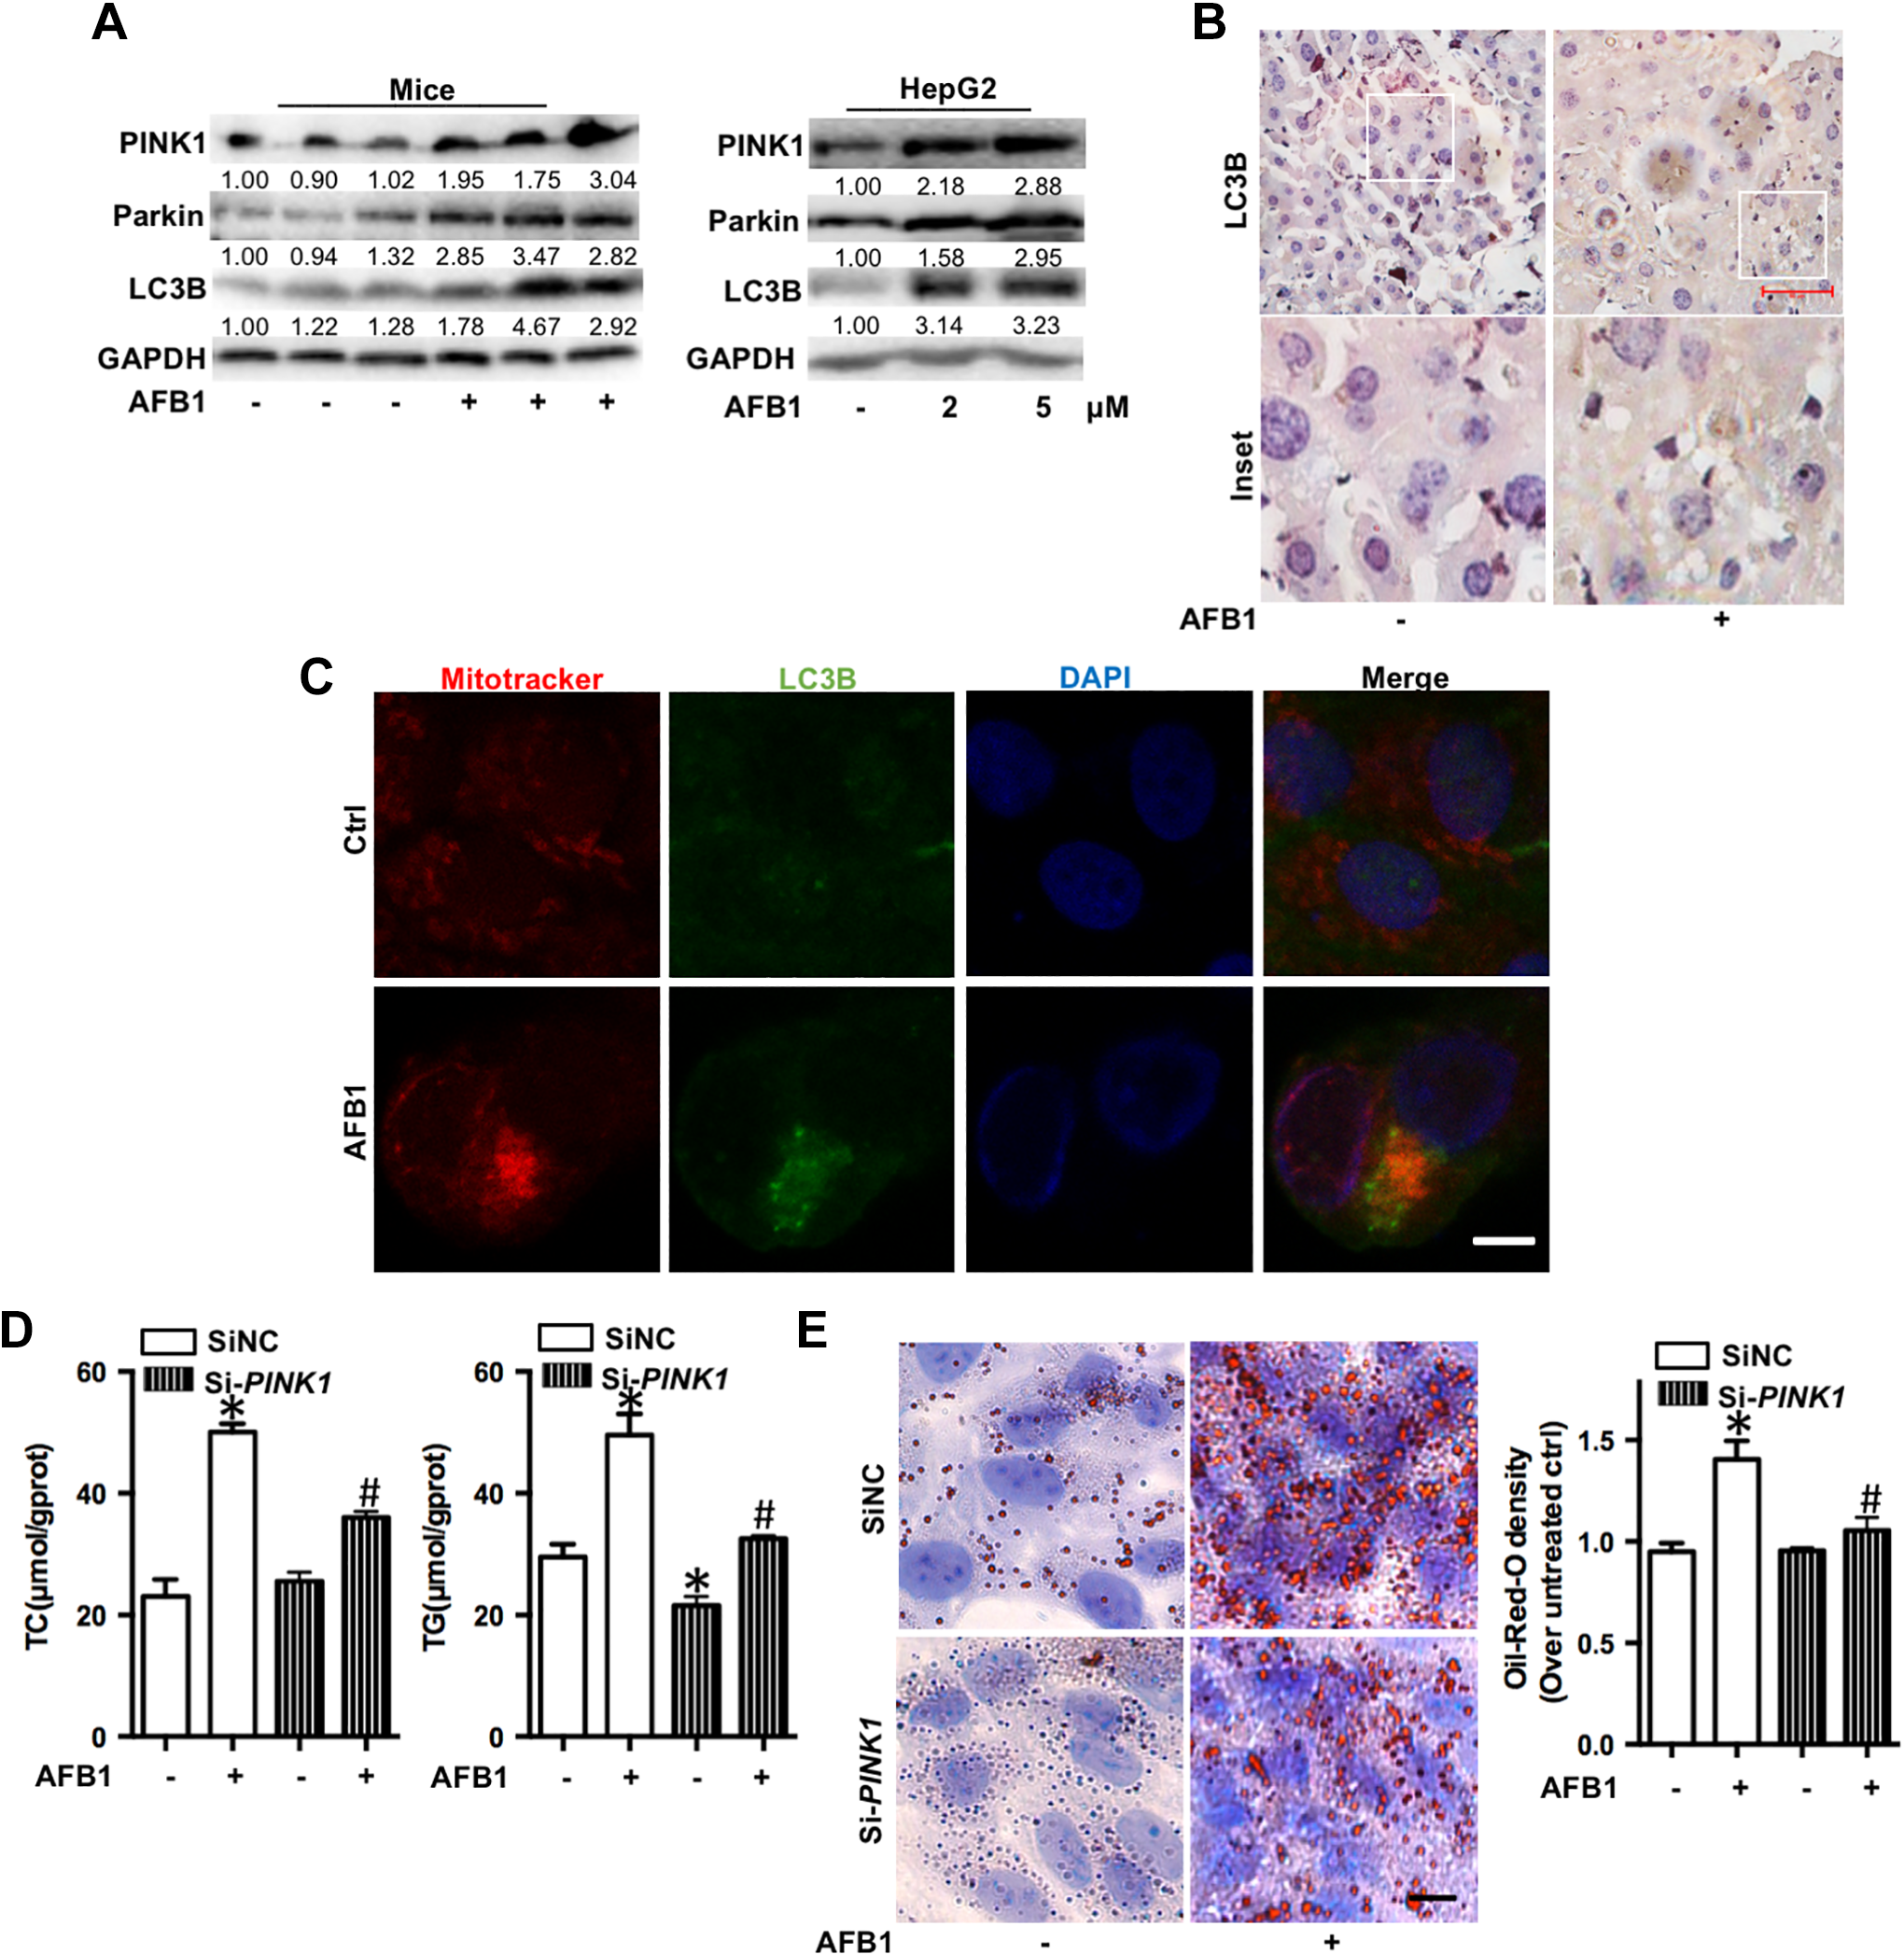
Aflatoxin B1 (AFB1) induces liver mitophagy both in vivo and in vitro. A, Mitophagy-related protein (PINK1, Parkin, and LC3B) levels after AFB1 treatment in HepG2 cells for 48 hours and livers for 30 days. B, Immunohistochemistry (IHC) analysis for LC3B in the liver tissues of AFB1-exposed mice for 30 days (magnification, ×400). Scale bar is 10 μm. C, Representative images of the immunofluorescence costaining for LC3B (green) and MitoTracker (red) in HepG2 cells after AFB1 was treated for 48 hours. Nucleus was stained with DAPI (blue). Scale bar represents 10 μm. D, Total cholesterol (TC) and TG levels after AFB1 treatment in si-NC and si-PINK1 HepG2 cells for 48 hours. E, Representative images and spectrophotometric quantification of LDs in si-NC and si-PINK1 HepG2 cells after AFB1 treatment for 48 hours. * P < 0.05 as compared to control, # P < 0.05 as compared to single AFB1 treatment group. AFB1 indicates aflatoxin B1; COX-2, cyclooxygenase-2; DAPI, 4′,6-diamidino-2-phenylindole; LD, liquid droplet; TG, total triglyceride.
Aflatoxin B1-Induced Mitophagy Can Be Reversed by Inhibition of COX-2
To explore the role of COX-2 in AFB1-induced hepatocyte mitophagy, we detected the expression level of PINK1, Parkin, and LC3B in Cas9-NC and Cas9-PTGS2 cells post-AFB1 treatment. The expression of these molecules was decreased in Cas9-PTGS2 cells as compared to Cas9-NC cells (Figure 5A). Subsequently, immunofluorescence analysis confirmed that LC3B decreased markedly and mitochondria morphology returned to normal in Cas9-PTGS2 cells as compared to Cas9-NC cells (Figure 5B). In addition, AFB1 exposure induced steatosis in vivo and in vitro. In HepG2 cells, AFB1 increased the expression of COX-2, which in turn, elevated the level of mitophagy that disrupted the normal mitochondrial lipid metabolism function and caused steatosis (Figure 5C).
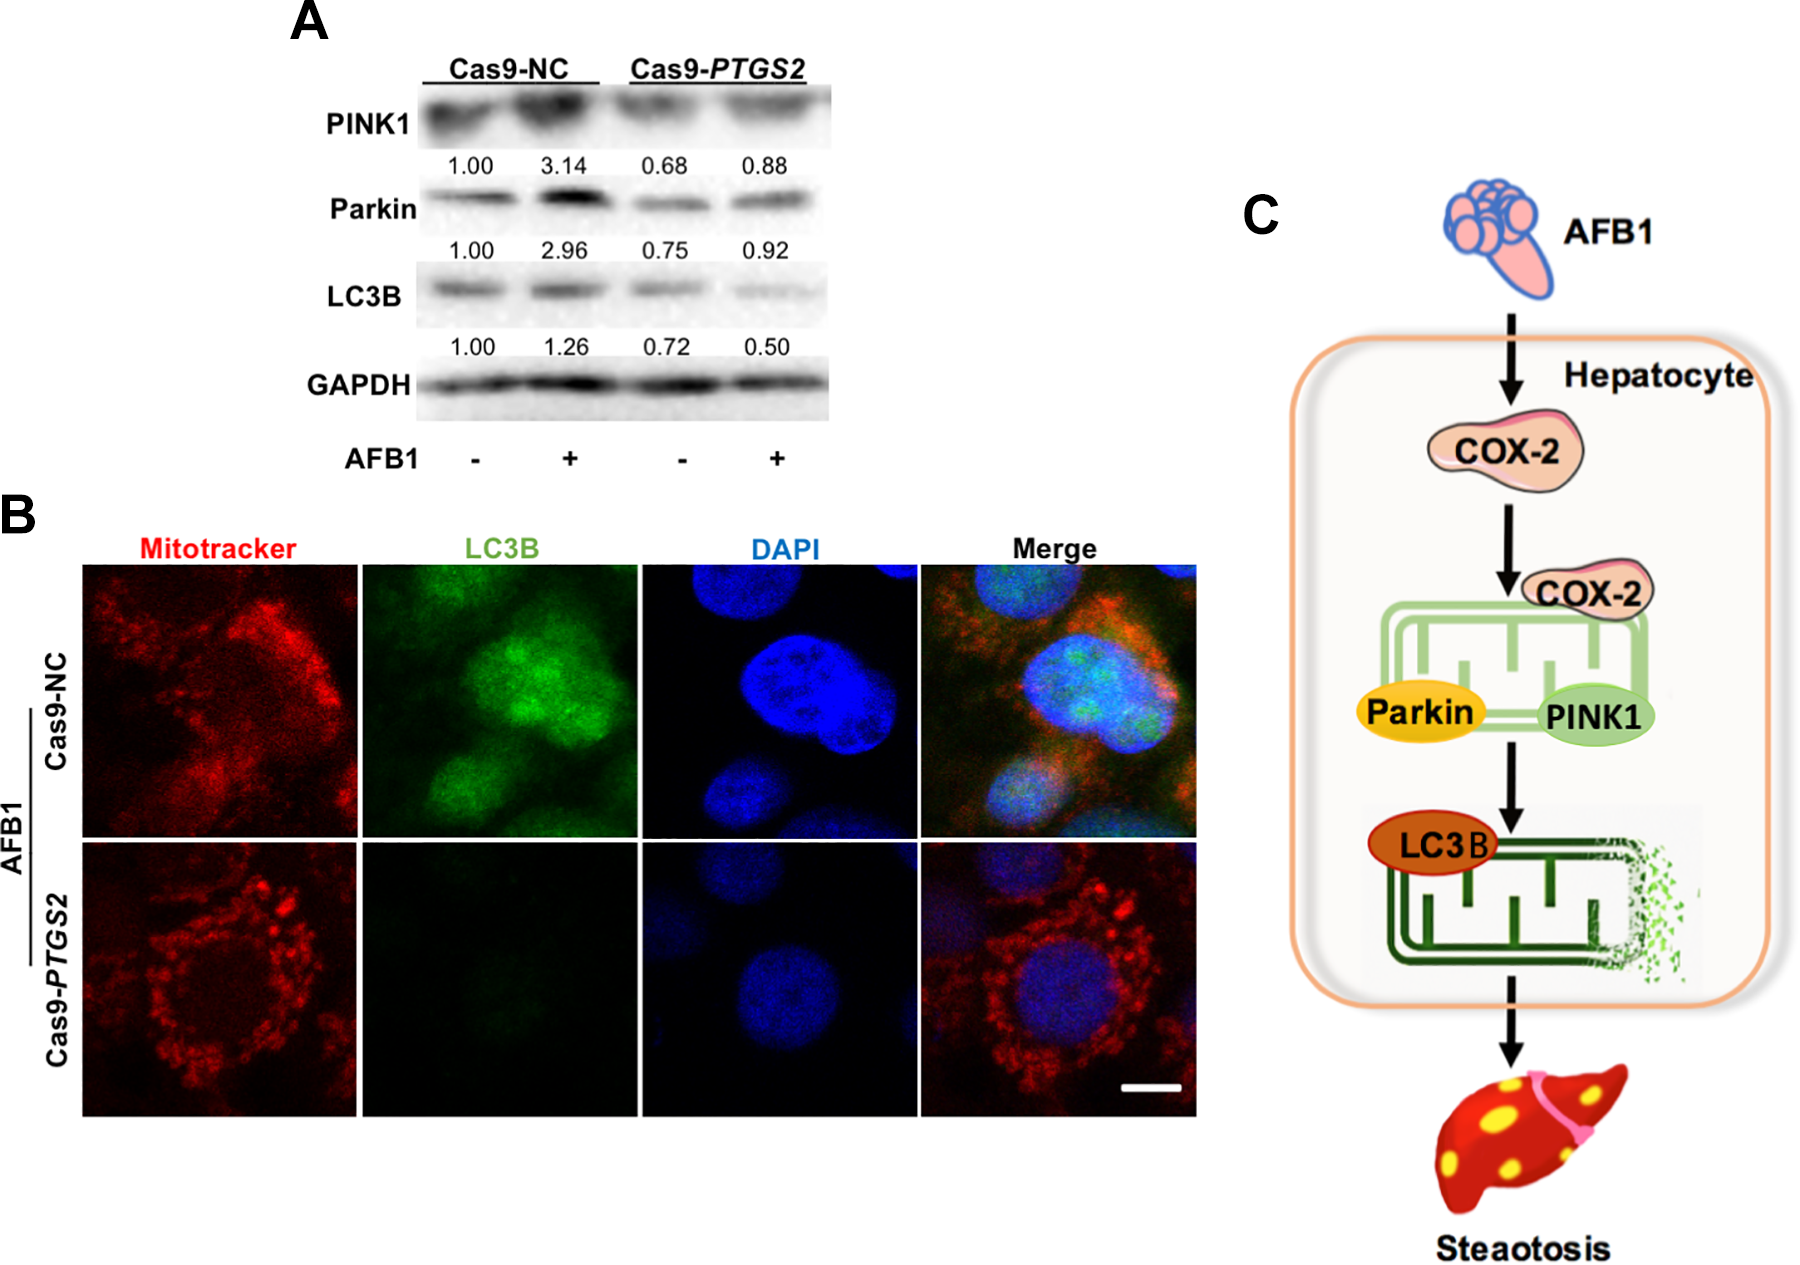
Aflatoxin B1 (AFB1)-induced mitophagy can be reversed by inhibition of COX-2. A, Mitophagy-related protein (PINK1, Parkin, and LC3B) expression of Cas9-PTGS2 cells after AFB1 treatment for 48 hours. B, Representative images of the immunofluorescence costaining for LC3B (green) and MitoTracker (red) in Cas9-PTGS2 cells after AFB1 treatment for 48 hours. Nucleus was stained with DAPI (blue). Scale bar represents 10 μm.* P < 0.05 as compared to control, # P < 0.05 as compared to single AFB1 treated group. C, Schematic of the signaling pathways involved in AFB1-induced liver steatosis. AFB1 indicates aflatoxin B1; COX-2, cyclooxygenase-2; DAPI, 4′,6-diamidino-2-phenylindole.
Discussion
The current study provided evidence that AFB1 causes liver injury and steatosis with increased ALT, AST, TC, and TG levels in vivo and in vitro and LDs in HepG2 cells. We also observed that COX-2 and mitophagy pathway are induced by AFB1 in both liver tissues and cultured HepG2 cells. Further studies showed that the knockout of COX-2 with the CRISPR/Cas9 system inhibited the AFB1-induced mitophagy and steatosis in HepG2 cells. In addition, inhibition of PINK1 with RNA interference attenuated AFB1-induced steatosis.
Aflatoxin B1 occurs worldwide and is hazardous, especially in the southeastern part of China and Africa; the food, dairy products, and poultry may be highly contaminated by AFB1. Chronic micro or acute high dose intake of AFB1 leads to different degrees of the liver damage, causing health hazards. 23 The epidemiological survey revealed that when the human body ingests AFB1 acutely, it induces acute hepatitis, hepatocyte steatosis, 2 liver necrosis, and bile duct hyperplasia. Chronic AFB1 poisoning includes liver, kidney, and cardiovascular system damage, of which liver damage is the most significant, involving inflammation, fatty changes, fibrosis, sclerosis, and liver cancer. 22,24 Aflatoxin B1 also causes liver damage in animals. After 21 days of oral administration of AFB1 (0.1 mg/kg·bw), the liver of the ducklings exhibited steatosis and necrosis, lymphocyte infiltration, damaged mitochondrial DNA, and swollen mitochondria. 25 Mice treated with AFB1 (0.5 mg/kg·bw) per week demonstrated increased hepatic oval stem cell number within 1 to 3 weeks, followed by lipid deposition and increased hepatic macrophages, cholangiocarcinoma, and small nodules. 26 In the present study, we also found that after 0.6 mg/kg exposure once in 2 days for 30 days or 0.5 μM treatment for 48 hours, AFB1 causes increased ALT and AST level and steatosis in vivo and in vitro.
The occurrence of several liver diseases is accompanied by an increase in the expression of COX-2 protein, which is induced by external environmental stimuli such as common environmental pollutants and physical factors. 27,28 Cyclooxygenase-2 causes apoptosis in liver cells. For example, Gao et al 29 showed that hepatitis B virus infection increases the expression of liver fibrosis factors, such as α-smooth muscle actin and collagen-1, by inducing the expression of COX-2 in C57/BL6 mice, leading to hepatocyte apoptosis and liver fibrosis. Moreover, after treatment with 50 mg/kg thioacetamide for 4 weeks, the expression of COX-2 increased, which promoted the elevation of serum ALT and AST levels and albumin concentration, accompanied by superoxide dismutase depletion and accumulation of lipid peroxides, finally resulting in apoptosis. 30 Cyclooxygenase-2 causes autophagy in liver cells. Li et al 31 treated HL-7702 cells with benzo[a]pyrene; consequently, Beclin-1 and LC3B were found to be overexpressed by elevated COX-2 expression in cells. Rats were intragastrically administered with 150 and 300 mg/L cobalt chloride for 7 days; as a result, the levels of antioxidant enzymes decreased significantly and that of the oxidative stress markers increased significantly. However, the regulatory mechanism included COX-2-promoted downstream mitochondrial autophagy and increased BAX expression, leading to liver damage. 30 The present study demonstrated that COX-2 causes lipid accumulation in hepatocytes. We also found that in AFB1-treated hepatocytes, the expression of COX-2 was increased in the cells and lipid accumulated in the hepatocytes. Further knockout of COX-2 by the CRISPR/Cas9 system reduced the lipid accumulation in hepatocytes, suggesting that COX-2 has a regulatory effect on AFB1-induced-lipid accumulation. Recent studies showed that the intervention of COX-2 expression is concentrated in selective inhibitors, such as celecoxib, resveratrol, and nonsteroidal anti-inflammatory drugs (NSAIDs). However, celecoxib and NSAIDs may cause side effects in the liver function. 32 In addition to inhibiting COX-2, resveratrol can act against oxidative damage and inhibit tumor proliferation. 17 In the Cas9-PTGS2 cell line, we could specifically target the PTGS2 gene, thereby providing a novel strategy to investigate the COX-2 regulatory mechanism.
Mitochondria is a highly dynamic and versatile double-membrane organelle in cells. 33 In addition to its key role in producing energy, mitochondria are involved in regulating intracellular protein homeostasis and maintaining cell viability and survival, encompassing lipid metabolism, reactive oxygen species production, Ca2+ activity, and cell death signals. Normal mitochondrial function is critical to maintaining the body’s need for energy metabolism. 34 Consecutively, the dynamic regulation of the normal mitochondria ensures that cells respond effectively to complex and variable intracellular environments. Therefore, mitochondrial dysfunction is closely related to a variety of diseases. In addition, the occurrence of mitophagy is critical to maintaining a normal mitochondrial pool. 35 The mitochondrial fission removes damaged mitochondria, while the intact fuse with the healthy mitochondria for optimal functions. However, the correlation between mitophagy and lipid accumulation is yet inconclusive. Naon et al 36 showed that the expression of mitochondrial fusion 2 protein is beneficial to β-oxidation of the organelle, accelerating fatty acid metabolism, and slowing the lipid accumulation. Yu et al showed that liraglutide ameliorates the nonalcoholic steatohepatitis through mitophagy. 37 The current study found that AFB1 exposure did not cause an increase in FABP1 synthesis but a decrease in CPT1A mRNA levels in the mitochondrial outer membrane of hepatocytes, resulting in TC and TG accumulation. Chen et al 22 found that AFB1 caused mitochondrial dynamic disorder via COX-2 in hepatocytes. However, as one of the most important mechanism of mitochondrial regulation, there is still no research about how mitophagy works in AFB1-treated hepatocytes. In this study, we tested PINK1, Parkin, and LC3B expression level in AFB1-treated mice’s liver and HepG2 cells. The results showed that AFB1 causes mitophagy and steatosis, and PINK1 may be an important regulator in AFB1-induced steatosis. Further, we verified the regulation of COX-2 on mitophagy after AFB1 treated. Gao et al found that Bnip3 can lead to mitochondrial dysfunction and unbalance of mitophagy in hepatocytes, promoting the development of nonalcoholic fatty liver disease. 38 Lower fatty acid synthase activity in PINK1 mutants decreases palmitate levels and increases the levels of cardiolipin, a mitochondrial inner membrane-specific lipid. 39 Kim et al reported that Parkin knockout mice were protected from 6-week HFD-induced obesity, hepatic steatosis, and insulin resistance. 16 Further mechanical studies implied that Parkin conferred these effects via ubiquitin-mediated stabilization of the lipid transporter CD36 in liver. Also, in an acute HFD feeding model, impaired intestinal lipid absorption was found in Parkin knockout mice as evidenced by increased fecal lipids and reduced plasma triglycerides after intragastric fat challenge. 40 Herein, we inferred that mitophagy is a double-edged sword: the moderate amount of mitophagy can improve the quality of mitochondria and accelerate the metabolism of fatty acids in hepatocytes; excessive mitophagy will fragment the mitochondria and reduce the fatty acid metabolism, leading to lipid accumulation in hepatocytes.
In summary, after knocking out of PTGS2, lipid accumulation and mitophagy caused by AFB1 exposure were inhibited. The current study provides a novel insight that AFB1 increases the expression of COX-2, which, in turn, elevates the level of mitophagy. Consequently, the normal mitochondrial lipid metabolism function is damaged, causing steatosis. This study implied that COX-2 might be a potential target for therapy against AFB1-induced steatosis.
Footnotes
Authors’ Note
The data supporting the findings in the article are available from the corresponding author upon reasonable request. Any experiments involving animals were conformed to relevant national or institutional guidelines for animal usage in research and this study was approved by the Ethics Research Committee of SDU (No. 19012).
Acknowledgments
The authors appreciate the help of the Pathology Department of Qilu Hospital for this study.
Author Contributions
Xin-Lu Ren contributed to acquisition, analysis, or interpretation of data, drafted manuscript, and critically revised manuscript; Peiyu Han contributed to acquisition, analysis, or interpretation of data and critically revised manuscript; Yiteng Meng substantially contributed to conception or design and critically revised manuscript. All authors gave final approval and agree to be accountable for all aspects of work ensuring integrity and accuracy.
Declaration of Conflicting Interests
The author(s) declared no potential conflicts of interest with respect to the research, authorship, and/or publication of this article.
Funding
The author(s) received no financial support for the research, authorship, and/or publication of this article.