
Abstract
Di(2-picolyl) amine (DPA) is a pyridine derivative known to chelate metal ions and thus has potential anticancer properties; however, its effect on normal cells remains unchartered necessitating further research. This study, therefore, investigated the mechanistic effects of DPA-induced cytotoxicity and apoptosis in the HEK293 cell line. Methods required that an half the maximum inhibition concentration (IC50) was derived using the 3-(4,5-dimethyl-2-thiazolyl)-2,5-diphenyl-2H-tetrazolium bromide (MTT) assay. Analyses aimed to assess oxidative stress, membrane damage, and DNA fragmentation by means of biochemical assays were performed. Luminometry analysis was carried out to understand the mechanism of apoptosis induction by determining the levels of adenosine triphosphate (ATP) and the activities of caspase-8, -9, and -3/7. Western blotting was used to ascertain the expression of apoptotic and stress-related proteins. An IC50 of 1,079 µM DPA was obtained. Antioxidant effect correlated with a minimum increase in reactive oxygen species induced lipid peroxidation. The increase in initiator caspase-8 and -9 and executioner caspase-3/7 activities by DPA-induced apoptosis albeit prompting a decline in the levels of ATP. Furthermore, DPA brought about the following consequences on HEK293 cells: markedly elevated tail lengths of the comets, poly (ADP-ribose) polymerase 1 cleavage, and apoptotic body formation observed in the late stages. The cytotoxic effects of DPA in HEK293 cells may be mediated by induction of apoptosis via the caspase-dependent mechanism.
Introduction
Di(2-picolyl) amine (DPA; Figure 1) is a secondary amine that has 2 picolyl substituents. 1 It is a derivative of pyridine, a heterocyclic organic compound that is abundant in nature with various biological activities. It functions in living organisms’ enzymes as a prosthetic group (NADP) with an involvement in redox reactions. Pyridines possess potential anticancer properties as demonstrated in experiments where pyridine epothilones that exhibited cytotoxic effects against various human cancer cell lines. 2 Thus, as a pyridine derivative, DPA warrants consideration of its potential anticancer properties.
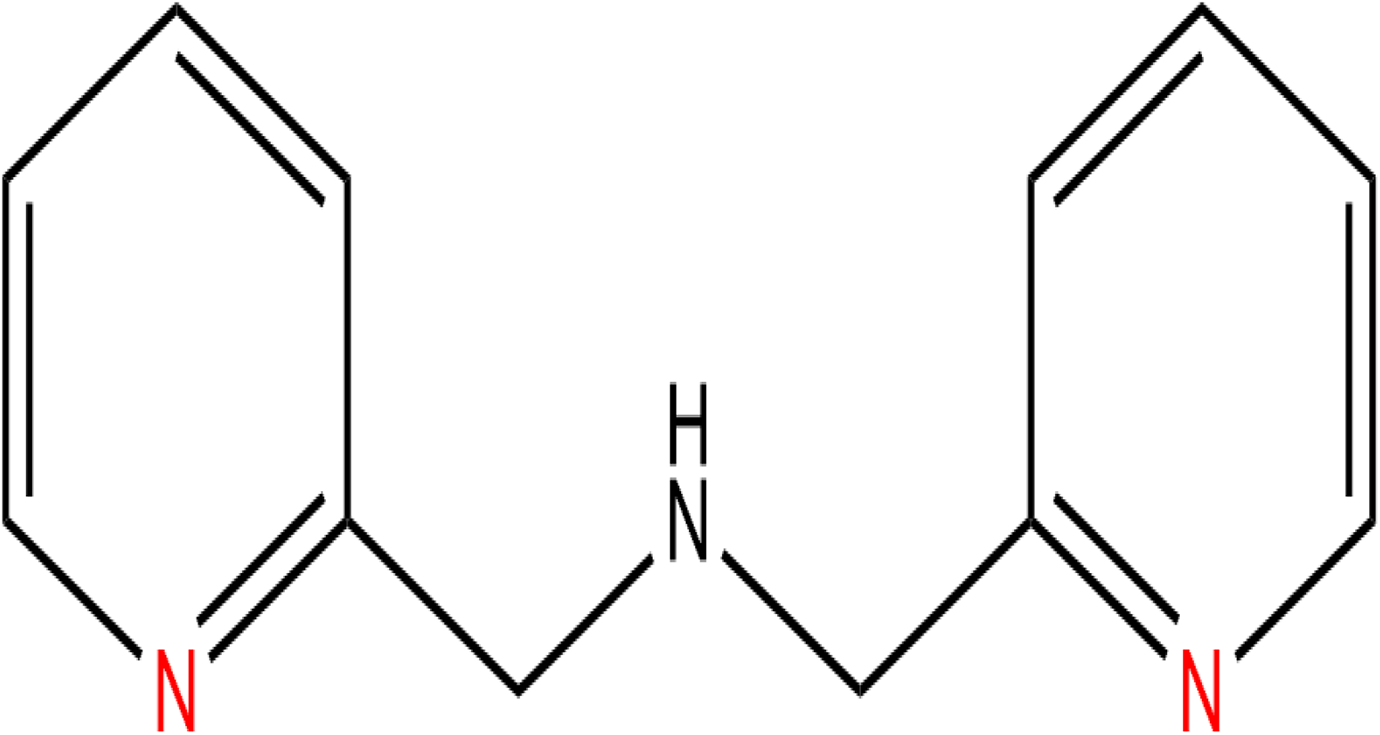
Structure of Di-(2-picolyl)-amine (DPA).
Franklin and Costello showed that metal ions such as zinc (Zn) are crucial in normal and malignant cells’ growth and advancement. 3 Di(2-picolyl) amine is a known metal chelator and in an attempt to establish whether novel polypyridyl chelators deplete cellular Zn, Zuo et al in 2012 noted DPA’s ability to attach to metal ions (eg, Zn, Cu, etc) and result in the formation of secure metal complexes. However, it was observed that DPA was not a strong chelator at low doses. 4 Some of the enzymes involved in detoxification and repair in the human body are metalloenzymes, including superoxide dismutase (SOD), poly (ADP-ribose) polymerase (PARP), and p53, and these could be adversely affected by compounds that chelate metal ions. Superoxide dismutase requires a metal cofactor (eg, iron, Zn, copper, and manganese) for its activity. 5 Additionally, another study using atomic absorption spectroscopy indicated that PARP is a Zn metalloenzyme. 6 However, Zuo et al noted that at low doses DPA did not trigger PARP cleavage in human prostate and breast cancer cells. Since PARP cleavage is associated with apoptosis, the potential of DPA to destabilize the X-linked inhibitor of apoptosis protein (XIAP) prior to induction of apoptosis was also investigated. It was found that XIAP were not reduced and thus no apoptosis induction took place. 4 Moreover, the in vitro chelation of Zn negates p53 DNA-binding activity and stimulates cysteines’ oxidation, thus implying that p53 conformation is influenced by the metalloregulation of Zns. 7
Nitric oxide synthase (NOS), as a metalloenzyme, is included in the enzyme families that require Zn.
8
It is involved in catalyzing NO and
Materials and Methods
Materials
HEK293 cells were purchased from Highveld Biologicals (Johannesburg, South Africa). Cell culture reagents and low-melting-point agarose (LMPA) were purchased from Whitehead Scientific (Cape Town, South Africa). Phosphate-buffered saline (PBS), 3-(4,5-dimethyl-2-thiazolyl)-2,5-diphenyl-2H-tetrazolium bromide (MTT), DPA, thiobarbituric acid (TBA) reactive substances (TBARS), and nitrates assay reagents were procured from Sigma Aldrich (St Louis, Missouri). Western blot reagents were obtained from Bio-Rad Laboratories, Inc. (Hercules, California). All antibodies were obtained from Cell Signalling Technology, Inc. (Danvers, Massachusetts). All other reagents were obtained from Merck (Darmstadt, Germany) unless otherwise stated.
Di(2-Picolyl) Amine Preparation
A stock solution of DPA was prepared by mixing 2 µL of DPA with 9,998 µL of complete culture medium (CCM). Stock solutions were prepared fresh before each treatment, and serial dilutions (0-1,000 µM for the MTT assay) or IC25/half the maximum inhibition (IC50) concentrations were prepared by diluting the stock solution.
Cell Culture
The HEK293 cells were reconstituted in CCM comprising Eagle’s minimum essential medium supplemented with 10% fetal calf serum, 1%
MTT Assay
The cytotoxicity of DPA on HEK293 cells was determined using the colorimetric MTT assay. HEK293 cells were seeded into a 96-well microtiter plate at an inoculation density of 15,000 cells/well (200 µL of CCM) in triplicate and allowed to adhere overnight. The inoculation medium was discarded, and the cells were treated with DPA (0-1,000 µM) for 24 hours. Thereafter, the treatment medium was discarded and replaced with 20 µL MTT salt solution (5 mg/mL in 0.1 M PBS) and 100 µL CCM. Following a 4-hour incubation, the salt solution was removed from each well, and 100 µL dimethyl sulphoxide (DMSO) was subsequently added to each well. The plate was then incubated at 37°C for 1 hour for the solubilization of the formazan crystals. Once the incubation period had elapsed, the optical density (OD) was measured using BioTek µQuant plate reader (Bio-Tek Instruments Inc, Vermont, USA) at 570/690 nm. The OD readings were used to calculate the percentage cell viability as follows:

Subsequently, a concentration–response curve was plotted using GraphPad Prism version 5.0 software (GraphPad Software Inc, La Jolla, California) relative to the control. The concentration of DPA that produced IC50 was calculated via linear extrapolation. Two independent experiments were conducted to verify the IC50. For subsequent assays, HEK293 cells were treated with DPA at a concentration equal to its IC50 (as well IC25). The IC25 value was calculated by dividing the IC50 by 2.
Adenosine Triphosphate Quantification Assay
The CellTitre-Glo assay (Promega, Madison, Wisconsin) was performed to measure adenosine triphosphate (ATP) concentration. Treated cells were resuspended in PBS and aliquoted in triplicate into a white 96-well luminometer plate (20,000 cells/well in 50 µL PBS). Subsequently, 50 µL of the reconstituted reagent was added into each well. The plate was incubated in the dark for 30 minutes at room temperature (RT). After the incubation period had elapsed, the Modulus microplate luminometer (Turner Biosystems, Sunnyvale, California) was utilized to detect luminescence as relative light units (RLU). Luminescence is proportional to the intracellular ATP level.
Assessment of Caspase Activity
Caspase-Glo assays (Promega) were used to detect caspase-3/7, 8, and 9’s activities by preparing 60,000 cells in 150 µL PBS for each flask of treated cells. This cell suspension was then added into a white, 96-well luminometer plate in triplicate (20,000 cells/well in 50 µL of PBS). Caspase-Glo-3/7, -8, and -9 reagents were reconstituted per manufacturer’s guidelines, 50 µL was added into each well, and the plate was incubated in the dark for 30 minutes at RT. The Modulus microplate luminometer was used to detect luminescence RLU.
Comet Assay
The treated cells were encapsulated in LMPA on slides with frosted ends. The first layer was formed by adding 2% LMPA (800 µL) to each slide, adding a coverslip and allowing solidification at 4°C for 10 minutes. The second layer contained the treated (control, IC25, and IC50) cell suspension (20,000 cells in 25 µL 0.1 M PBS), Gel Red nucleic acid gel stain (1 µL) and 1% LMPA (300 µL, 37°C) which was cover slipped and solidified for 10 minutes at 4°C. Finally, the third layer comprising 1% LMPA (300 µL, 37°C) was added and allowed to set (10 minutes, 4°C). In the subsequent cell membrane lysing step, coverslips were removed to enable solidified gels to be submerged in cold cell lysis buffer (2.5 M NaCl, 100 mM EDTA, 1% Triton X-100, 1% Tris, 10% DMSO, and 10 mM Tris—pH 10)]for 1 hour at 4°C. The slides were subsequently submerged in electrophoresis buffer (1 mM EDTA [pH 13] and 300 mM NaOH) for 20 minutes at RT to allow for equilibration. A Bio-Rad compact power supplier was used to perform electrophoresis on the slides at 25 V and 300 mA for 35 minutes. The slides were subsequently washed 3 times (5 minutes each) in fresh solutions of 0.4 M Tris (pH 7.4) to neutralize the samples before the coverslips were replaced. An Olympus IX51 inverted fluorescent microscope was used to view the slides at the following wavelengths: (1) excitation: 510 to 560 nm and (2) emission 590 nm. Images of 50 cells and comets were captured and the Soft imaging system (Life Science—Olympus Soft Imaging Solutions version 5) was utilized to assess DNA damage by measuring the lengths of the comets and reported in µm as average comet lengths.
Hoechst Assay
Hoechst 33342 (H3570; Invitrogen, Eugene, Oregon) was used to stain DPA-treated HEK293 cells to assess the nuclear morphology. Cells (400,000 cells) were discharged into a 6-well plate and allowed to adhere overnight. The cells were treated in duplicate for 24 hours, then washed 3 times (0.1 M PBS) and fixed in 10% paraformaldehyde (PFA, pH 7.4, 5 minutes) for cell preservation. Excess PFA was removed from the cells by washing them again (0.1 M PBS). Hoechst working solution (5 µg/mL in 0.1 M PBS) was added and incubated (15 minutes, 37°C). The cells were then washed to remove any dye that did not bind to nucleic acids in the sample before viewing. Images were captured using an Olympus IX51 inverted fluorescent microscope (excitation 350 nm and emission 450 nm) and Olympus Soft Imaging Solutions version 5. Ten images per treatment replicate were captured at magnification of 200×.
TBARS Assay
An amount of 200 µL of supernatant per control/treatment was added into appropriately labeled, sterile glass test tubes. A negative control (200 µL CCM) and positive control (1 µL malondialdehyde [MDA] + 199 µL CCM) were also prepared. In order to inactivate any interfering proteins/enzymes, 200 µL of 2% phosphoric acid (H3PO4) and 200 µL of 7% H3PO4 was added to each of the tubes. Subsequently, 400 µL of the TBA/butylated hydroxytoluene solution was added to each sample excluding the blank; the blank received 3 mM HCl (400 µL). Each tube was vortexed briefly before the pH was acidified using 200 µL of 1 M HCl. Optimal hydrolysis of MDA adducts was achieved by boiling the tubes in a water bath for 15 minutes at 100°C. The samples were cooled to RT, with 1500 µL of butanol being added thereafter to each tube in order to ensure the removal of MDA through phase separation. Distinct phase separation was achieved by vortexing the tubes for 30 seconds and allowing them to stand until this occurred. The upper butanol phase (1,000 µL) was transferred to Eppendorf tubes. Each sample was transferred to a 96-well microtiter plate in triplicate (200 µL per well). The absorbance was measured (532 nm, 600 nm) using a Bio-Tek µQuant spectrophotometer. The average of 3 replicates was calculated and divided by the absorption coefficient, 156 mM−1 to determine the average concentration of MDA (µM).
Nitrates Assay
Sodium nitrate standards (0-250 µM) were prepared. Each standard (50 μL) and sample supernatant (50 μL) was pipetted into a 96-well plate in duplicate. The following solutions were added into each well: 50 µL of vanadium (III) chloride, 25 µL of sulfanilamide, and 50 µL of N-1-Naphthyl ethylenediamine dihydrochloride. This mixture was incubated for 30 minutes at 37°C. The absorbance was measured at a wavelength of 540 nm, with a reference wavelength of 690 nm. The means of all standards and samples were calculated, a standard curve using the known concentrations of standards was created, and the equation derived from the XY plot was used to substitute the mean absorbance of each sample to determine the concentration (µM).
Western Blotting
Sample preparation
Total protein was extracted using CytoBuster reagent (catalog no. 710093; Novagen, San Diego, California), supplemented with protease and phosphatase inhibitors (Roche, Germany, 05892791001 and 04906837001, respectively), per manufacturer’s instructions. CytoBuster reagent (300 µL) was added to treated cells in a 25-cm3 flask and left on ice for 15 minutes. The cells were lysed, aspirated, and centrifuged to isolate the crude protein extract (4°C, 5 minutes, 10,000×g). The supernatant was transferred to a clean labeled Eppendorf tube and kept on ice. Protein concentration was determined using the bicinchoninic acid (BCA; Sigma, St Louis, Missouri) assay. Briefly, Bovine serum albumin (BSA) standards (0-1 mg/mL) were prepared and loaded (25 µL) into duplicate wells of a 96-well plate. The samples were also loaded accordingly. The BCA reagent (198 µL BCA, 4 µL CuSO4) was added to each well. The plate was incubated at 37°C for 30 minutes and the Bio-tek µQuant enzyme-linked immunosorbent assay (ELISA) plate reader was used to measure the OD (562 nm). The standard curve generated from the standards OD values was used to determine the concentrations of the crude protein samples. The samples were then standardized to a concentration of 1.5 mg/mL in CytoBuster in order to facilitate a protein expression comparison between treated samples. Laemmli buffer (dH2O, 0.5 M Tris-HCl [pH 6.8], 3% glycerol, 10% sodium dodecyl sulfate [SDS], 12% β-mercaptoethanol, 2% bromophenol blue dye; [1:4]) was added to the standardized protein samples that were then boiled for 5 minutes to denature the proteins.
Sodium dodecyl sulfate polyacrylamide gel electrophoresis
Denatured protein samples were separated via SDS polyacrylamide gel electrophoresis. Initially, 10% resolving gel was prepared (dH2O, 1.5 M Tris, 10% SDS, Bis/acrylamide, 10% ammonium persulphate [APS], tetramethylene diamine [TEMED]) and allowed to polymerize (1 hour). Thereafter, 4% stacking gel was prepared (dH2O, 0.5 M Tris, 10% SDS, Bis/acrylamide, 10% APS, and TEMED) and added on top of the resolving gel (1 hour). Protein samples (25 µL) and a low-molecular-weight marker (5 µL) were loaded into the wells and then subjected to an electric field (150 V, 90 minutes) using a Bio-Rad compact power supply. During electrophoresis 1× running (electrode) buffer (dH2O, Tris, glycine, SDS, 4°C) was used.
Electrotransfer
Following electrophoresis, the gel and nitrocellulose membranes were equilibrated in transfer buffer (dH2O, Tris, glycine, methanol, pH 8.3, 4°C) for 10 minutes. The separated protein bands were electrotransferred from the gel to the nitrocellulose membrane using a Bio-Rad transblot turbo (25 V, 2.5 mA, 30 minutes).
Immunoprobing
The nitrocellulose membranes were blocked in order to prevent nonspecific binding of antibodies. They were submerged in 5% BSA/5% nonfat dry milk in Tris-buffered saline (dH2O, Tris-HCl [pH 7.4], NaCl) containing 0.5% Tween-20 (TTBS) and incubated on shaker for 2 hours at RT and then probed for SOD2 (13141S), glutathione peroxidase (GPx; 3286S), NRF2 (12721S), PARP1 (9542S), BAX (5023S), p53 (48818S), and HSP70 (46477S). Membranes were incubated with the individual primary antibodies (1:1,000 in 5% BSA in TTBS) for 1 hour at RT and at 4°C overnight to allow the antibody to bind to its specific target protein. Thereafter, the membranes in primary antibody were placed on a shaker for 1 hour in order to allow them to reach RT, followed by washing 5 times (10 minutes each time) with 10 mL TTBS to wash off excess antibody that did not bind to target proteins and probing with a horse radish peroxidase (HRP)-labeled secondary antibody (1:2,000 in 5% BSA in TTBS). This was performed as follows: HRP-conjugated anti-rabbit immunoglobulin G (IgG; 7074P2) was added to SOD2, PARP1, GPx1, BAX, and NRF2 or HRP-conjugated anti-mouse IgG (7076S) was added to both p53 and HSP70 membranes for 2 hours at RT on the shaker. After incubation, the membranes were washed 5 times with 10 mL TTBS (10 minutes each time), and a final washing was done with deionized water prior to viewing with chemiluminescence reagent (Clarity; Western). Enhanced chemiluminescence substrate and the molecular Imager (ChemiDoc XRS+ Imaging system) was used to detect the captured reaction, and the resultant protein expression analyzed using Image Lab software version 5. The membranes were stripped for normalization of protein expression using β-actin. Briefly, they were washed and quenched using 5 mL H2O2 (30 minutes, 37°C), then after, subsequently washed again prior to blocking in 5 mL of 5% BSA/TTBS for 2 hours on a shaker. The membranes were then reprobed with the housekeeping protein, HRP-conjugated-anti β-actin (A3854, 1: 5,000; Sigma) for 1 hour at RT. The membranes were washed and viewed as described. Data were expressed as mean relative band density and fold change, relative to the housekeeping protein and control, respectively.
Statistical Analysis
Statistical analysis was carried out using GraphPad Prism version 5.0 software. The concentration-response-inhibition equation produced an IC50 for MTT assay. The statistical significances were determined by an unpaired Students t test with Welch correction (results reported as mean ± standard deviation) and a 95% confidence interval. A P value of < 0.05 was considered significant.
Results
Metabolic Activity and Cell Viability
MTT assay
The MTT assay was utilized to evaluate DPA toxicity in HEK293 cells over 24 hours. Serial dilutions of DPA (0-1,000 µM) were used to determine a dose–response activity, where the cell viability did not differ significantly from the control between 1.398 and 2.602 µM and remained approximately 91% to 107% viable. However, a dose-dependent decrease in the viability of cells occurred subsequent to 2.602 µM DPA until the lowest viability (57%) was obtained at 1,000 µM DPA. The results show that a concentration of 1,079 µM was sufficient to cause 50% of HEK293 cells toxicity (IC50). This DPA concentration was utilized in all successive assays (Figure 2).
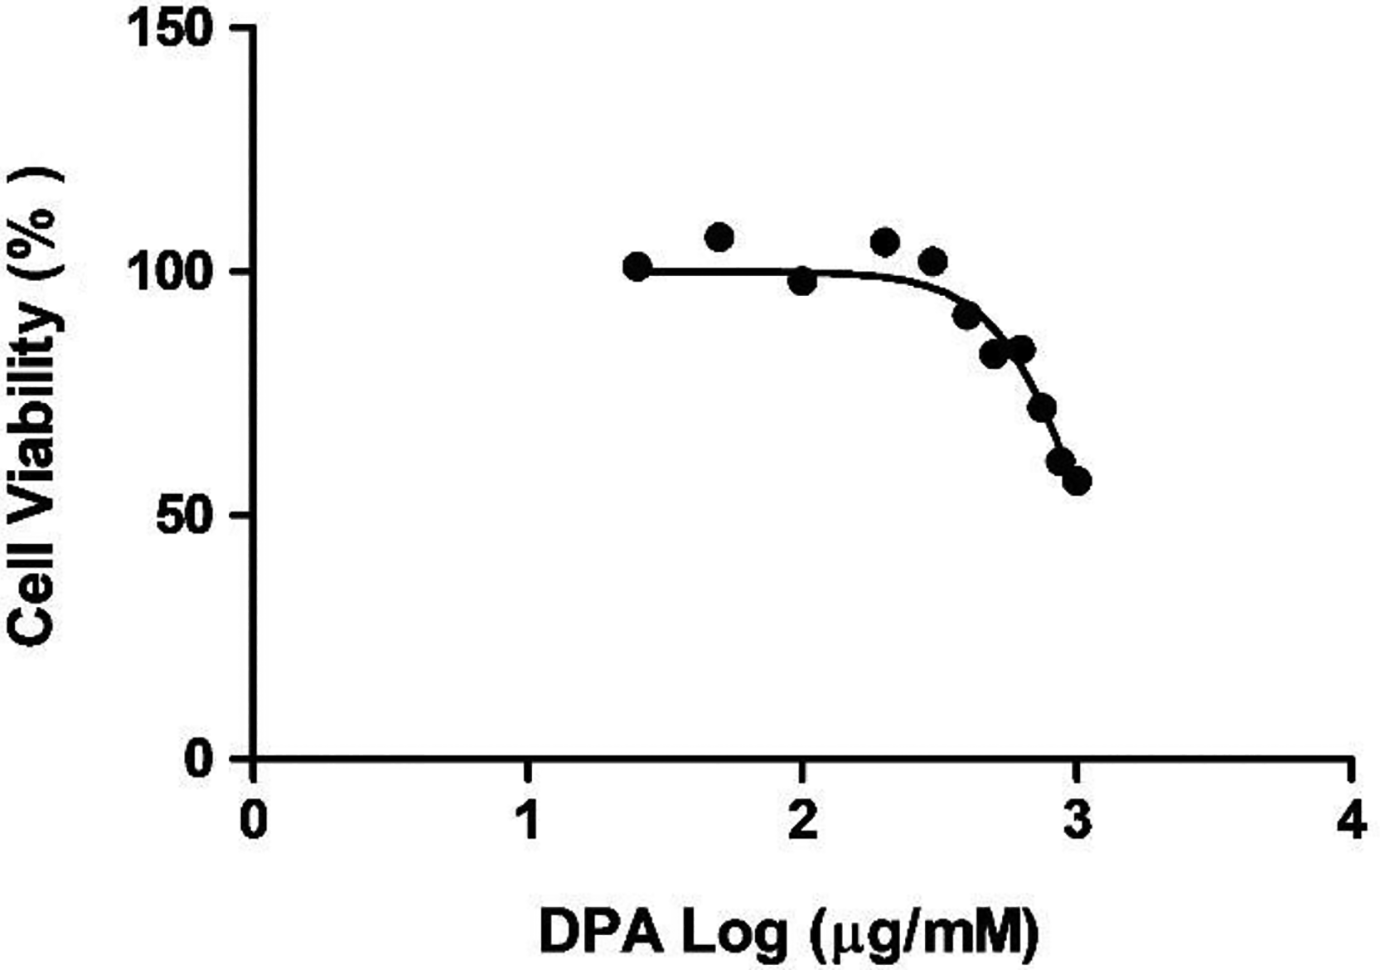
Di(2-picolyl) amine (DPA) induced a “dose-dependent” decrease in HEK293 cell viability after a 24 hours treatment. Data are represented as a percentage of viable cells relative to the untreated cells.
Adenosine triphosphate quantification
The ATP concentration in HEK293 cells was assessed via a luminometric cell viability assay. The control ATP levels were recorded as 9,852,623.25 ± 34,445.59 RLU (Figure 3). Adenosine triphosphate levels in both IC25 (3,342,491 ± 121772.3 RLU) and IC50 (4,035,326 ± 114,134.0) treated cells significantly decreased by more than 50% when compared to the control cells (P < 0.0001; Figure 3). Additionally, there was a statistical significance between the IC25 and IC50 with a P value = 0.0098 in the ATP levels.
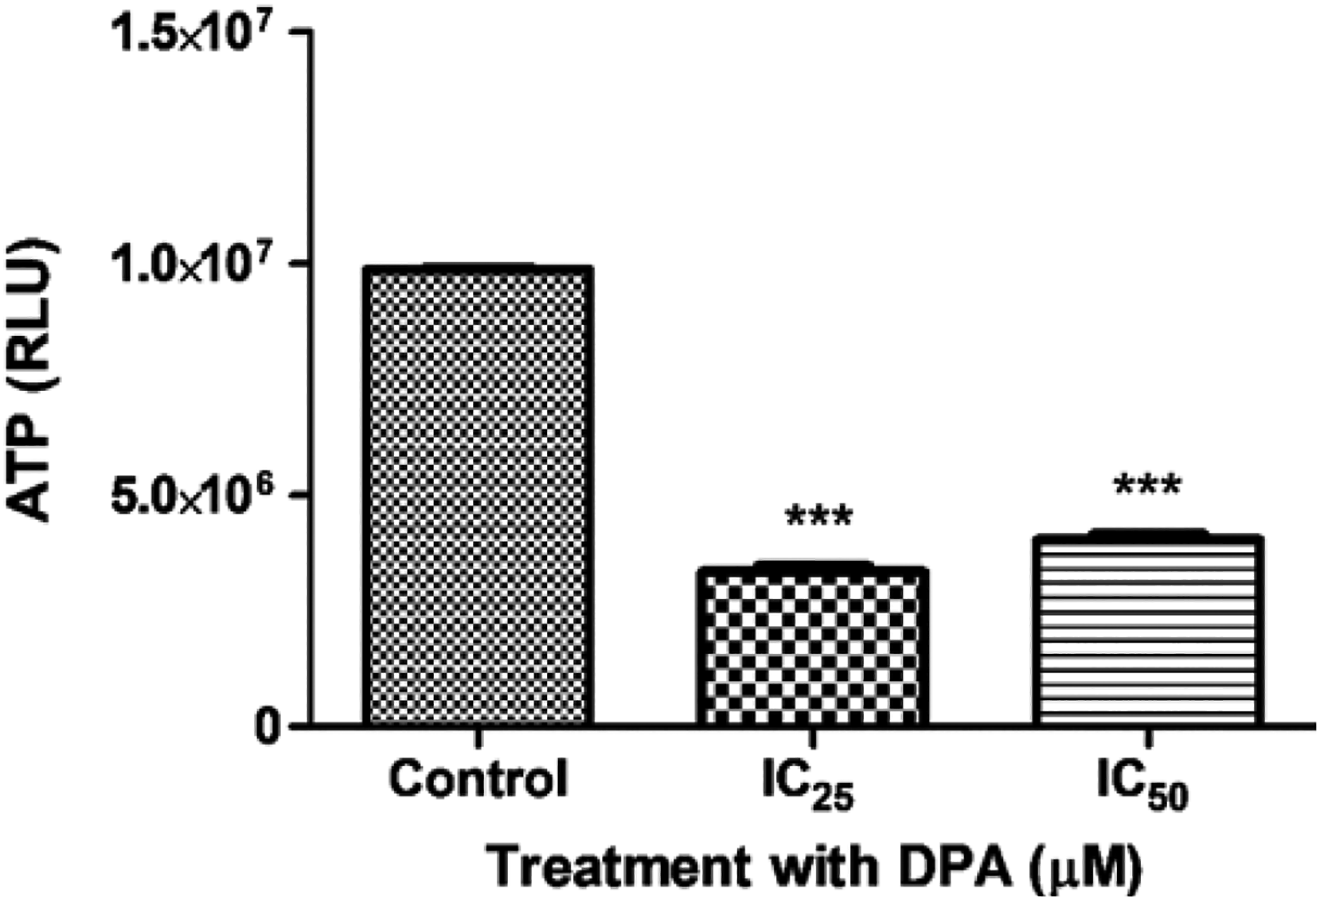
Adenosine triphosphate (ATP) levels in the control and Di-(2-picolyl)-amine (DPA)-treated HEK293 cells. DPA significantly decreased ATP levels after 24 hours in both concentrations (IC25 and IC50) ***P < 0.0001 compared to the control.
Oxidative Stress
Lipid peroxidation
Lipid peroxidation induced by reactive oxygen species (ROS) was assessed through the quantification of extracellular MDA (namely, lipid peroxidation end product) as an indicator of oxidative stress. The extracellular MDA concentration in IC25-treated cells was slightly increased relative to the control (0.021 ± 0.0042; Figure 4). However, a 0.64-fold change increase occurred when cells were treated with the IC50 concentration of DPA, but this was not significant (Figure 4).
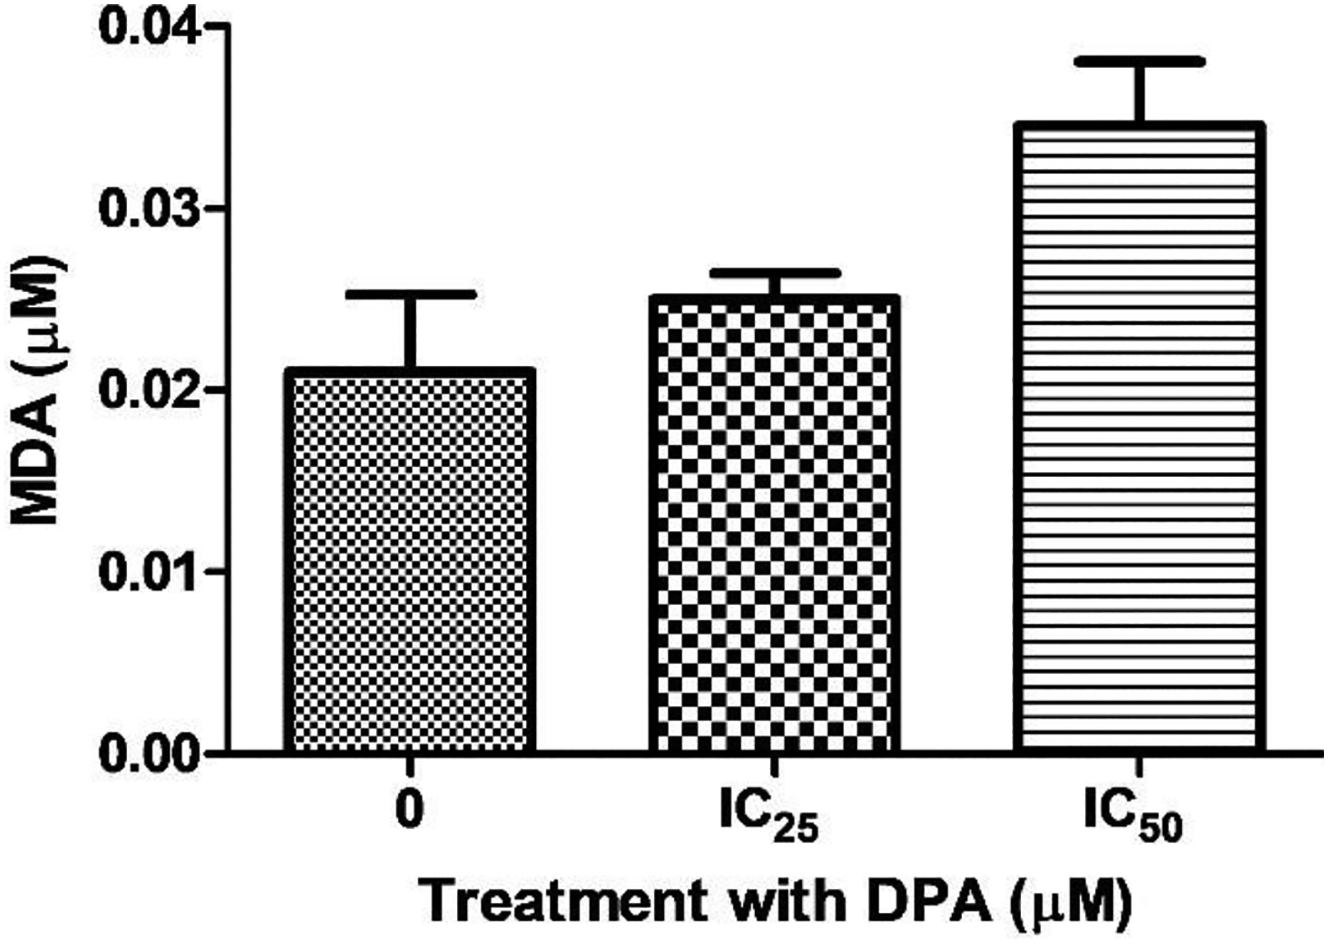
HEK293 cells treated with Di-(2-picolyl)-amine (DPA) showed an increase in malondialdehyde (MDA) levels for all concentrations when compared to the control. IC50 (P = 0.1793) showed the highest increase in MDA levels.
Nitric oxide synthase assay
The basis of the NOS assay is the enzymatic transformation of nitrate to nitrite by the enzyme nitrate reductase as an indicator of reactive nitrogen species (RNS). Treatment of cells with DPA did not significantly alter the RNS levels relative to the control (Figure 5).
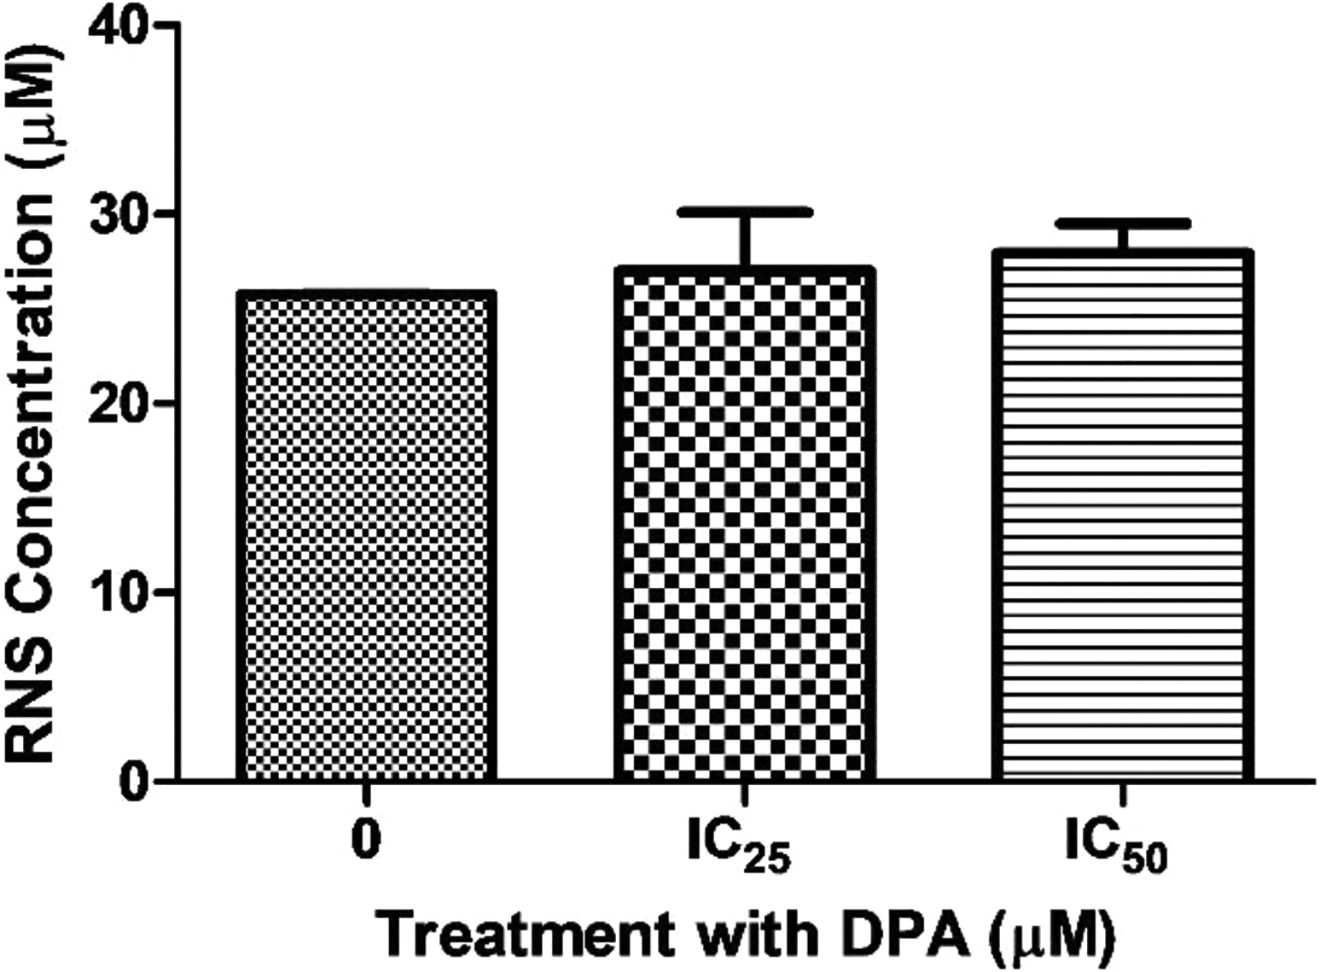
HEK293 cells which were treated with Di-(2-picolyl)-amine (DPA) showed a minimal increase in reactive nitrogen species (RNS) levels at the IC25 concentration (P = 0.5641). The increase observed for IC50 was only slightly greater than the one noted at the IC25 concentration but was not statistically significant (P = 0.1378).
Apoptosis
Initiator and executioner caspase activation
The activities of caspase-8, -9, and -3/7 were determined via luminometry. Di(2-picolyl) amine conspicuously amplified the activity of all caspases measured. The DPA-induced increase in caspase 8 activity was ±0.3-fold for both IC25 and IC50 concentrations when compared to the control (Figure 6A). Likewise, caspase-9 activity was increased upon treatment of HEK293 cells, with a 0.27-fold and 0.36-fold increase observed at IC25 and IC50 concentrations, respectively (Figure 6B). Executioner caspase3/7 activity in DPA-treated HEK293 cells was elevated at all concentrations when compared to the control. The greatest increase occurred at the IC25 concentration with a 0.44-fold change to the control. Although the activity increased by 0.27-fold at the IC50 concentration relative to the control, a decline in activity was also observed when compared to the IC25 concentration (Figure 6C).
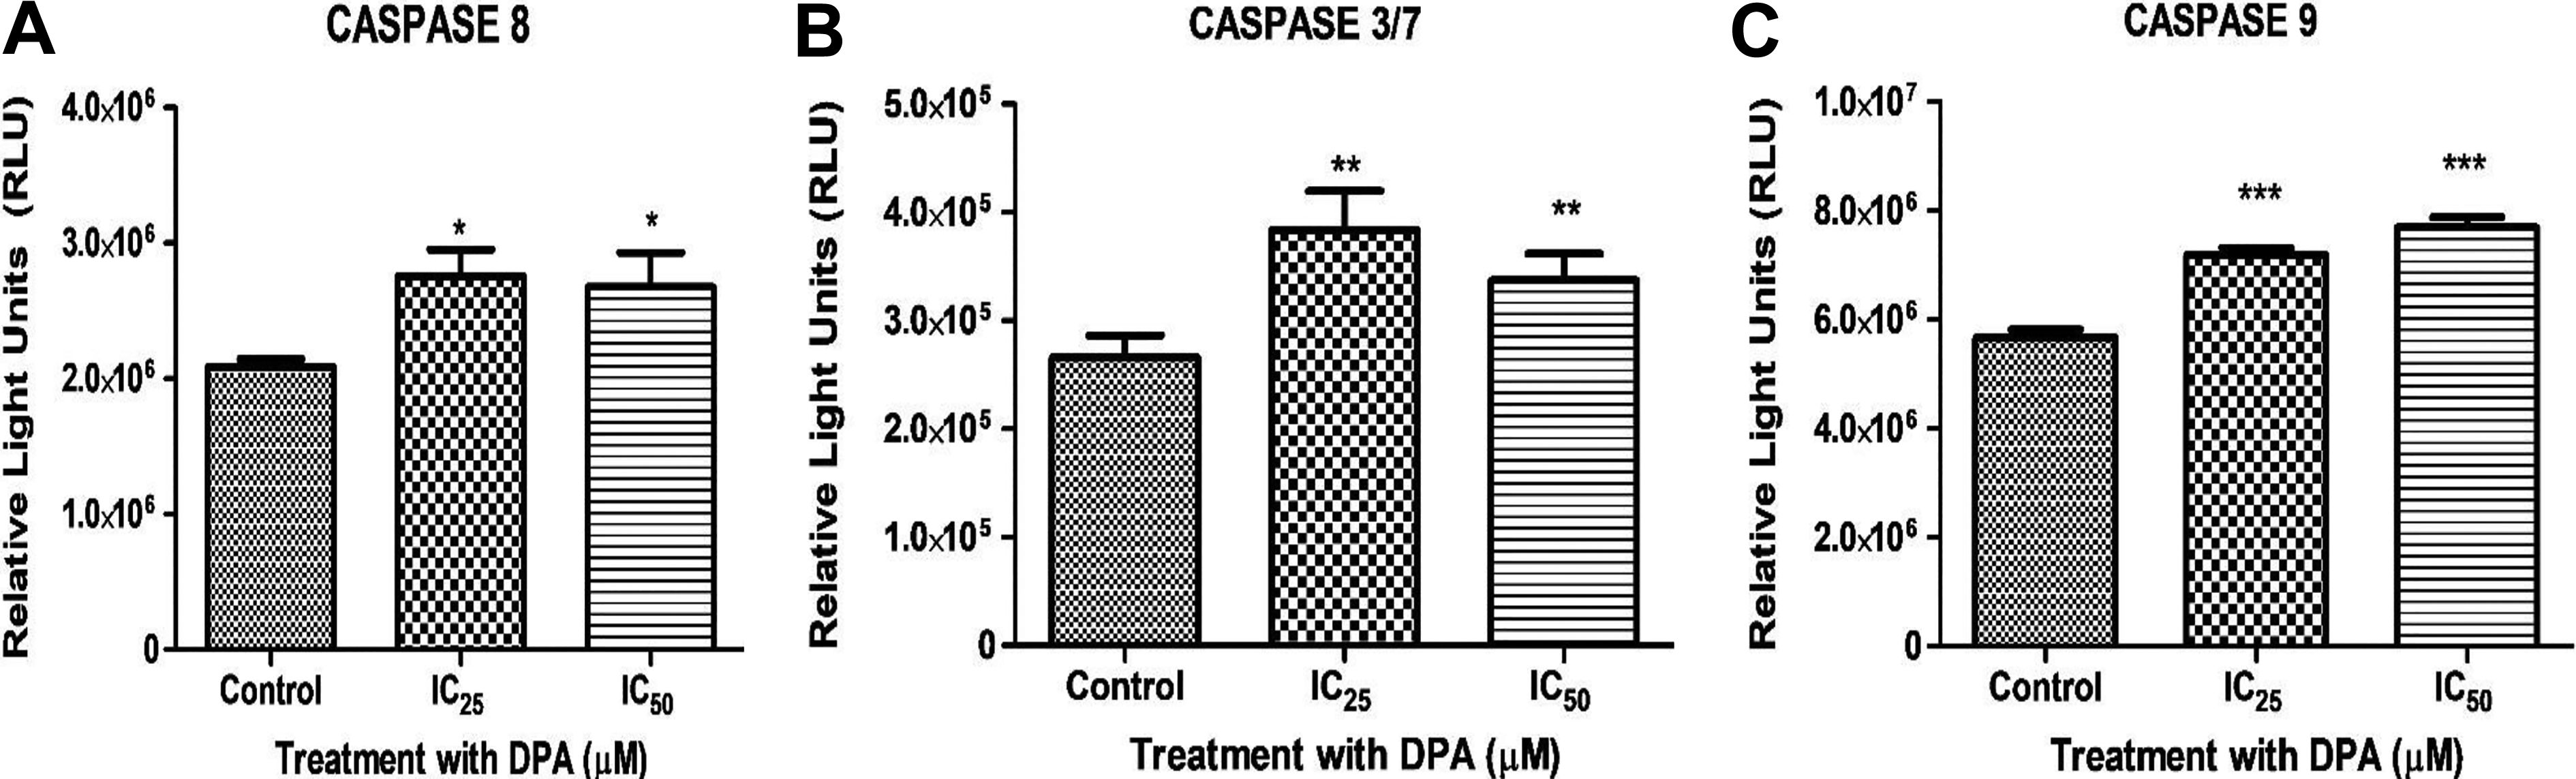
A, The activity of initiator caspase-8 was increased in Di-(2-picolyl)-amine (DPA)-treated HEK293 cells at the IC25 and IC50 concentrations when compared to the control. B, The activity of initiator caspase-9 was appreciably enhanced in DPA-treated HEK293 cells compared to the control at all concentrations, with IC50 exhibiting the greatest caspase 9 activity. C, Activity of executioner caspases-3/7 was inflated in DPA treated HEK293 cells at both the IC25 and IC50 concentrations compared to the control. *P < 0.05, **P < 0.05, ***P < 0.0001.
Nuclear Morphology
Hoecsht assay
Apoptotic late stages are characterized by hypercondensed nuclei, formation of apoptotic bodies, and fragmentation of DNA. Hoecsht staining demonstrated higher cell density in healthy cells undergoing several mitotic stages in the untreated control (Figure 7A). Nuclear condensation, the formation apoptotic bodies, and fragmentation of DNA were induced by DPA in HEK293 cells after 24 hours as can be seen in (Figure 7B and C).
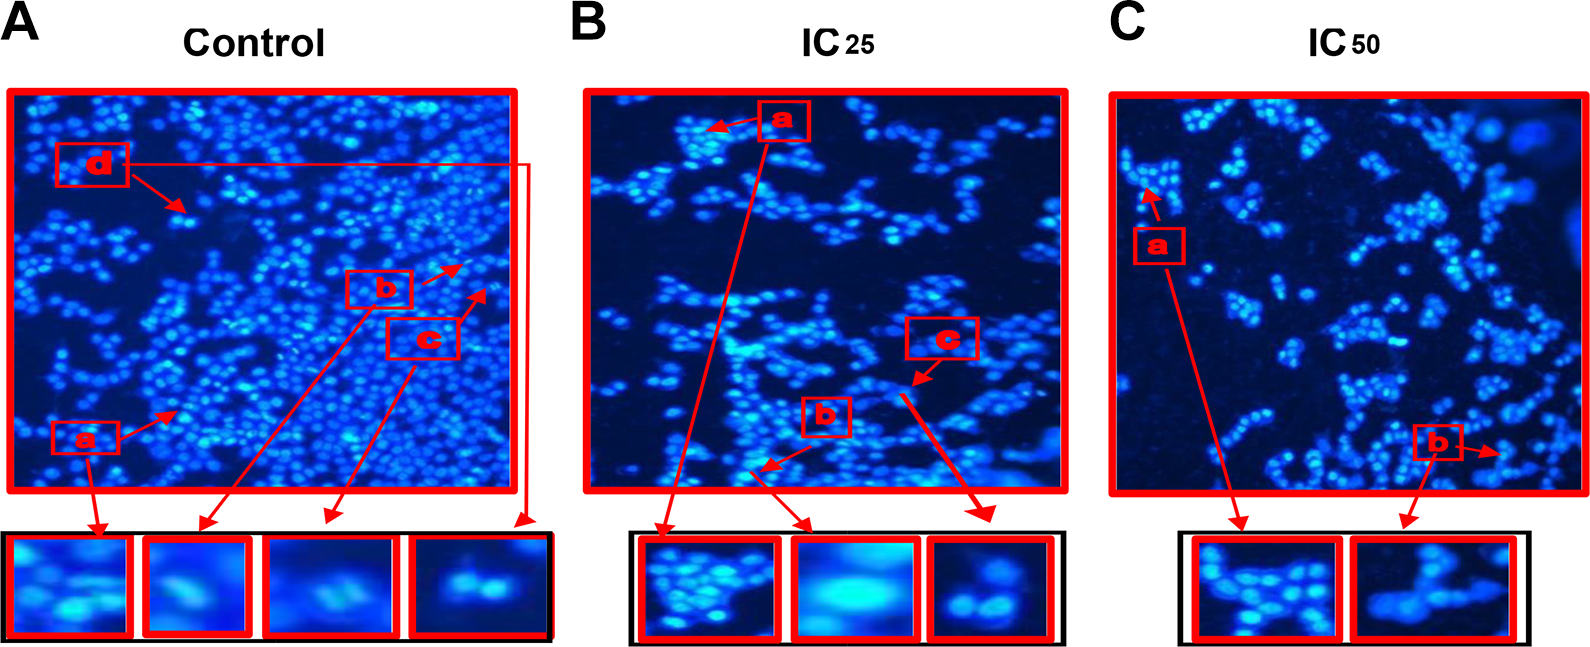
The Hoecsht assay showing the (A) Nuclear morphology of untreated HEK293 cells showing (a) early prophase, (b) metaphase, (c) anaphase, (d) early telophase, (B) IC25-treated HEK293 cells showed that Di-(2-picolyl)-amine (DPA)-induced (a) apoptotic body formation, (b) chromatin condensation, (c) DNA fragmentation and reduced HEK293 cell density as compared to control. (C) IC50—Nuclear morphology of DPA treated HEK293 cells at the IC50 concentration. DPA induced (a) apoptotic body formation, (b) DNA fragmentation as well as reducing HEK293 cell density as compared to control (×200).
DNA damage: SCGE Assay
DNA fragmentation in DPA-treated HEK293 cells was detected by means of the comet assay, where longer comet tails were indicative of greater DNA fragmentation. No comets were observed in untreated HEK293 cells, where intact core of DNA was retained in the nucleus (Figure 8A and D). Distinct comet tails were evidence of DNA fragmentation that occurred in DPA-treated cells at the IC25 concentration (Figure 8B and D) and IC50 concentration (Figure 8C and D).
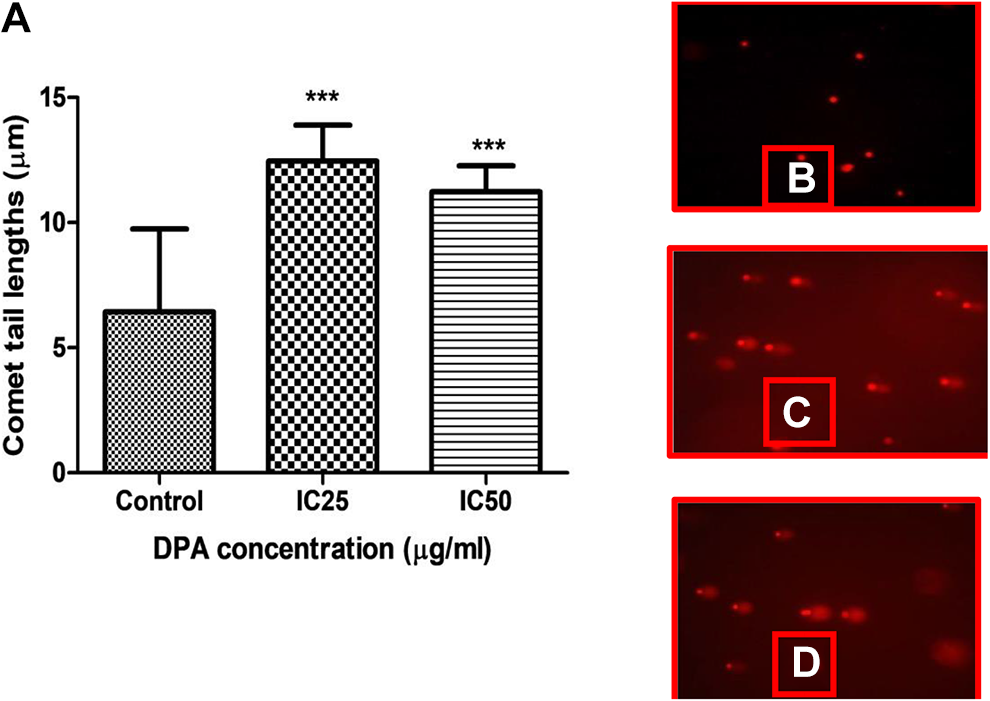
A, Control cells with large comet heads contain intact DNA. B, An increase in DNA fragmentation was observed in Di-(2-picolyl)-amine (DPA)-treated cells at IC25 which showed long comet tails and represented as the highest increase in the graph (D) compared to the control cells. C, Increased DNA fragmentation was observed for IC50 DPA-treated cells as indicated by the longer comet tails when compared to the control cells. However, a slight decrease was observed when compared to the IC25 concentration. ***P < 0.0001 (×200).
Apoptotic Induction
Protein expression of HSP70, p53, GPx, SOD, poly (ADP-ribose) polymerase 1, and NRF2
The expression of target proteins was normalized against the housekeeping protein, β-actin to produce a relative band intensity (RBI). Di(2-picolyl) amine did not alter the protein expression of HSP70 at the IC25 concentration; however, expression on the other hand was slightly downregulated with a 0.17-fold change at IC50 (Figure 9A). Protein expression of p53 was decreased for both the IC25 (0.10-fold) and IC50 treatments (0.14-fold; Figure 9B and C) shows that the expression of GPx was significantly increased (0.31-fold) at the IC25 concentration, while treatment with the IC50 of DPA exhibited a 0.50-fold decrease in GPx expression. Regarding SOD, in both concentrations, a 0.21-fold and 0.30-fold increase were observed in expression, respectively, at IC25 and IC50 relative to the nontreated cells (Figure 9D). Poly (ADP-ribose) polymerase 1’s IC25 concentration showed a 0.17-fold change in expression and the IC50 increased the expression to 0.21-fold (Figure 9E). A significant reduction in NRF2 expression was noted at the IC50 concentration (0.76-fold), while at IC25 a 0.19-fold increase was shown when compared to the control (Figure 9F).
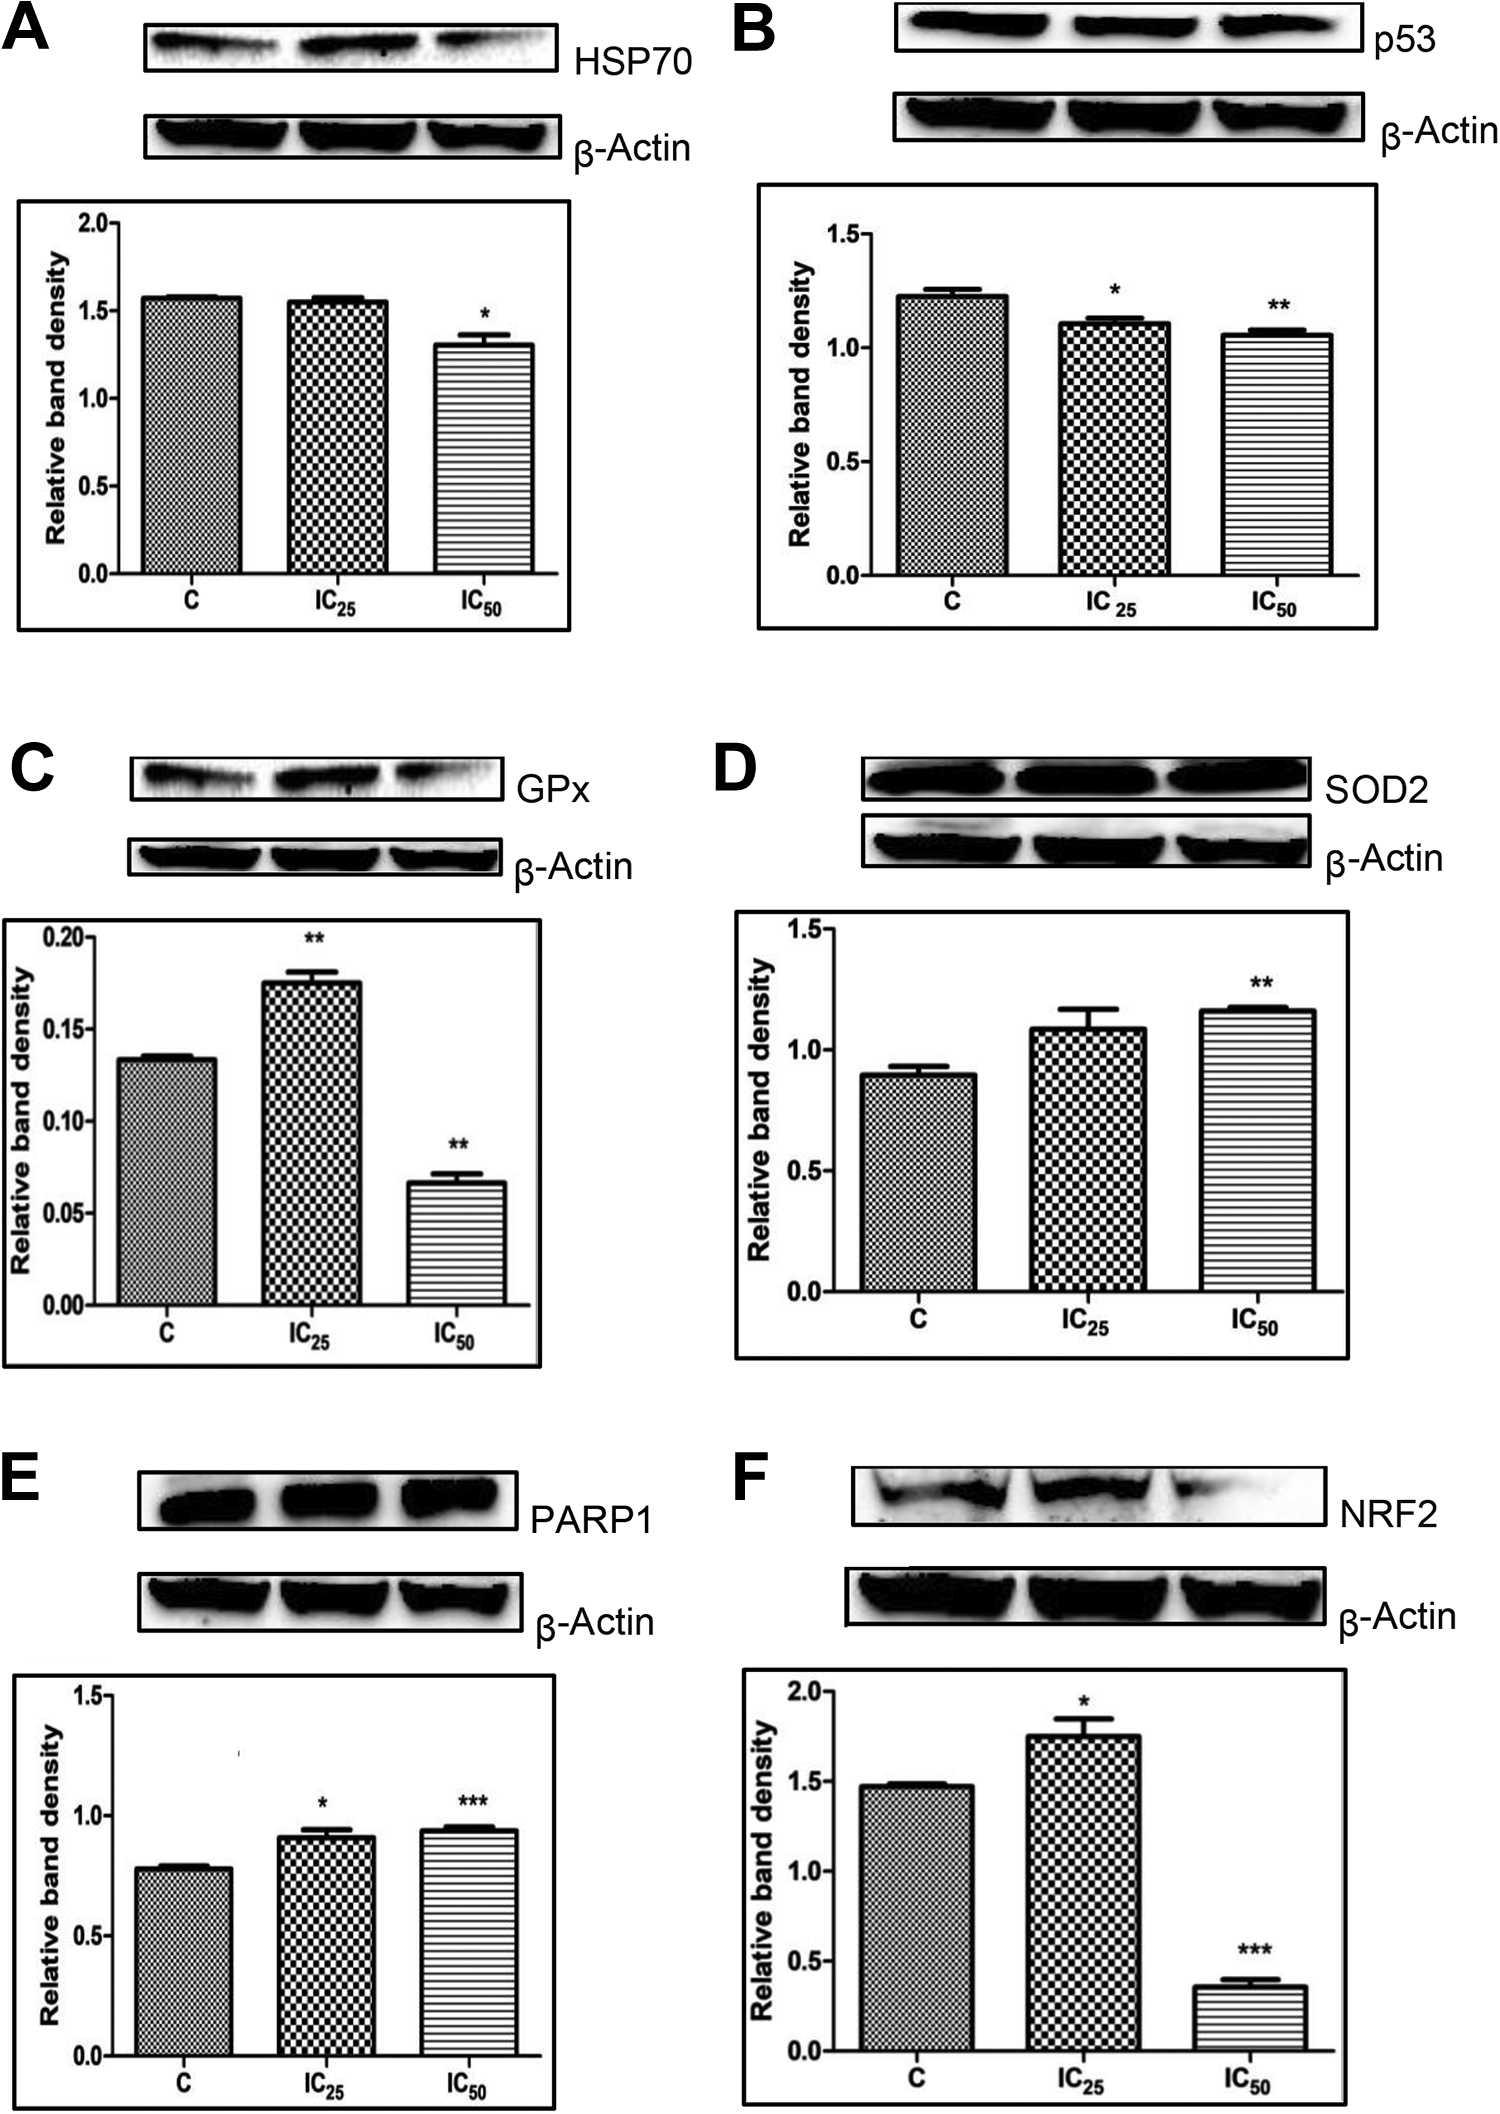
Treatment with the IC25 concentration of Di(2-picolyl) amine (DPA) increased protein expression of PARP-1, superoxide dismutase (SOD) 2, glutathione peroxidase (GPx), and Nrf2, while the RBI of HSP70 was similar to the control and p53 decreased slightly. The IC50 concentration of DPA significantly decreased HSP70, p53, GPx, PARP-1, and Nrf2, while SOD2 was significantly increased (A) HSP70: IC25 (P = 0.2965), IC50 (P < 0.05). (B) p53: IC25 (P < 0.05), IC50 (P < 0.05). (C) GPx: IC25 (P < 0.05), IC50 (P < 0.05). (D) SOD: IC25 (P = 0.0660), IC50 (P < 0.05). (E) PARP-1: IC25 (P <0.05), IC50 (P < 0.05). (F) NRF2: IC25 (P < 0.05), IC50 (P < 0.05) in HEK293 cells after treatment for 24 hours. PARP-1 indicates poly (ADP-ribose) polymerase 1; RBI, relative band intensity.
Discussion
Di(2-picolyl) amine is a pyridine derivative, that is, a heterocyclic organic compound known to possess potential anticancer properties. 10 Every substance to be utilized in the body as a potential therapeutic agent needs to first be investigated for its effect on the kidneys, as they are the primary excretion organs. Zuo et al elucidate that DPA is a metal chelator with the ability to thwart enzymatic activities and cellular processes, thus generating cytotoxicity. Therefore, this study aimed to examine whether DPA has potential properties in affecting HEK293 kidney cells.
The measurement of the metabolic activity, cell viability, and proliferation were assessed through MTT assay. Only viable cells with an active metabolism are able to enzymatically convert MTT to water-insoluble formazan crystals by mitochondrial dehydrogenases; thus, the color formation serves as a key marker of only the viable cells. 11 The MTT assay revealed that DPA generated a “dose-dependent” reduction “in cellular metabolic activity and viability in” HEK293 cells (Figure 1). Green and Reed elucidate that an early attribute of cell death is the disruption of the electron transport chain, which is usually followed by a decrease in ATP production. 12 This decreased metabolic activity results in a decline of reducing equivalents and ATP. 13 Reducing equivalents are requisite for the mitochondrial respiratory chain within the mitochondrial membrane, in addition to MTT salt reduction for the generation of the formazan product. 14 Mitochondrial respiratory chain disruption results in a disruption of the mitochondrial membrane proton gradient, which is key for the activity of ATPase for ATP generation. 13 Thus, the decrease in ATP observed in (Figure 3) corresponds to the dose-dependent reduction in cellular metabolic activity and subsequent viability in HEK293 cells (Figure 1).
Mitochondria are paramount organelles in the inception of considerable ROS production in addition to their susceptibility to oxidative damage. Reactive oxygen species generation via restricted electron transfer brought about by a mitochondrial membrane disruption can emanate in elevated ROS production. 13 Considerably elevated ROS levels accompanied by a reduction in antioxidants can result in DNA and lipid oxidation. 15 Chemically reactive molecules/ions whose formation stems from inadequate one electron reduction of oxygen are known as ROS. 16 Examples are superoxide anion radical (O2 ●-), hydrogen peroxide (H2O2), hypochlorous acid, hydroxyl radical (●OH), and so on. They are natural by-products of cellular processes, such as mitochondrial respiration as well as being required for physiological functions such as apoptosis, cell signaling, and so on. Free radical attack on cellular lipids can result in lipid peroxidation. 15 Reactive oxygen species induced lipid peroxidation was minimally elevated by DPA (Figure 4) along with a concurrent decline in GPx levels when compared to control cells (Figure 9C). This is indicative of DPA’s ability to impede HEK293 cells’ mitochondrial membrane and its activities thus triggering oxidative stress.
Reactive nitrogen species are reactive intermediates formed when nitric oxide (●NO) condenses with O2 ●− to form peroxynitrite in an enzymatic reaction. 17 Increased RNS levels have been connected to cell injury and death via nitrosative stress induction. 18 As evidenced in this study, SOD’s expression increased (Figure 9D) due to the increase in ROS (Figure 4). Therefore, production of peroxynitrite cannot occur, resulting in minimal increase in RNS (Figure 5).
Superoxide dismutase and GPx form part of the first-line defense antioxidants which suppress/prevent the formation of free radicals or reactive species in cells. Superoxide dismutase acts by catalyzing the dismutation of 2 molecules of O2 ●− to H2O2 and molecular oxygen (O2). H2O2 is subsequently detoxified to water by GPx. This intracellular enzyme is also responsible for breaking down lipid peroxides to their corresponding alcohols. 19 Figure 9C shows that GPx’s expression is initially increased, thus indicating that detoxification took place and corresponds with the lipid peroxidation increase observed at IC25 (Figure 4). However, at IC50 a subsequent GPx downregulation (Figure 9C) was noted, indicating the possibility that H2O2 had formed hydroxyl radicals thus triggering increased lipid peroxidation (Figure 4).
Lipid peroxidation is a known oxidative stress biomarker and results in disruption in the integrity of the cellular membrane and consequently cell damage. 19,20 It is the oxidative degradation that occurs when free radicals remove electrons from membrane lipids resulting in cell damage. Polyunsaturated fatty acids are mostly affected due to their multiple double bonds between methylene bridges (CH2−) in reactive hydrogen atoms. The end products of this process are reactive aldehydes, that is, MDA. The TBARS assay is used to assess MDA as evidence of lipid peroxidation. 19,21 The increased MDA (Figure 4) provides evidence of increased lipid peroxidation and subsequent oxidative stress in DPA treated cells. NRF2 regulates the expression of various gene networks that encode proteins with cytoprotective activities. 22 The presence of oxidative stress results in an increase in the expression of NRF2 (Figure 8C).
The downregulation of p53 (Figure 9B) indicates that DNA damage generated by oxidative stress was not repaired. This inability was further evidenced by the long SCGE comet tails (Figure 8B and C) compared to intact DNA in the control cells (Figure 8A); after DPA-treated cells were assessed for damaged and fragmented DNA. The Hoecsht assay enabled the visualization of other late stages of apoptosis such as condensation and damage of nuclear components, apoptotic bodies formation. 23 Figure 8B and C shows that DPA-induced hypercondensation of nuclei, DNA fragmentation, and resulted in the formation of a number of apoptotic bodies in HEK293 cells, compared to the untreated control (Figure 8A), thus indicating that it is cytotoxic to the cells.
DNA fragmentation is the end result of apoptosis stemming from the activity of executioner caspase 3. 23 Caspase 3 is one of the executioner caspases that stimulate degradation of nuclear material by means of cytoplasmic endonucleases, and nuclear and cytoskeletal proteins by proteases. 24 Its activity was increased (Figure 6). In apoptotic cells, activated caspase-3 cleaves iCAD to release CAD which degrades chromosomal DNA within the nuclei and results in chromatin condensation. Caspase-3 also induces cytoskeletal reorganization and disintegration of the cell into apoptotic bodies. 24
Caspase-8 and -9 were also increased (Figure 6). Caspase-8 activation triggers the execution phase of apoptosis where BID is activated to truncated tBID. The truncated tBID activates BAX/BAK and then translocates to the mitochondria, where it inserts into the mitochondrial outer membrane and results in outer membrane permeabilization. Cytochrome c is then released from the mitochondria where it binds and activates Apaf-1 as well as procaspase-9, forming an “apoptosome.” The clustering of procaspase-9 in this manner leads to caspase-9 activation which activates caspase-3/7. 25
Poly(ADP-ribose) polymerase 1 is also a participant in apoptosis, recognizes, and repairs DNA damage and is involved in single-strand break repair (SSBR). 26 Poly (ADP-ribose) polymerase 1 was cleaved (Figure 9E), indicating that SSBR did not take place as shown by the comet assay (Figure 8]) and the cell therefore underwent apoptosis. The DNA damage that HEK293 cells underwent due to DPA exposure (Figure 8) necessitated an analysis of p53 expression. This analysis revealed a decrease in p53’s expression at IC25 and a further decline at IC50 (Figure 9B). This thus indicated that the damage was beyond repair and thus p53 had not been activated. Moreover, p53 expression downregulation was indicative of a lack of involvement in the release of caspase 9 and by extension exclusion from apoptotic involvement.
Heat shock proteins (HSPs) are encoded by genes whose expression is elevated during stress conditions (namely, heat shock, oxidative stress, heavy metal, and so on). During these conditions, HSP’s heighten cell survival via protection and disaggregation of stress-labile proteins as well as damaged proteins’ proteolysis. 27 HSP70 in particular is involved in mitochondrial protein homeostasis in addition to moderating translocation and folding reactions. 28 In this study, HSP70’s initial decrease in expression was negligible (Figure 9A). Its subsequent expression did however decrease at IC50. This indicated that at the higher ROS concentration (Figure 2), HSP70 was unable to protect the cells from the oxidative stress. This also correlated to the longer comet tails in the SCGE graph (Figure 8).
Regarding DPA’s ability to induce apoptosis, a study involving DPA as one of the Zn chelators was performed to attempt to establish whether novel polypyridyl chelators deplete cellular Zn and destabilize the XIAP prior to induction of apoptosis in human prostate and breast cancer cells. Di(2-picolyl) amine was identified as being able to bind to metal ions (eg, Zn, Cu, and so on) resulting in the stable metal complexes formation and thus possibly induce apoptosis. 4,29 At low doses, however, it was unable to either trigger PARP cleavage nor XIAP decline, and thus no apoptosis induction took place. In this study, however, DPA was administered at high doses to HEK293 cells and was able to induce apoptosis.
Conclusion
Di(2-picolyl) amine effectuated oxidative stress by the elevation in the level of ROS-induced lipid peroxidation resulting in membrane damage and subsequently reducing antioxidant response. Mitochondrial activity disruption was analogous with reduced ATP levels. These occurrences jointly prompted the caspase cascade that culminated in compromised DNA integrity, and obviated its repair, consequently resulting in cell death via both the intrinsic and extrinsic apoptosis. Based on the evidence collected, it can be concluded that DPA is a cytotoxic agent against human HEK293 cells. Further studies involving the use of in vivo animal models should be undertaken to elucidate the actual mechanism of action. Moreover, future research should focus on how DPA’ s anticancerous properties on cancerous cells can be harnessed while circumventing its cytotoxic effect on healthy cells.
Footnotes
Authors’ Note
Ethical approval was obtained from the Biomedical Research Ethics Administration (BE469/18). The generated data used to support the findings of this study are included within the article.
Acknowledgments
The authors acknowledge the College of Health Sciences, University of Kwa-Zulu Natal, Durban, South Africa for supporting this study.
Author Contributions
Satyo, L. contributed to conception, design, acquisition, analysis, and interpretation, and drafted the manuscript; Amoako, D. contributed to conception, design, acquisition, analysis, and interpretation, and critically revised the manuscript; Somboro, A. contributed to conception, design, acquisition, analysis, and interpretation, and critically revised the manuscript; Sphelele, C. contributed to conception, acquisition, and analysis, and critically revised the manuscript; Kumalo, H. contributed to conception, design, acquisition, analysis, and interpretation, and critically revised the manuscript; Mhlongo, N. contributed to design, analysis, and interpretation, and critically revised the manuscript; Khan, R. contributed to conception, design, acquisition, analysis, and interpretation, and critically revised the manuscript. All authors gave final approval and agree to be accountable for all aspects of work ensuring integrity and accuracy.
Declaration of Conflicting Interests
The author(s) declared no potential conflicts of interest with respect to the research, authorship, and/or publication of this article.
Funding
The author(s) received no financial support for the research, authorship, and/or publication of this article.