
Abstract
Conventional in vitro assays are often used as initial screens to identify potential toxic effects of nanoparticles (NPs). However, many NPs have shown interference with conventional in vitro assays, resulting in either false-positive or -negative outcomes. Here, we report an alternative method for the in vitro assessment of NP-induced cytotoxicity utilizing Fluoro-Jade C (FJ-C). To provide proof of concept and initial validation data, Ag-NPs and Au-NPs were tested in 3 different cell cultures including rat brain microvessel endothelial cells, mouse neural stem cells, and the human SH-SY5Y cell line. Conventional 2,3-bis-(2-methoxy-4-nitro-5-sulfophenyl)-2H-tetrazolium-5-carboxanilide (XTT) and lactate dehydrogenase (LDH) assays were run in parallel with the new method and served as references. The results demonstrate for the first time that FJ-C labeling can be a useful tool for assessing NP-induced cytotoxicity in vitro. Using these approaches, it was also demonstrated that removal of Ag-NPs—while keeping the Ag-ions that were released from the Ag-NPs in culture media—abolished the measured cytotoxicity, indicating that Ag-NPs rather than Ag-ions in solution contributed to the observed cytotoxic effects. Further, co-treatment of Ag-NPs with N-acetyl cysteine (NAC) prevented the observed cytotoxicity, suggesting a protective role of NAC in Ag-NP-induced cytotoxicity. Thus, this alternative in vitro assay is well suited for identify potential cytotoxicity associated with exposure to NPs.
Introduction
Nanoparticle (NP)-based materials are being increasingly introduced into consumer and medical use. 1 -3 While some NPs are designed to elicit specific cytotoxicity, for example, targeting microorganisms or cancerous cells, others purport to be biocompatible with no adverse effects on the biological systems into which they come in contact. Since many NPs have demonstrated unwanted cytotoxicity, 4 -6 investigating NP-associated toxic effects should help to profile the desired and undesired consequences of NP-exposures and to assist in the development of strategies to avoid or limit such associated adverse effects. Owing to their unique physicochemical properties, NPs can bind to enzymes or assay reagents and change their affinities or activities, or change optical absorbance or emission properties of assay products. Some NPs are also luminescent or autofluorescent and, thus, can interfere with those assay types. Existing studies report that NPs can interfere with many well-established cytotoxicity assays such as 2,3-bis-(2-methoxy-4-nitro-5-sulfophenyl)-2H-tetrazolium-5-carboxanilide (XTT), 7 3-(4,5-dimethylthiazol-2-yl)-2,5-diphenyltetrazolium bromide (MTT), 8 water soluble tetrazolium salt 1, 9 3-(4,5-dimethylthiazol-2-yl)-5-(3-carboxymethoxyphenyl)-2-(4-sulfophenyl)-2H-tetrazolium (MTS), 10 lactate dehydrogenase (LDH), 11 calcein acetoxymethyl ester (calcein-AM), 12 fluorescein diacetate, 9 propidium iodide, 13 neutral red, 14 annexin-V, 15 adenylate kinase, 16 adenosine triphosphate, 17 caspase-3, 15 Alamar Blue, 7 CellTiter-Blue, 18 and Live/Dead, 19 resulting in false-positive or -negative outcomes. Therefore, developing alternative approaches for assessing NP-exposure-associated cytotoxicity could help to better evaluate the safety profiles of NP-based products and benefit not only the research community but also medical and industrial applications.
Fluoro-Jade (F-J) and its derivatives (F-J B and F-J C) are poly-anionic fluorescein analogs and were initially developed for the labeling of degenerating neurons in the brain. 20 -22 The histochemical stain is simple and sensitive compared to “classical” approaches such as the silver-stain. 23 Further development of the histochemical labeling has led to the formulation of F-J B 21 and F-J C, 22 with F-J C resulting in higher resolution, higher contrast, and lower background than F-J B. 22 The F-J labeling has been utilized in a wide variety of studies, such as traumatic brain injury, deafferentation, developmental apoptosis, ischemia, animal models of neurodegenerative diseases, and exposure to different neurotoxicants. 20 -28 Despite successful utilizations in over 1,000 published studies, however, the labeling mechanism or the binding target of the F-Js remains elusive. It was hypothesized that F-Js might bind to a poly-aminergic product during cellular degeneration such as spermidine, cadaverine, or putrescine. 21 However, other possibilities of the F-J binding target such as the synthesis of new molecules or biochemical modifications of existing molecules other than degraded components of macro-molecules during the cell death process have yet to be identified or ruled out. Previous studies have also demonstrated F-J labeling of activated microglia and astrocytes, 29 -32 suggesting that F-J binding targets might be present in different cell populations other than neurons. In fact, a recent report extended the validity of the FJ-C labeling to neuronal and non-neuronal cells in vitro. 33 In the present study, the utility of FJ-C was further examined in the assessment of cytotoxicity following silver nanoparticle (Ag-NPs) and gold nanoparticle (Au-NPs) exposure in different types of cell cultures. In addition, 2 other sets of experiments were conducted to answer the following questions: (1) Do silver ions released from the Ag-NPs contribute to the observed cytotoxic effects; and (2) can N-acetyl cysteine (NAC), a precursor to the primary endogenous antioxidant glutathione, attenuate AgNP-induced cytotoxicity?
Methods
Nanoparticle Characterization
Basic characterizations of the Ag-NPs (citric acid coated) and Au-NPs (tannic acid coated) employed in this study were conducted by the manufacturer (nanoComposix Inc, San Diego, California). Nevertheless, the physicochemical properties of these Ag-NPs and Au-NPs (including size, shape, morphology, hydrodynamic size, and ζ potential), were further determined at the Food and Drug Administration (FDA)’s Nanotechnology Core Facility located at the National Center for Toxicological Research.
The primary size, shape, and morphology of the NPs used in the present study were determined using transmission electron microscopy. In preparation for the cell culture experiments, the NPs were passed through a 0.2 µM polyvinylidenefluoride (PVDF) filter, after which they were homogeneously dispersed in 18 MΩ H2O and 3 µL suspensions were deposited on a formvar carbon coated grid, dried, and evacuated before analysis. Images were collected using a field emission JEM-2100 microscope (JEOL, Tokyo, Japan) equipped with a charge-coupled device camera.
Hydrodynamic sizes and ζ potentials of the Ag- and Au-NPs were measured in water using a Zetasizer (Malvern, Worcestershire, United Kingdom) as described previously. 34 Since the measurement of the hydrodynamic size of NPs in solution using dynamic light scattering (DLS) depends on the concentration and composition of the sample, the concentrations of the NP samples were optimized at 10 µg/mL to assure the quality of the DLS data. Ag- and Au-NPs (at 10 µg/mL in 18 MΩ H2O), were vortexed and sonicated for 5 minutes to provide a homogenous dispersion. For size determinations, 70 µL of the diluted NP dispersions were transferred to a cuvette for dynamic size measurement. For ζ potential measurements, a Malvern ζ potential cell was washed 3 times with ultrapure water followed by transferring 850 µL of dispersed NPs to the cell. Both size and ζ potential were measured at least 3 times and the average size and ζ potential of the NPs were obtained.
Cell Cultures
Rat brain microvessel endothelial cells
The isolation and cell culture procedures were as described previously. 35 Adult male Sprague-Dawley rats were obtained from the animal breeding facility at FDA’s National Center for Toxicological Research (NCTR). The use of animals and the experimental procedures involving animals were carried out in accordance with the National Institute of Health Guide for the Care and Use of Laboratory Animals and were approved by the Animal Care and Use Committee at the NCTR (Protocol # E0746001). In brief, animals were sacrificed by decapitation and the brains removed. After removal of meninges and cerebellum, the cerebral cortices were mechanically homogenized through a 100 µm mesh screen. Dispase II enzyme (5 mg/mL), reconstituted in minimal essential medium (MEM) isolation media (MEM [1 M], HEPES [50 mM], polymyxin B [50 µg/mL], gentamicin [50 µg/mL], and amphotericin B [2.5 µg/mL] at pH 7.4), was added (10 mg/g brain tissue) to freshly homogenized cerebral cortical tissue, and MEM isolation media at pH 9.0 was added (equal weight/weight of brain tissue). The mixture was placed in an incubation shaker for 1 hour at 37 C and 150 rpm. Following this incubation, the supernatant was removed after centrifugation (10 minutes at 1,570×g) and the crude capillaries were isolated by re-suspending the cerebral cortical tissue in MEM supplemented with 13% (weight/volume) dextran followed by centrifugation (10 minutes at 9,170×g). The crude capillary pellet was collected and re-suspended in a collagenase/dispase (5 mg/mL) solution at a final concentration of 0.1% (volume/weight) and placed in an incubation shaker for 1 hour at 37°C and 150 rpm. During this time, a percoll gradient was set up by centrifugation (60 minutes at 39,200×g). The digested capillaries were centrifuged (10 minutes at 1,200×g) to remove the enzymatic treatment, re-suspended in isolation media and pipetted into the percoll gradient tubes. The cells were then separated by centrifugation (10 minutes at 1,700×g), extracted from the percoll gradient using a 3-mL syringe, pelleted, and re-suspended in complete media containing 45% (volume/volume) MEM, 45% (volume/volume) Ham’s F-12 nutrient mix, 10% (volume/volume) fetal bovine serum (FBS), and 10 mM HEPES, 13 mM sodium bicarbonate, 50 µg/mL gentamicin, 2.5 µg/mL amphotericin B, and 100 µg/mL sodium heparin. The cells were then plated at a seeding density of 50,000 cells/cm2 on collagen-coated and fibronectin-treated culture plates and incubated in a humidified incubator with 5% CO2 at 37°C. The cultures were used after cells reached confluence, typically 10 to 14 days post-seeding.
Mouse neural stem cells
Neurospheres, derived from cells isolated from embryonic day 14 mouse striatum, and associated culture supplies were purchased from StemCell Technologies (Vancouver, Canada). Neurospheres were grown at 37°C and 5% CO2 in NeuroCult Neural Stem Cells (NSC) Basal Medium supplemented with NeuroCult proliferation supplement and 20 ng/mL recombinant human epidermal growth factor. Neurospheres were grown until they reached 100 to 150 μm in diameter. They were then seeded at 14,000 cells/cm2 on poly-d-lysine/laminin-coated culture ware and incubated in NeuroCult NSC Basal Medium supplemented with Neurocult NSC differentiation supplement (1:10 volume dilution). Cultures were used for the experiments after cells reached confluence, typically 7 to 10 days post-seeding.
Human SH-SY5Y cell line
The SH-SY5Y cell line, originally derived from a human neuroblastoma, was obtained from American Type Culture Collection (Manassas, Virginia). SH-SY5Y cells were cultured at 70,000 cells/cm2 in media containing 45% (volume/volume) Dulbecco’s modified Eagle medium, 45% (volume/volume) Ham’s F-12 Nutrient Mix (DMEM/F12), and 10% (volume/volume) FBS (Mediatech, Manassas). The cell cultures contained 100 IU penicillin and 100 µg/mL streptomycin and were maintained at 5% CO2 and 37°C. Cells were used in experiments after forming confluent cultures (∼7 days post-seeding).
Cell Culture Treatment
Cell treatments consisted of 24-hour exposures to their respective culture media plus various doses of Ag-NPs (up to 5 µg/mL) or Au-NPs (up to 50 µg/mL). Vendor supplied NP stock solutions (Ag-NP = 1.8 mg/mL and Au-NP = 1.0 mg/mL) and all other test articles including cadmium nitrate tetrahydrate (Sigma-Aldrich, Saint Louis, Missouri), thimerosal (Sigma-Aldrich), Fluoro-Jade C (Histo-Chem Inc, Jefferson, Arkansas), and N-acetyl cysteine (Sigma-Aldrich) were sterilized via micro-filtration through a 0.2 µm diameter PVDF filter before being vortex-mixed with culture media. Conventional culture medium served as the negative control, whereas 50 µM cadmium nitrate tetrahydrate (Sigma-Aldrich) and 100 µM thimerosal (Sigma-Aldrich) were used as positive controls.
Removal of Ag-NPs and Subsequent Quantification of Ag-Ions in Culture Media
Culture medium containing 5 µg/mL Ag-NPs was first made, incubated at 37°C for 24 hours and then centrifuged using a Beckman Coulter Optima L-100K Ultracentrifuge and a Beckman 70.1Ti rotor (Beckman Coulter, Brea, California) at 150,000×g for 2 hours in 10.4 mL polycarbonate tubes (Beckman Coulter). The supernatant was then collected and used for subsequent cell treatments in vitro. A small portion of the supernatant was also analyzed using inductively coupled plasma mass spectrometry (ICP-MS) to quantify the Ag-ion amount in the centrifuged culture media.
A portion of the centrifuged culture media (1 mL) was diluted in water containing Indium-115 isotope (Ultra Scientific, North Kingstown, Rhode Island) as the internal standard to a volume of 15 mL. Inductively coupled plasma-mass spectrometry analysis was conducted in standard mode at 1 reading per replicate with 3 replicates per sample. A calibration curve was obtained using 6 standard silver solutions and the addition of an internal silver standard reference (SCP Science, Champlain, New York) was effected to ensure that no interference was occurring.
Fluoro-Jade C Labeling
Culture medium containing FJ-C was prepared fresh using a FJ-C stock solution (10 mg of F-J C in 100 mL distilled water) before each use. After 24 hours of treatment with respective test articles, cell cultures were briefly washed with normal cultured medium before FJ-C labeling. Then, the culture medium was replaced with phenol red free culture medium containing 0.25 µg/mL FJ-C and 1 µg/mL Hoechst-33342 trihydrochloride trihydrate (Invitrogen, Carlsbad, California). FJ-C labeled cells were observed 30 minutes afterward using a FITC-filter (excitation/emission = 490/525 nm), while the Hoechst 33342-labeled cell nuclei were visualized using a DAPI-filter (excitation/emission = 340/460 nm). Multi-well culture plates were scanned using a high-content image recording system (ImageXpress Micro XL, Molecular Devices, Sunnyvale, California). All acquired images were saved as TIFF files and quantitative analyses were performed using the Multiwavelength Cell Scoring module of the MetaXpress software (Molecular Devices). This module counted Hoechst 33342-labeled cells as the total number of cells and determined the percentage of cells in each image field that were also labeled with FJ-C.
Lactate Dehydrogenase Assay
Lactate dehydrogenase (LDH) release, presumably from the cytoplasm of damaged cells, was measured using Roche cytotoxicity detection kits (Roche Diagnostics, Indianapolis, Indiana) as described previously. 33 Briefly, after 24-hour exposures to test articles, 100 uL of treatment media was incubated with 100 µL of LDH substrate and after 15 minutes the absorbance was measured at 490 nm with a reference wavelength of 650 nm using a Synergy-MX plate reader and Gen5 software (BioTek, Winooski, Vermont).
The XTT Assay
The XTT assays for assessing mitochondrial function were performed using previously described methods. 33 Cell cultures were briefly washed with normal culture medium before using the XTT assay kits (Sigma-Aldrich). After washing, 30 µL of fresh XTT reagent (0.2 mg/mL) in the presence of 25 µM phenazine methosulfate was added to the XTT incubation media (120 µL) in each well of a 96 well plate and incubated for 2 hours at 37°C. Formazan production was measured using a Synergy-MX plate reader and Gen5 software at an absorbance wavelength of 450 nm and a reference wavelength of 650 nm.
Statistical Analysis
SigmaPlot (version 13.0) was employed for the statistical analyses. For single-dose comparisons between a treated group and the control group, for example, the cadmium-treated cells versus the nontreated cells, a t test was applied if the collected data in each group passed both the normality (Shapiro-Wilks test) and equal variance tests; otherwise a Mann-Whitney U test was used. For comparisons of multiple treatment groups, for example, among the treatment groups with various doses of Ag-NP exposures, one-way analysis of variance (ANOVA) was chosen if the collected data in all treatment groups passed the Shapiro-Wilks test; otherwise one-way ANOVA on Ranks (Kruskal-Wallis test) was used. For post hoc ANOVA analyses, that is, comparisons of multiple groups against the control group or pairwise multigroup comparisons, Tukey test was used when the sizes of all treatment groups were equal; otherwise Dunn’s test was applied. A value of P < 0.05 was considered to indicate a statistically significant difference.
Results
Transmission electron microscopy analysis indicated that the Ag- and Au-NPs both had predominantly spherical shapes (Figure 1). The primary size of Ag- and Au-NPs was determined to be 20.4 ± 3.8 nm and 22.0 ± 5.3 nm (mean ± standard deviation (SD)), respectively. Zetasizer analyses suggested that the average hydrodynamic size of the Ag- and Au-NPs was 25.7 ± 0.2 nm and 19.4 ± 0.1 nm (mean ± SD), respectively. The average surface charge of the Ag- and Au-NPs was −36.1 ± 0.4 mV and −36.8 ± 0.9 mV (mean ± SD), respectively. These data suggest a relatively homogenous population of the employed Ag- and Au-NPs.
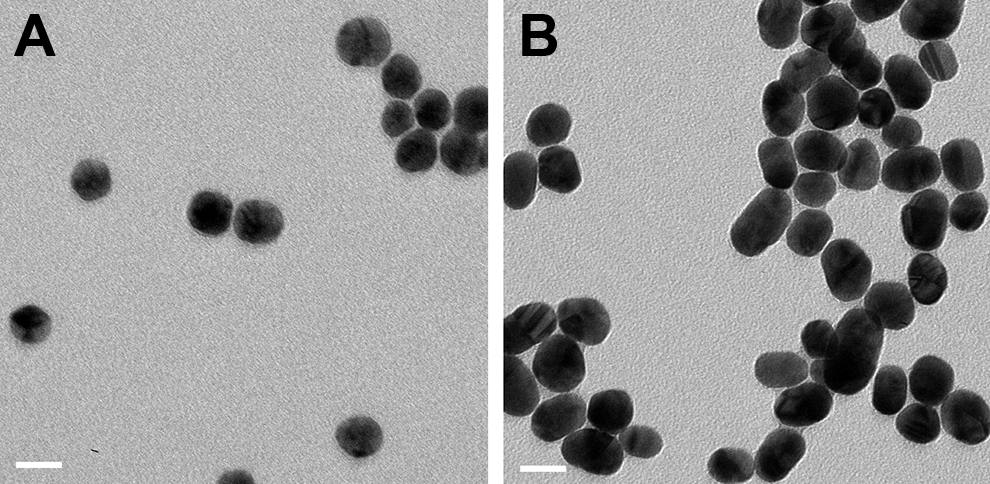
Size and morphology of Ag-NPs (A) and Au-NPs (B) determined by transmission electron microscopy (TEM). The NPs were deposited on formvar carbon coated grids and dried for TEM imaging. Images were analyzed in high resolution mode with an acceleration voltage of 100 kV. Scale bars = 20 nm.
Cytotoxicity following exposures to Ag- and Au-NPs was examined first in rat brain microvessel endothelial cells (rBMVECs) using 3 different assessment methods: FJ-C, XTT, and LDH assays. Figure 2 shows the results of exposure to 5 µg/mL Ag-NPs and 50 µg/mL Au-NPs, which have been reported previously to cause cytotoxicities in rBMVECs, 35,36 as well as the 2 positive controls thimerosal (Thim) and cadmium (Cd). The FJ-C results showed significant increases in the number of FJ-C positive cells in all treated groups when compared to that of the negative control group (Figure 3A), indicating cytotoxicity. 33 The XTT results also indicated significant changes in the treated groups when compared to the negative control group (Figure 2B). However, while the AgNP-, Thim-, and Cd-treated cells all exhibited lower XTT-signals, consistent with cytotoxicity, the AuNP-treated cells, by contrast, were characterized by significantly higher XTT-signals (Figure 2B). The LDH results showed consistently higher levels in all treated groups compared to the negative control group (Figure 2C), confirming cytotoxicity.
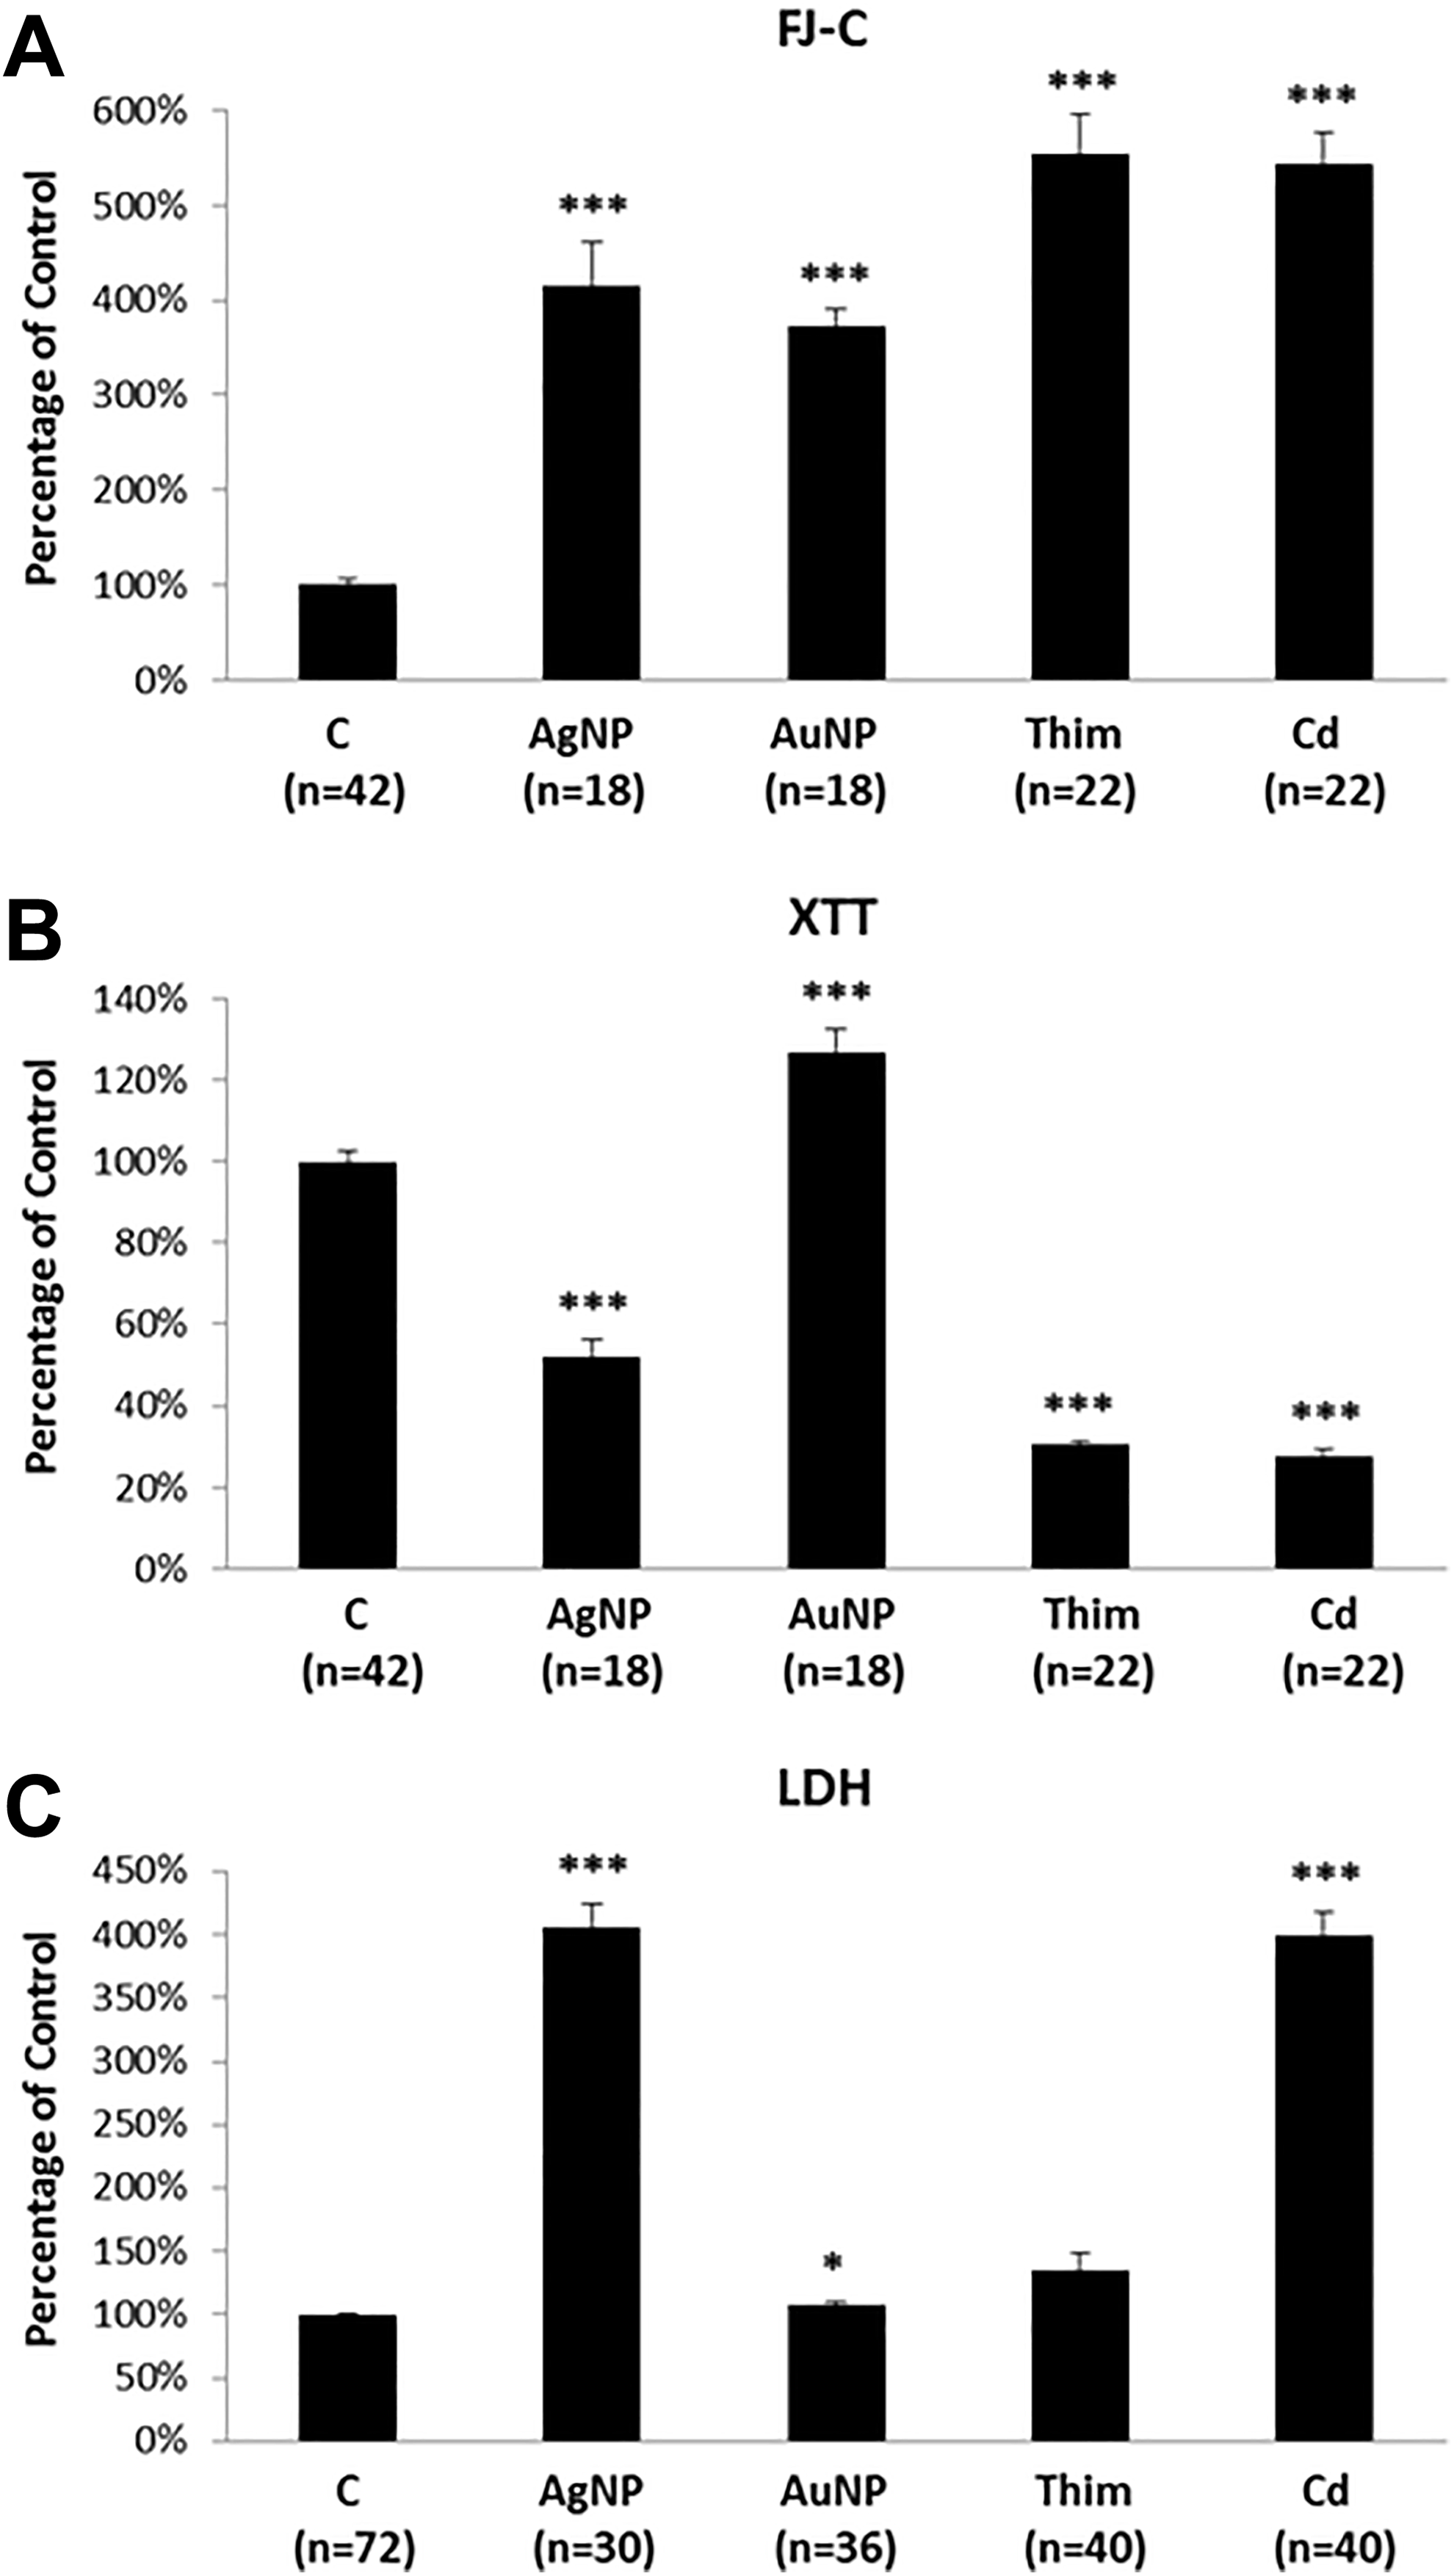
Rat brain microvessel endothelial cell (rBMVEC) cultures treated with normal culture medium (Control); 5 µg/mL Ag-NP; 50 µg/mL Au-NP; 100 µM thimerosal (Thim); or 50 µM cadmium (Cd). A: FJ-C assay, B: XTT assay and C: LDH assay. Each column represents the mean value expressed as the percentage of the respective control. Error bars represent standard errors of the mean. “n” indicates the number of cell culture dishes evaluated for each treatment group. * indicates P < 0.05 and *** = P < 0.001.
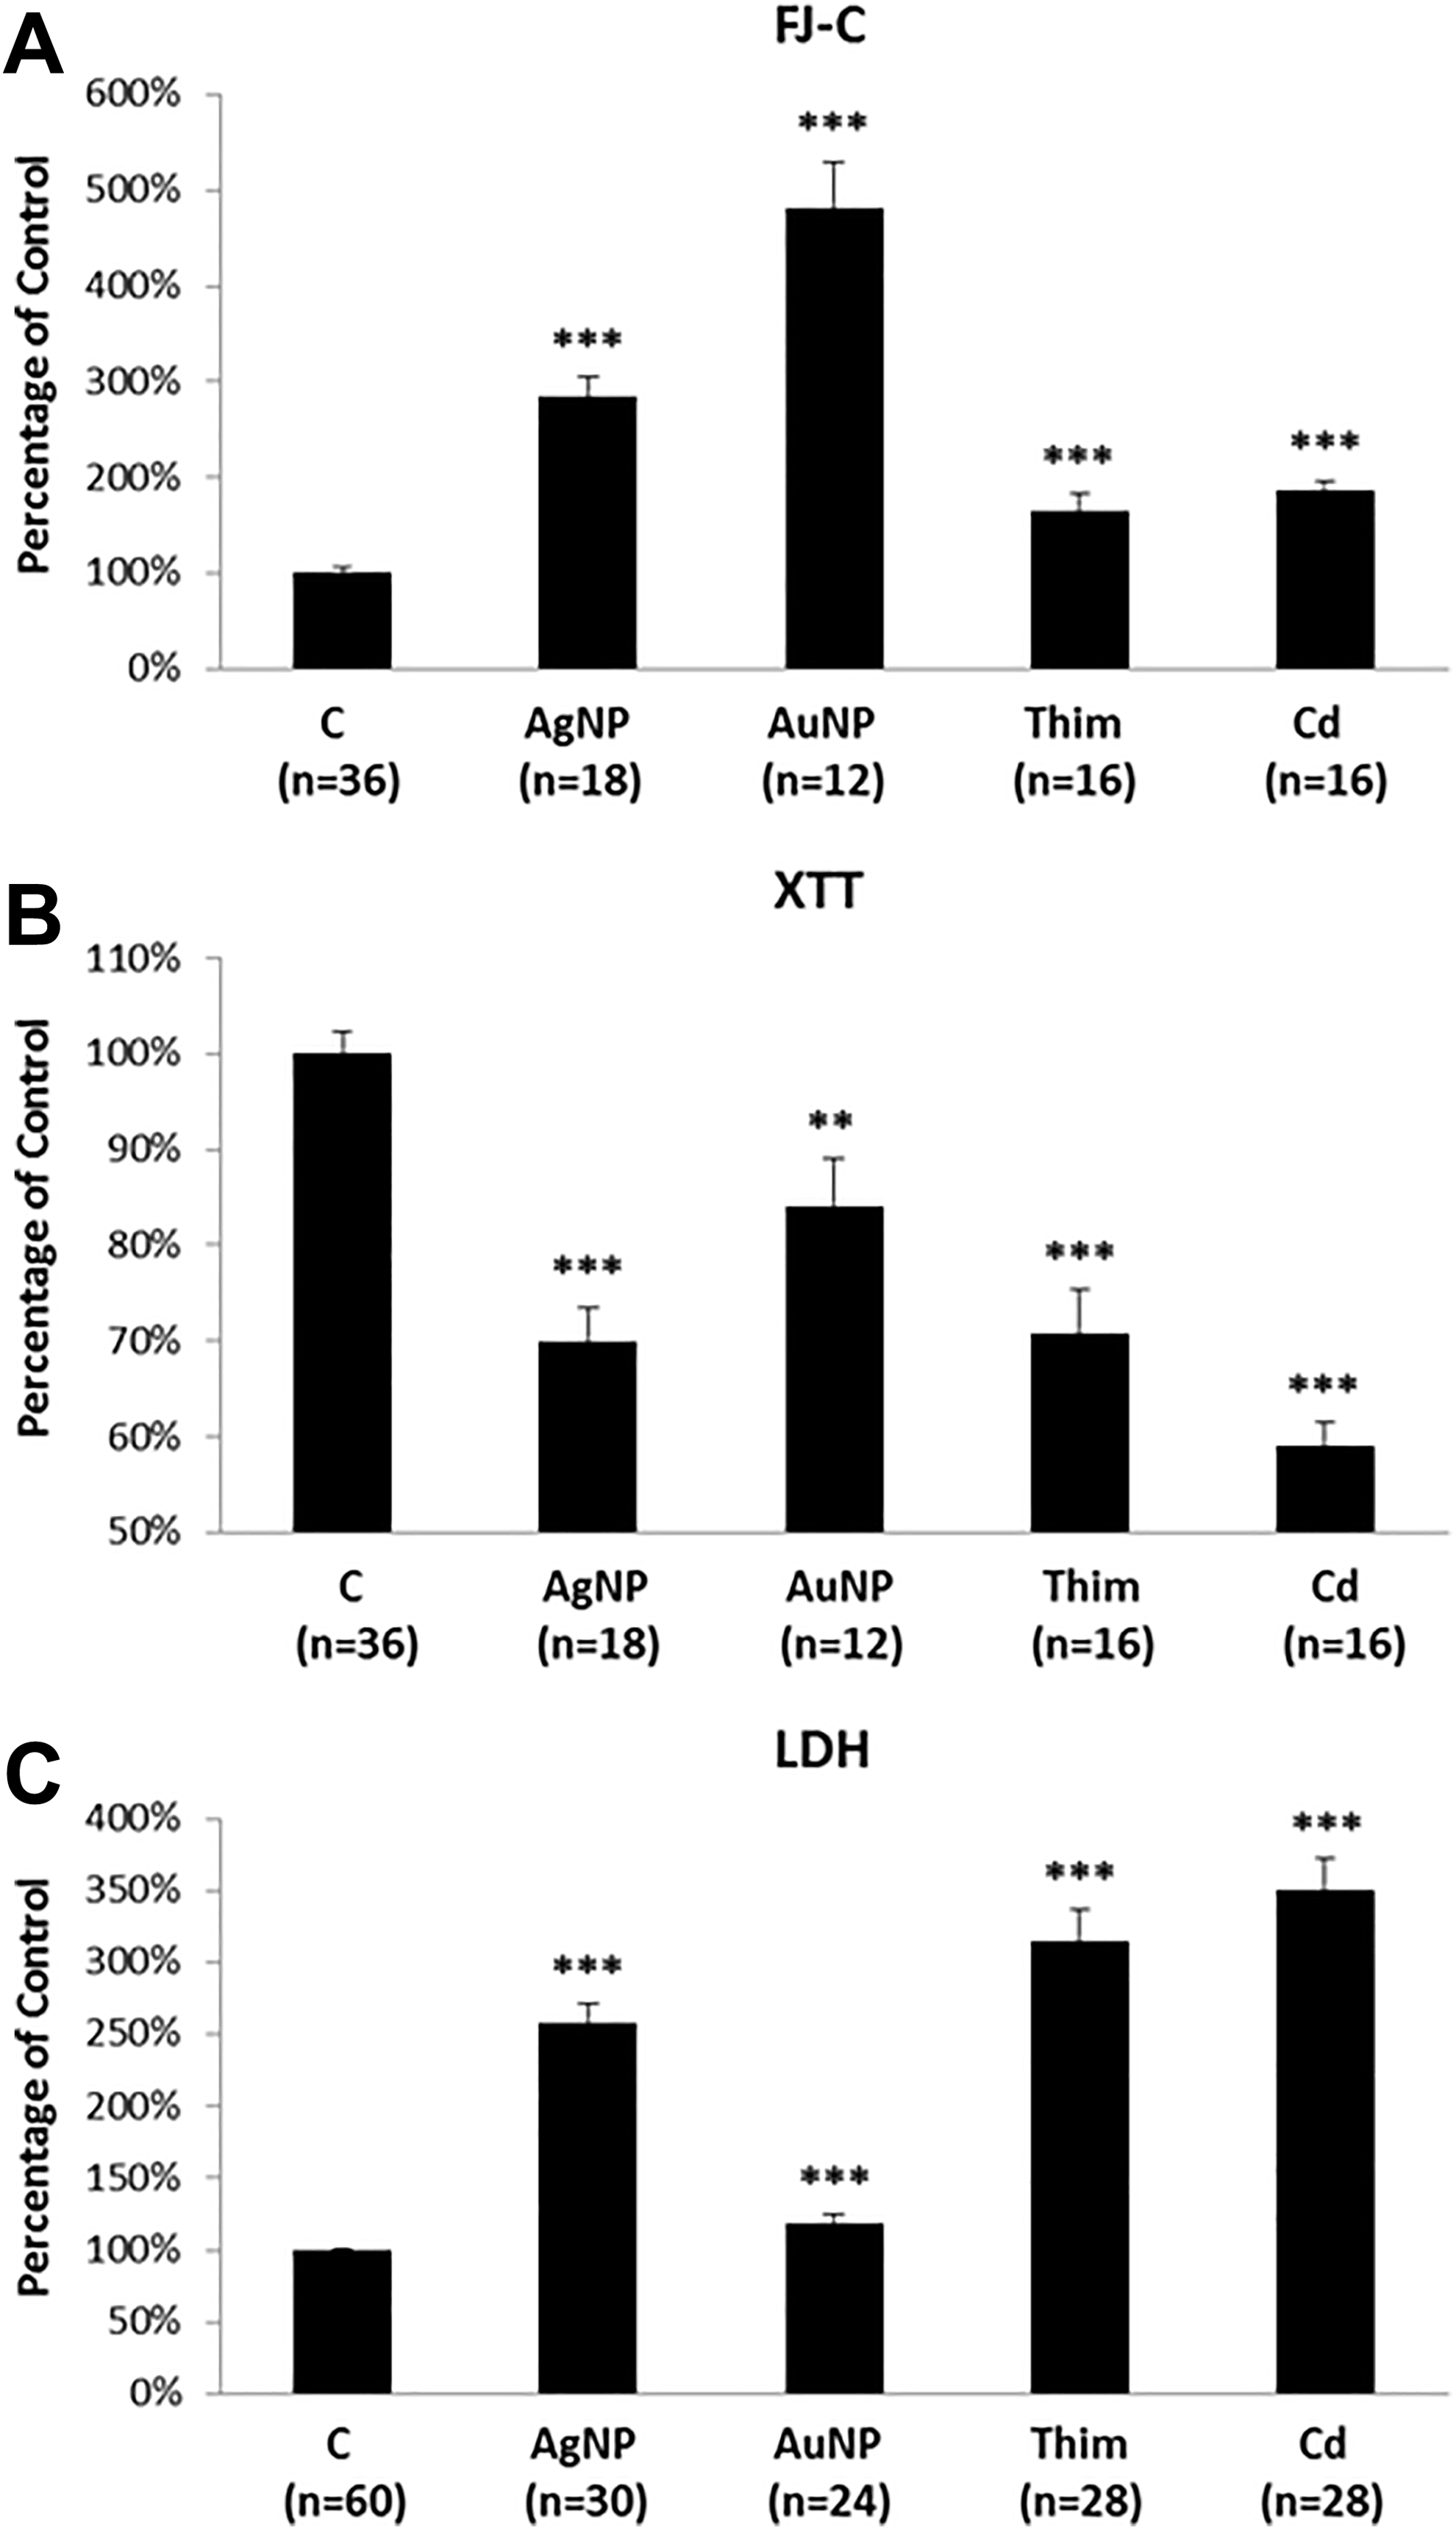
Mouse neural stem cell (NSC) cultures treated with normal culture medium (Control); 5 µg/mL Ag-NP; 50 µg/mL Au-NP; 100 µM thimerosal (Thim); or 50 µM cadmium (Cd). A: FJ-C assay, B: XTT assay and C: LDH assay. Error bars represent standard errors of the mean. “n” indicates the number of cell culture dishes evaluated for each treatment group. ** indicate P < 0.01 and *** = P < 0.001.
The same approaches were subsequently applied in the 2 additional cell cultures: NSC and the human cell line SH-SY5Y. Neural stem cell cultures showed significant increases in FJ-C labeling in all treated groups (Figure 3A), significant decreases in the XTT signal in all treated groups (Figure 3B), and significant increases in LDH levels in all treated groups (Figure 3C), consistently indicating cytotoxicity as determined by each of these assays.
Lastly, with the SH-SY5Y cultures, FJ-C labeling showed significant increases in all treated groups (Figure 4A), similar to findings in the rBMVECs and NSC. The mean XTT signals in all treated groups were significantly lower compared to that of the negative control group (Figure 4B). However, LDH release was found to be significantly increased in only the Thim- and Cd-treated groups but not in the AgNP- and AuNP-treated groups (Figure 4C). Together, these data suggest that the FJ-C assay consistently detected AgNP- and AuNP-induced cytotoxicity in all 3 tested cell culture systems and that the FJ-C results were confirmed by XTT- and/or LDH-assays in most cases.
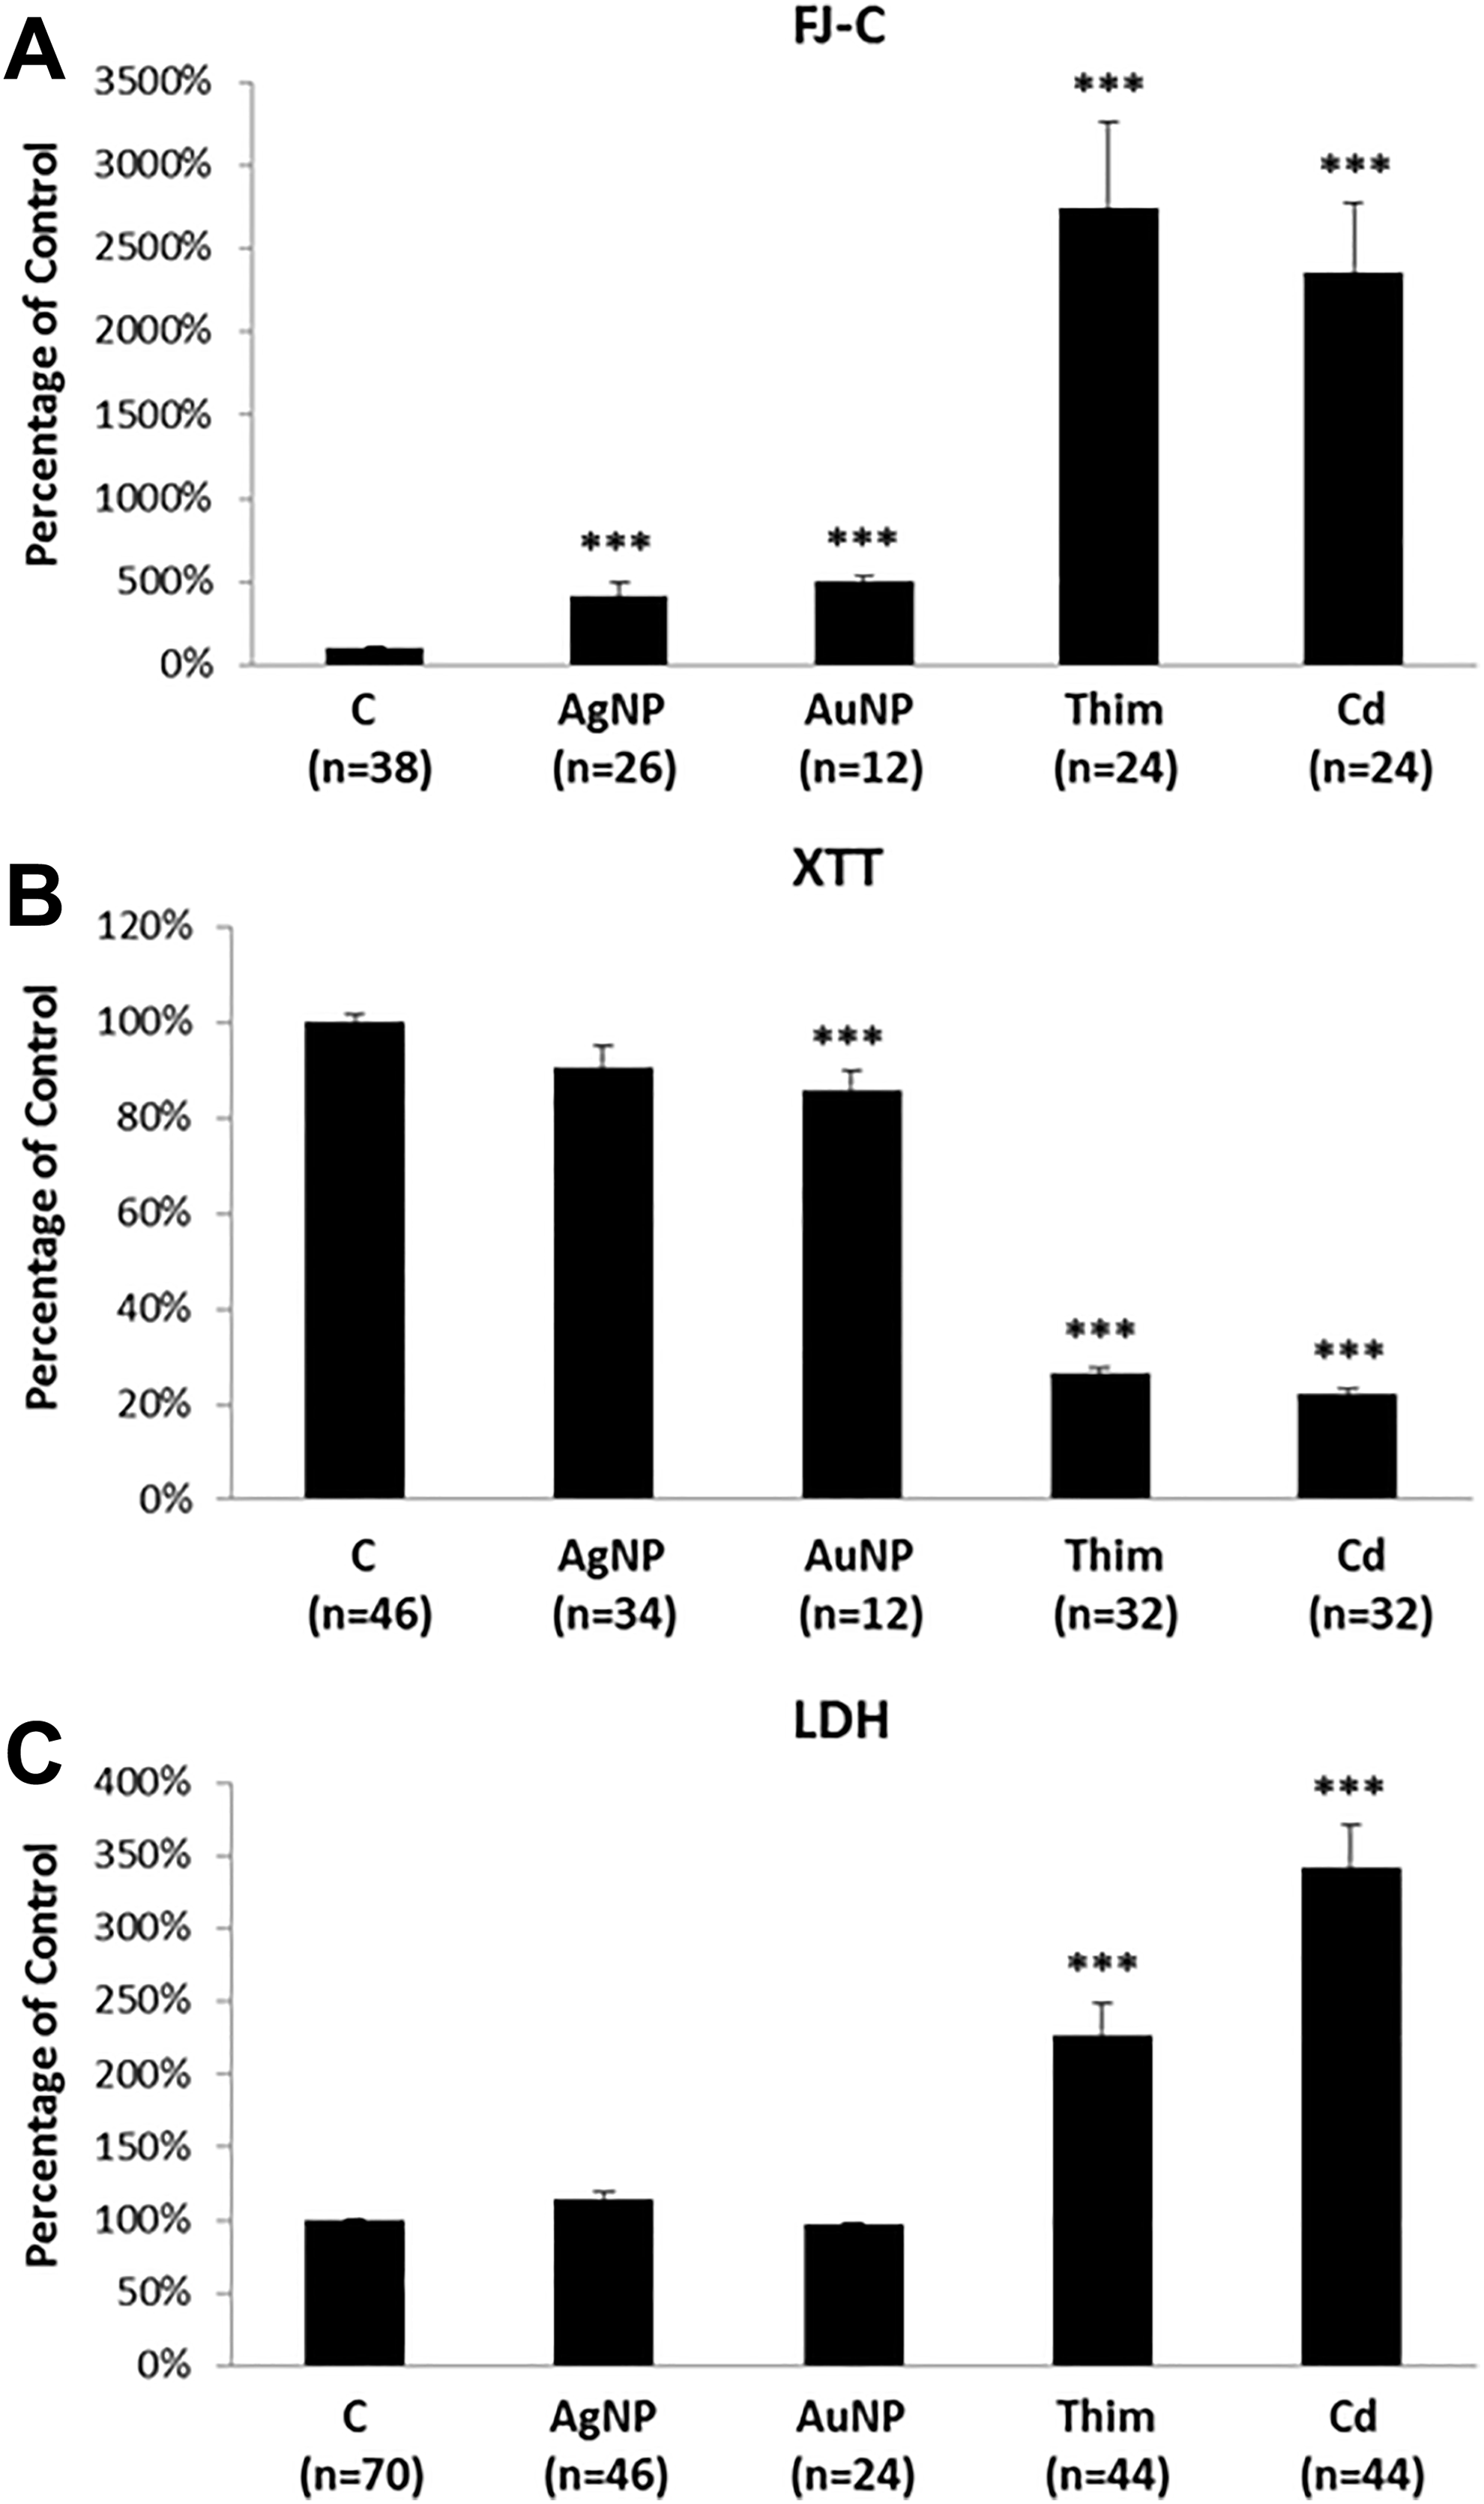
SH-SY5Y cell cultures treated with normal culture medium (Control); 5 µg/mL Ag-NP; 50 µg/mL Au-NP; 100 µM thimerosal (Thim); or 50 µM cadmium (Cd). A: FJ-C assay, B: XTT assay, and C: LDH assay. Error bars represent standard errors of the mean. “n” indicates the number of cell culture dishes evaluated for each treatment group. *** indicates P < 0.001.
The dose-dependent effects of Ag-NPs in rBMVEC cultures were then addressed along with the question of whether the observed cytotoxic effects were attributed to the Ag-NPs or Ag-ions released from the Ag-NPs. Cell culture media from which Ag-NPs have been removed by ultra-centrifugation and which contained Ag-ions released from Ag-NPs were then used to treat rBMVEC cultures which were subsequently assessed using the FJ-C, LDH, and XTT assays. The cytotoxic effects were compared to those incubated with media containing various concentrations of Ag-NPs. Figure 5 shows the results of treatments with normal (blank) culture media, with various doses of Ag-NPs in the culture media, and with the centrifuged culture media. In general, Ag-NP exposures generated dose-dependent increases in FJ-C labeling (Figure 5A) and LDH release (Figure 5C) and decreases in XTT intensities (Figure 5B). The minimal Ag-NP dose that elicited a significant change was 0.5 µg/mL as determined using the FJ-C and XTT assays, and 0.25 µg/mL as determined using the LDH assay. By contrast, once the Ag-NPs were removed from the media, the results of all 3 assays showed outcomes similar to that of the negative control groups (Figure 5). Quantitative determination of the Ag-ion amount in the centrifuged media using ICP-MS revealed that the Ag-ion amount in the culture media was 616.6 ± 5.6 ng/mL (mean ± SD). These results suggest that the cytotoxic effects observed following Ag-NP exposures were caused directly by Ag-NPs rather than by Ag-ions released from the Ag-NPs in the media.
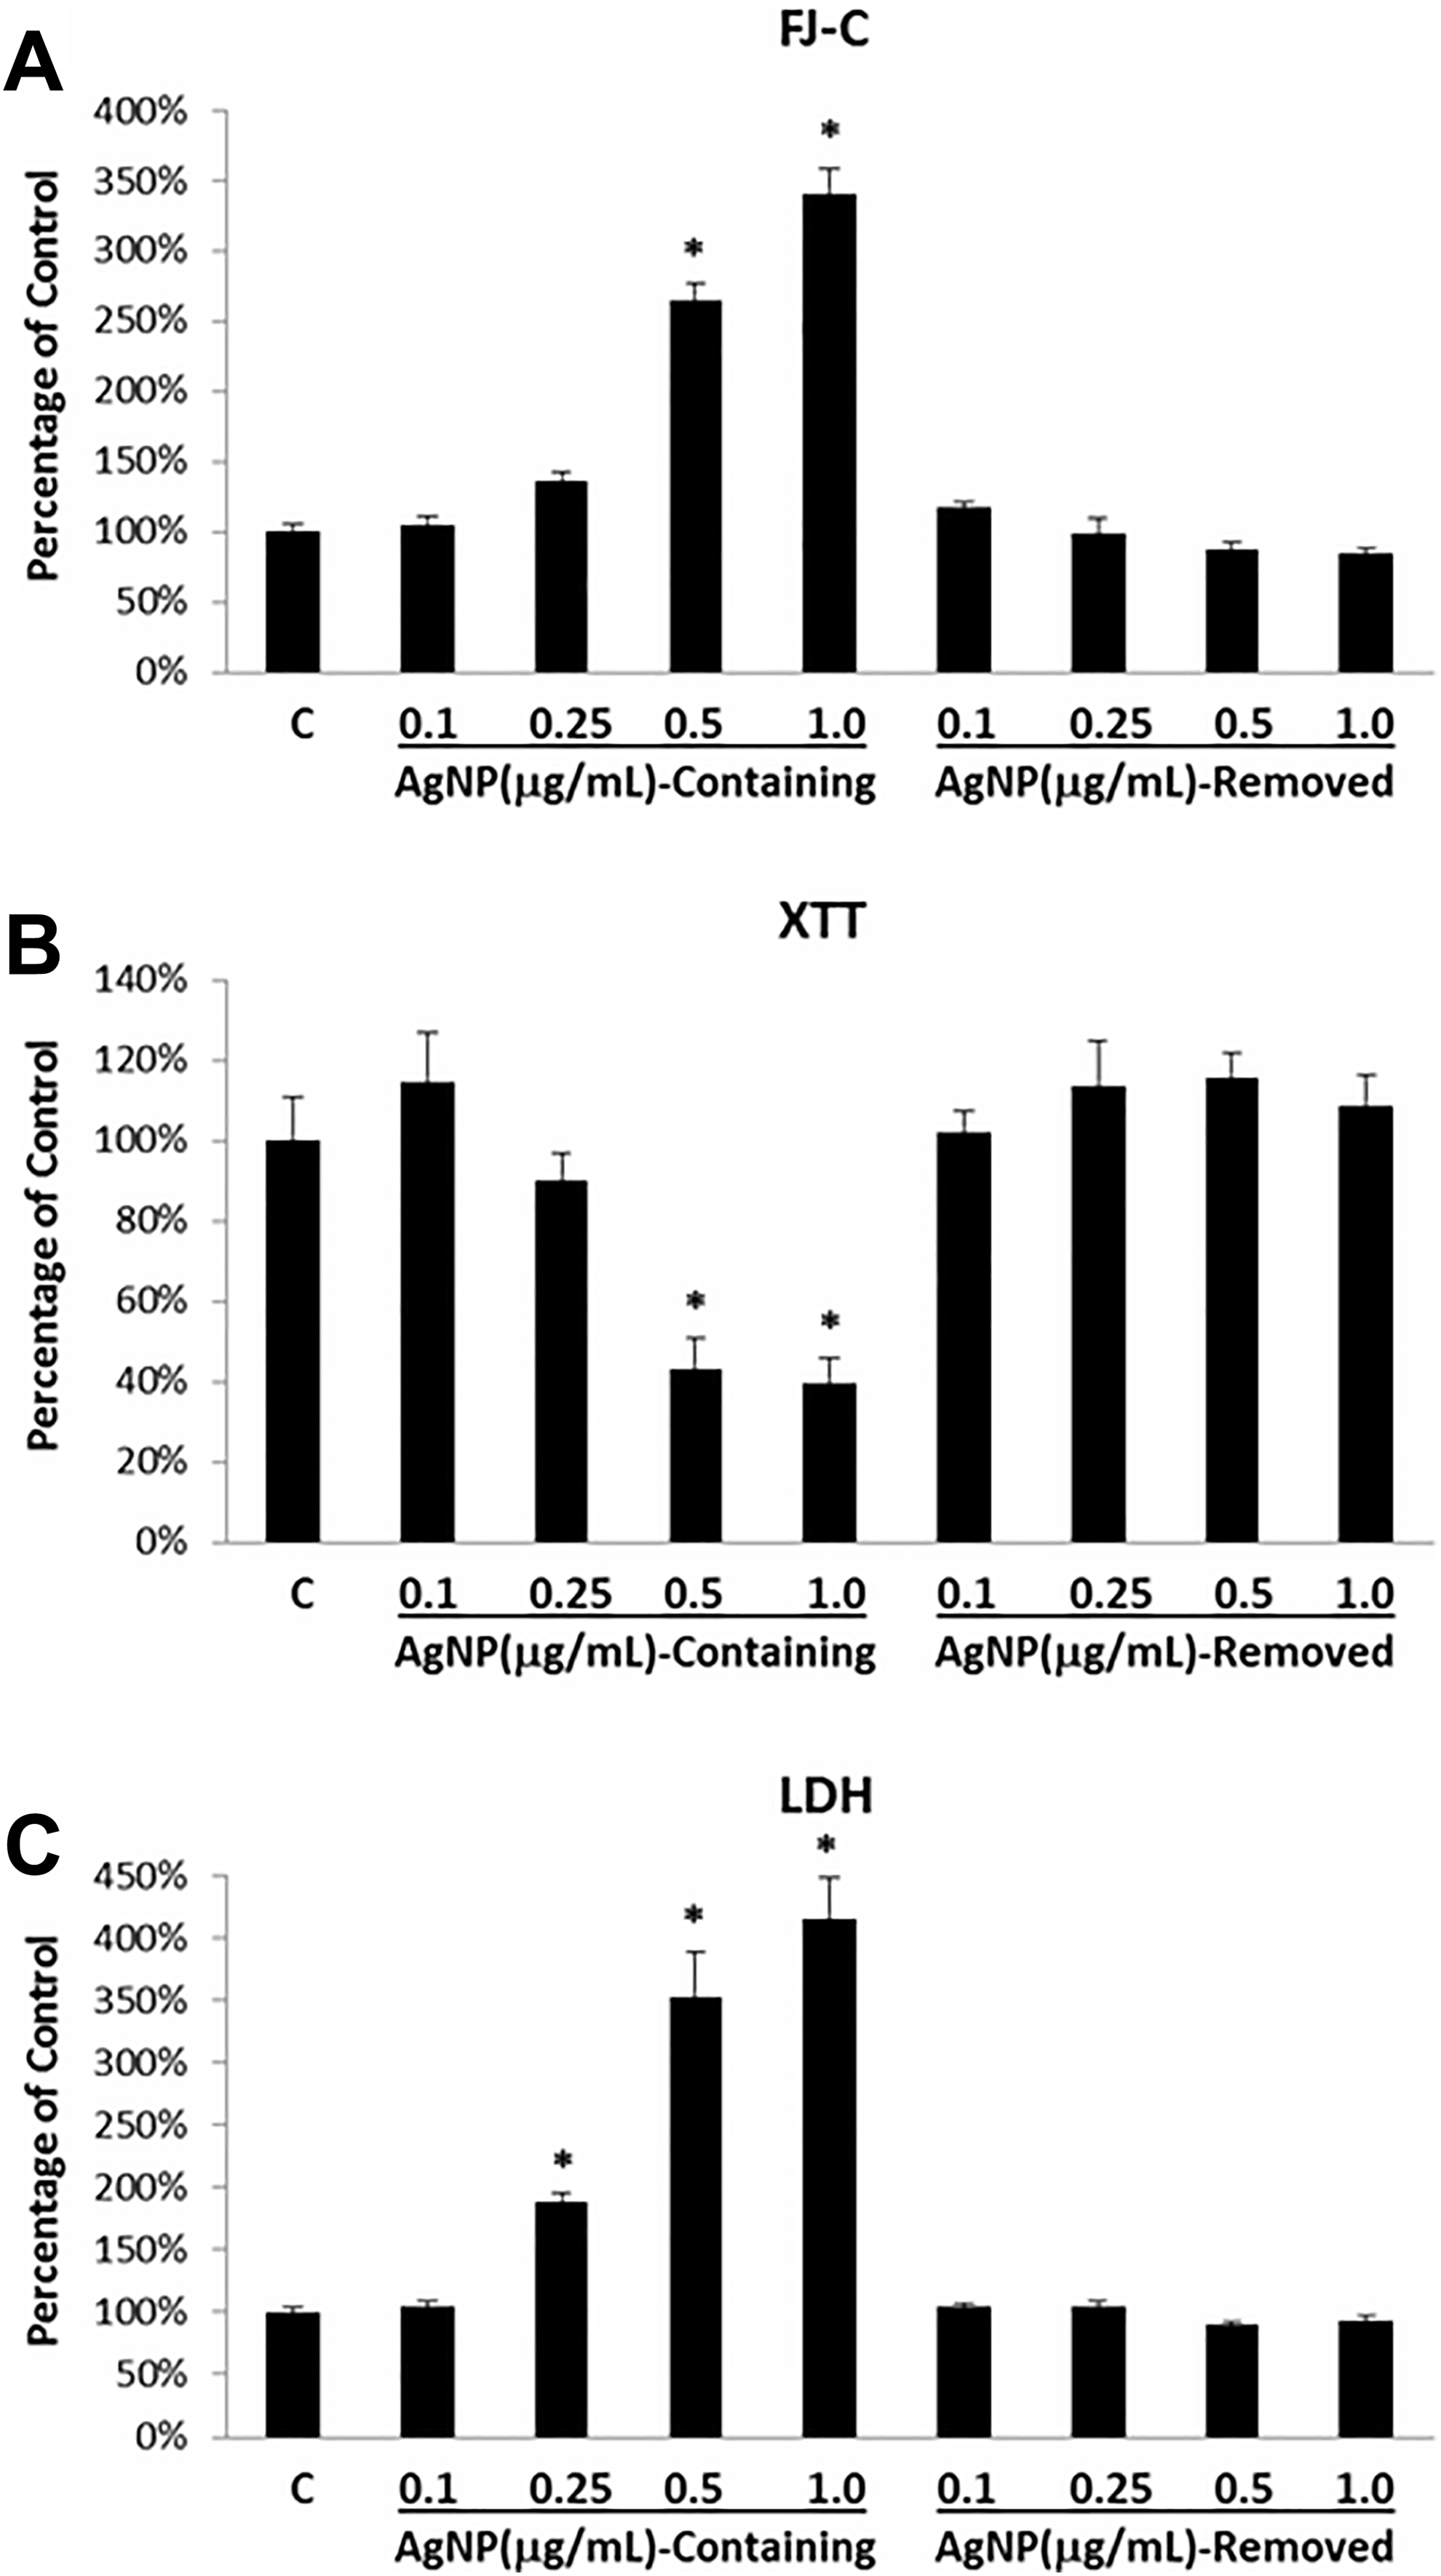
Rat brain microvessel endothelial cell cultures treated with normal culture medium (Control); various doses of Ag-NPs; or media that had the Ag-NPs removed by ultra-centrifugation. A: FJ-C assay; B: XTT assay; and C: LDH assay. For the FJ-C and XTT assay results, each column represents the average of 6 culture dishes, except for the control where it represents the average of 12 culture dishes. For the LDH assay results, each column represents the average of 12 culture dishes, except for the control where it represents the average of 24 culture dishes. Error bars represent standard errors of the mean. * indicates P < 0.05.
Using similar approaches, the question of whether NAC, an antioxidant, could prevent AgNP-induced cytotoxicity was also addressed, since oxidative stress has been suggested as an underlying mechanism of NP-induced cytotoxicity. 37 -39 After 24-hour incubation with 1 µg/mL Ag-NPs in the presence and absence of 1 mM NAC, rBMVEC cultures were subjected to the FJ-C, XTT, and LDH assays. Figure 6 shows significant increases in FJ-C labeling (Figure 6A) and LDH levels (Figure 6C) and significant decreases in XTT signals (Figure 6B) following AgNP-treatment while these effects were significantly reduced in the presence of NAC as indicated by all 3 FJ-C, XTT, and LDH assays (Figure 6), suggesting that NAC plays a protective role with respect to NP-induced cytotoxicity.
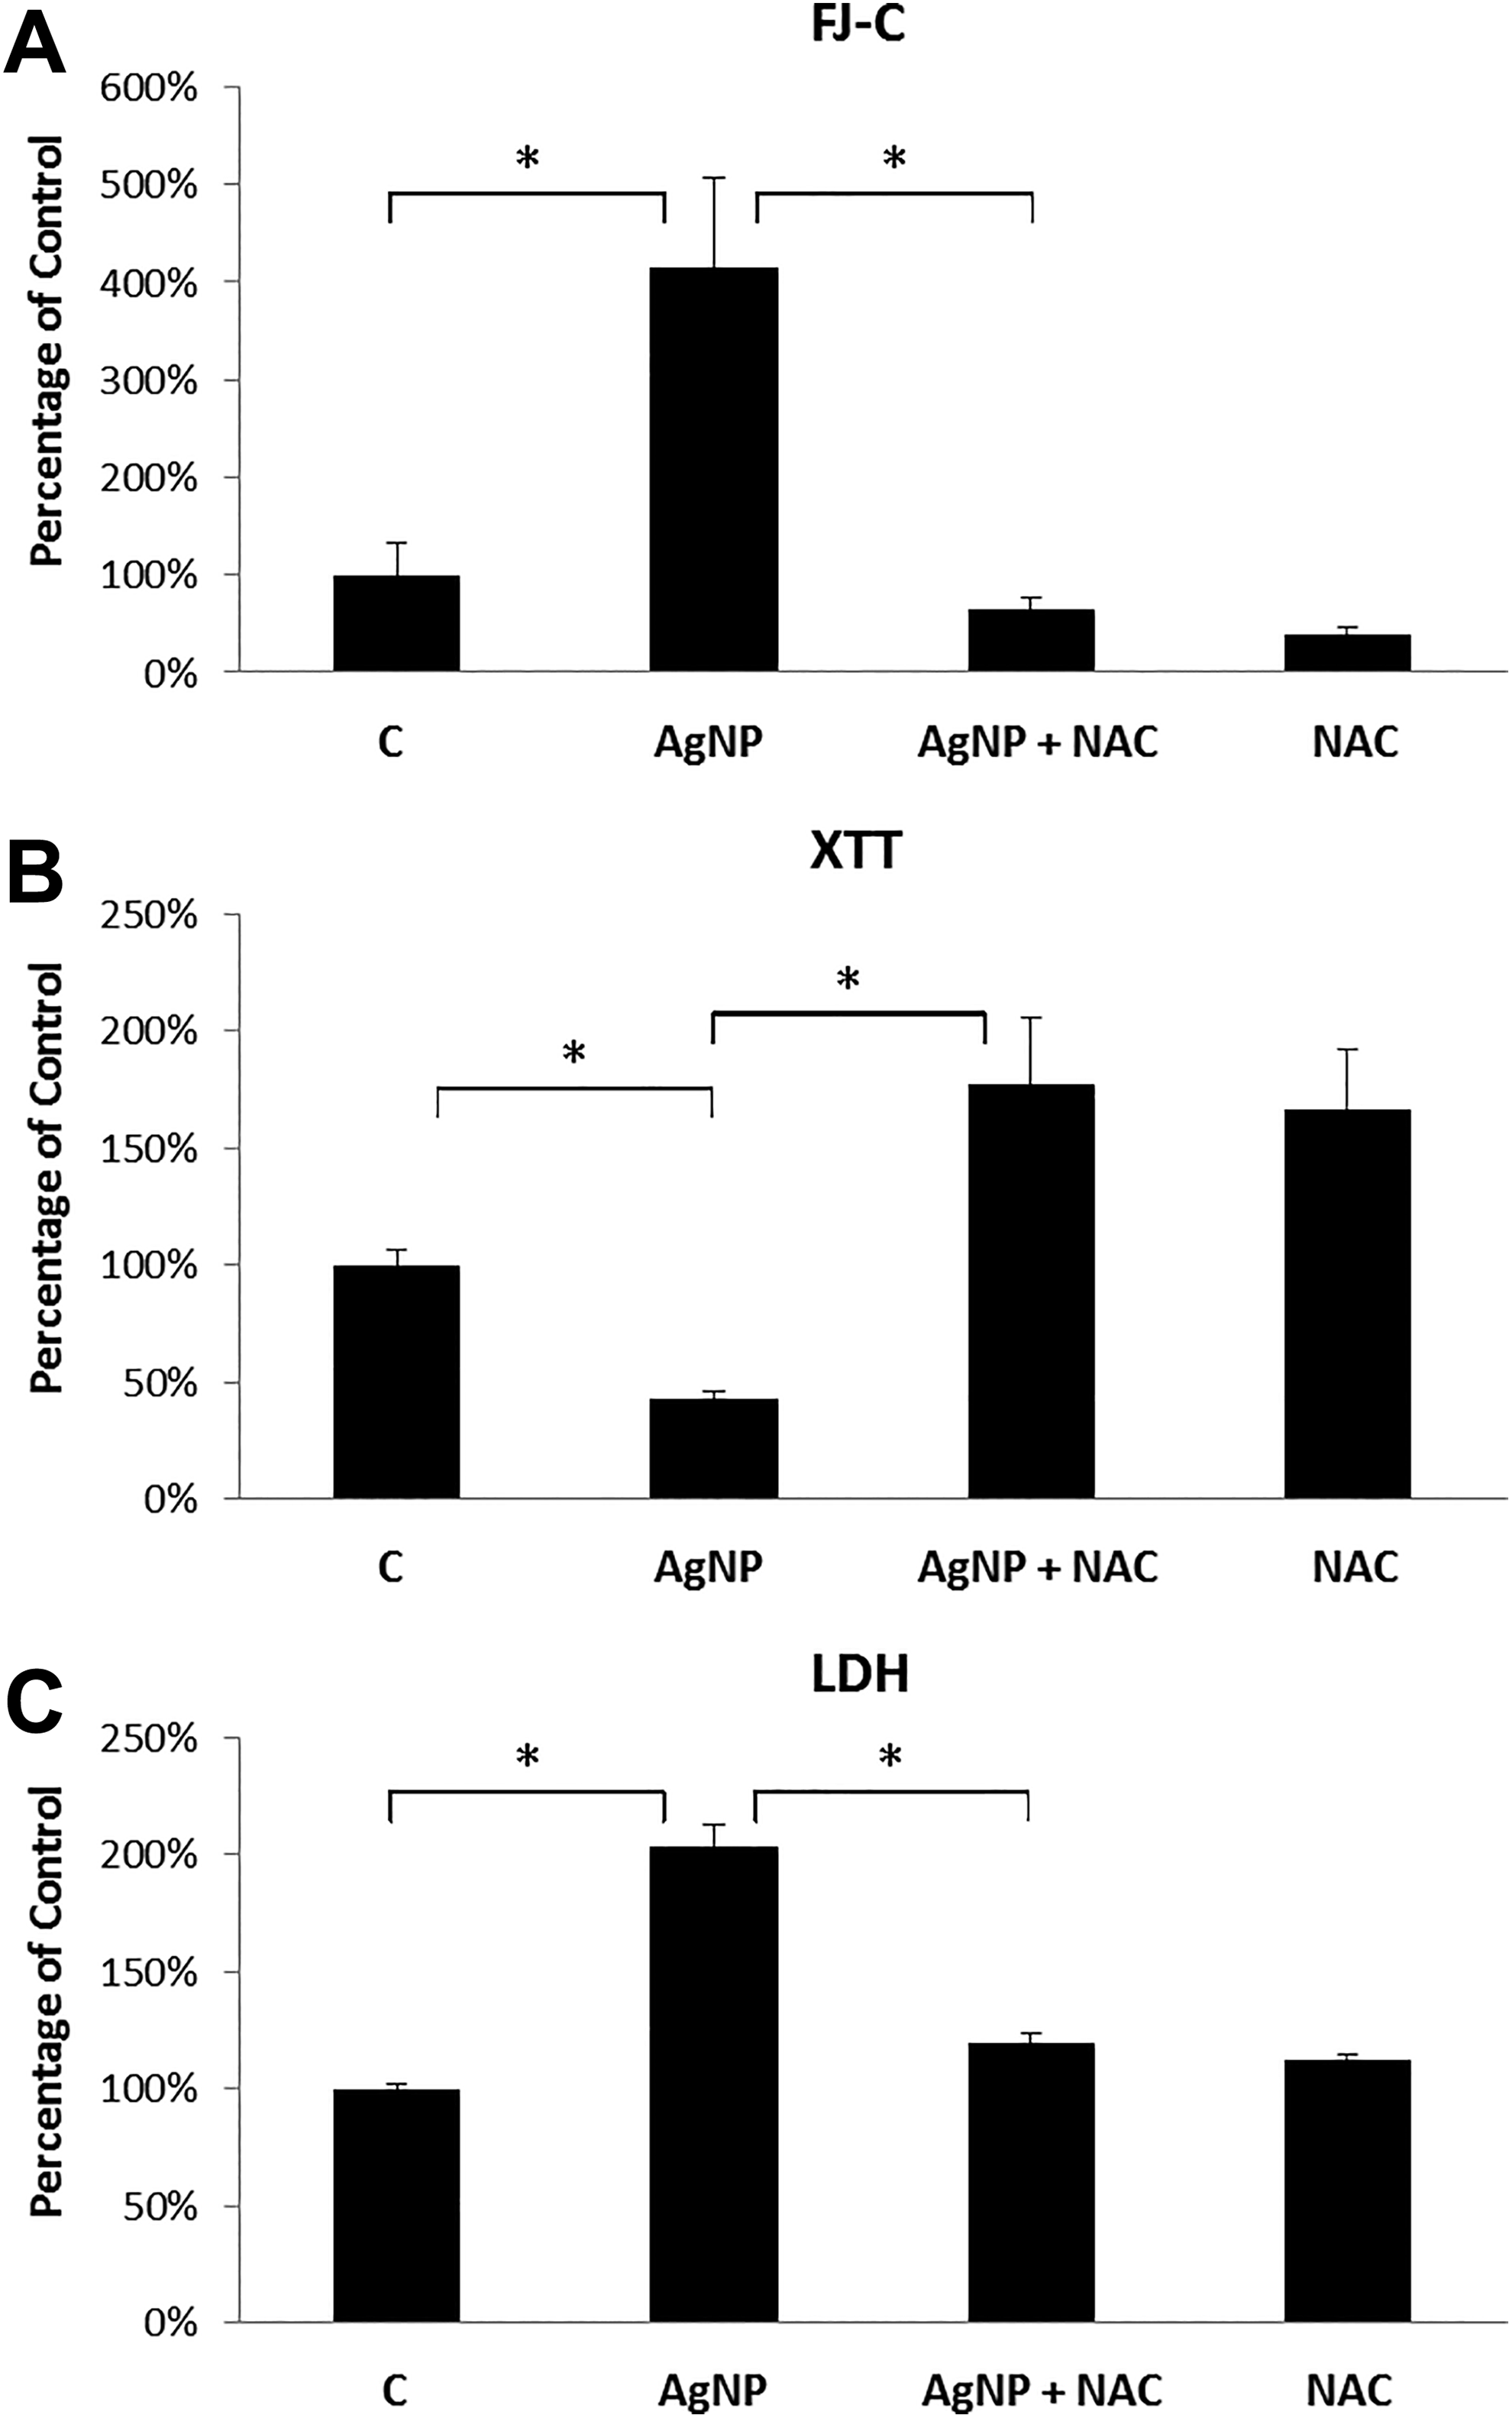
Rat brain microvessel endothelial cell cultures treated with normal culture medium (Control); 1 µg/mL Ag-NP; 1 µg/mL Ag-NP plus 1 mM NAC; or 1 mM NAC alone. A: FJ-C assay. Each column represents the average of 8 culture dishes. B: XTT assay. Each column represents the average of 14 culture dishes, except for the control where it represents the average of 20 culture dishes. C: LDH assay. Each column represents the average of 16 examined culture dishes. Error bars represent standard errors of the mean. * indicates P < 0.05.
Finally, to examine whether Ag-NPs and Au-NPs could have direct interactions with FJ-C and, thus, potentially interfere with FJ-C assays, the fluorescence intensity of 0.25 µg/mL FJ-C, in the absence or presence of 5 µg/mL Ag-NPs and in the absence or presence of 50 µg/mL Au-NPs in cell free media was measured. The fluorescence intensity of FJ-C, FJ-C with Ag-NPs, and FJ-C with Au-NPs were 44,723, 42,226, and 42,392 or 100%, 94.4%, and 94.8%, respectively. These results demonstrate no or minimal quenching of FJ-C signal intensity in the presence of either Ag-NPs or Au-NPs.
Discussion
The present study demonstrates the utility of FJ-C labeling for the assessment of NP-induced cytotoxicity in vitro. The results not only have confirmed previous reports on AgNP- and AuNP-induced cytotoxicities in rBMVECs 35,36 but also expand the characterization of the cytotoxic effects of Ag-NPs and Au-NPs to include NSCs and SH-SY5Y cells. Using Ag-NPs and rBMVECs as proof-of-concept, our results further suggest that FJ-C assays could be used to address fundamental questions such as those concerning the dose-dependent effects of NPs, the toxic effects of metal-NPs versus their associated metal-ions, and the mechanisms underlying NP-induced cytotoxicity. Since the FJ-C assay was successful in detecting cytotoxicity caused by Ag-NPs and Au-NPs in the examined cell cultures, all from different species (rat, mouse, and human) and included neuronal and endothelial cells and a tumor cell line, it seems likely that the FJ-C assay will be applicable to a wide variety of other cell types.
While the FJ-C results showed cytotoxicity in the NP-treated groups in all 3 tested cell culture systems, the XTT and LDH results did not always show toxic effects in the NP-treated groups. The negative results of the LDH- and XTT-assays are likely due to NP-mediated interference, which could also be cell-type specific as suggested elsewhere. 7,40 -43 Both LDH- and XTT-assays are colorimetric measurements and based on enzymatic activities of LDH and succinate dehydrogenase, respectively. Since both enzymes are constituently expressed and can be greatly influenced by metabolic activities, their assay’s readouts are indicative and may not be specific to cytotoxicity. For examples, exercise could increase cellular release of LDH 44 and the XTT assay has also been utilized for the determination of cell proliferation. 45 Available evidence also suggests that LDH- and XTT-assays can be interfered by NPs. 7,11 On the other hand, FJ-C labels degenerating cells and thus should be more suitable and specific for cytotoxicity evaluation. Previous studies showed auto-fluorescence of Ag-NPs and Au-NPs and their emission peaks at 470 nm 46 and 610 nm, 47 respectively, whereas FJ-C fluorescence signal peaks at 529 nm, 23 suggesting no overlap of the peak emission bands. Nevertheless, we examined potential interference of Ag-NPs and Au-NPs with FJ-C and found little change of FJ-C fluorescence intensity when FJ-C was mixed with either Ag-NPs or Au-NPs. However, since only Ag-NPs and Au-NPs were examined in the present study, caution has to be given when cytotoxicities of other NPs are evaluated using FJ-C as whether there is a quenching effect of that particular NP on FJ-C fluorescence signal. Also, because different NPs may possess different auto-fluorescence characteristics, their auto-fluorescence signals have to be in a nonoverlapping range of the FJ-C signal to avoid fluorescence interference with FJ-C.
An ongoing controversy revolves around the issue of whether the cytotoxic effects following Ag-NP exposures are caused directly by Ag-NPs or by Ag-ions released from the Ag-NPs in the incubation media. A number of previous studies attempted to address this issue by examining the cytotoxic effects of Ag-NPs and Ag-ions in parallel and comparing their effects side-by-side. 48 -55 However, most of these studies compared the effects of Ag-NPs and Ag-ions using equal weights of Ag-NPs and AgNO3. A problem with such experimental designs is that by utilizing the same weight of Ag-NPs and AgNO3, the number of Ag-particles surrounding each cell will be different because the physical size of a single Ag-NP and that of a single Ag-ion are different, which could play a critical role in terms of inducing toxic effects. Using ultra-centrifugation to remove the Ag-NPs from the media and testing the resulting Ag-NP-free solution side-by-side with normal media and media that contained Ag-NPs, this important question was addressed directly in the present study. The results serve to demonstrate that the observed cytotoxic effects can be attributed to the Ag-NPs themselves, since removal of the Ag-NPs but not the Ag-ions abolished the cytotoxic effects.
Nanoparticles-induced cytotoxicity has been suggested as being mediated through oxidative stress, such as lipid peroxidation, generation of reactive oxygen species (ROS), and depletion of glutathione. 37 -39 Participation of ROS in the cytotoxic action of Ag-NPs has already been shown in several other cell lines. 49,56,57 The present results showing that the cytotoxic effects of Ag-NPs can be significantly reduced in the presence of NAC support the oxidative stress mechanism, and moreover, that NAC can play a protective role in alleviating NP-induced cytotoxicity.
In conclusion, because abundant evidence has shown that various NPs can interfere with the outcome of existing cytotoxicity assays, development of new assays as alternatives for the assessment of NP-induced cytotoxicity is especially relevant and significant. Here, we demonstrated that the FJ-C assay consistently detected NP-induced cytotoxicity in different cell culture systems. It is anticipated that the FJ-C assay will be well suited as an alternative approach for the in vitro detection of cytotoxicity induced by nanomaterials and likely other compounds of interest.
Footnotes
Acknowledgments
We thank Susan Lantz for technical support. The information in these materials is not a formal dissemination of information by FDA and does not represent agency position or policy.
Author Contributions
Q.G. contributed to conception and design, contributed to acquisition, analysis, and interpretation, drafted manuscript, and critically revised manuscript; E.C. contributed to acquisition and analysis and critically revised manuscript; S.A. contributed to conception and design, contributed to interpretation, and critically revised manuscript; M.P. contributed to conception, contributed to interpretation, and critically revised manuscript; V.K. contributed to conception, contributed to interpretation, and critically revised manuscript; Y.J. contributed to acquisition and analysis and critically revised manuscript; Y.Z. contributed to conception and design, contributed to acquisition, analysis, and interpretation, and critically revised manuscript. All authors gave final approval and agree to be accountable for all aspects of work ensuring integrity and accuracy.
Declaration of Conflicting Interests
The author(s) declared no potential conflicts of interest with respect to the research, authorship, and/or publication of this article.
Funding
The author(s) disclosed receipt of the following financial support for the research, authorship, and/or publication of this article: This work was supported by the US Food and Drug Administration (FDA), National Center for Toxicological Research protocol numbers E0746001 and E0752401.