
Abstract
Autosomal recessive polycystic kidney disease (ARPKD) is a monogenic disease characterized by development of hepatorenal cysts, pericystic fibrosis, and inflammation. Previous studies show that mast cell (MC) mediators such as histamine induce proliferation of cholangiocytes. We observed robust MC accumulation around liver cysts, but not kidney cysts, in polycystic kidney (PCK) rats (an animal model of ARPKD). Therefore, we hypothesized that MCs contribute to hepatic cyst growth in ARPKD. To test this hypothesis, we treated PCK rats with 1 of 2 different MC stabilizers, cromolyn sodium (CS) or ketotifen, or saline. The CS treatment decreased MC degranulation in the liver and reduced serum tryptase (an MC granule component). Interestingly, we observed an increase in liver to body weight ratio after CS treatment paralleled by a significant increase in individual cyst size. Hepatic fibrosis was not affected by CS treatment. The CS treatment increased hepatic cyst wall epithelial cell (CWEC) proliferation and decreased cell death. Ketotifen treatment also increased hepatic cyst size. In vitro, CS treatment did not affect proliferation of isolated hepatic CWECs from PCK rats. In contrast, CS decreased kidney to body weight ratio paralleled by a significant decrease in individual cyst size. The percentage of kidney to body weight ratio was strongly correlated with serum renin (an MC granule component). Ketotifen did not affect kidney cyst growth. Collectively, these data suggest that CS affects hepatic and renal cyst growth differently in PCK rats. Moreover, CS may be beneficial to renal cystic disease but may exacerbate hepatic cyst growth in ARPKD.
Introduction
Congenital hepatic fibrosis (CHF) associated with autosomal recessive polycystic kidney disease (ARPKD) is a serious hepatic ciliopathy for which no curative pharmacologic treatments exist. 1 Dysfunctional cholangiocyte cilia, due to mutations in PKHD1 and production of aberrant polyductin/fibrocystin protein, are critical for disease pathogenesis. 2,3 Thirty percent of neonatal patients with CHF/ARPKD succumb to disease due to pulmonary hypoplasia secondary to grossly enlarged, cystic kidneys 4 ; those who survive the perinatal period may be plagued by recurrent episodes of acute cholangitis, severe portal hypertension, and development of esophageal varices due to the progression of pericystic fibrosis. The conditions of adult patients with CHF/ARPKD are often further complicated due to the development of biliary malignancies. 5,6
Previous research has identified several pathways that contribute to cyst wall epithelial cell (CWEC) proliferation and pericystic fibrosis in CHF/ARPKD. In CWECs, these mechanisms include reduced intracellular calcium, increased cyclic adenosine monophosphate (cAMP) production and cAMP-mediated signaling, and increased production of pro-proliferative cytokines, including interleukin 6 (IL-6), epidermal growth factor, vascular endothelial growth factor (VEGF), and insulin-like growth factor 1. 7 -9 Therapeutic interventions targeting these pathways attenuate disease progression. 8 In addition, pericystic fibrosis is reduced in polycystic kidney (PCK) rats after treatment with pioglitazone, a peroxisome proliferator-activated receptor-γ agonist, 10 and increased activation of the renin- and angiotensin-converting enzyme system in PKD, consistent with severe portal hypertension that occurs in patients with CHF/ARPKD, is attenuated after treatment with telmisartan, an angiotensin receptor blocker. 11 However, even with these advances in our understanding of disease pathogenesis, pharmacologic interventions for patients with CHF/ARPKD have not led to significant improvements in patient outcome. Indeed, transplant remains the only cure for this disease.
Mast cells (MCs) are cells of the innate immune system with a broad range of effector activity. 12 They synthesize and store many molecules, including chymase, tryptase, histamine, and renin, in large cytoplasmic granules which they release during tissue injury and in response to other stimuli. 13,14 An MC produces a diverse array of cytokines, chemokines, and growth factors, including IL-6 and VEGF. 15,16 In addition to their well-known roles in allergy, 17 MCs exhibit profibrotic activity 18 as well as growth-promoting activity for cholangiocytes after bile duct ligation in rats and mice. 19,20 The MCs are also associated with human liver disease. 21 They are increased in the portal area of cirrhotic patients 22 and are considered pathogenic in human cholangiocarcinoma. 23 An abundant literature suggests that MCs are associated with inflammatory and fibrotic disease. 18 Further, MCs are found surrounding the human biliary tree and the number of MCs increases in the liver in patients with ARPKD. 24 The MCs also participate in the pathogenesis and progression of biliary disease in other animal models. 25,26 However, no studies have explored the role of MCs in CHF/ARPKD. Here, we sought to test the hypothesis that MCs are involved in the progression of CHF/ARPKD and are the common link between a triumvirate of pathogenic mechanisms (inflammation, proliferation, and fibrosis 27 ) involved in this disease.
Materials and Methods
Animals
Polycystic kidney (an orthologous model of human ARPKD) rats and normal Sprague-Dawley (SD) were obtained from Charles River Laboratories (Kingston, New York). Pkhd1LSL(−)/LSL(−) mice (an accepted mouse model of human ARPKD) were a kind gift from Dr Christopher J. Ward (University of Kansas Medical Center, KUMC). 28 Animal treatment was approved by and performed in accordance with the Institutional Animal Care and Use Committee at KUMC.
Treatments and Tissue Collection
The PCK rats were injected intraperitoneal with saline or cromolyn sodium (CS) based on a previous study by Hei et al (50 mg/kg/d 29 ) or ketotifen fumarate (1 mg/kg/d) from postnatal day (PND) 15 to PND 30. Both CS and ketotifen were purchased from Sigma-Aldrich (St. Louis, Missouri). The treatment period was chosen based on the starting time point of MC infiltration in PCK rats (PND 15, Figure 1B) and the observed development of cysts and fibrosis from our earlier work. 30 Rats were euthanized at PND 31. Pkhd1LSL(−)/LSL(−) mice were injected with saline or CS from PND 30 to PND 45. The treatment period was chosen based on the initiation of observable cysts and fibrosis in the liver. 28 The liver, kidney, and plasma were collected for further analysis as previously described. 31
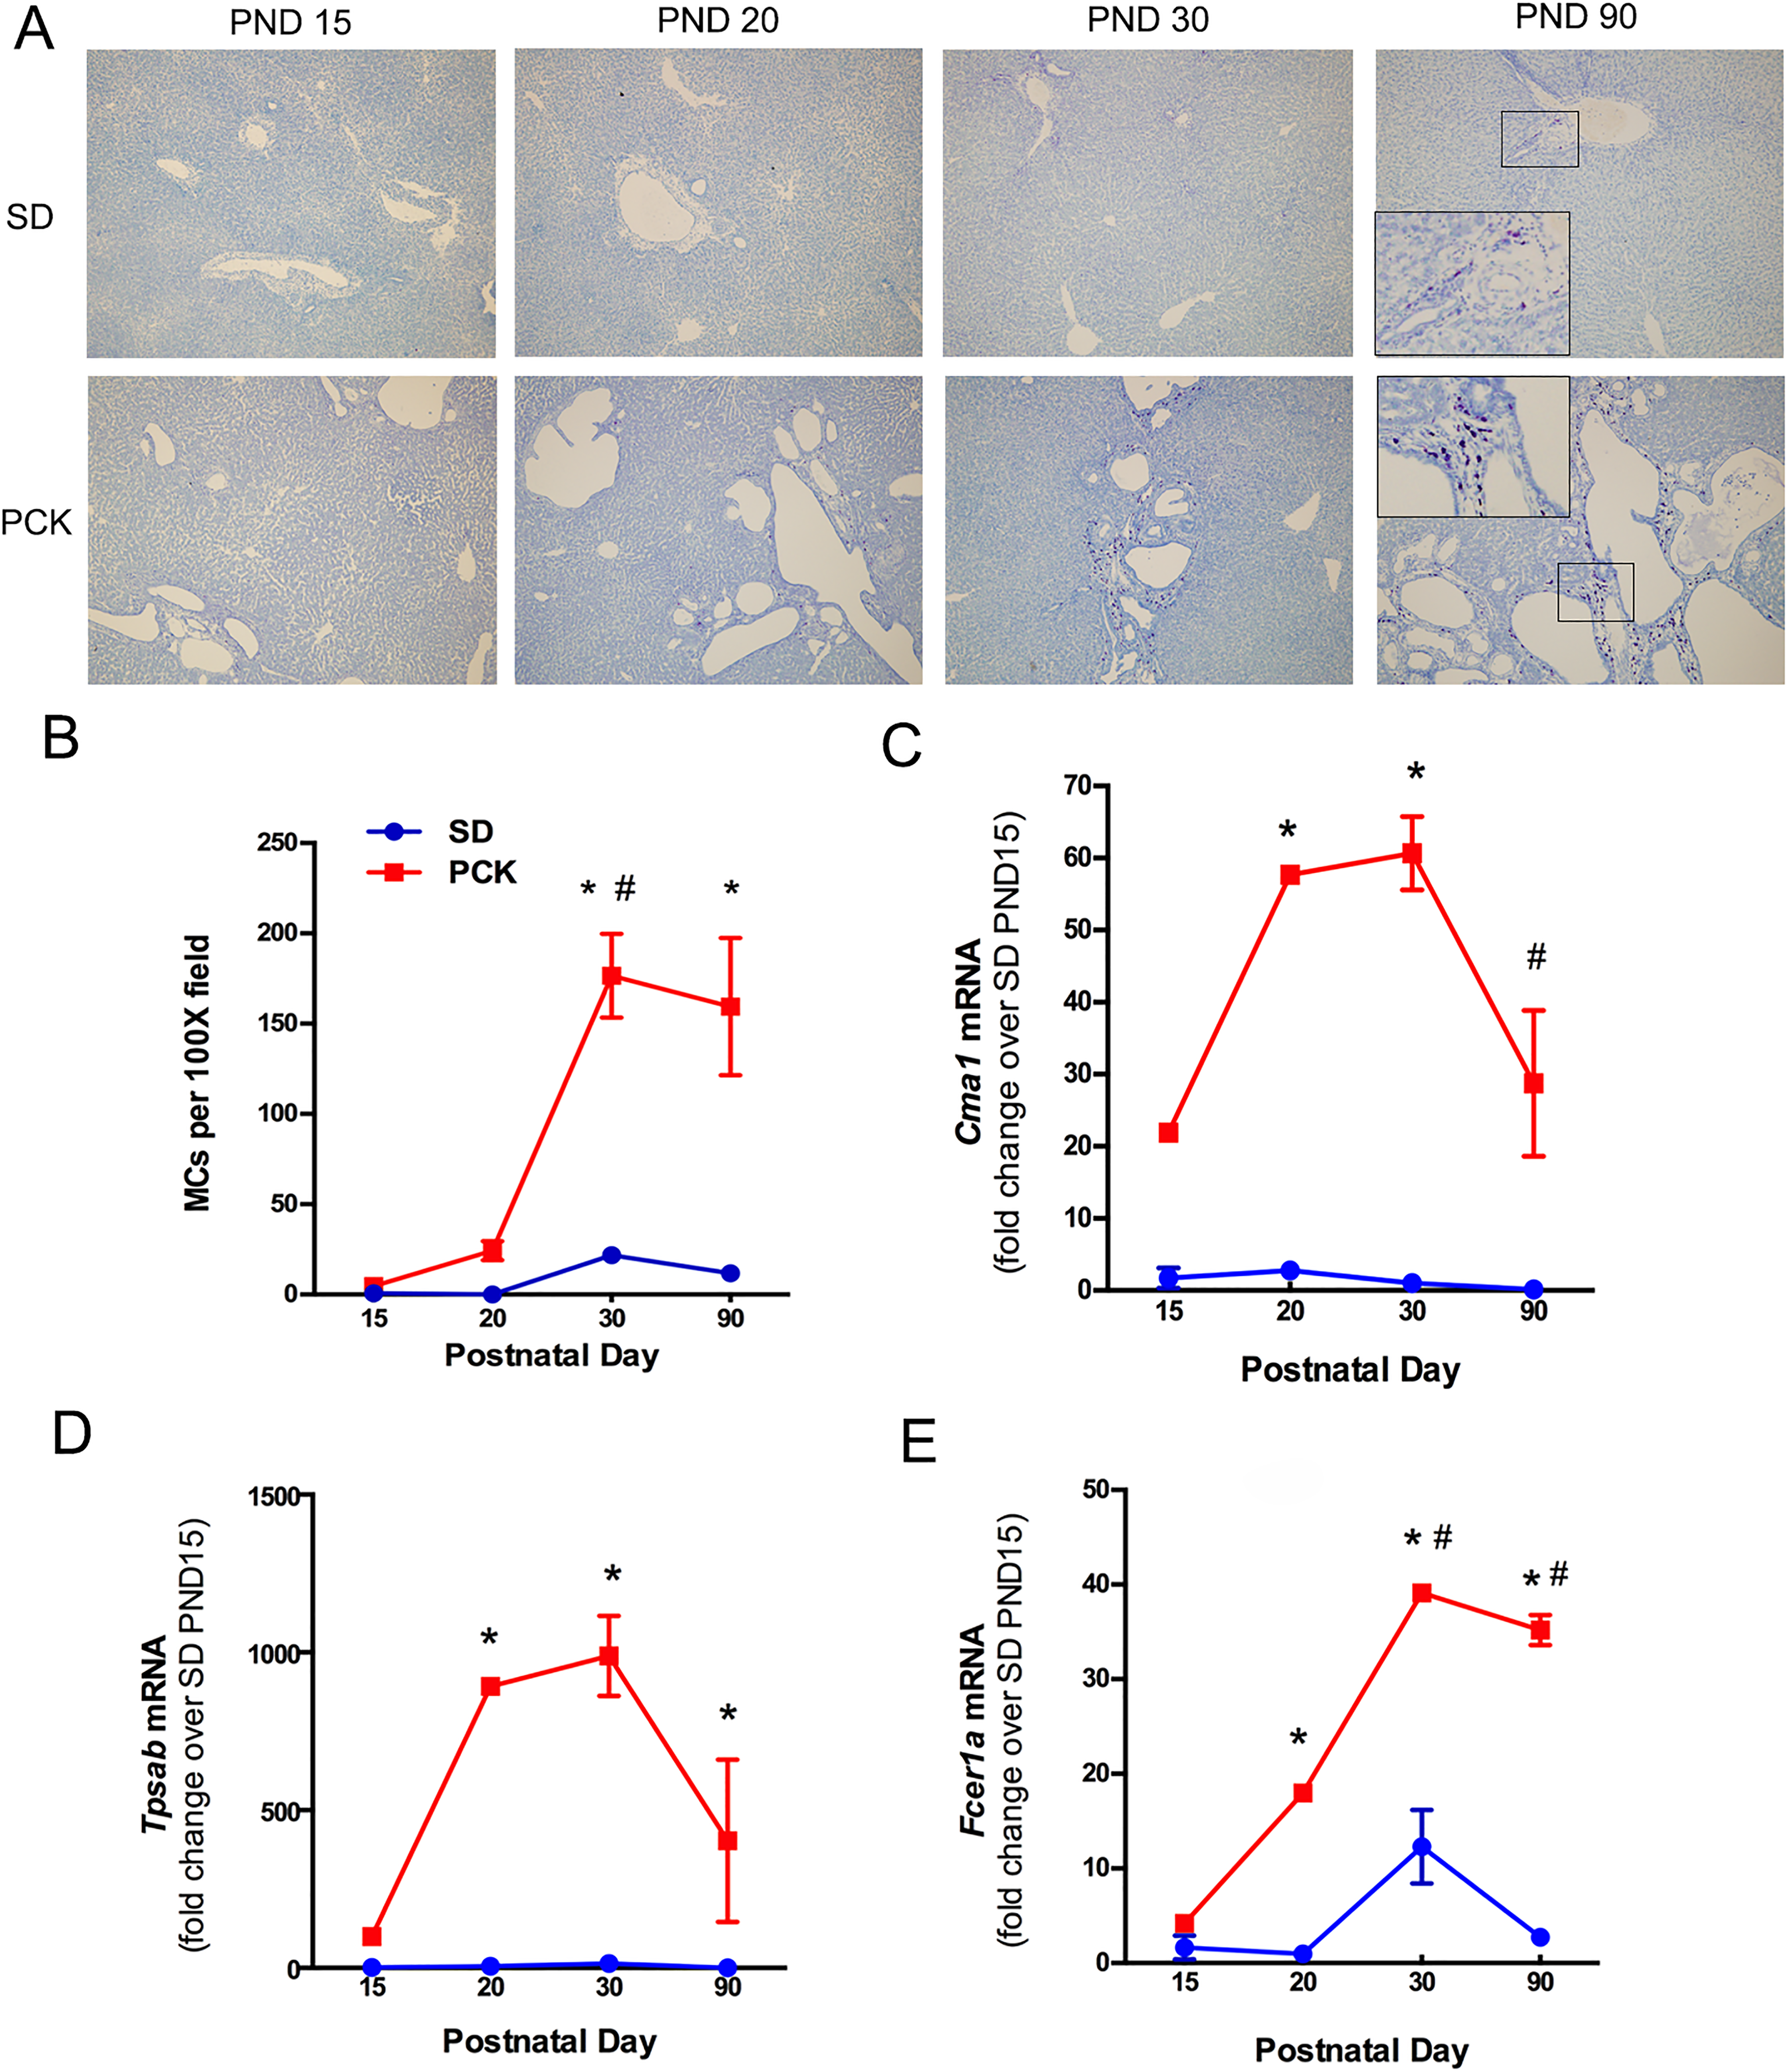
Mast cell infiltration in SD and PCK rat livers. A, Representative images of toluidine blue-stained livers from SD and PCK rats from postnatal day (PND) 0 to PND 90. Images were taken at 100× magnification. B, Quantification of mast cell (MC) number over time. C-E, MC-associated gene expression, Cma1, Tpsab, and Fcer1a, was measured by real-time PCR in SD and PCK rat livers from PND 0 to PND 90. N = 3 to 4 rats per group. * P < .05 between genotypes at the indicated time point. # P < .05 compared to previous time point within a genotype. PCK indicates polycystic kidney; PCR, polymerase chain reaction; SD, Sprague-Dawley.
Histological Analysis
The liver and kidneys were preserved in 10% buffered formalin, embedded in paraffin, and stained with hematoxylin and eosin (H&E). Average cyst size per liver section was calculated as the ratio of cystic area and the number of cysts. Cell death was assessed by terminal deoxynucleotidyl transferase dUTP nick end labeling (TUNEL) staining using the In Situ Cell Death Detection Kit, TMR red (Roche Applied Science, Indianapolis, Indiana). Ki67 staining was performed on frozen sections (5 μm thick) as described before. 31 ImageJ (National Institutes of Health; version 1.51w/13 March 2018) was used to quantify TUNEL staining and Ki67 staining by a blinded individual. For TUNEL staining, data were expressed as percentage of TUNEL-positive cyst all epithelial cells (CWECs) over total number of CWECs. For Ki67 staining, data were expressed as Ki67-positive CWECs (for the liver, or non-CWECs for the kidney) over total number of CWECs (for the liver, or non-CWECs for the kidney).
Sirius Red Staining
Formalin-fixed, paraffin-embedded (5 μM) liver sections were stained with 0.1% Sirius red solution as previously described. 32 All images were taken at 100× magnification with an Olympus BX51 microscope with an Olympus BH2RFLT3 burner and Olympus DP71 camera operated by DP controller software (Olympus, Waltham, Massachusetts). Five nonoverlapping images were acquired per liver section. One liver section per rat in each experimental group was photographed (n = 4-6 rats per group). ImageJ was used to quantify the area of positive staining and intensity of that staining above an arbitrary threshold which remained constant for all images.
Toluidine Blue Staining
Toluidine blue staining was performed on formalin-fixed, paraffin-embedded (5 μM) liver sections as described by Kennedy et al. 33 Briefly, liver sections were deparaffinized, rehydrated, and stained with toluidine blue working solution (pH 2.0-2.5). After staining, 200× images were taken using an Olympus DP71 camera and later quantified by ImageJ using a constant threshold to differentiate “nondegranulated” MCs from “degranulated” MCs, based on the intensity of purple staining. A “degranulated” MC can be identified by loss of granule staining and visible release of granules. A “nondegranulated” MC maintains intact cell structure and retains intense granule staining. Total MC number was counted manually using the “Cell Counter” function from ImageJ. The MCs above threshold were counted as “nondegranulated.” The number of “degranulated MC” was calculated by subtracting “nondegranulated” MC number from total MC number. All images were coded and analyzed by a blinded observer.
RNA Isolation, Complementary DNA Synthesis, and Real-Time Polymerase Chain Reaction
Total RNA was isolated from RNAlater-stabilized tissue using an RNeasy Mini Kit (Qiagen, Valencia, California). Four micrograms of RNA were reverse transcribed into complementary DNA (cDNA) using a Retroscript Kit (Life Technologies/Ambion, Grand Island, New York). SYBR green (Universal Super Mix, BioRad, Hercules, California) was used for real-time polymerase chain reaction (PCR). Results were calculated using 2−ΔΔCt method. The data were expressed as fold change over saline-treated animals. 18S was used as the housekeeping gene and did not differ between treatment groups or genotypes. Primers utilized in this study are listed in Table 1.
Primers Used for Real-Time PCR Transcript Analysis.
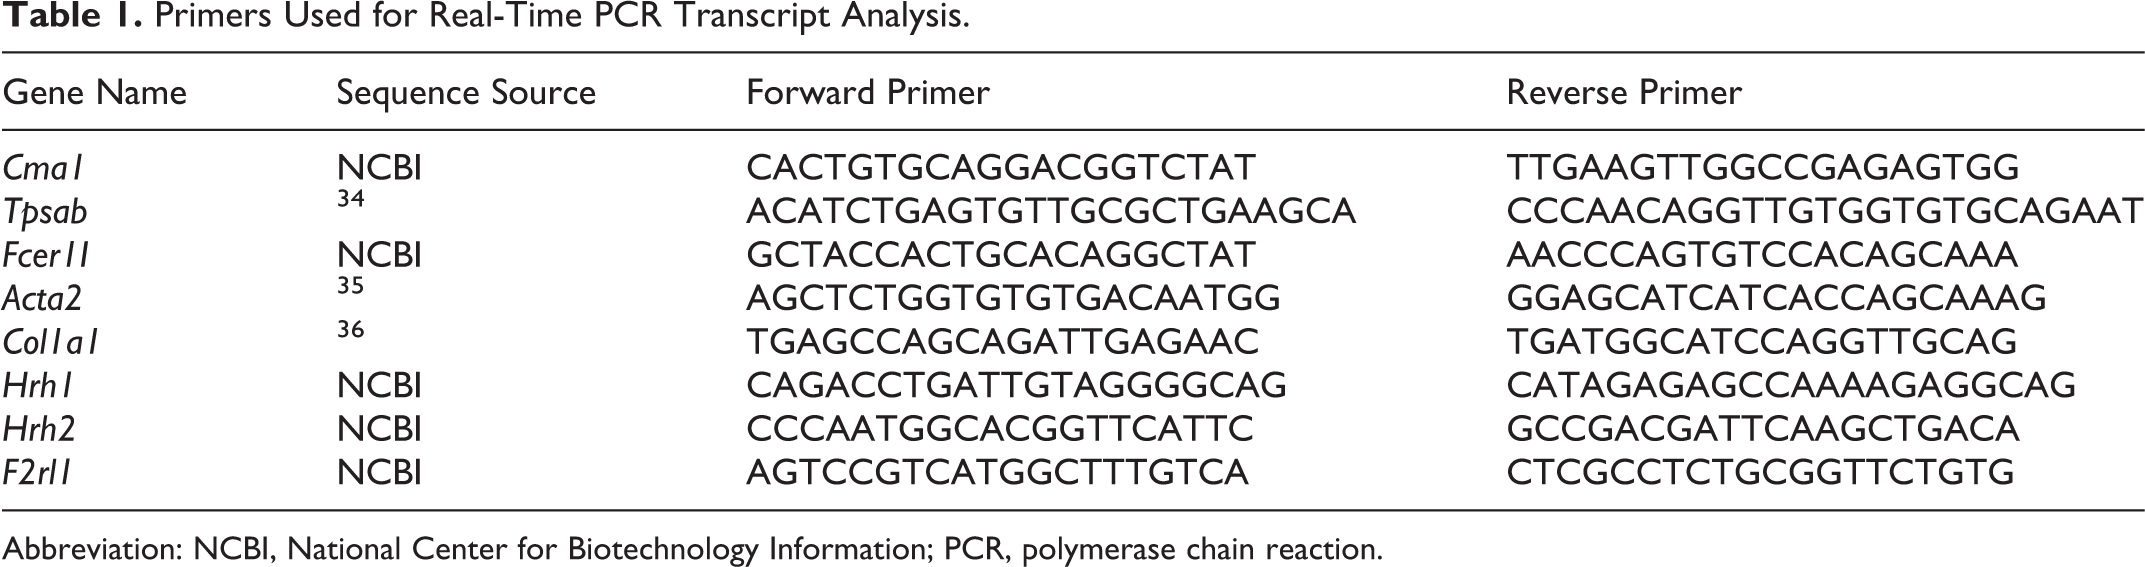
Abbreviation: NCBI, National Center for Biotechnology Information; PCR, polymerase chain reaction.
Serum Histamine, Tryptase, and Renin Measurement
Histamine release was measured in serum by histamine enzyme-linked immunosorbent assay (EIA) kits following the manufacturer’s instruction (Cayman Chemical, Ann Arbor, Missouri). Tryptase release was measured in serum by rat tryptase (TPS) enzyme-linked immunosorbent assay (ELISA) Kit (Neo Scientific, Cambridge, Massachusetts). Renin release was measured in serum by rat renin-1 ELISA Kit (RayBiotech, Norcross, Georgia).
Total Collagen Calculation by Hydroxyproline Assay
Hydroxyproline level was measured in the liver as described by Reddy and Enwemeka. 37 Briefly, 10-mg liver tissue was weighed and subjected to digestion in 12 N hydrochloric acid (100 μL) and water (100 μL) at 120°C for 3 hours. The samples were vortexed every 30 to 40 minutes during digestion to achieve complete homogenization. The supernatant was collected following centrifugation at 10,000g for 10 minutes. Samples were incubated with chloramine T (100 μL) at room temperature for 25 minutes. Ehrlich reagent (100 μL) was added and the samples were incubated at 60°C for 35 minutes. Absorbance was measured at 550 nm. Hydroxyproline concentration was calculated using a standard curve. The amount of collagen was estimated by dividing the hydroxyproline concentration by 12.5% as shown in the referred paper. 37
Cyst Wall Epithelial Cell Isolation and Cell Proliferation Assay
The CWECs from PCK rats were isolated as described by LaRusso et al and Jiang et al. 30, 38 Briefly, the biliary tree was isolated following liver perfusion at 37 C. The biliary tree was then cut into small pieces and digested in Modified Eagle Medium containing 25 mM HEPES (Sigma-Aldrich), 10 mg hyaluronidase (Sigma-Aldrich), 8 mg collagenase P (Roche Applied Science), and 6 mg DNase (Sigma-Aldrich) for 45 minutes in a 42°C water bath. The tissue pieces were then washed and cultured in collagen-coated plates. After 2 to 3 days of culture, proliferating cysts were digested and CWEC plated as a monolayer. A cell proliferation assay was performed as described by Yamaguchi et al. 39 In brief, cells were treated with various concentrations (10, 25, 50, and 100 μM) of CS for 48 hours. Cell proliferation was determined based on the production of formazan using CellTiter 96 Aqueous One Solution Cell Proliferation Assay (Promega, Madison, WI). The amount of formazan is directly proportional to the living cell number in culture.
Statistics
All results are represented as mean ± standard error of mean. Student t test was used to calculate differences between the 2 groups. One-way analysis of variance (ANOVA) or 2-way ANOVA was used depending on comparisons performed. Tukey adjustment for multiple comparisons was used where appropriate. A Pearson correlation was done to determine the relationship between 2 independent variables. In each case, statistical significance was defined as P ≤ .05.
Results
Mast Cells Infiltrates the Pericystic Area of PCK Rats
To determine whether or not MC infiltration was increased in PCK rats, we stained liver sections from SD and PCK rats at PND 15, PND 20, PND 30, and PND 90 using toluidine blue, a histological stain that stains MC granules dark purple 40 (Figure 1A). The number of MCs was low in both SD and PCK rats at PND 15 and PND 20. The MC infiltration in PCK rats exhibited an increase at PND 30, and the number was significantly greater than that in SD rats (Figure 1B). The MC number did not increase further in either strain at PND 90 (Figure 1B). To confirm the presence of MCs at the transcript level, we performed real-time PCR to measure MC-specific target gene expression. Chymase (Cma1) and tryptase (Tpsab), 2 MC serine proteases, and Fc∊ receptor I α (Fcer1a), the receptor that binds immunoglobulin E on MCs, 41 were all increased in livers from PCK rats when compared to SD rats from PND 15 to PND 90 (Figure 1C-E). By PND 90, the transcripts for Cma1 declined relative to their levels at PND 30 in PCK rats (Figure 1C). Transcripts for Tpsab and Fcer1a remained elevated even at PND 90 (Figure 1D and E).
Evaluation of MC Degranulation and Granule-Associated Receptors in PCK Rats
Degranulation is one mechanism by which MC can promote cell proliferation, inflammation, and fibrosis. 33, 42,43 Therefore, we next sought to determine whether or not the MCs found in livers from PCK rats were degranulated. First, we used toluidine blue to assess granule content in hepatic MCs. A threshold differentiating a “nondegranulated” MC from a “degranulated” MC was set based on morphological differences described in “Method” section (Figure 2A). Using this objective approach, the number and percentage of nondegranulated versus degranulated MCs was determined in livers from PCK rats. We found that the number and percentage of degranulated MCs was greater at PND 30 than PND 20 (Figure 2B and C). The number of degranulated MCs did not change from PND 30 to PND 90 (Figure 2B and C), and the percentage of degranulated MCs at PND 90 was not different than that found at PND 20 (Figure 2B and C). We further evaluated the expression of 2 histamine receptors, H1R (Hrh1) and H2R (Hrh2), using biliary tree samples from SD and PCK rats. Our data suggest that both of their expression did not differ between SD and PCK rats (Figure 2D and E). Interestingly, protease-activated receptor-2 (PAR2, F2rl1), a tryptase receptor, was expressed significantly higher in PCK rat biliary trees compared to biliary trees from SD rats (Figure 2F).
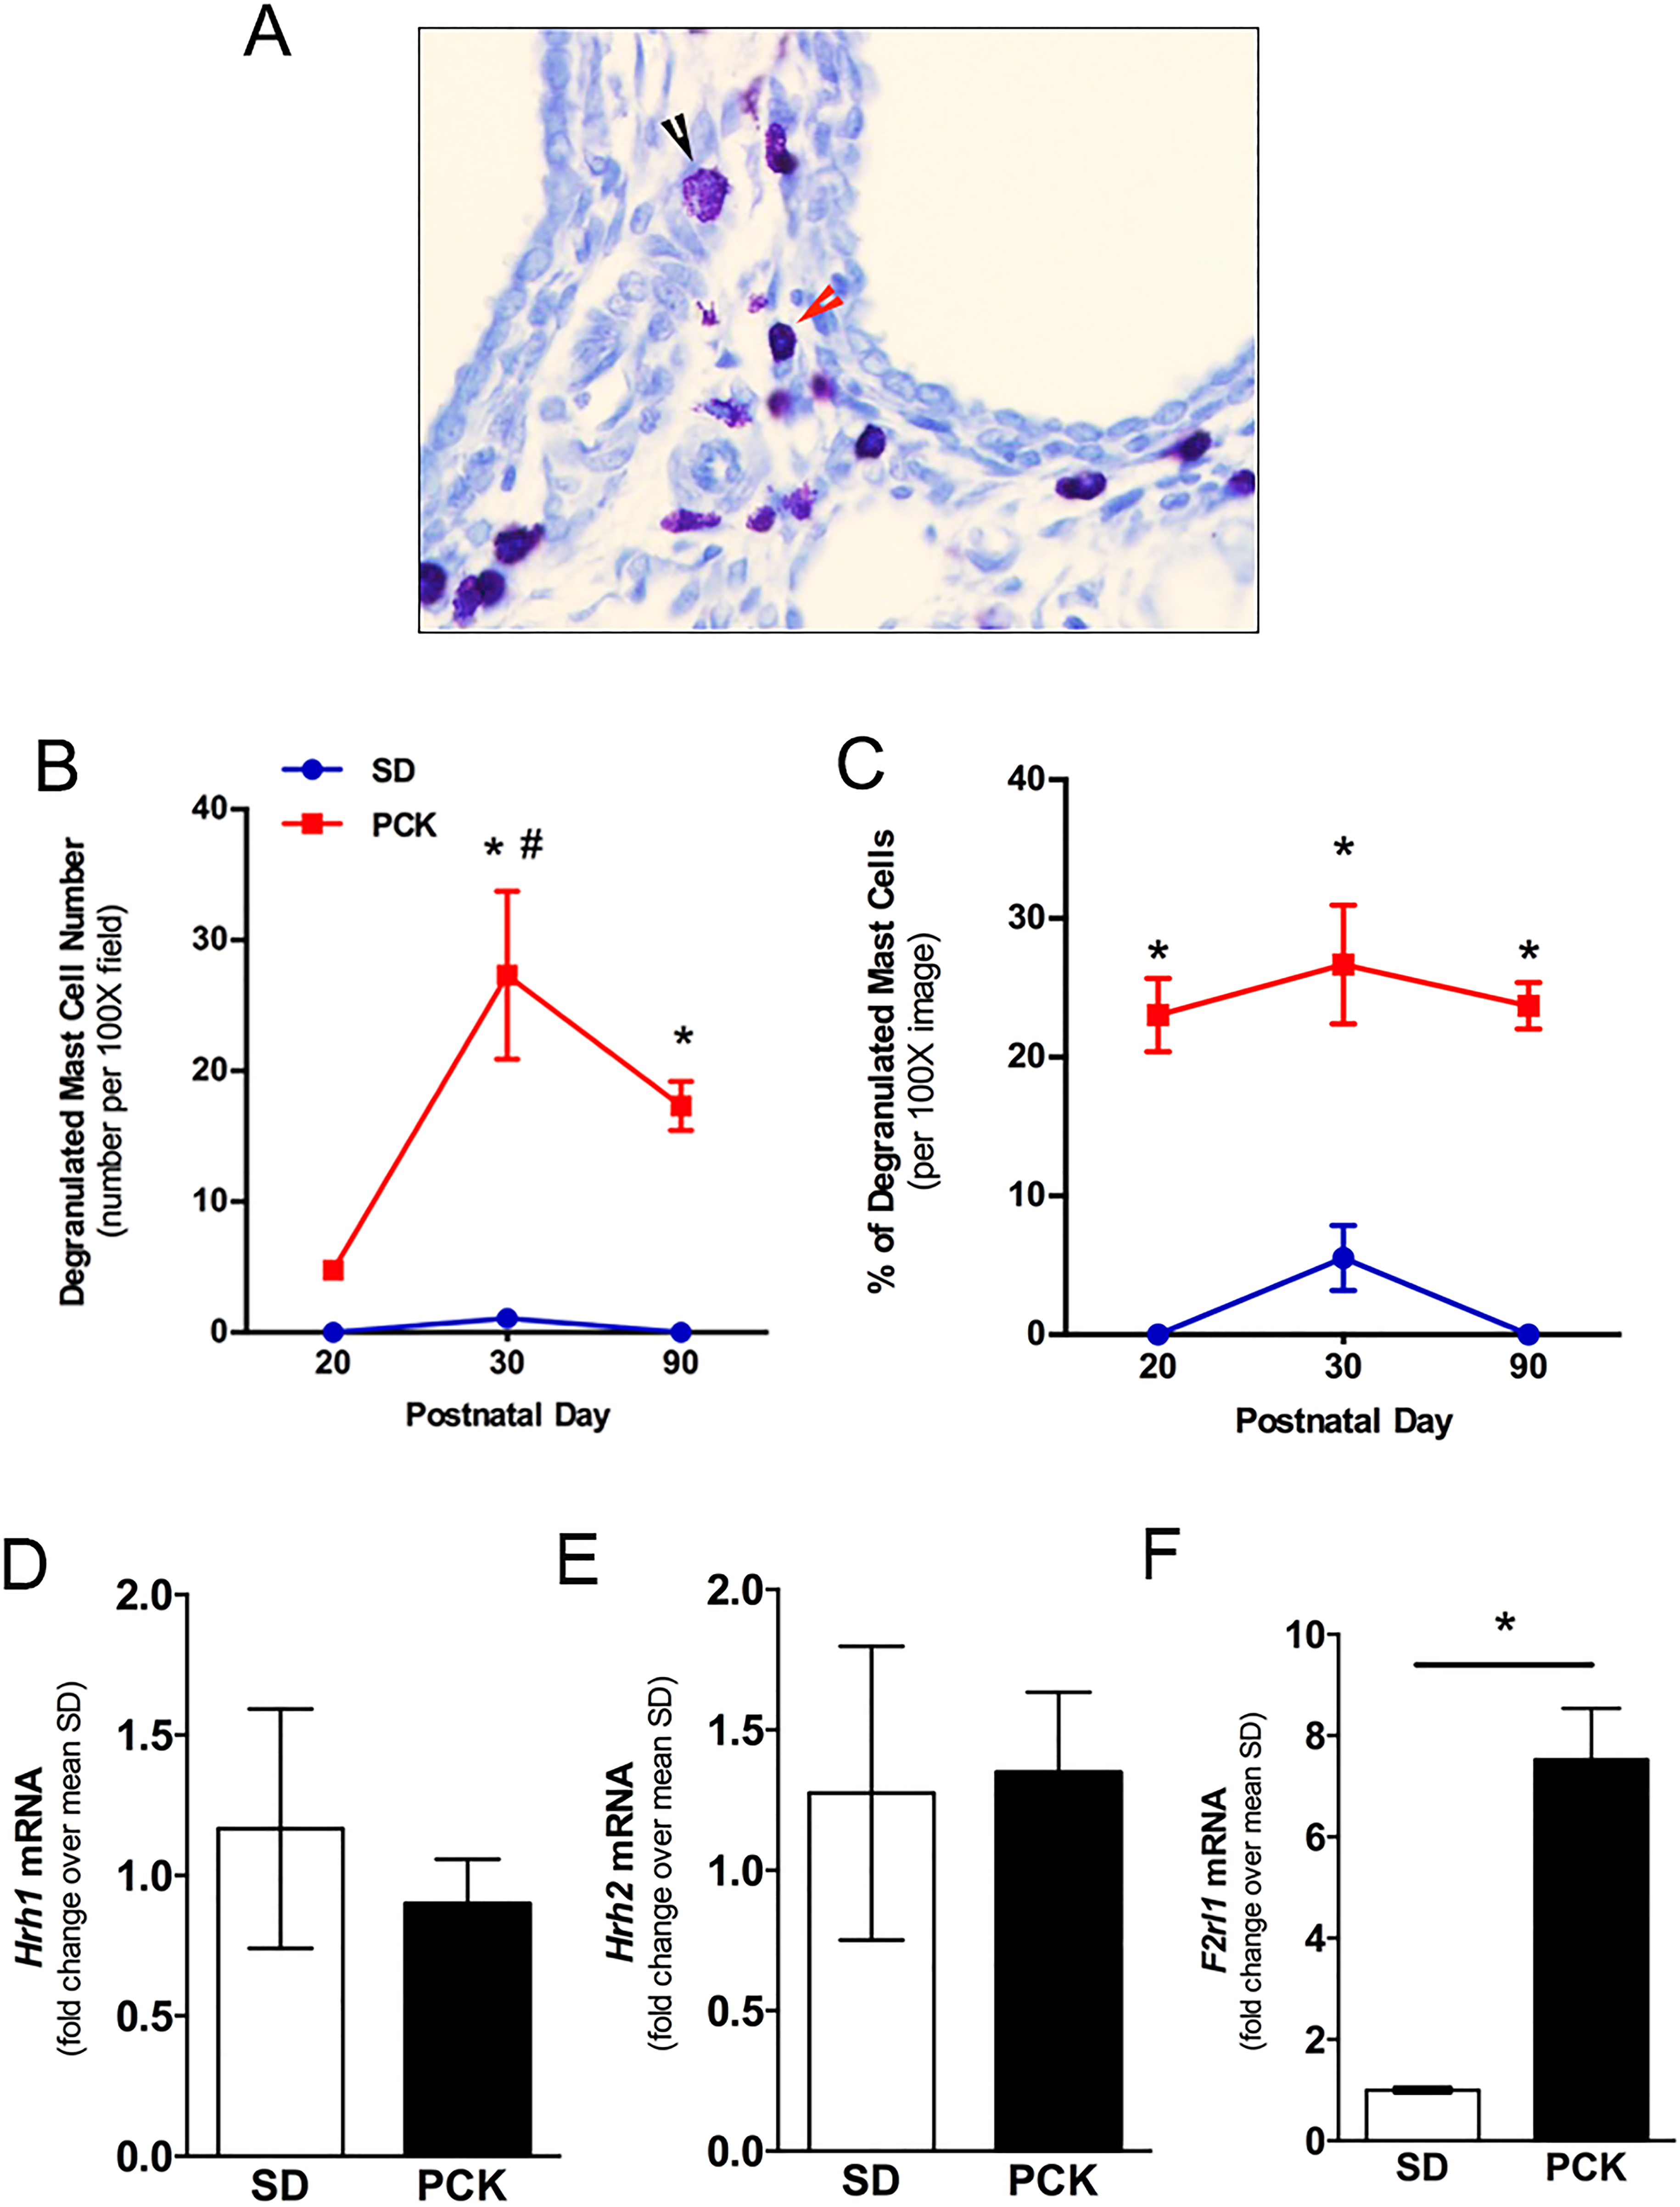
Evaluation of mast cell (MC) degranulation and granule-associated receptors in PCK rat livers. A, Examples of a nondegranulated MC (red arrow head) and a degranulated MC (black arrow head). Image was taken at 200× magnification. B, Number of degranulated MCs in PCK rat livers at postnatal day (PND) 20, PND 30, and PND 90. C, Percentage of degranulated MC in PCK rat livers at PND 20, PND 30, and PND 90. N = 3 to 4 rats per group. D, E, Gene expression of histamine receptors, Hrh1 and Hrh2, in biliary tree samples from SD and PCK rats. F, Gene expression of tryptase receptor, protease-activated receptor 2 (PAR2, F2rl1), in biliary tree samples from SD and PCK rats. * P < .05 between groups. PCK indicates polycystic kidney; SD, Sprague-Dawley.
Inhibition of MC Degranulation, In Vivo, Using CS and Its Impact on Hepatic Cyst Growth and Pericystic Fibrosis
Cromolyn sodium is an MC stabilizer used to treat asthma. 44,45 It has also been used to prevent MC degranulation in rats after bile duct ligation, 33 an experimental model of cholestasis in which histamine promotes the proliferation of cholangiocytes. Therefore, we treated PCK rats with CS (50 mg/kg/d 29 ) from PND 15 to PND 30 to determine whether we could prevent MC degranulation and prevent growth of hepatic cysts. After 15 days of CS treatment, MC degranulation was attenuated relative to saline-treated controls (Figure 3A). Quantification of the number of nondegranulated cells and degranulated cells indicated a 40% decrease in degranulated cells after CS exposure (Figure 3B). To further support these observations, we measured histamine and tryptase, 2 MC granule contents, in serum from rats treated, or not, with CS. While histamine levels, measured using a histamine EIA, did not differ between saline- and CS-treated rats (Figure 3C), levels of tryptase, as measured using a tryptase ELISA, were reduced (Figure 3D).
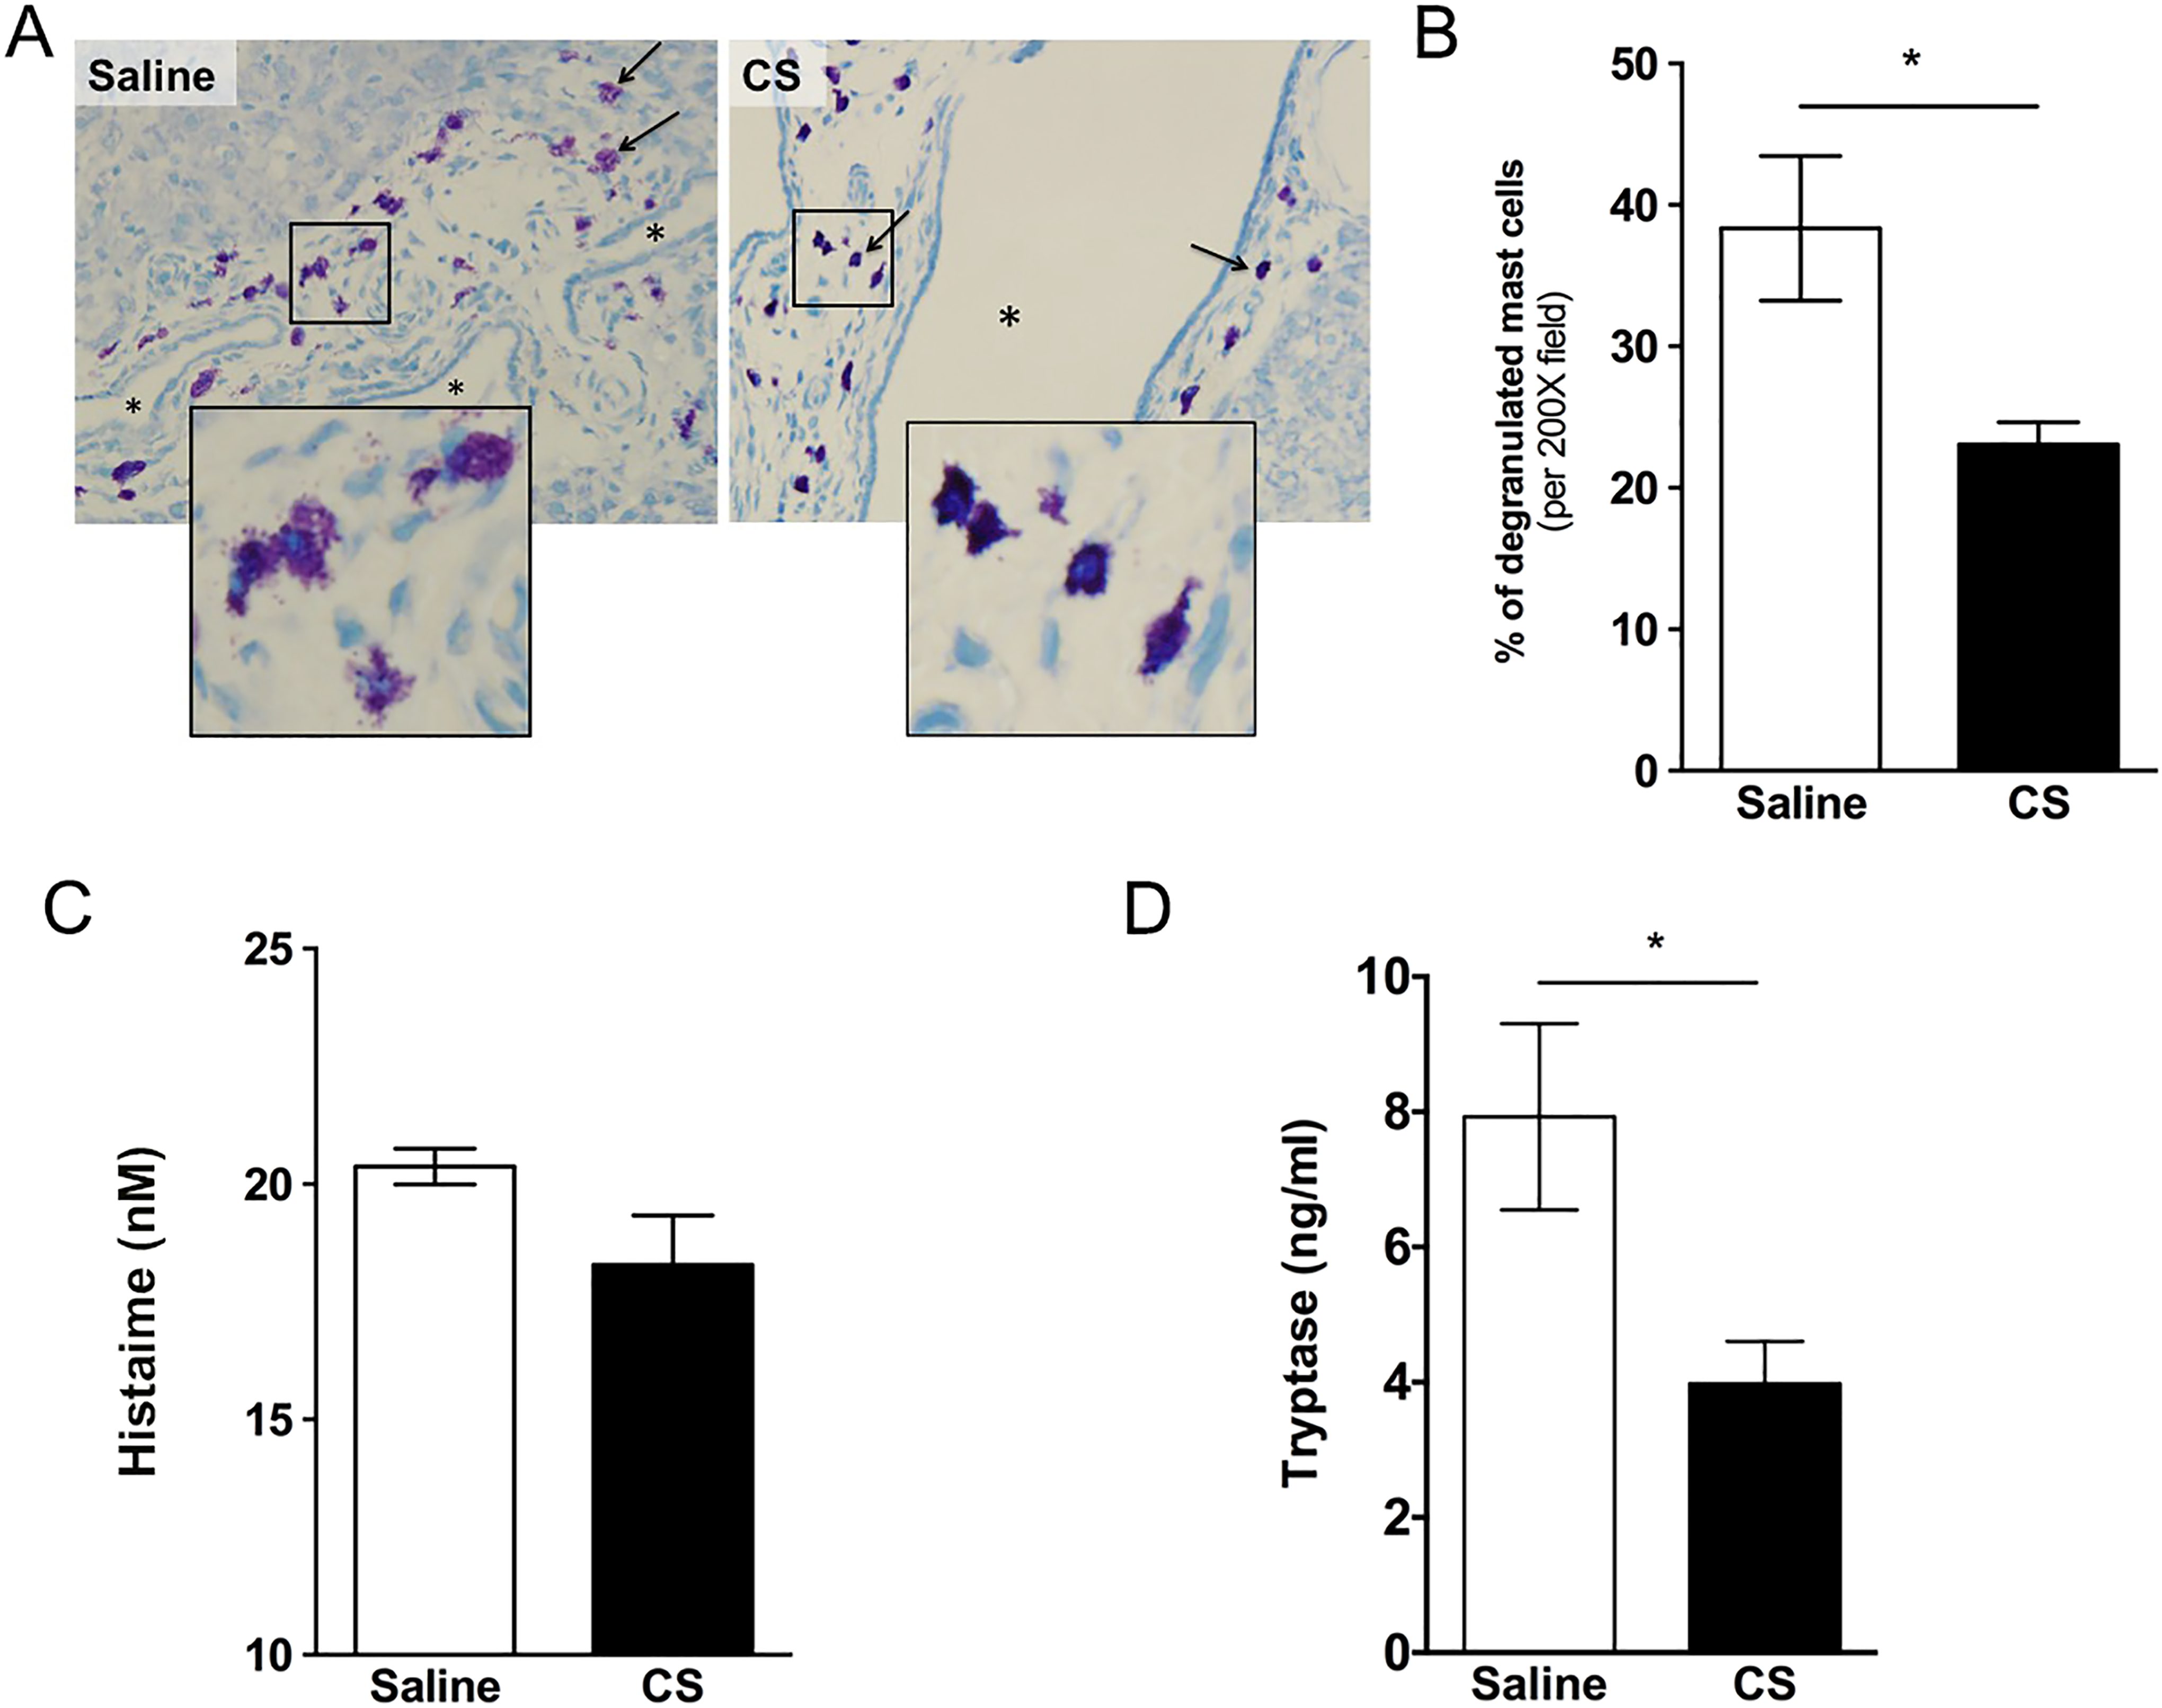
Effect of cromolyn sodium (CS) on mast cell (MC) degranulation in PCK rat livers. A, Representative images of toluidine blue-stained liver sections from a saline- and CS-treated PCK rat. Images were taken at 200× magnification. B, Percentage of degranulation of MC in saline and CS treatment groups. C and D, Serum level of histamine (C) and tryptase (D) in saline and CS treatment groups. N = 4 to 5 rats per group. * P < .05 between groups. PCK indicates polycystic kidney.
Next, we evaluated the impact of CS exposure on hepatic cysts in PCK rats. Surprisingly, by histological assessment of H&E-stained liver sections, CS exposure increased cyst size (Figure 4A). This was reflected in an ∼5% increase in liver to body weight ratio in saline- versus CS-treated rats (Figure 4B), as well as by a morphological analysis of individual cyst size which was also increased after CS exposure (Figure 4C). Next, we wanted to elucidate the mechanism responsible for the increase in cyst size found in CS-treated PCK rat livers. In other words, was this increase in cyst size due to increased CWEC proliferation, a decrease in CWEC death, or another mechanism? To determine whether the increase in cyst size was due to an increase in CWEC proliferation, we performed Ki67 staining of liver sections from PCK rats. Ki67 staining indicated a 90% increase in CWEC proliferation after CS treatment compared to proliferation found in saline-treated PCK rats (Figure 5A and C). Next, we used TUNEL staining to determine whether or not CS exposure altered CWEC cell death. We found a trend to a greater number of TUNEL-positive nuclei in livers from saline-treated PCK rats when compared to CS-treated rats; this result approached significance (P = .098, Figure 5B and D).
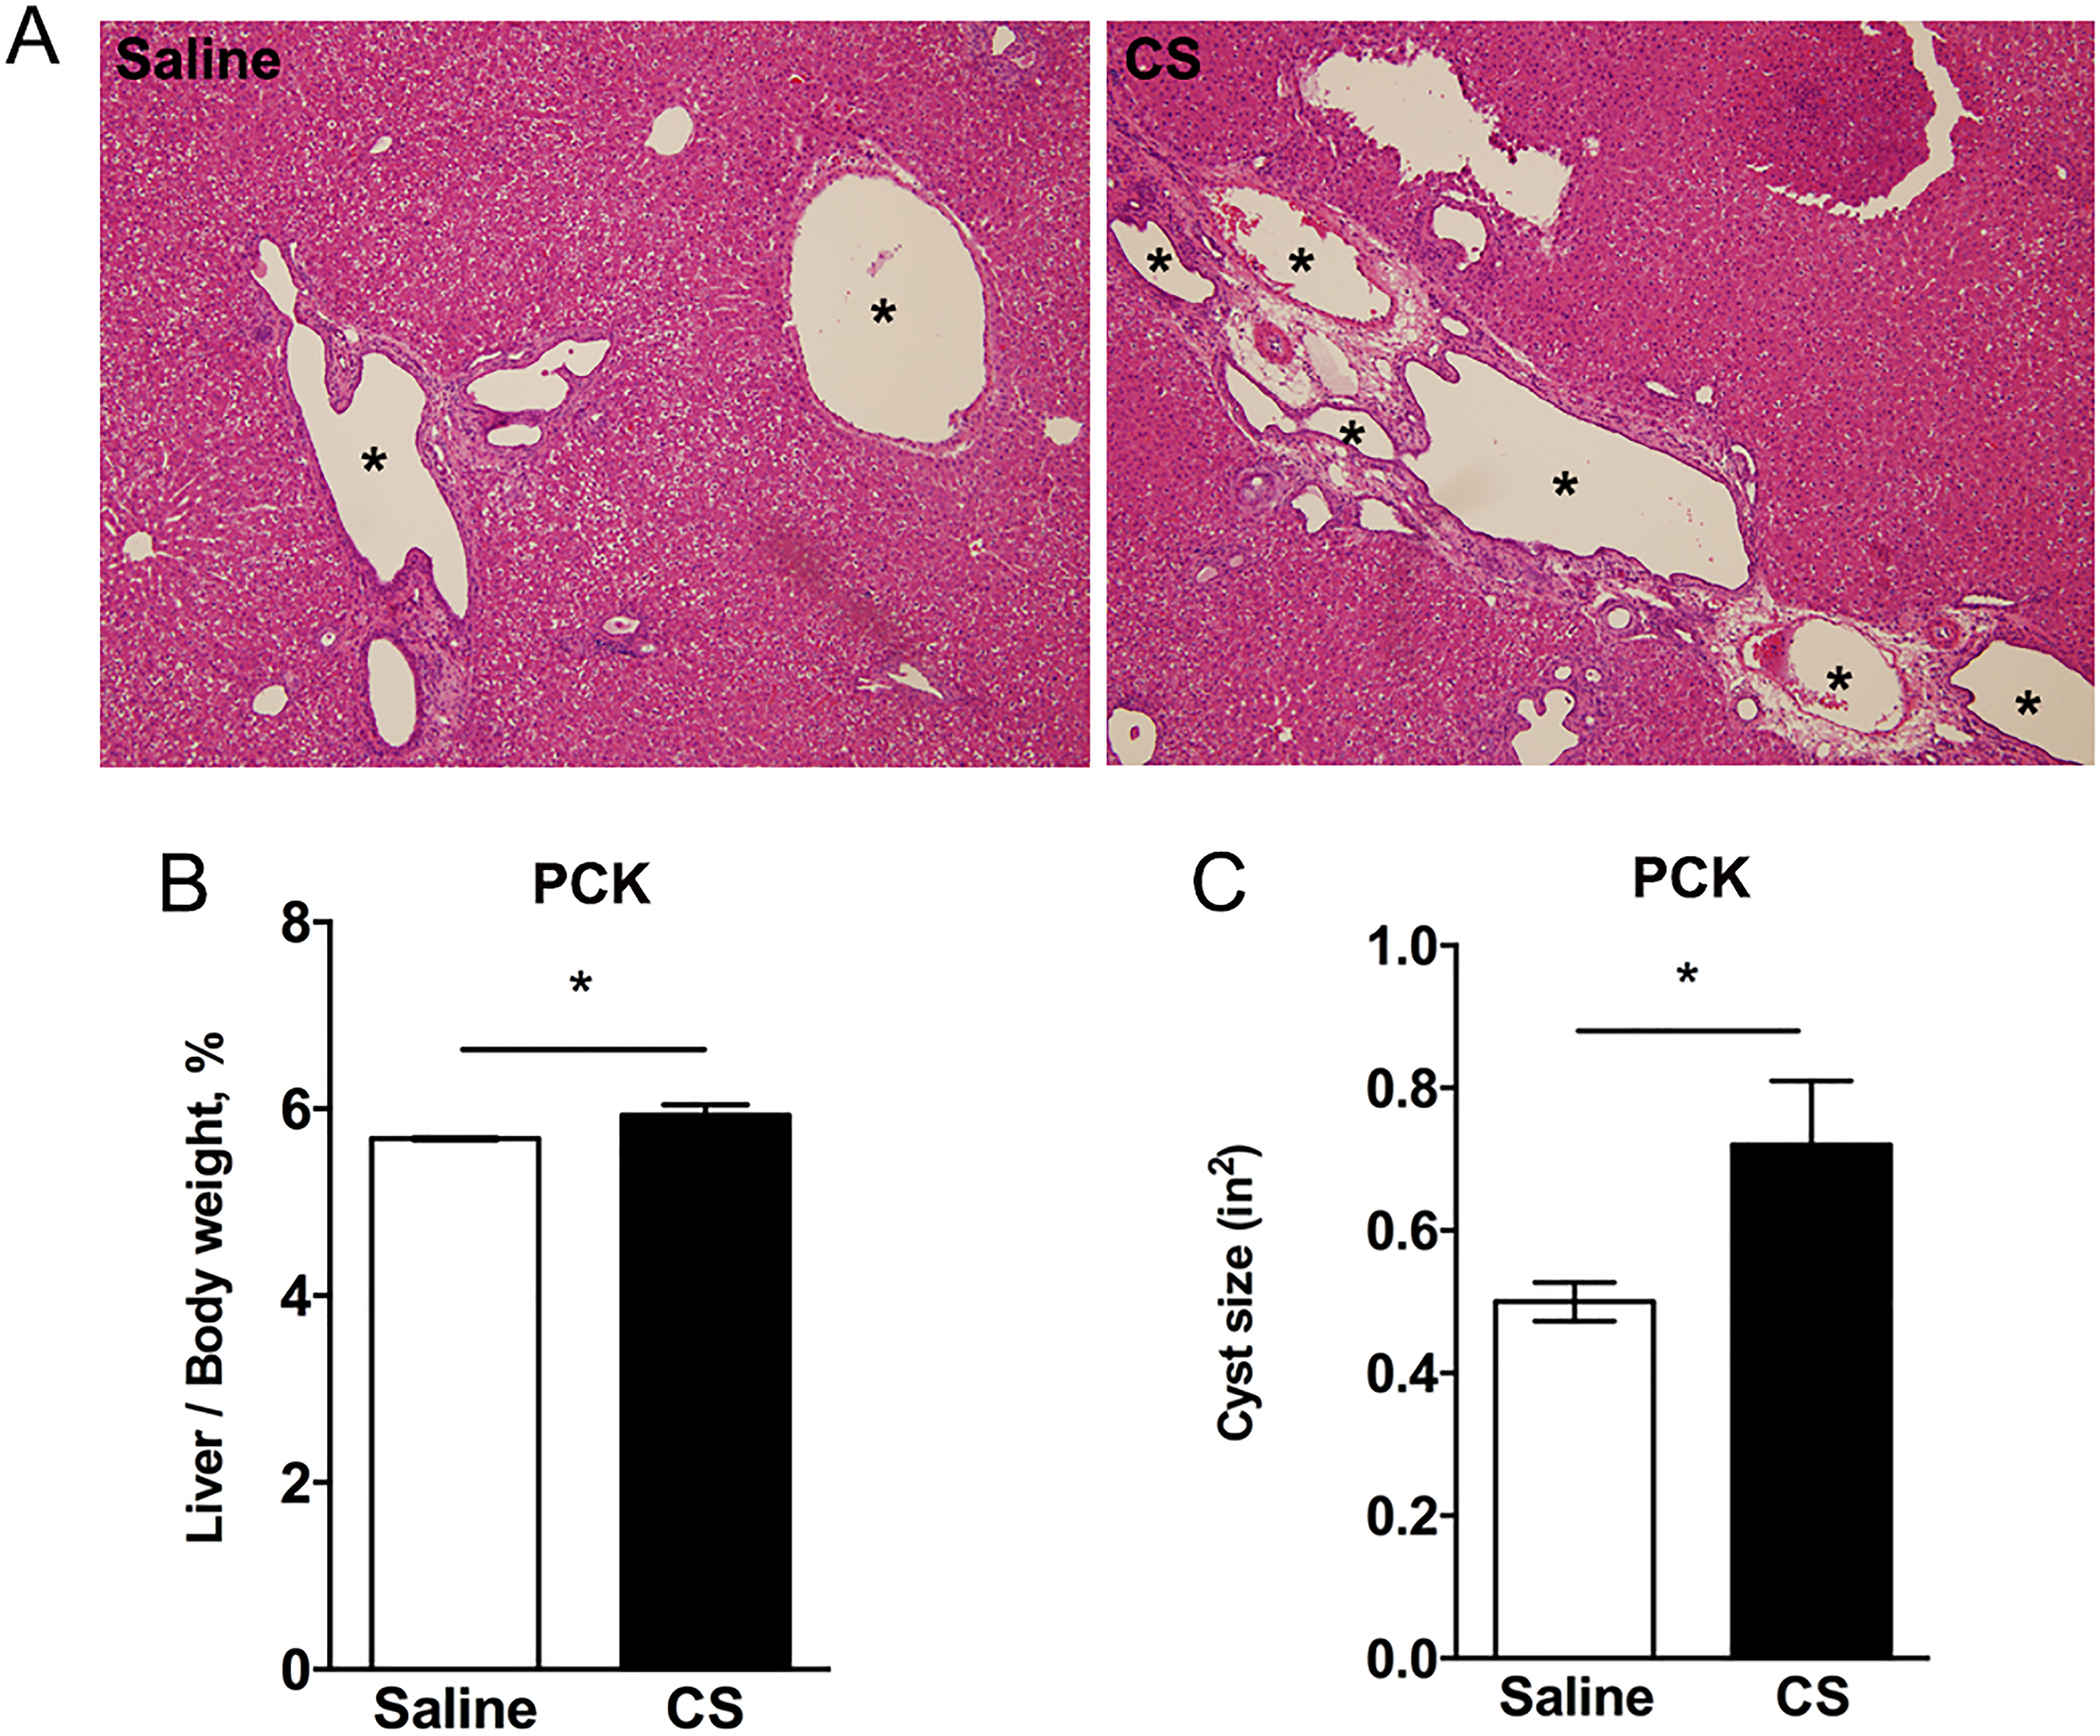
Effect of cromolyn sodium (CS) on livers from PCK rats. A, Representative histology of hematoxylin and eosin (H&E) stained liver slides from saline- and CS-treated PCK rats. Asterisks (*) indicate cysts. Images were taken at ×100 magnification. B and C, Ratio of liver to body weight expressed as a percent of body weight (B) and average cyst (C) in saline- and CS-treated PCK rats. * P < .05 between groups. PCK indicates polycystic kidney.
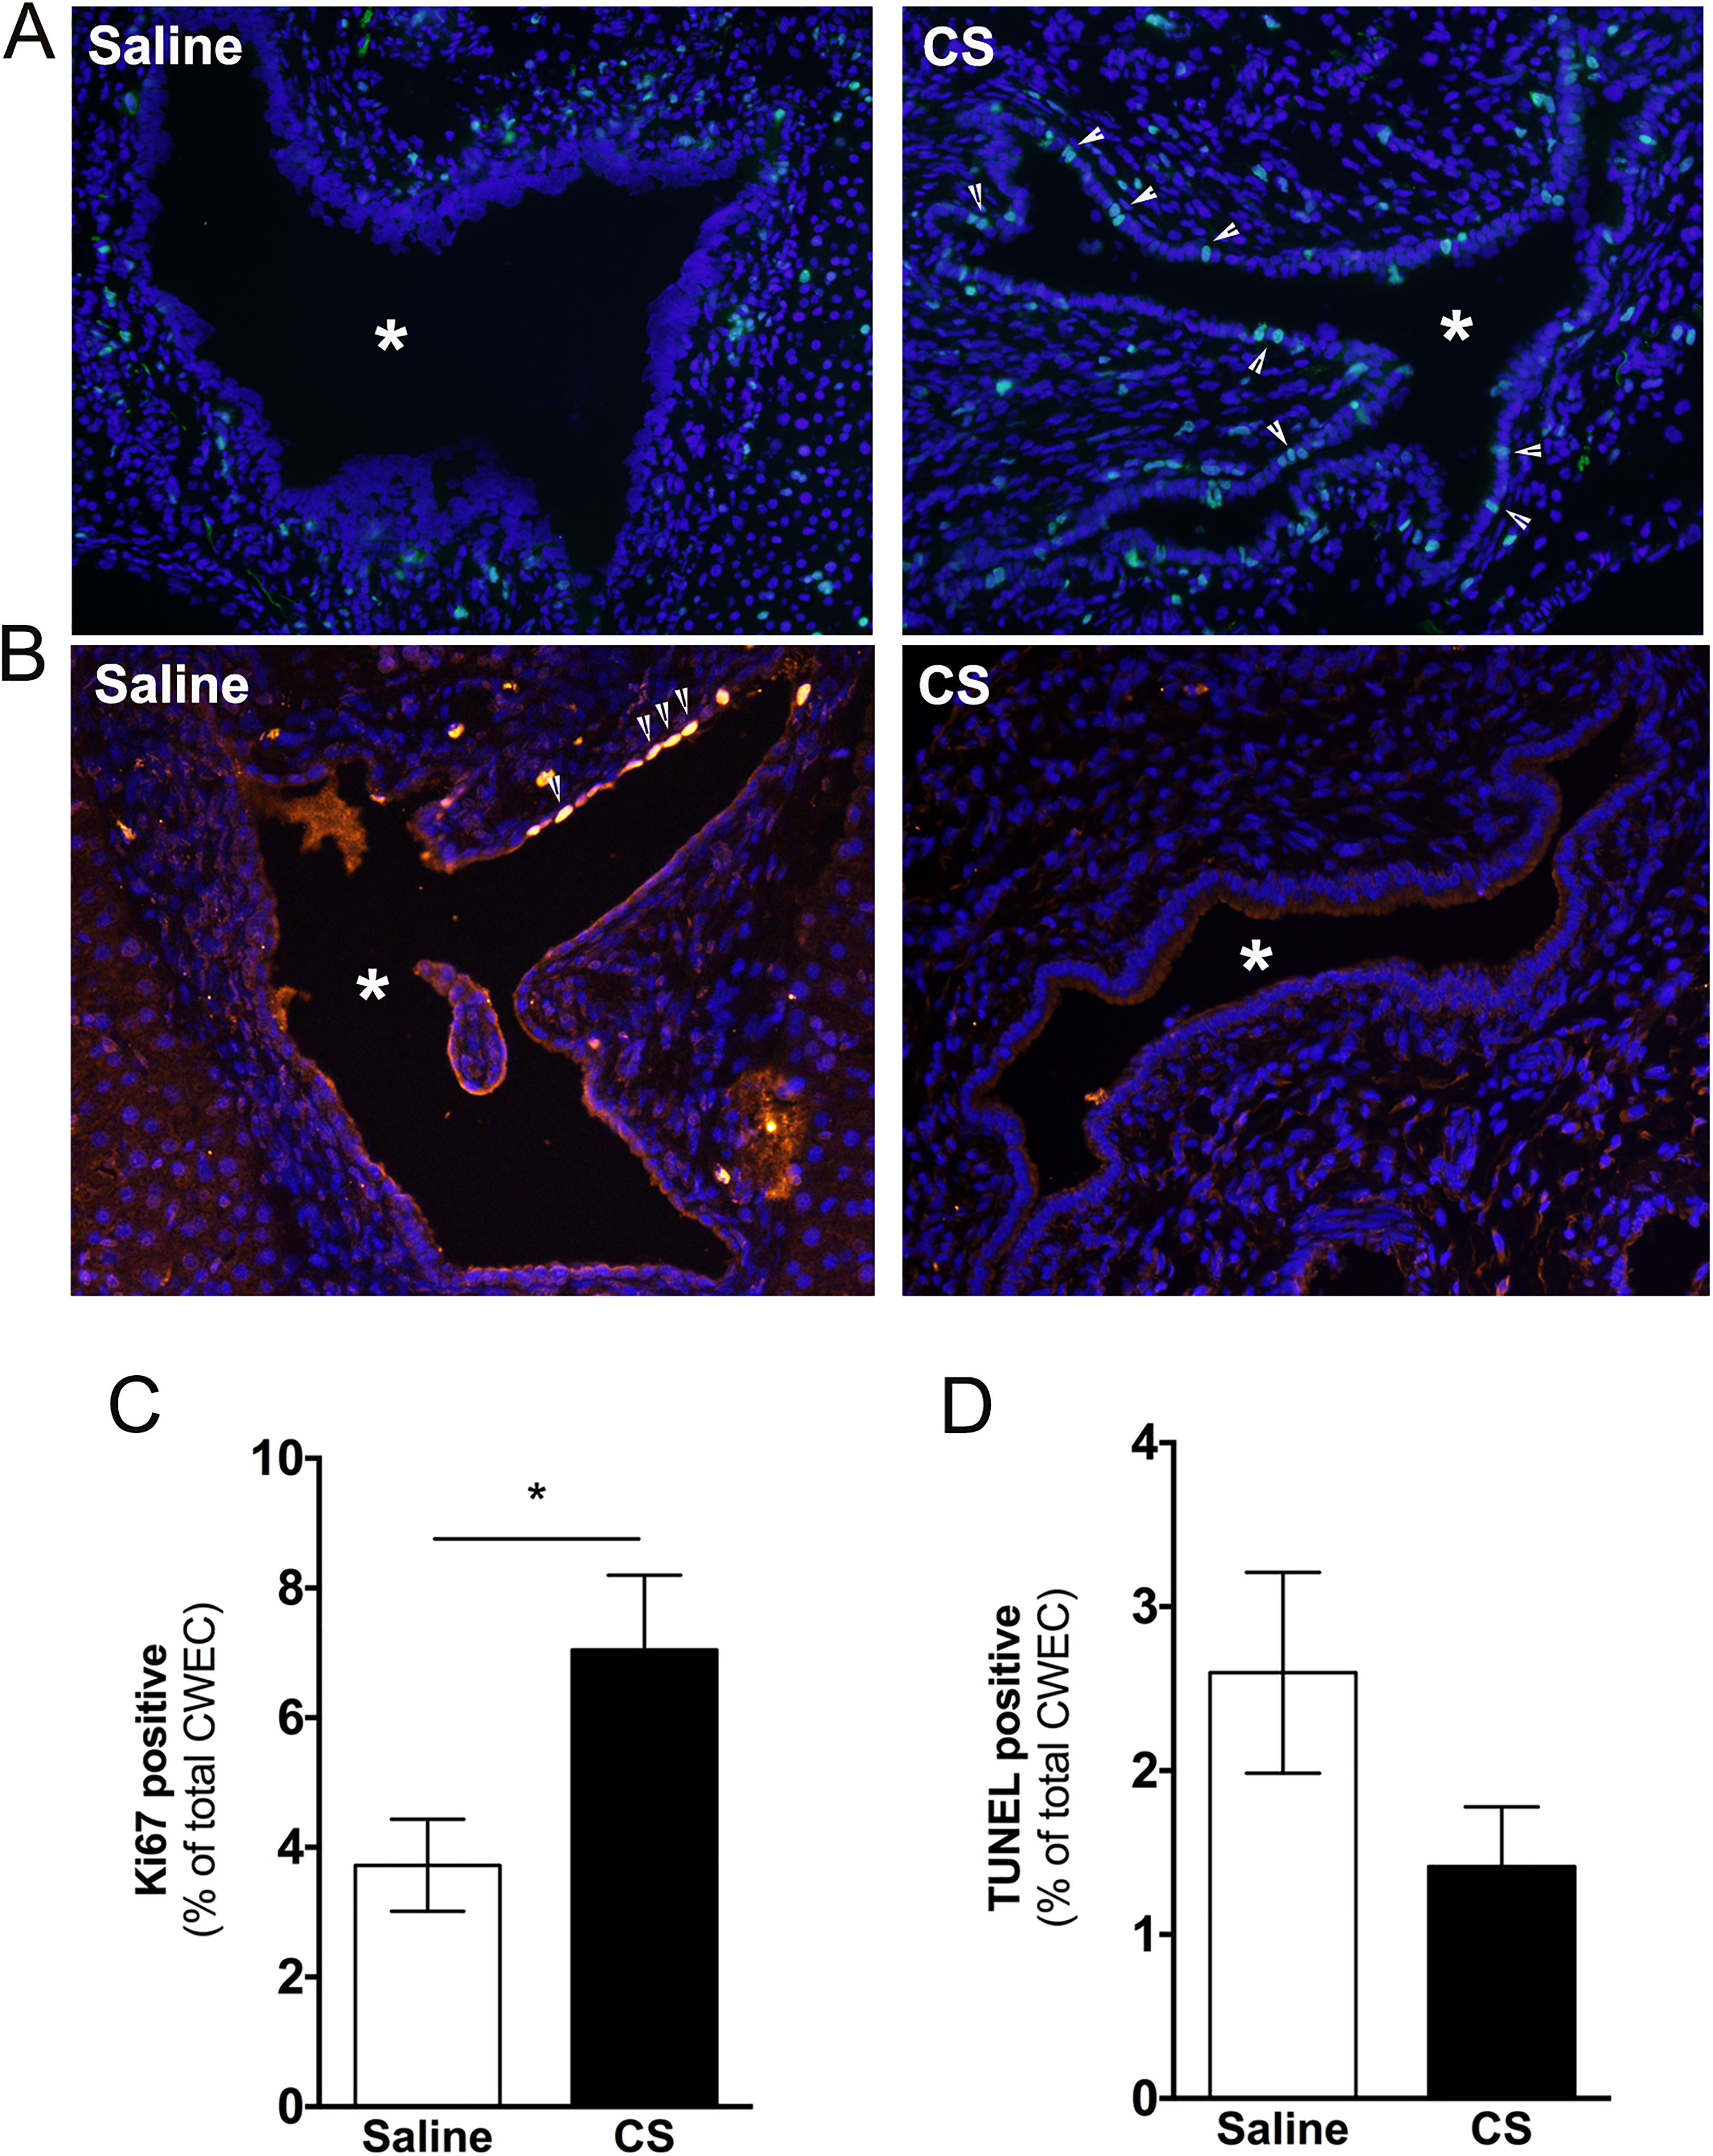
Evaluation of cell proliferation and cell death following cromolyn sodium (CS) treatment. A and B, Representative images of Ki67 (A) and TUNEL (B) stained liver sections from saline- and CS-treated PCK rats. DAPI was used to visualize nuclei. Images were taken at 200 × magnification. Asterisks (*) indicate cysts. Arrow heads indicate Ki67 (A) or TUNEL (B) positive cells. C and D, Percentage of Ki67 (C) and TUNEL (D) positive cyst wall epithelial cells (CWECs) over total CWECs. N = 4 rats per group. * P < .05 between groups. PCK indicates polycystic kidney; DAPI, 4′,6-diamidino-2-phenylindole.
Given that both cyst size and number increases in PCK rats from PND 0 to PND 90 and that fibrosis increases in parallel with cyst expansion, 30 we predicted that the increased cyst size observed in CS-treated PCK rats would be associated with increased pericystic fibrosis. To evaluate fibrosis, we used Sirius red staining and a biochemical assay to estimate the amount of collagen found in livers from control and CS-treated PCK rats. Morphometric analysis of Sirius red-positive staining indicated that CS treatment did not increase liver fibrosis when compared to saline-treated PCK rats (Figure 6A-C). Consistently, hydroxyproline analysis, used to estimate collagen levels, 37 revealed that collagen content was the same in PCK rats, regardless of treatment (Figure 6D). Finally, we used real-time PCR to measure transcripts associated with fibrosis. Levels of α-smooth muscle actin (αSMA/Acta2), a marker for marker for myofibroblasts, 46 and type I collagen (Col1a1) were not different between treatment groups (Figure 6E and F).
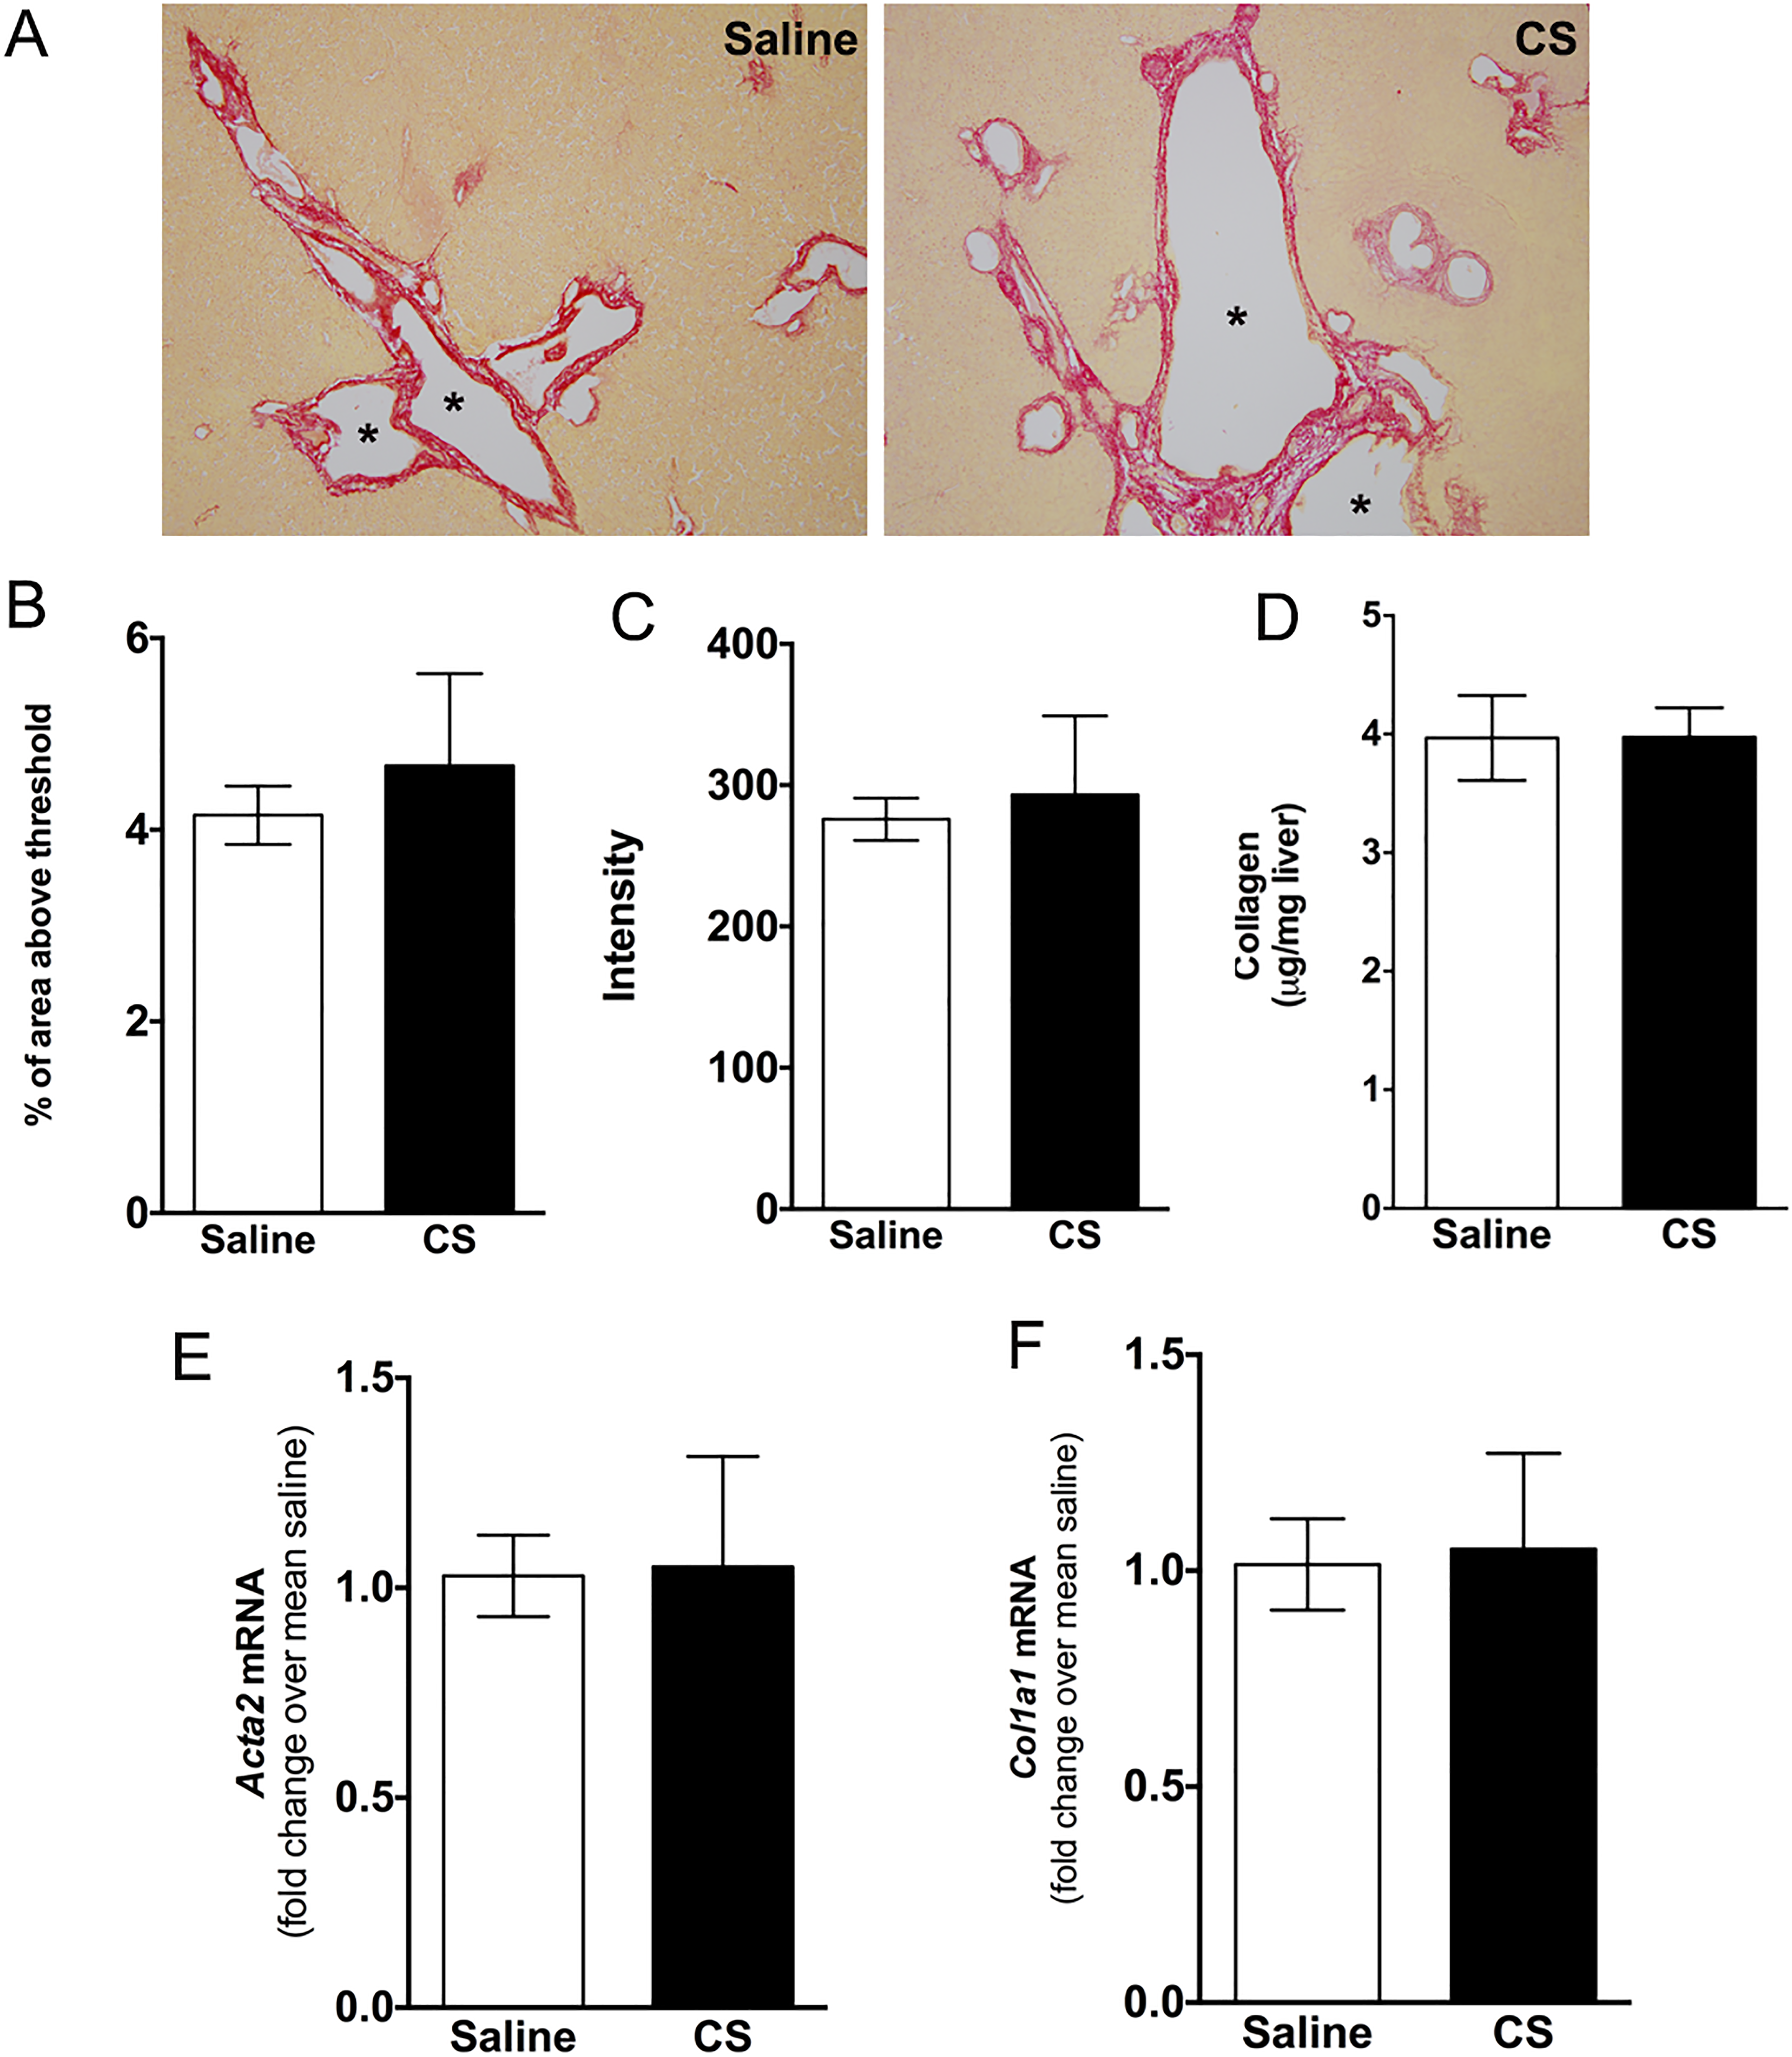
Evaluation of liver fibrosis following cromolyn sodium (CS) treatment in PCK rats. A, Representative images of Sirius red-stained liver sections from saline- and CS-treated PCK rats. Images were taken at 100× magnification. Asterisks (*) indicate cysts. B and C, Quantification of Sirius red staining by measuring percentage of Sirius red-positive area (B) and intensity (C) in saline- and CS-treated PCK rats. D, Hepatic hydroxyproline concentration was determined using a biochemical assay from which approximate collagen content was calculated. E and F, Hepatic fibrotic marker transcript Acta2 (E) and Col1a1 (F) were measured using real-time PCR. The data are expressed as fold change over saline. N = 3 to 7 rats per group. * P < .05 between groups. PCK indicates polycystic kidney; PCR, polymerase chain reaction.
Impact of CS Exposure on Renal Cyst Growth and Fibrosis Indices
Because PCK rats exhibit both hepatic and renal cysts, we sought to determine whether or not CS exposure increased renal cyst growth and fibrosis. First, we evaluated MC numbers in kidneys from PCK rats and found that MCs were not present in the parenchyma of the kidney but were restricted to the connective tissue and fat surrounding the kidney and were very low in number compared to MC accumulation in the liver (Figure 7A). The CS treatment caused a reduction in kidney to body weight ratio (Figure 7B), and morphological analysis of cysts revealed that cystic area was reduced in kidneys from PCK rats treated with CS (Figure 7C). As expected, CS treatment of SD rats did not affect kidney to body weight ratio compared to saline treatment (Figure 7D).
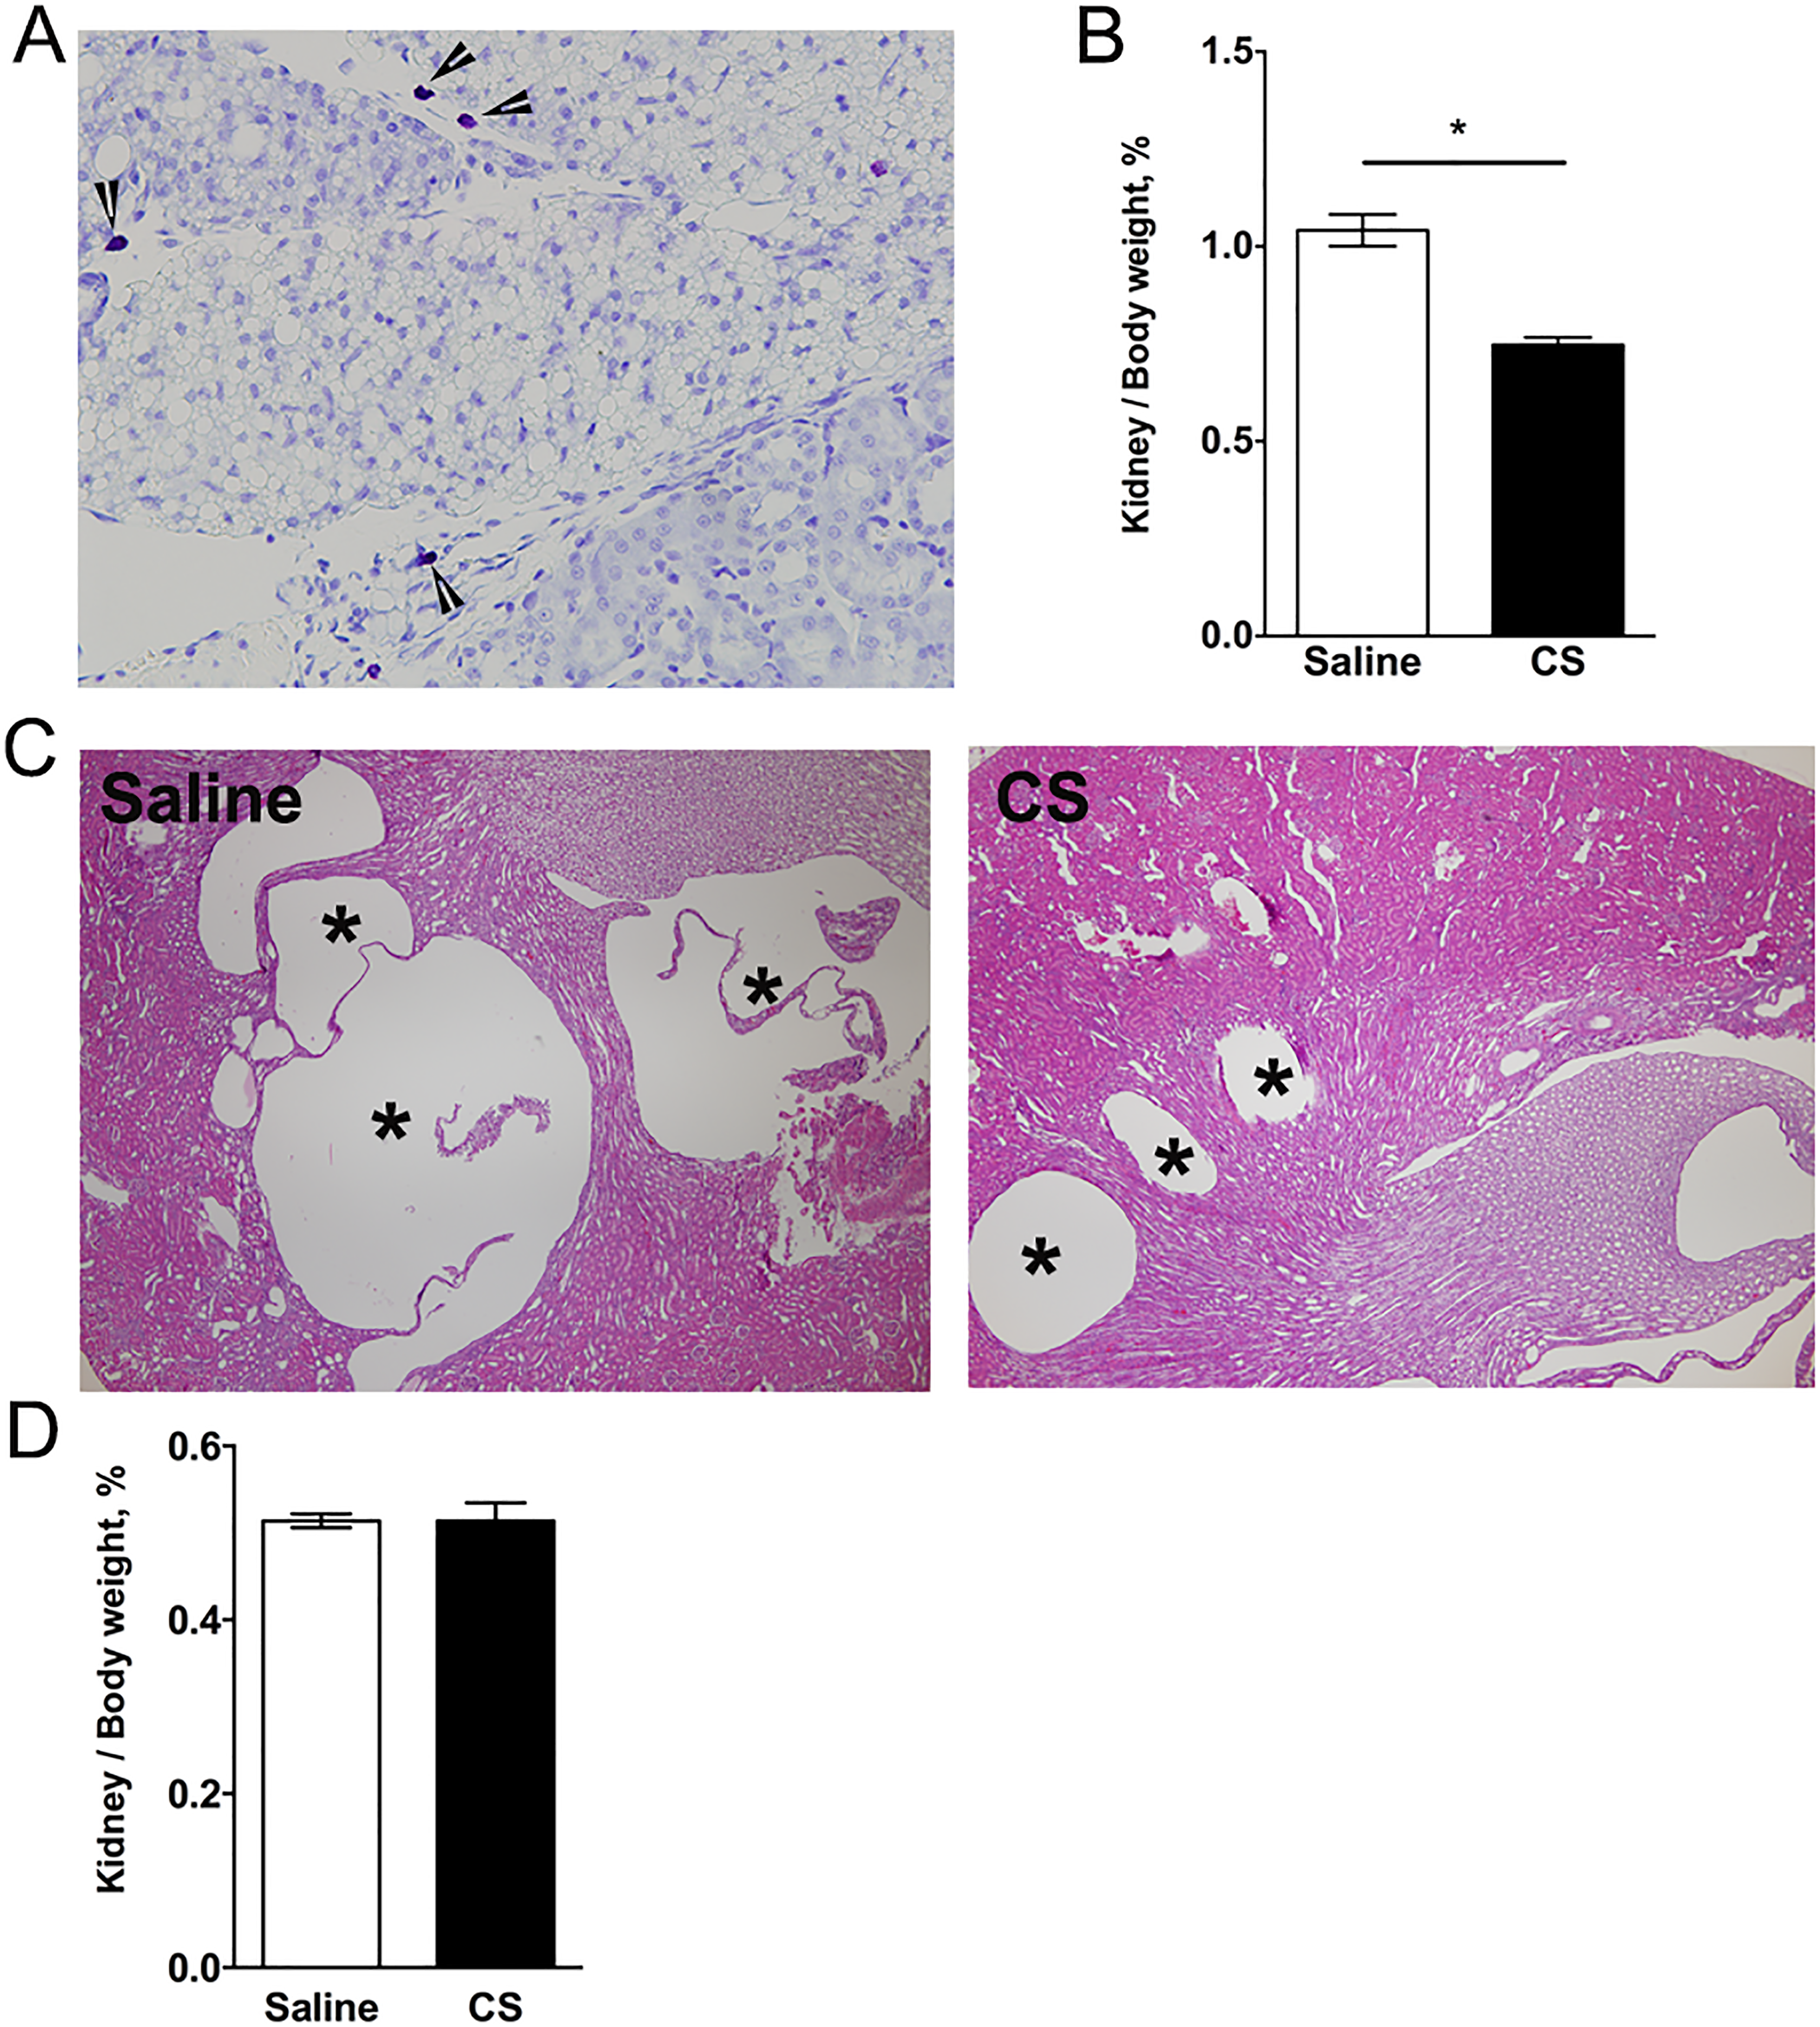
Effect of cromolyn sodium (CS) on kidney cyst growth in PCK rats and Pkhd1LSL (−) /LSL(−) mice. A, Toluidine blue-stained kidney section from a PCK rat. Image was taken at 400× magnification. Arrow heads indicate mast cells. B, Ratio of kidney to body weight in PCK rats following saline or CS treatment expressed as a percentage of body weight. * P < .05 between groups. C, Representative images of hematoxylin and eosin (H&E)-stained kidney sections from saline- and CS-treated PCK rats. Asterisks (*) indicate cysts. N = 4 to 6 rats per group. D, Ratio of kidney to body weight in SD rats following saline or CS treatment expressed as a percentage of body weight. N = 6 to 7 mice per group. PCK indicates polycystic kidney.
Evaluation of renal epithelial cell proliferation by Ki67 staining revealed that CS exposure suppressed proliferation only of noncystic epithelial cells (ie, cystic epithelium was Ki67 negative), and this approached significance (P = .0599, Figure 8A and C). The TUNEL staining revealed a decrease in cyst epithelial cell death in kidneys from CS-treated PCK rats (Figure 8B and D). Renal interstitial fibrosis in PCK rats is not evident until PND 70. 47 Therefore, we analyzed Acta2 and Col1a1 transcripts as markers of early fibrogenic change in the kidney. We found that these transcripts were reduced in kidneys from CS-treated PCK rats compared to kidneys from saline-treated PCK rats (Figure 8E and F).
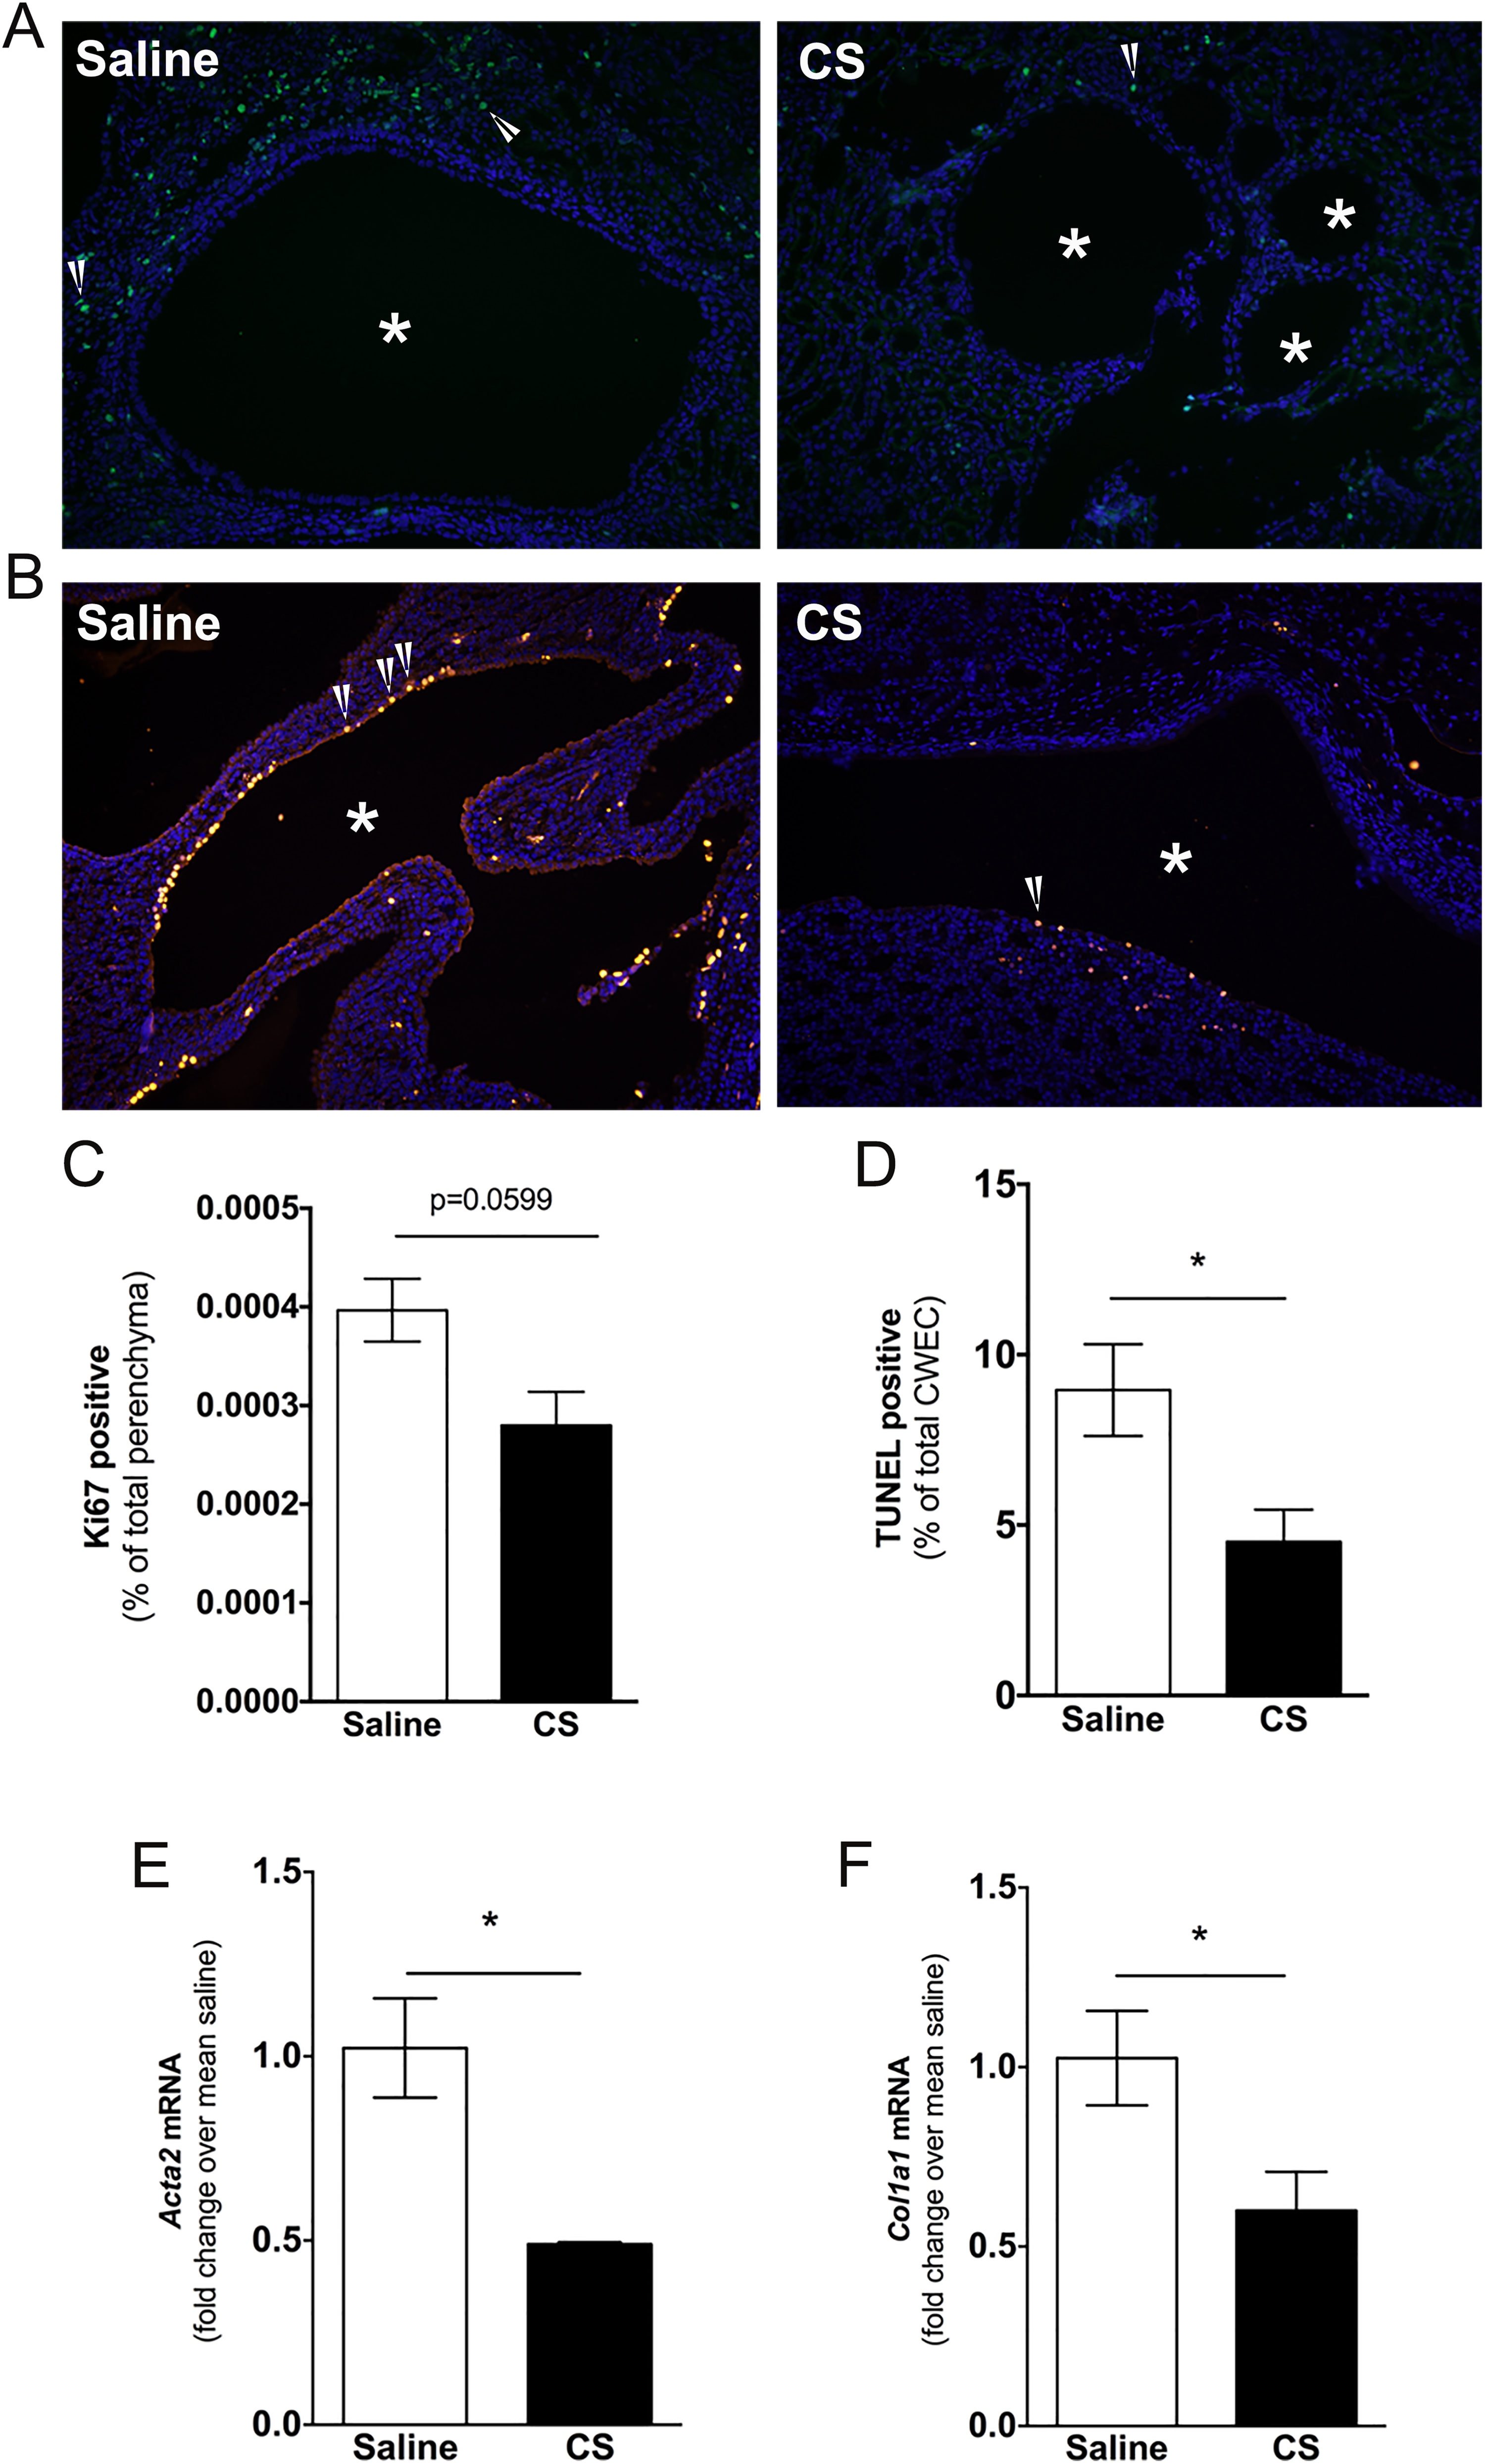
Evaluation of renal cell proliferation and cell death following cromolyn sodium (CS) treatment. A and B, Representative images of Ki67 (A) and TUNEL (B) stained kidney sections from saline- and CS-treated PCK rats. DAPI was used to visualize nuclei. Images were taken at 200 × magnification. Asterisks (*) indicate cysts. Arrow heads indicate Ki67- or TUNEL-positive cells. C and D, Percentage of Ki67-positive noncystic epithelial cells (C) and TUNEL-positive cyst wall epithelial cells over total number of cells counted. E and F, Fibrotic marker transcript Acta2 (E) and Col1a1 (F) were measured in PCK rat kidneys using real-time PCR. Data are expressed as fold change over saline. N = 4 rats per group. * P < .05 between groups. DAPI indicates 4′,6-diamidino-2-phenylindole; PCK, polycystic kidney; PCR, polymerase chain reaction.
Evaluation of an Off-Target Effect of CS on Cyst Growth
We performed 3 additional experiments to determine whether CS had a direct effect on cyst growth, independent of its MC stabilization activity. First, in a previous study, 30 we optimized the isolation and culture of CWEC from PCK rats and found that they formed cytokeratin 19-postive colonies consistent with their cholangiocyte origin. Next, we exposed CWECs to increasing concentrations of CS, in vitro. We found that a CS did not increase CWEC proliferation (Figure 9A). Forskolin, a cAMP agonist, stimulates renal cystic epithelial cell proliferation in ADPKD through activating the B-Raf-MEK-ERK pathway. 48,49 In our study, forskolin treatment increased hepatic CWEC proliferation by 50%, demonstrating that our CWEC was capable of proliferation, in vitro.
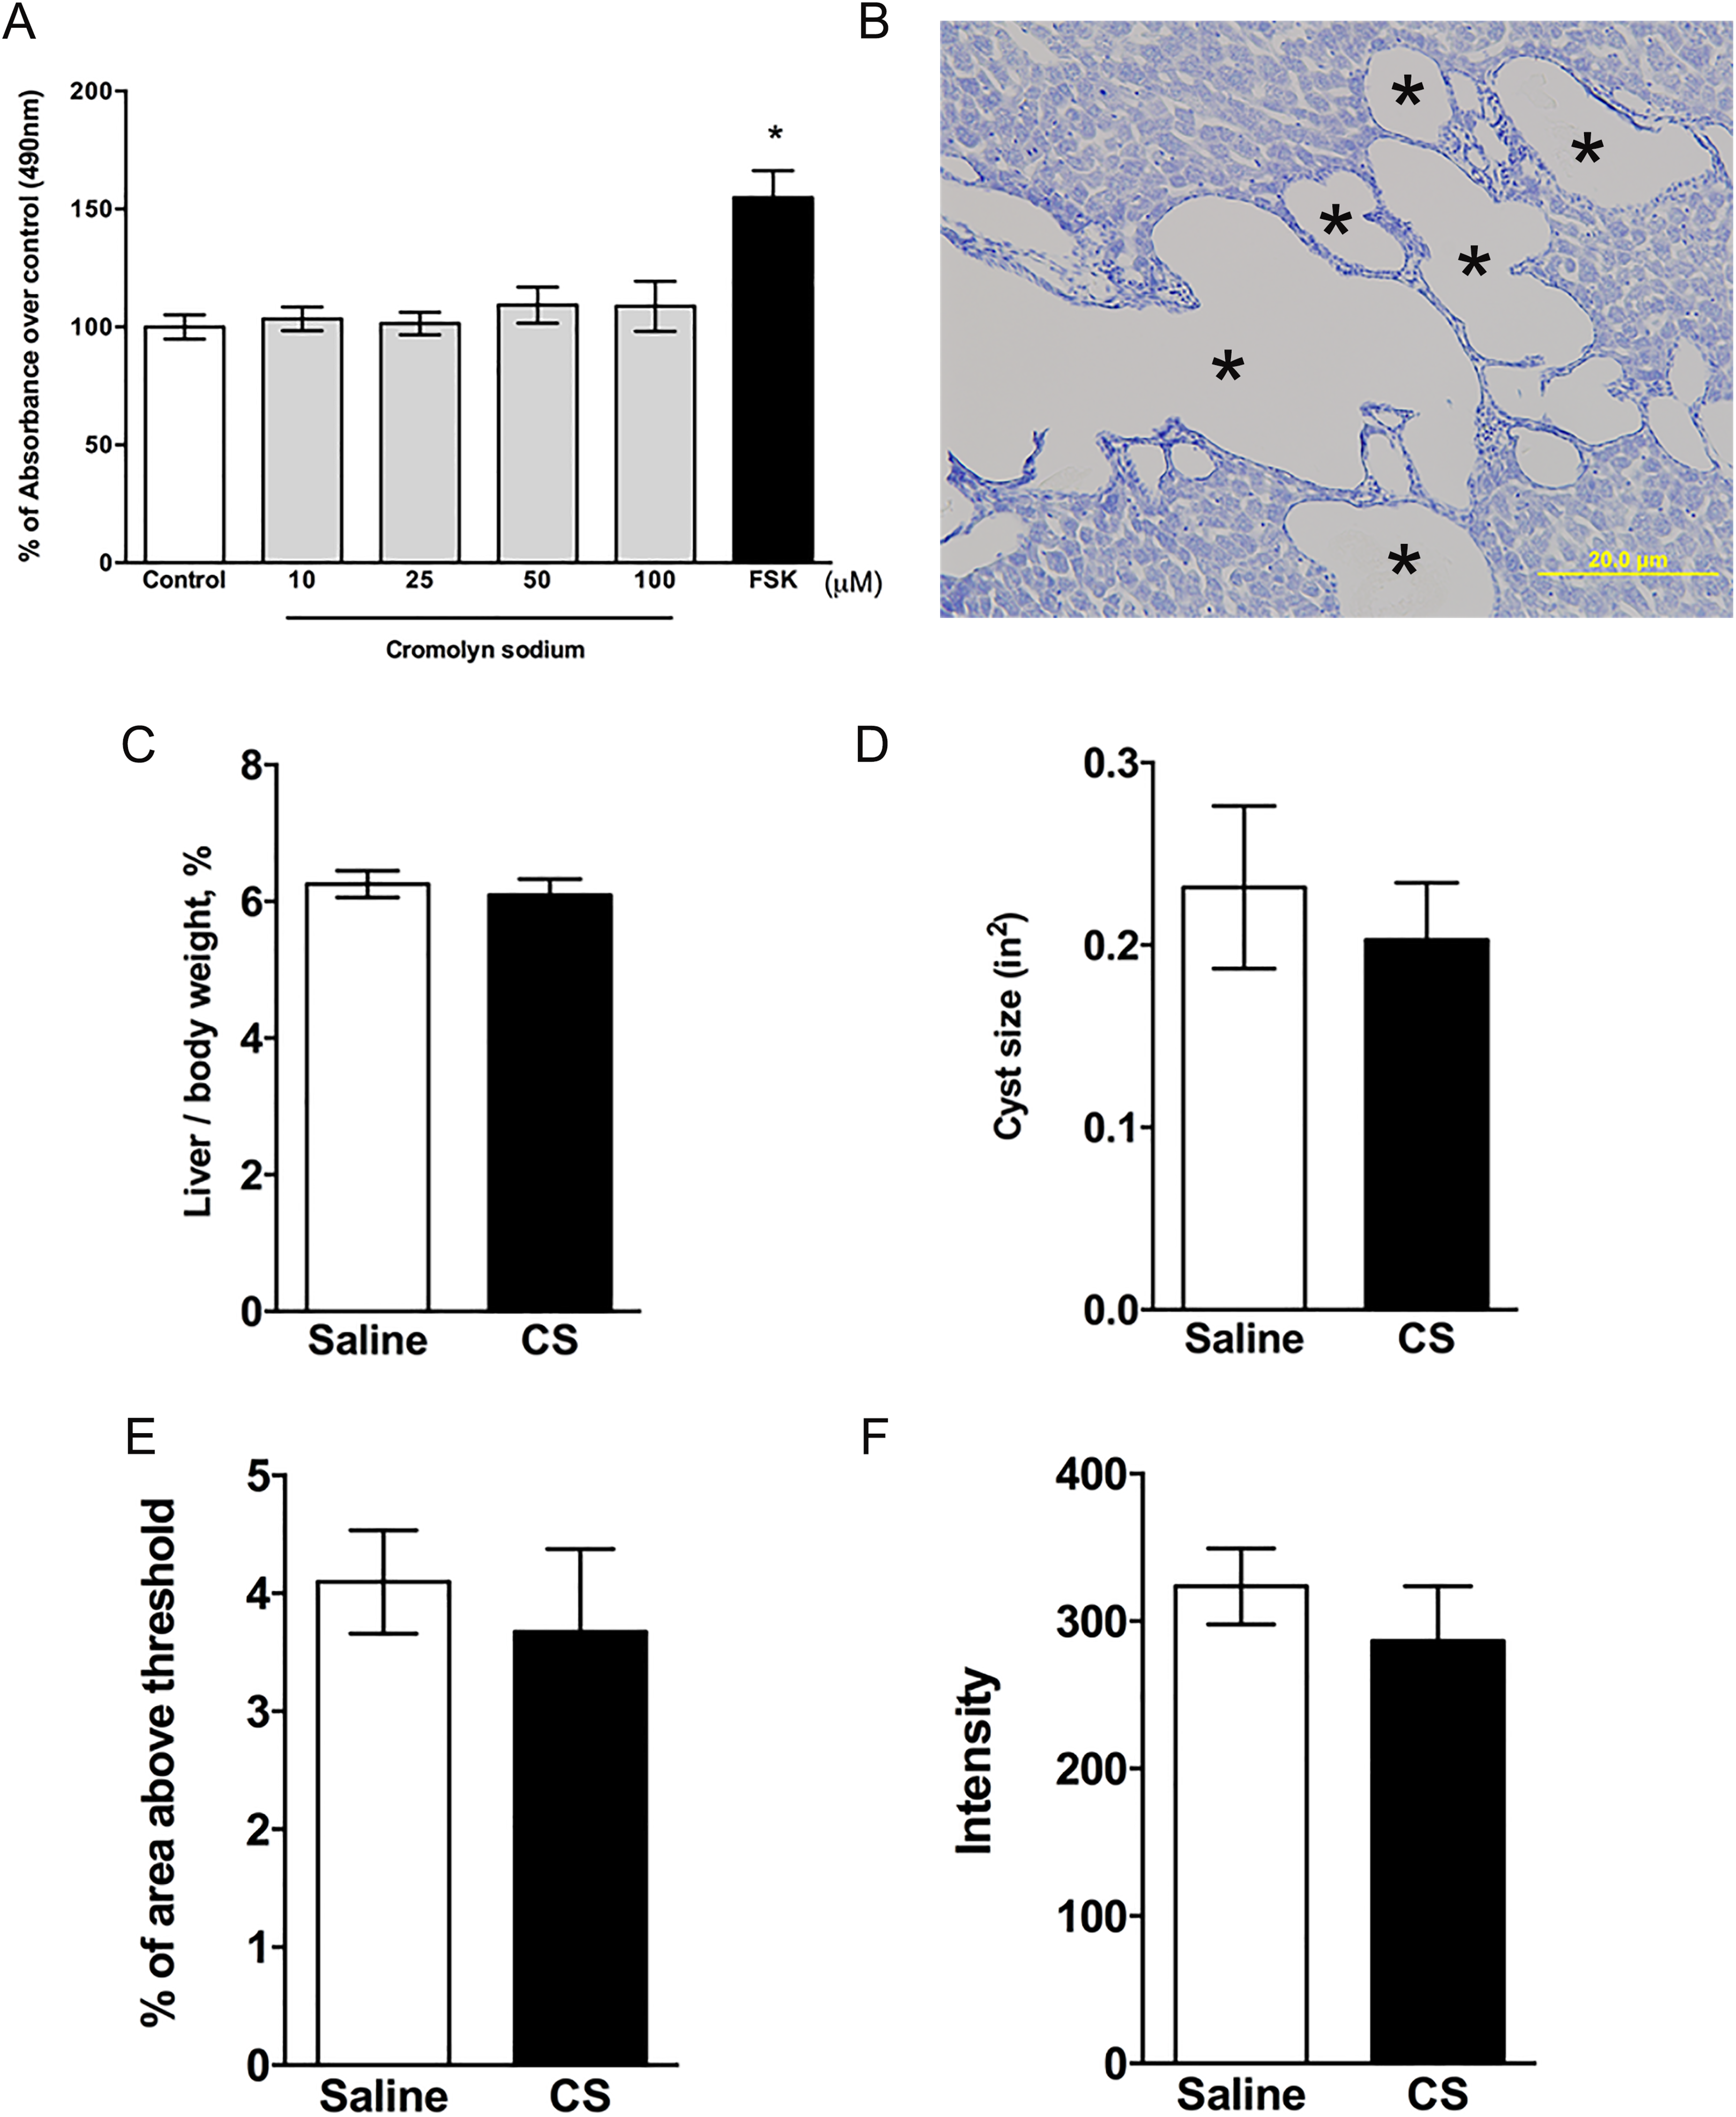
Effect of cromolyn sodium (CS) on isolated hepatic cyst wall epithelial cells (CWECs) and Pkhd1LSL (−) /LSL(−) mice. A, Effects of different CS concentrations on CWEC proliferation. CWECs were treated with the indicated CS concentrations, vehicle, or forskolin (FSK, 5 µM). Each experiment was repeated 3 times (CWECs from 3 separate biliary trees from 3 separate rats isolated on 3 separate days). B, toluidine blue-stained liver section from a Pkhd1LSL (−) /LSL(−) mouse. Image was taken at 200× magnification. Asterisks (*) indicate cysts. * P < .05 compared to control. C and D Ratio of liver to body weight expressed as a percentage of body weight (C) and average cyst size (D) in Pkhd1LSL (−) /LSL(−) mice treated with saline and CS. E and F, Quantification of Sirius red-stained liver sections by calculating percentage of Sirius red-positive area (E) and measuring intensity of staining (F) per 100× magnification field. N = 6 to 7 mice per group.
To unequivocally prove that MCs have a direct effect on hepatic cyst growth in ARPKD and that CS did not have an off-target effect on CWECs, the ideal experiment would involve creation of MC-deficient PCK rats, followed by treatment with CS, and evaluation of hepatic cystic disease. However, MC-deficient rats are not commercially available. Therefore, we were unable to carry out this experiment. Instead, we capitalized on an observation we made in mouse models of ARPKD: MC numbers do not increase during progression of hepatic cystic disease as we see in PCK rats (Figure 9B) or in humans with ARPKD. 24 Therefore, in our second experiment, we exposed Pkhd1LSL(−)/LSL(−) mice to CS and evaluated hepatic cystic indices. Similar to PCK rats, Pkhd1LSL(−)/LSL(−) mice exhibited aggressive development of hepatic cysts and pericystic fibrosis by PND 30. 28 However, toluidine blue staining demonstrated that MCs were not present in livers from Pkhd1LSL(−)/LSL(−) mice (Figure 9B). Confident that these mice were effectively liver MC deficient, we then exposed Pkhd1 mutant mice to CS and evaluated cyst growth and fibrosis using the same methods as performed for PCK rats. We found that CS treatment did not affect liver to body weight ratios (Figure 9C), cyst area (Figure 9D), or fibrosis (Figure 9E and F).
As a third approach to investigate if CS directly impacts cyst growth and fibrosis in ARPKD, we treated PCK rats with another MC stabilizer, ketotifen, from PND 15 to PND 30. Similar to what we found in CS-treated PCK rats, ketotifen treatment effectively inhibited MC degranulation compared to the saline-treated group (Figure 10A and B). We also measured tryptase level in serum, but we did not detect a significant difference between saline- and ketotifen-treated groups (Figure 10C). We evaluated hepatic cyst burden and fibrosis after ketotifen treatment and found that hepatic cyst size was significantly increased with no change in hepatic fibrosis (Figure 11A-D); renal cyst size did not change after ketotifen treatment (Figure 11E).
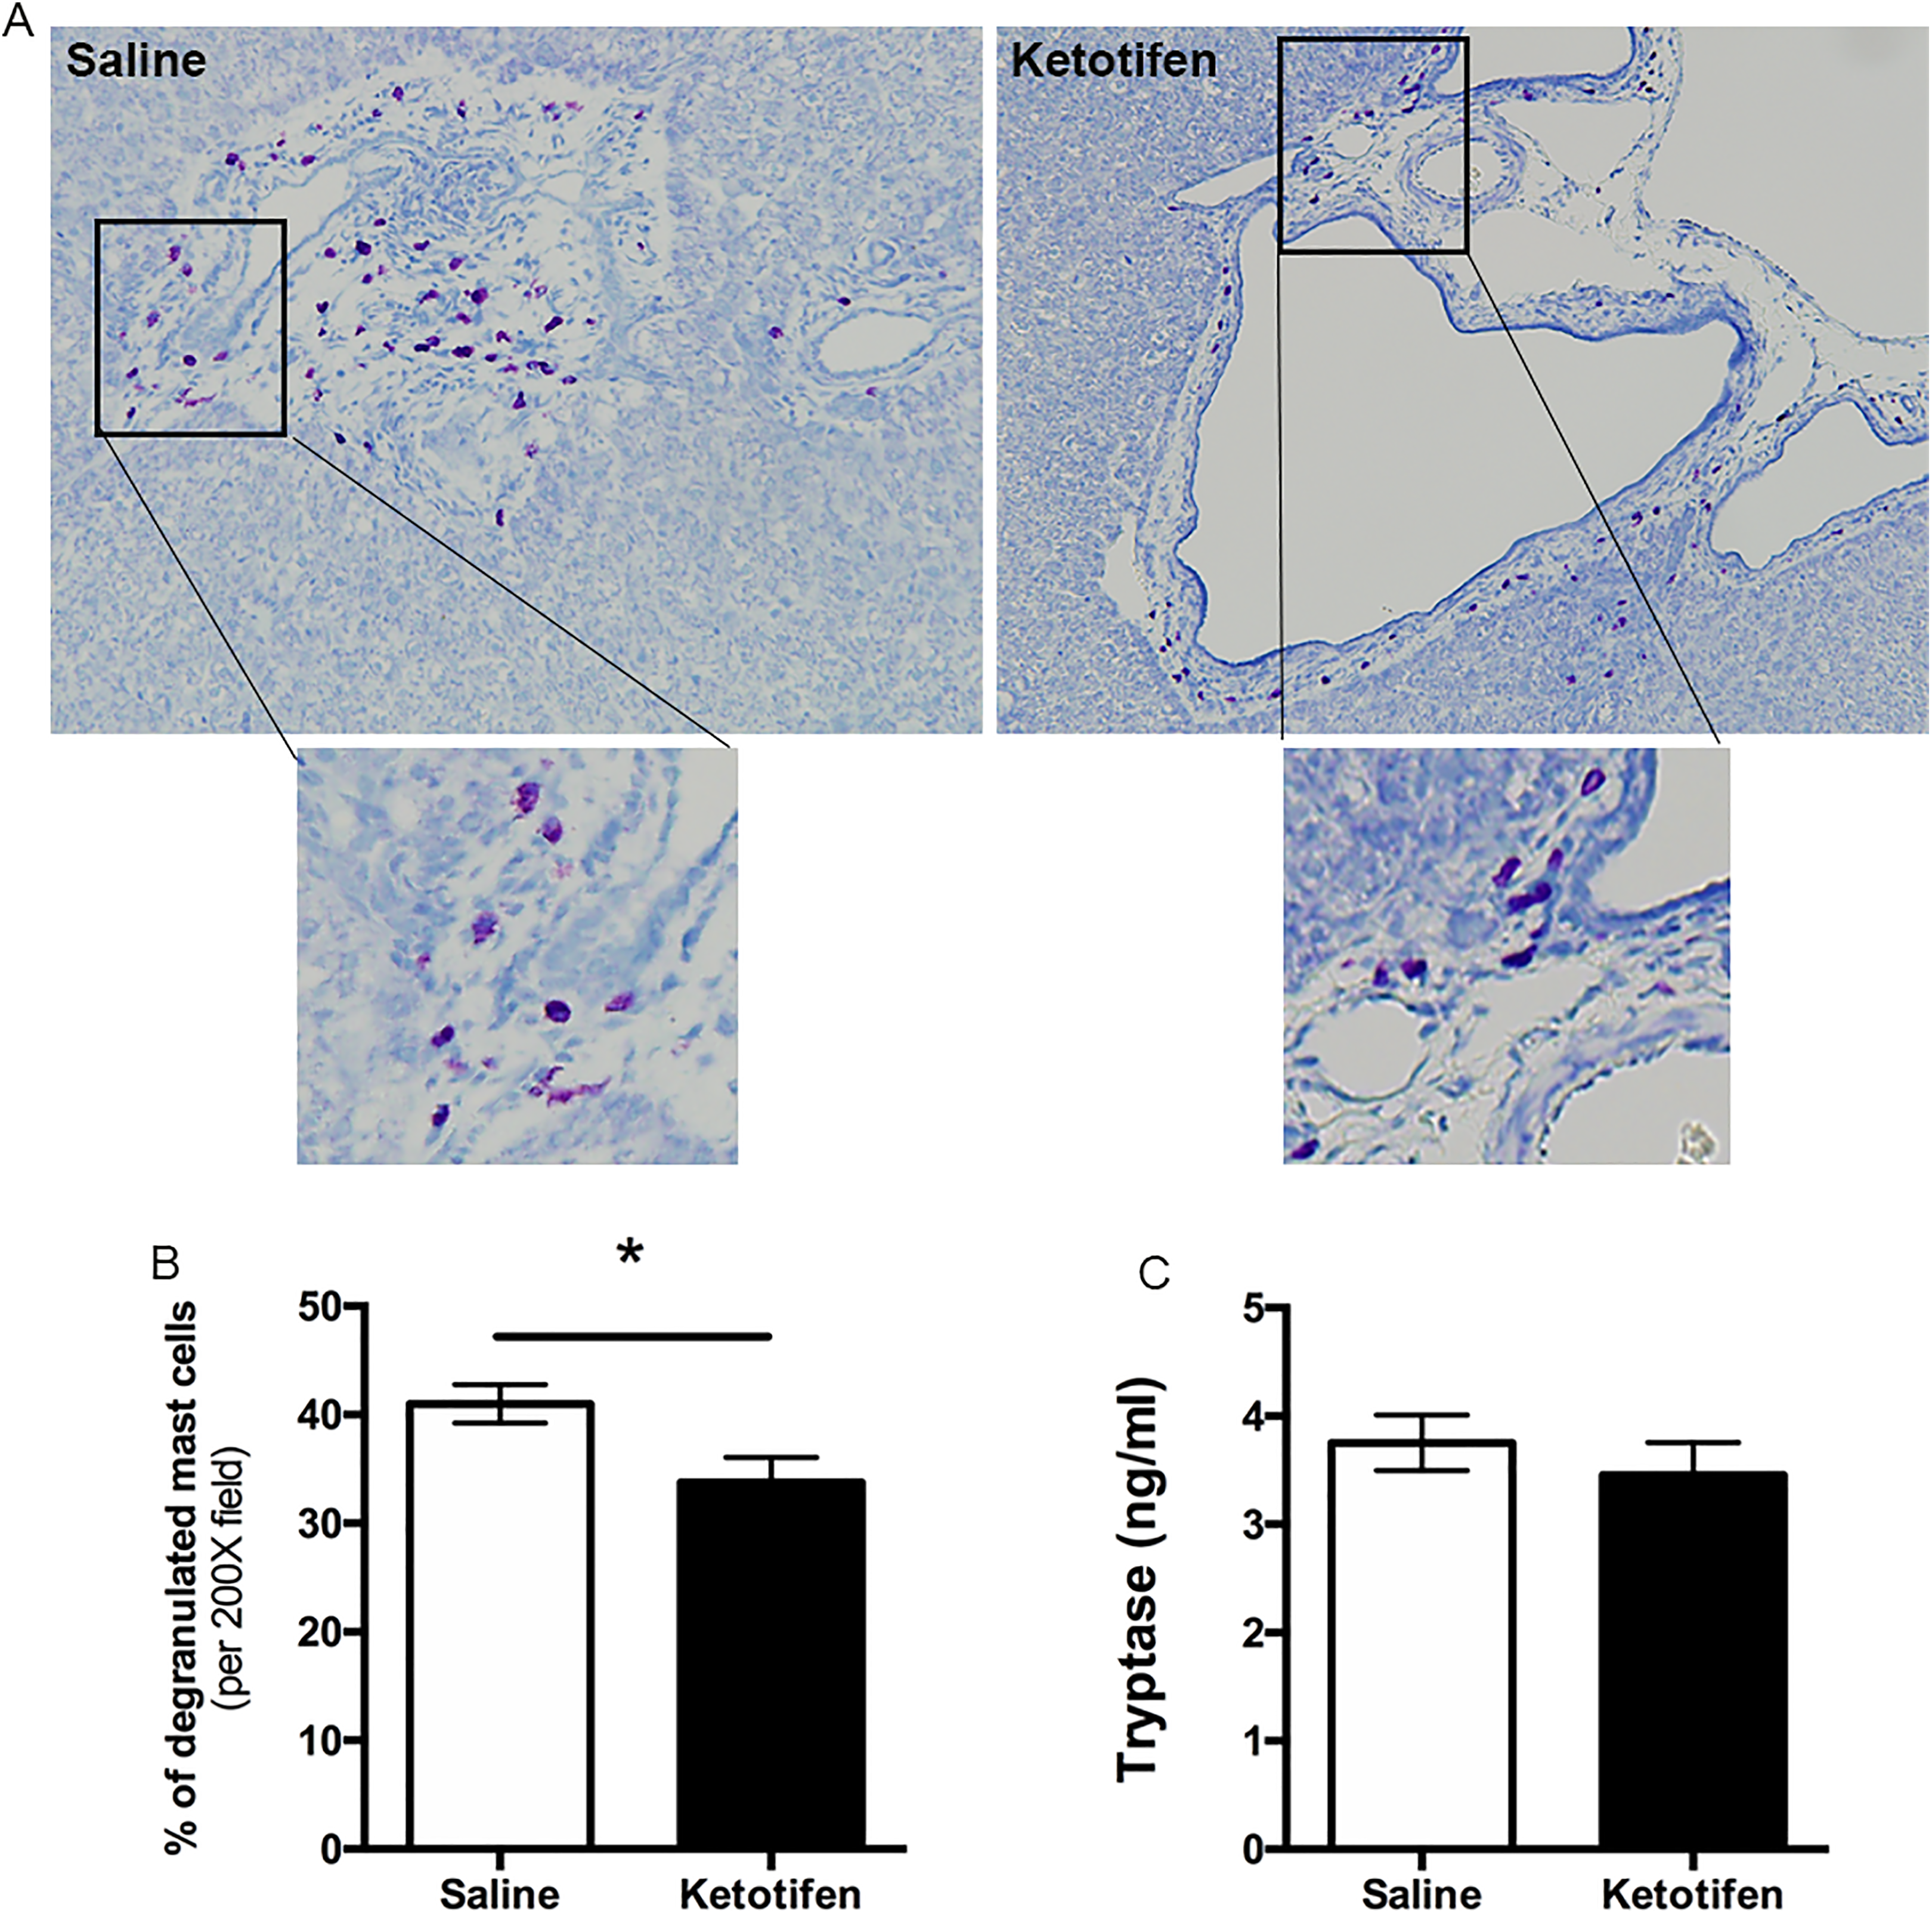
Effect of ketotifen on mast cell (MC) degranulation in PCK rats. A, Representative images of toluidine blue-stained liver sections from a saline-treated PCK rat and a ketotifen-treated PCK rat. Images were taken at 200× magnification. B, Percentage degranulated MC after saline or ketotifen treatment. C, Serum level of tryptase in saline and ketotifen treatment groups. N = 8 rats per group. * P < .05 between groups. PCK indicates polycystic kidney.
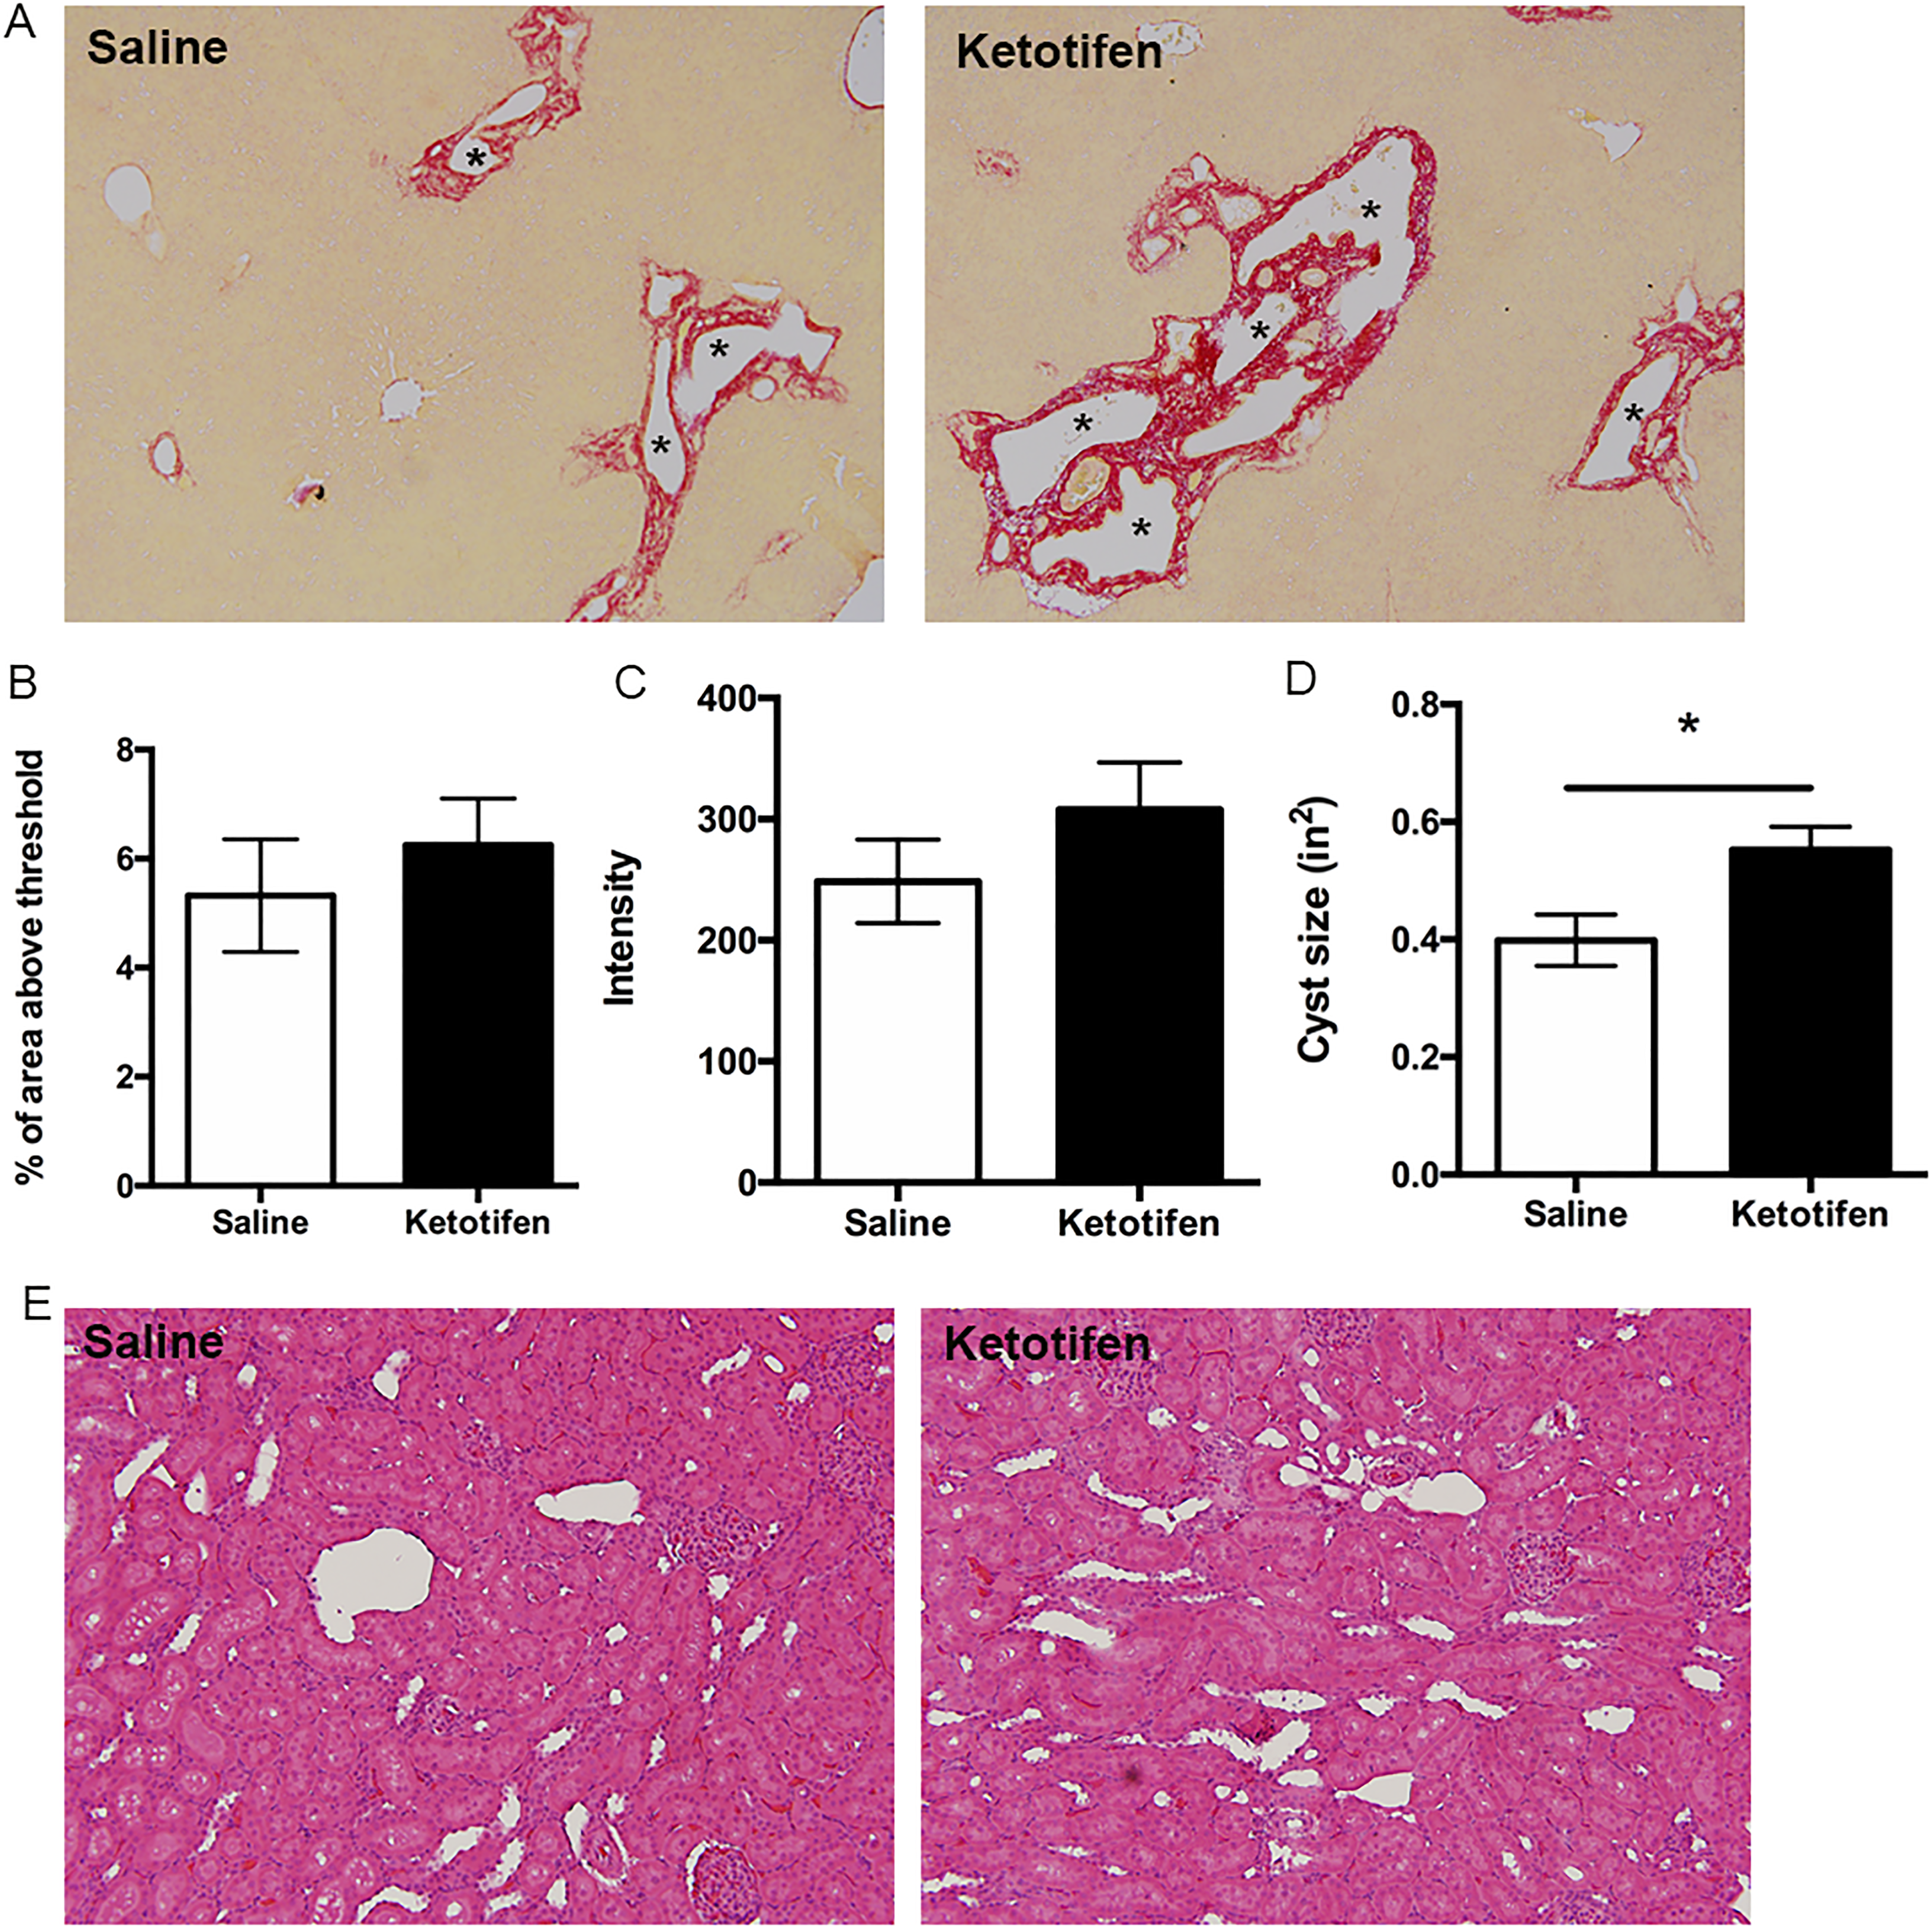
Evaluation of liver cysts and fibrosis following ketotifen treatment in PCK rats. A, Representative images of Sirius red-stained liver sections from saline- and ketotifen-treated PCK rats. Images were taken at 100× magnification. Asterisks (*) indicate cysts. B and C Quantification of Sirius red staining by calculating percentage of Sirius red-positive area (B) and measuring intensity (C) in saline- and ketotifen-treated PCK rats. D, Average cyst size after saline or ketotifen treatment. E, Representative images of hematoxylin and eosin (H&E) stained kidney sections from saline- and ketotifen-treated PCK rats. Image was taken at 200× magnification. N = 7 to 8 rats per group. * P < .05 between groups. PCK indicates polycystic kidney.
Increased activity of renin–angiotensin–aldosterone system (RAAS) has been implicated in the pathogenesis of renal cysts in ADPKD and ARPKD. 50 -52 To investigate if renin, an MC granule component, was responsible for the change of renal cyst size, we measured renin level in serum samples from SD rats and PCK rats treated with saline, CS, or ketotifen. We found that renin level in saline-treated PCK rats was significantly higher compared to SD rats (Figure 12A). Compared to saline-treated PCK rats, CS treatment trended to decrease renin, but the decrease was not statistically significant. Ketotifen treatment had no impact on renin level compared to saline-treated PCK rats (Figure 12A). Interestingly, the percentage of kidney to body weight ratio was strongly correlated with renin level in PCK rats, suggesting a role of renin in renal cyst progression (Figure 12B).
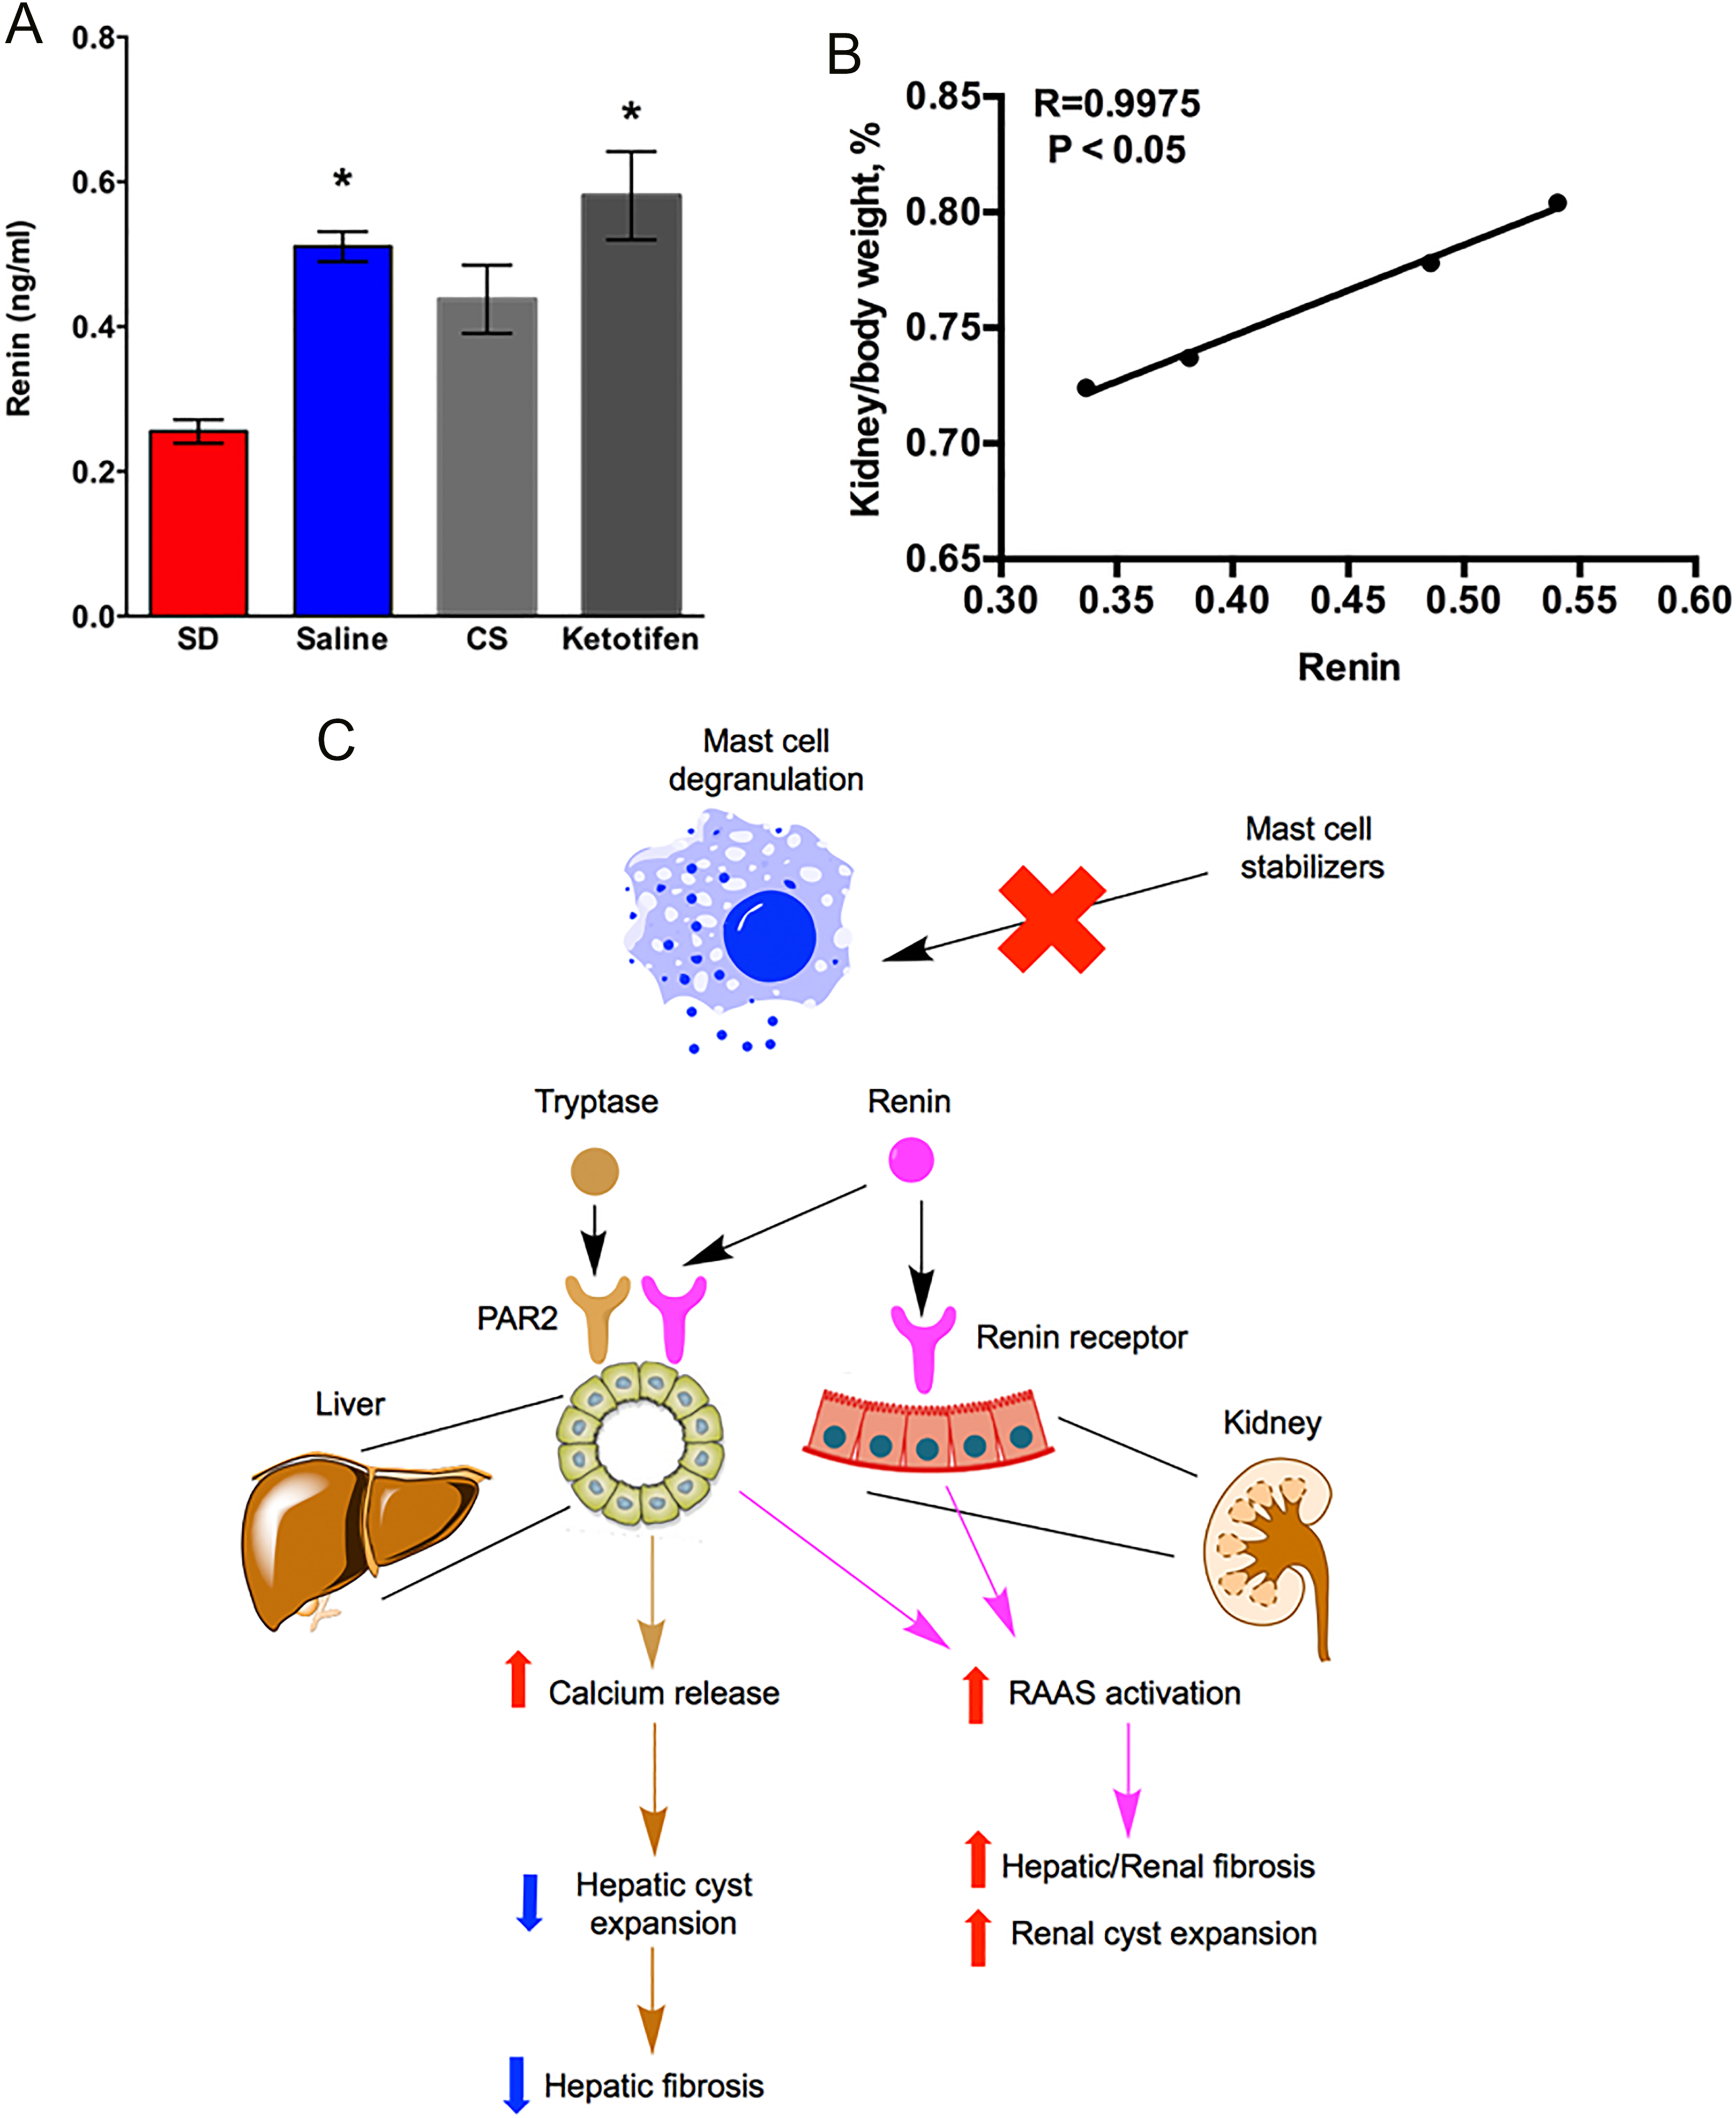
Evaluation of the relationship between renin and kidney cyst growth. A, Serum level of renin in SD rats, saline-treated PCK rats, cromolyn sodium (CS)-treated PCK rats, and ketotifen-treated PCK rats. N = 4 to 13 per group. * P < .05 compared to SD. B, Correlation between renin and percentage of kidney to body weight ratio in PCK rats. R = 0.9975, P < .05. C, Working model: different mast cell (MC) granule components have different effects on liver versus kidney in CHF/ARPKD. In liver samples from PCK rats, we observed an increased MC infiltration and increased expression of tryptase receptor (PAR2). Activation of PAR2 induces an increase in intracellular Ca2+ that prevents cyst expansion by limiting intracellular cAMP levels. Therefore, inhibition of tryptase release by mast cell stabilizing agents could prevent increases in intracellular Ca2+ levels, leading to a high intracellular cAMP, further exacerbating hepatic cyst expansion. Whether renin has an effect on liver cysts remains to be elucidated. In the kidney, the pathogenic role for infiltrated MC is likely minimal since renal MC numbers are very low and restricted to connective tissue surrounding the kidney. However, as MC granules contain renin and the renin–angiotensin–aldosterone system promotes autosomal dominant polycystic kidney disease, 53 inhibition of MC degranulation anywhere in the body could attenuate renin levels. Therefore, the reduction of renal cyst size we observed after stabilizing MCs could be due to a decrease in systemic renin and renin-mediated renal cyst expansion. Moreover, as renin also has profibrotic effects, reduced renin levels due to MC granule stabilization could attenuate fibrogenic processes in the liver or in the kidney. ARPKD indicates autosomal recessive polycystic kidney disease; cAMP, cyclic adenosine monophosphate; CHF, congenital hepatic fibrosis; PCK, polycystic kidney; SD, Sprague-Dawley.
Discussion
The ARPKD is a rare genetic disease accompanied by hepatorenal cysts and pericystic fibrosis. 53,54 Previously, we hypothesized that the disease is regulated by a “pathogenic triumvirate” consisting of CWEC proliferation, fibrosis, and inflammation. 27 The MCs are inflammatory cells found in a number of pathologies. 55 In this study, we investigated the role of MCs in the progression of hepatorenal cyst growth and associated fibrosis in PCK rats. Our findings provide novel evidence to support the differential function that MCs have on cholangiocyte and renal epithelial cell proliferation in an animal model of ARPKD. Our study demonstrated that (1) MCs infiltrated the pericystic areas of PCK rat liver but did not accumulate in the cystic regions of PCK rat kidney; (2) increased MC infiltration correlated with increased expression of MC markers in PCK rat liver, and (3) inhibition of MC degranulation promoted hepatic cyst growth but inhibited (CS), or did not alter (ketotifen), renal cyst growth in PCK rats.
The MCs function, in part, through the release of preformed mediators found in large cytoplasmic granules in a process called degranulation. Granule contents include molecules such as histamine, proteases, and proinflammatory cytokines. 17 Previous studies by Kennedy et al suggest that histamine is the major MC granule component that stimulates cholangiocyte proliferation in bile duct ligated rats (a model of cholestasis). 33 To study MC degranulation in PCK rat livers, we quantified the number of degranulated MCs in PCK rats. Our data suggested that MC degranulation peaked at PND 30, in parallel with the peak of MC infiltration. By treating PCK rats with CS, an MC stabilizer, we found MC degranulation was significantly inhibited in line with reduced serum tryptase level. Previous studies show that CS treatment decreases cholangiocyte proliferation and increases apoptosis in animal models of cholestasis and primary sclerosing cholangitis. 33, 56 In contrast, we saw a different effect of CS in our model where CS treatment increased hepatic cyst size by increasing CWEC proliferation and decreasing CWEC apoptosis. The CS-related enhancement of hepatic cyst growth was supported by several parameters, including liver to body weight ratio, cyst size, CWEC proliferation, and cell death. Consistently, inhibiting MC degranulation with ketotifen also significantly increased hepatic cyst size. We excluded the direct effect of CS on hepatic cysts by incubating isolated CWECs with CS for 48 hours (Figure 9A), supporting the idea that MCs, and not CS alone, limit hepatic disease in PCK rats.
A previous study suggests that histamine from MCs stimulates cholangiocyte proliferation in a rat model of cholestasis, 33 and inhibiting MC degranulation with CS inhibits cholangiocyte proliferation in that model. Those data suggest that histamine–histamine receptor interactions are critical for cholangiocyte proliferation. In our study, we examined the expression level of histamine receptors by real-time PCR using biliary tree samples from SD and PCK rats. We found that H1R and H2R expression in PCK rats did not differ from SD rats, and there was no systemic decrease in serum histamine level after CS treatment. This suggests that histamine may not play a pathogenic role in ARPKD. However, we observed a decrease in serum tryptase level after CS treatment, and the mRNA for its receptor, PAR2, was expressed significantly higher in PCK rats compared to SD rats. Activation of PAR2 induces a rapid Ca2+ influx intracellularly 57 that acts as an antagonist of cyst expansion by decreasing cAMP levels. 58 It is plausible to speculate that reduction of tryptase by CS caused a decrease in Ca2+ level, which further exacerbated hepatic cyst expansion in a cAMP-dependent manner (Figure 12).
Previous studies suggest that the RAAS is upregulated in the liver and kidney from PCK rats, and its activation is associated with hepatorenal cyst expansion and fibrosis. 51,59 The MCs are capable of synthesizing and releasing the active form of renin. Therefore, this extrarenal renin production could further activate the RAAS. 13 Consistent with previous studies, systemic renin was increased in PCK rats compared to SD rats, suggesting a role of renin in pathogenesis of ARPKD. Inhibition of MC degranulation with CS trended to reduce plasma renin levels in our study. We expected a decrease in liver fibrosis after CS treatment, but this did not happen. However, several mediators can promote fibrosis, so perhaps a reduction in renin did not attenuate fibrosis because other factors were still promoting fibrosis. For example, increased liver stiffness is a key factor driving the progression of fibrosis. 60 We observed an increase in hepatic cyst size after CS treatment which could have increased liver stiffness. Therefore, it is plausible to speculate that reduced renin levels in the context of increased liver stiffness prevented an attenuation of fibrosis after CS treatment.
The MCs are associated with a variety of renal diseases. Although MCs are found infrequently in normal kidneys, their number increases in the presence of renal injury. 61 In PCK rat kidneys, MC number did not increase even though they develop renal cysts and interstitial fibrosis. Therefore, we speculate that MCs may not play a pathogenic role on renal cyst growth. It is already appreciated that RAAS activation contributes to the pathophysiology of ADPKD not only through the promotion of hypertension but also by directly stimulating the growth of renal cysts. 62 Therefore, the beneficial effect of CS treatment on renal cyst reduction could possibly due to a decrease in serum renin level (Figure 12). As we expected, although the decrease of renin in CS-treated PCK rats was moderate, we showed a strong correlation between percentage of kidney to body weight ratio and renin. In contrast, ketotifen treatment didn’t affect renin level as we saw in the CS experiment. This may explain why we didn’t observe renal size change after ketotifen treatment. In addition to renin, serum tryptase was not significantly suppressed in PCK rats after ketotifen treatment, despite evidence for MC granule stabilization in ketotifen-treated rats. These data suggest that the strength of the MC stabilization differed between the 2 compounds.
In contrast to what we found in the liver, CS treatment caused a decrease in noncystic renal epithelial cell proliferation, suggesting that MC stabilization may delay formation of renal cysts. Interestingly, we also observed a decrease in cystic renal epithelial cell death after CS treatment to PCK rats. Consistently, a previous study suggests that inhibiting apoptosis in a rat model of PKD effectively inhibits cystogenesis. 63 Whether a decrease in renal epithelial cell proliferation mediated by renin or other mediators or increase in cystic epithelial cell death is the driver or the outcome of cystogenesis in our study remains to be elucidated.
Finally, a previous study suggests that activation of RAAS may lead to formation of interstitial fibrosis in kidney. 64 Therefore, inhibiting renin release by CS treatment may contribute to a decrease in renal fibrosis. Although kidney fibrosis is not established at this time point in PCK rats, we did observe that 2 fibrotic genes, Acta2 and Col1a1, were reduced after CS treatment. This suggests reduced fibrogenic potential in the kidney. Further analysis is needed to determine whether the decrease in fibrotic gene expression is due to a reduction in renal cyst size as discussed above for the liver or an inhibition of RAAS activation.
In summary, we have shown that MC number is increased in the liver but not the kidney in PCK rats, an animal model of CHF/ARPKD. Inhibition of MC degranulation with CS had differential effects on hepatic and renal disease in the PCK rat. These data indicated a protective role of MC in hepatic pathophysiology but a pathogenic role in renal pathophysiology. Moreover, this study also suggests that mechanisms driving cholangiocyte proliferation in animal models of other biliary diseases are not directly translatable to mechanisms which drive CWEC proliferation in CHF/ARPKD. Clinically, usage of CS may be beneficial to patients who only have renal cysts but should be prescribed with caution to patients with hepatic cysts. In the case of ARPDK where patients have both hepatic and renal cysts, CS should be avoided to prevent exacerbation of hepatic disease. However, perhaps CS’s renoprotective effects could be explored further and lead to kidney-targeted drug delivery approaches to achieve therapeutic benefit in that organ independent of negative impacts on hepatic cystic disease.
Footnotes
Authors’ Contribution
Jiang, L. and Pritchard, M. contributed to conception and design, contributed to acquisition, analysis, and interpretation; drafted manuscript; and critically revised manuscript. Fang, P. and Seth, S. contributed to acquisition and analysis and drafted manuscript. Apte, U. contributed to conception and design, contributed to analysis and interpretation, and drafted manuscript. All authors gave final approval and agree to be accountable for all aspects of work ensuring integrity and accuracy.
Declaration of Conflicting Interests
The author(s) declared no potential conflicts of interest with respect to the research, authorship, and/or publication of this article.
Funding
The author(s) disclosed receipt of the following financial support for the research, authorship, and/or publication of this article: This study was supported by National Institutes of Health, National Center for Research Resources (P20 RR021940, Michele T. Pritchard), National Institute of General Medical Sciences (P20 GM103549, Michele T. Pritchard), and University of Alabama at Birmingham (P30DK074038, Michele T. Pritchard).