
Abstract
We previously demonstrated that the expression levels of drug-metabolizing enzymes, cytochrome P450 (CYP) enzymes, in the liver are significantly decreased in a murine model of ulcerative colitis (UC). In this study, we investigated changes in the pharmacokinetics of phenytoin, a CYP2C substrate drug, in the presence of UC. Colitis was induced by feeding male mice 3.5% dextran sulfate sodium (DSS) dissolved in drinking water for 10 days. The messenger RNA (mRNA) expression of CYP2C29 and CYP2C37 and the protein expression of CYP2C in the liver were evaluated via real-time reverse transcription–polymerase chain reaction and Western blotting, respectively. In DSS-treated animals, both mRNA and protein expression levels of CYP2C in the liver were significantly reduced relative to those in control animals (by 20%-40%). Phenytoin (30 mg/kg) was administered orally in a single dose to mice, and plasma concentrations were measured. Plasma concentrations of phenytoin were higher in the DSS-treated group than in the control group at 12, 24, and 36 hours after administration. Animals given DSS also exhibited a higher area under the plasma concentration–time curve extrapolated to infinity (AUCinf, 315 μg·h/mL), a delayed elimination half-life (T 1/2, 8.1 hours), and a decreased body clearance (CL/F, 3.52 mL/h) compared with that of control animals (AUCinf, 215 μg·h/mL; T 1/2, 3.6 h; CL/F, 5.58 mL/h). This study indicated that the presence of UC decreases CYP2C expression levels in the liver, thereby delaying the metabolism of CYP2C substrates, including phenytoin, and increasing blood concentrations of these substrates.
Introduction
Ulcerative colitis (UC) is classified as an inflammatory bowel disease. More specifically, it is an inflammatory disease that causes ulceration localized to the large intestinal mucosa and has the main manifestations of diarrhea, bloody stool, abdominal pain, and body weight loss. The number of patients with UC continues to increase in Asian countries. 1,2 Although its causes remain incompletely elucidated, UC is considered to be an autoimmune disease caused by multiple factors underlying abnormal immune functions, such as stress, dietary habits, and changes in intestinal bacterial flora. 3,4
The main treatments for UC are symptomatic: 5-aminosalicylic acid is used for mild conditions and steroids are used for more severe conditions. In recent years, proactive use of a mesalazine preparation (via a drug delivery system) or infliximab, a molecularly targeted drug, has been the treatment of choice for UC and has produced favorable clinical outcomes. In response to these changes in treatment options, pharmaceutical companies are actively engaging in drug development for UC, with efforts centered on molecularly targeted drugs. Immunosuppressive drugs, typified by cyclosporine and tacrolimus, have conventionally been used to treat moderate to severe UC and are often selected as a treatment option because they demonstrate a certain level of clinical efficacy. As described above, various types of drugs are currently used to treat UC and relieve symptoms of this disease. As a result, increased incidences of adverse effects have recently been reported in patients with UC. For example, patients with UC who received cyclosporine have exhibited an approximately 5-fold increase in blood concentrations of this drug, 5 and adverse effects (hypercholesterolemia, hypertension, and tremor, among others) have been reported in 70% or more of such patients. 6 Although the cause of these increased blood concentrations of cyclosporine was previously unknown, our studies using an animal model have shown that these elevated concentrations are attributable to decreased messenger RNA (mRNA) and protein expression levels of the cytochrome P450 (CYP) isoform CYP3A, the major metabolizing enzyme for cyclosporine, in the liver. 7 Furthermore, we have also shown that decreased expression levels of CYP3A in the liver may be due to hepatic inflammation triggered by lipopolysaccharide in the large intestine. 7 These findings suggested the involvement of decreased expression levels of CYP3A in increased blood concentrations of cyclosporine in the presence of UC. In addition to CYP3A, other CYP isoforms, such as CYP1A, CYP2C, CYP2D, and CYP2E, were also found to have markedly decreased mRNA and protein expression levels during the active stage of UC. 7 Based on these findings, we assumed that blood concentrations of administered drugs that are substrates for CYP enzymes other than CYP3A might also increase during the active stage of UC.
A significantly elevated risk of epilepsy among patients with UC has been reported. 8 Phenytoin (pK a: 8.3), 9 an antiepileptic drug, is well absorbed from the gastrointestinal tract 10 and is then metabolized by CYP2C in the liver. Based on the assumption that expression levels of CYP2C are decreased during the active stage of UC, we investigated how blood phenytoin concentrations would fluctuate during this stage.
Materials and Methods
Animals and Treatments
Seven-week-old male ICR mice were purchased from Japan SLC, Inc (Shizuoka, Japan). Colitis was induced by feeding mice 3.5% dextran sulfate sodium (DSS; MP Biomedicals, LLC, Aurora, Ohio) dissolved in drinking water for 10 days (the DSS group; 5 mice). 11 The control group of mice received water without DSS (5 mice). Subsequently, the colon, liver, and small intestine were removed, and the colon length was measured. The liver and small intestine were instantly flash frozen in liquid nitrogen.
The present study was conducted in accordance with the Guiding Principles for the Care and Use of Laboratory Animals as adopted by the Committee on Animal Research at Hoshi University. All surgical procedures were performed under diethyl ether anesthesia, and all efforts were made to minimize suffering.
Assessment of Colitis
The disease activity index was calculated by summing scores for each of the following indicators of pathological conditions associated with UC 12 : percentage of body weight decrease, diarrhea, and bloody feces. The percentage of body weight decrease was calculated as follows: body weight for the control group was established as 100% and percentage change in body weight was calculated and scored (0 = >0%; 1 = −1% to −5%; 2 = −5% to −10%; 3 = −10% to −15%; 4 = −15% to −20%; 5 = <−20%). Diarrhea was scored on a 3-point scale by determining fecal condition (0 = normal feces; 1 = soft feces; 2 = watery feces). Bloody feces was assessed and scored via visual inspection (0 = negative; 1 = positive).
Hematoxylin–Eosin Staining
The colon was fixed in 10% neutral-buffered formalin. After trimming, the colon was embedded in paraffin using a tissue processor, and sections with thicknesses of 3 to 4 μm were cut. These sections were stained with Mayer hematoxylin and eosin-Y and observed by light microscopy.
Real-Time Reverse Transcription–Polymerase Chain Reaction
RNA was extracted from the liver and small intestine using the TRI reagent (Sigma-Aldrich Corp, St Louis, Missouri). A high-capacity complementary DNA (cDNA) synthesis kit (Applied Biosystems, Foster City, California) was used to synthesize cDNA from 1 μg of RNA. Target gene expression was analyzed via real-time reverse transcription–polymerase chain reaction (RT-PCR) using the primers listed in Table 1. Real-time RT-PCR was conducted with a denaturation temperature of 95°C for 15 seconds, an annealing temperature of 56°C for 30 seconds, and an elongation temperature of 72°C for 30 seconds. The fluorescence intensity of the reaction was monitored using an MyiQ single-color real-time RT-PCR detection system (Bio-Rad Laboratories, Hercules, California). Messenger RNA gene expression levels were normalized to β-actin gene expression levels. β-Actin expression levels in DSS-treated UC mice and control mice did not differ.
Primer Sequences for Mouse mRNA.
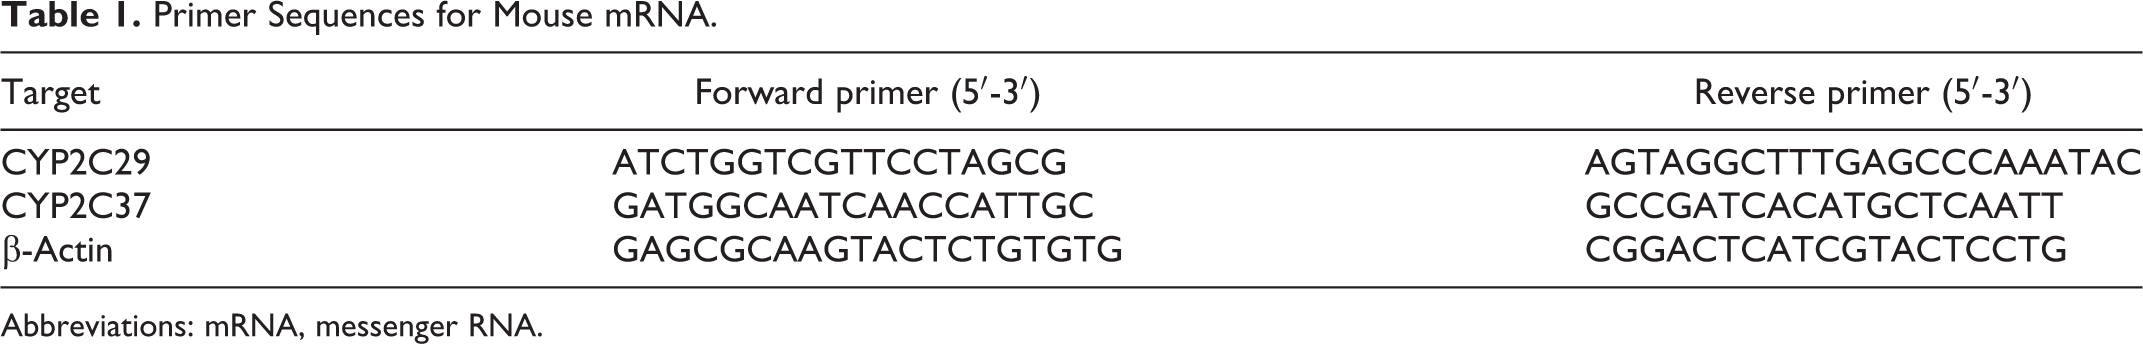
Abbreviations: mRNA, messenger RNA.
Electrophoresis and Immunoblotting
Microsomal fractions from the liver were obtained as previously described. 13,14 Samples were separated using sodium dodecyl sulfate-polyacrylamide gel electrophoresis (SDS-PAGE), and proteins were transferred to a polyvinylidene difluoride (PVDF) membrane. After blocking, the membrane was incubated with primary antibodies for 1 hour. The primary antibodies used were mouse anti-rat CYP2C6 (1/1,000; Sigma-Aldrich Corp) and mouse anti-rabbit glyceraldehyde-3-phosphate dehydrogenase (1/2,000; Chemicon International, Inc, Temecula, California). The membrane was then incubated with donkey anti-mouse immunoglobulin G-horseradish peroxidase (IgG-HRP) antibody (1/2,500; GE Healthcare, Chalfont St Giles, United Kingdom) for 1 hour. Subsequently, the membrane was incubated with ECL prime detection reagent and visualized using an LAS-3000 Mini Lumino image analyzer (Fujifilm, Tokyo, Japan).
Phenytoin Pharmacokinetics
Phenytoin (CAS number 57-41-0, purity 99.0%; Wako Pure Chemical, Osaka, Japan) was administered orally in a single dose (30 mg/kg) to mice fasted overnight (to 25 mice in each group). At 4, 8, 12, 24, and 36 hours after administration, approximately 1 mL of blood was collected from the abdominal vena cava using a heparinized syringe (5 mice/time point). Plasma fractions were separated via the centrifugation of blood samples. The extraction of phenytoin in plasma and analysis using high-performance liquid chromatography-ultra violet (HPLC-UV) were performed as described previously. 15,16
Data Analysis
The area under the plasma concentration–time curve extrapolated to infinity (AUCinf) was calculated using the average concentrations from 5 mice at each time point by applying the linear trapezoidal rule. The elimination rate constant (k el) and elimination half-life (T 1/2 = 0.693/kel) were calculated from the concentration profiles of the elimination phase. The maximum plasma concentration (C max) and the time to maximum plasma concentration (T max) were obtained from actual measurements. Body clearance (CL/F, where F is bioavailability) was calculated using the following formula:

F was treated as a constant because the same formulation of phenytoin was used throughout the study and because we assumed that bioavailability did not differ across different mice. 17
Statistical Analyses
Numerical data are expressed as the means (standard deviation [SD]). The significance of differences was examined using Student t test for pairs of values. The significance of differences was examined by performing analysis of variance followed by Tukey tests for multiple comparisons. Differences with P < 0.05 were considered to be statistically significant.
Results and Discussion
In this study, we established an animal model representing the condition of UC during its active stage to analyze the extent to which a decreased expression level of CYP2C in the liver affects blood concentrations of phenytoin as a substrate drug. We used only male mice for the following reasons: (1) we previously clarified that hepatic CYP2C expression in male UC model mice, 7 (2) many reports concerning UC model animals used males, and (c) the expression of CYP2C in the liver was not different between males and females. 18
The animal model used in the study was a model of DSS-induced UC. A DSS-based model of UC is widely used because the pathological conditions resulting from DSS treatment are very close to those observed during the active stage of UC in humans. 19 More specifically, mice in the DSS model exhibit characteristic symptoms of UC, such as body weight loss, bloody stool, and diarrhea. The results of hematoxylin–eosin staining showed that the colonic mucosa was thicker in the DSS-induced UC model mice than in the control mice. The migration and infiltration of inflammatory cells were also found in the colons of the DSS-treated group. In addition, it was shown that the goblet cells decreased in the DSS colon (Figure 1).
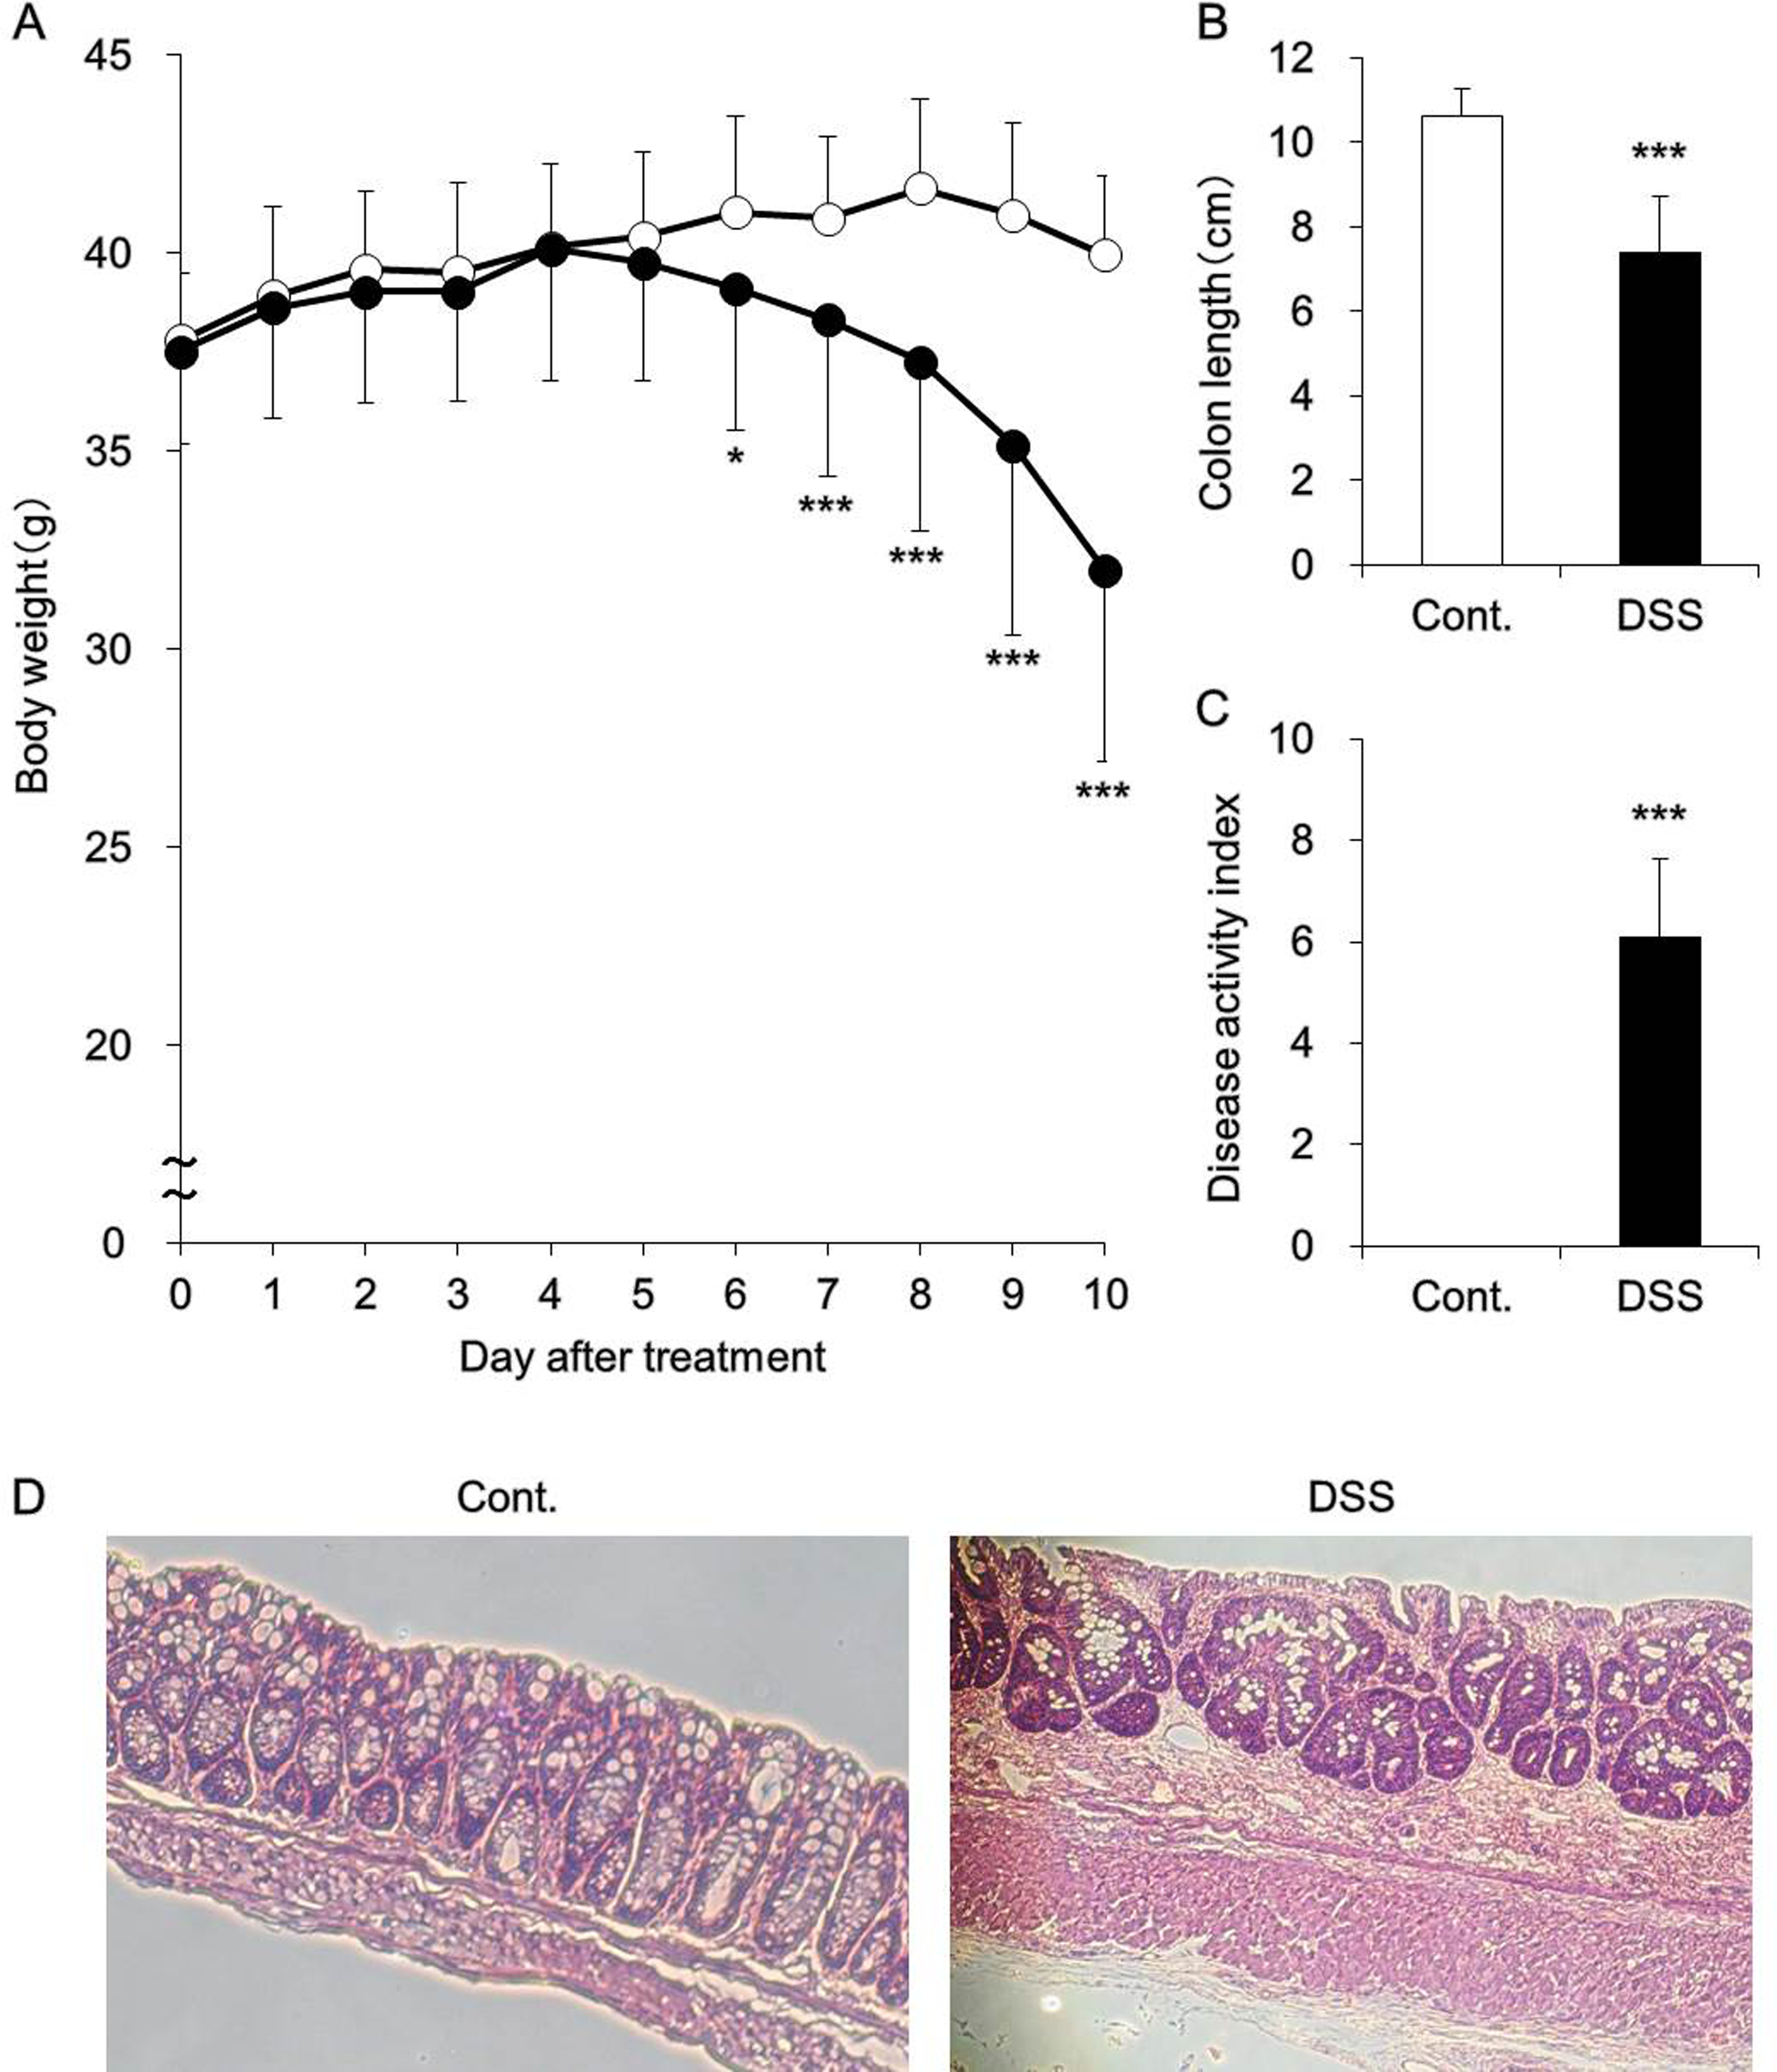
(A) Body weight, (B) colon length, (C) disease activity index, and (D) histology of the colon. Mice were provided with 3.5% dextran sulfate sodium (DSS) dissolved in drinking water for 10 days ad libitum (black). Control mice received water without DSS (white). Body weight (A), colon length (B), and disease activity index (C) were measured. Data are presented as the means (standard deviation [SD]) and were obtained from 5 mice per group. Student t test was performed to determine the statistical significance of between-group differences. Differences with *P < 0.05 and ***P < 0.001 versus the control group were determined to be statistically significant. The colon was fixed in 10% neutral-buffered formalin, paraffinized, and stained using hematoxylin–eosin (D).
Hepatic mRNA expression levels of CYP2C29 and CYP2C37 were analyzed in DSS-treated mice (Figure 2A). These analyses indicated that the expression levels of any CYP2C isoforms were decreased following DSS treatment. These decreases in expression were also identified at the protein level (Figure 2B). These results were consistent with those observed in our previous studies. 7
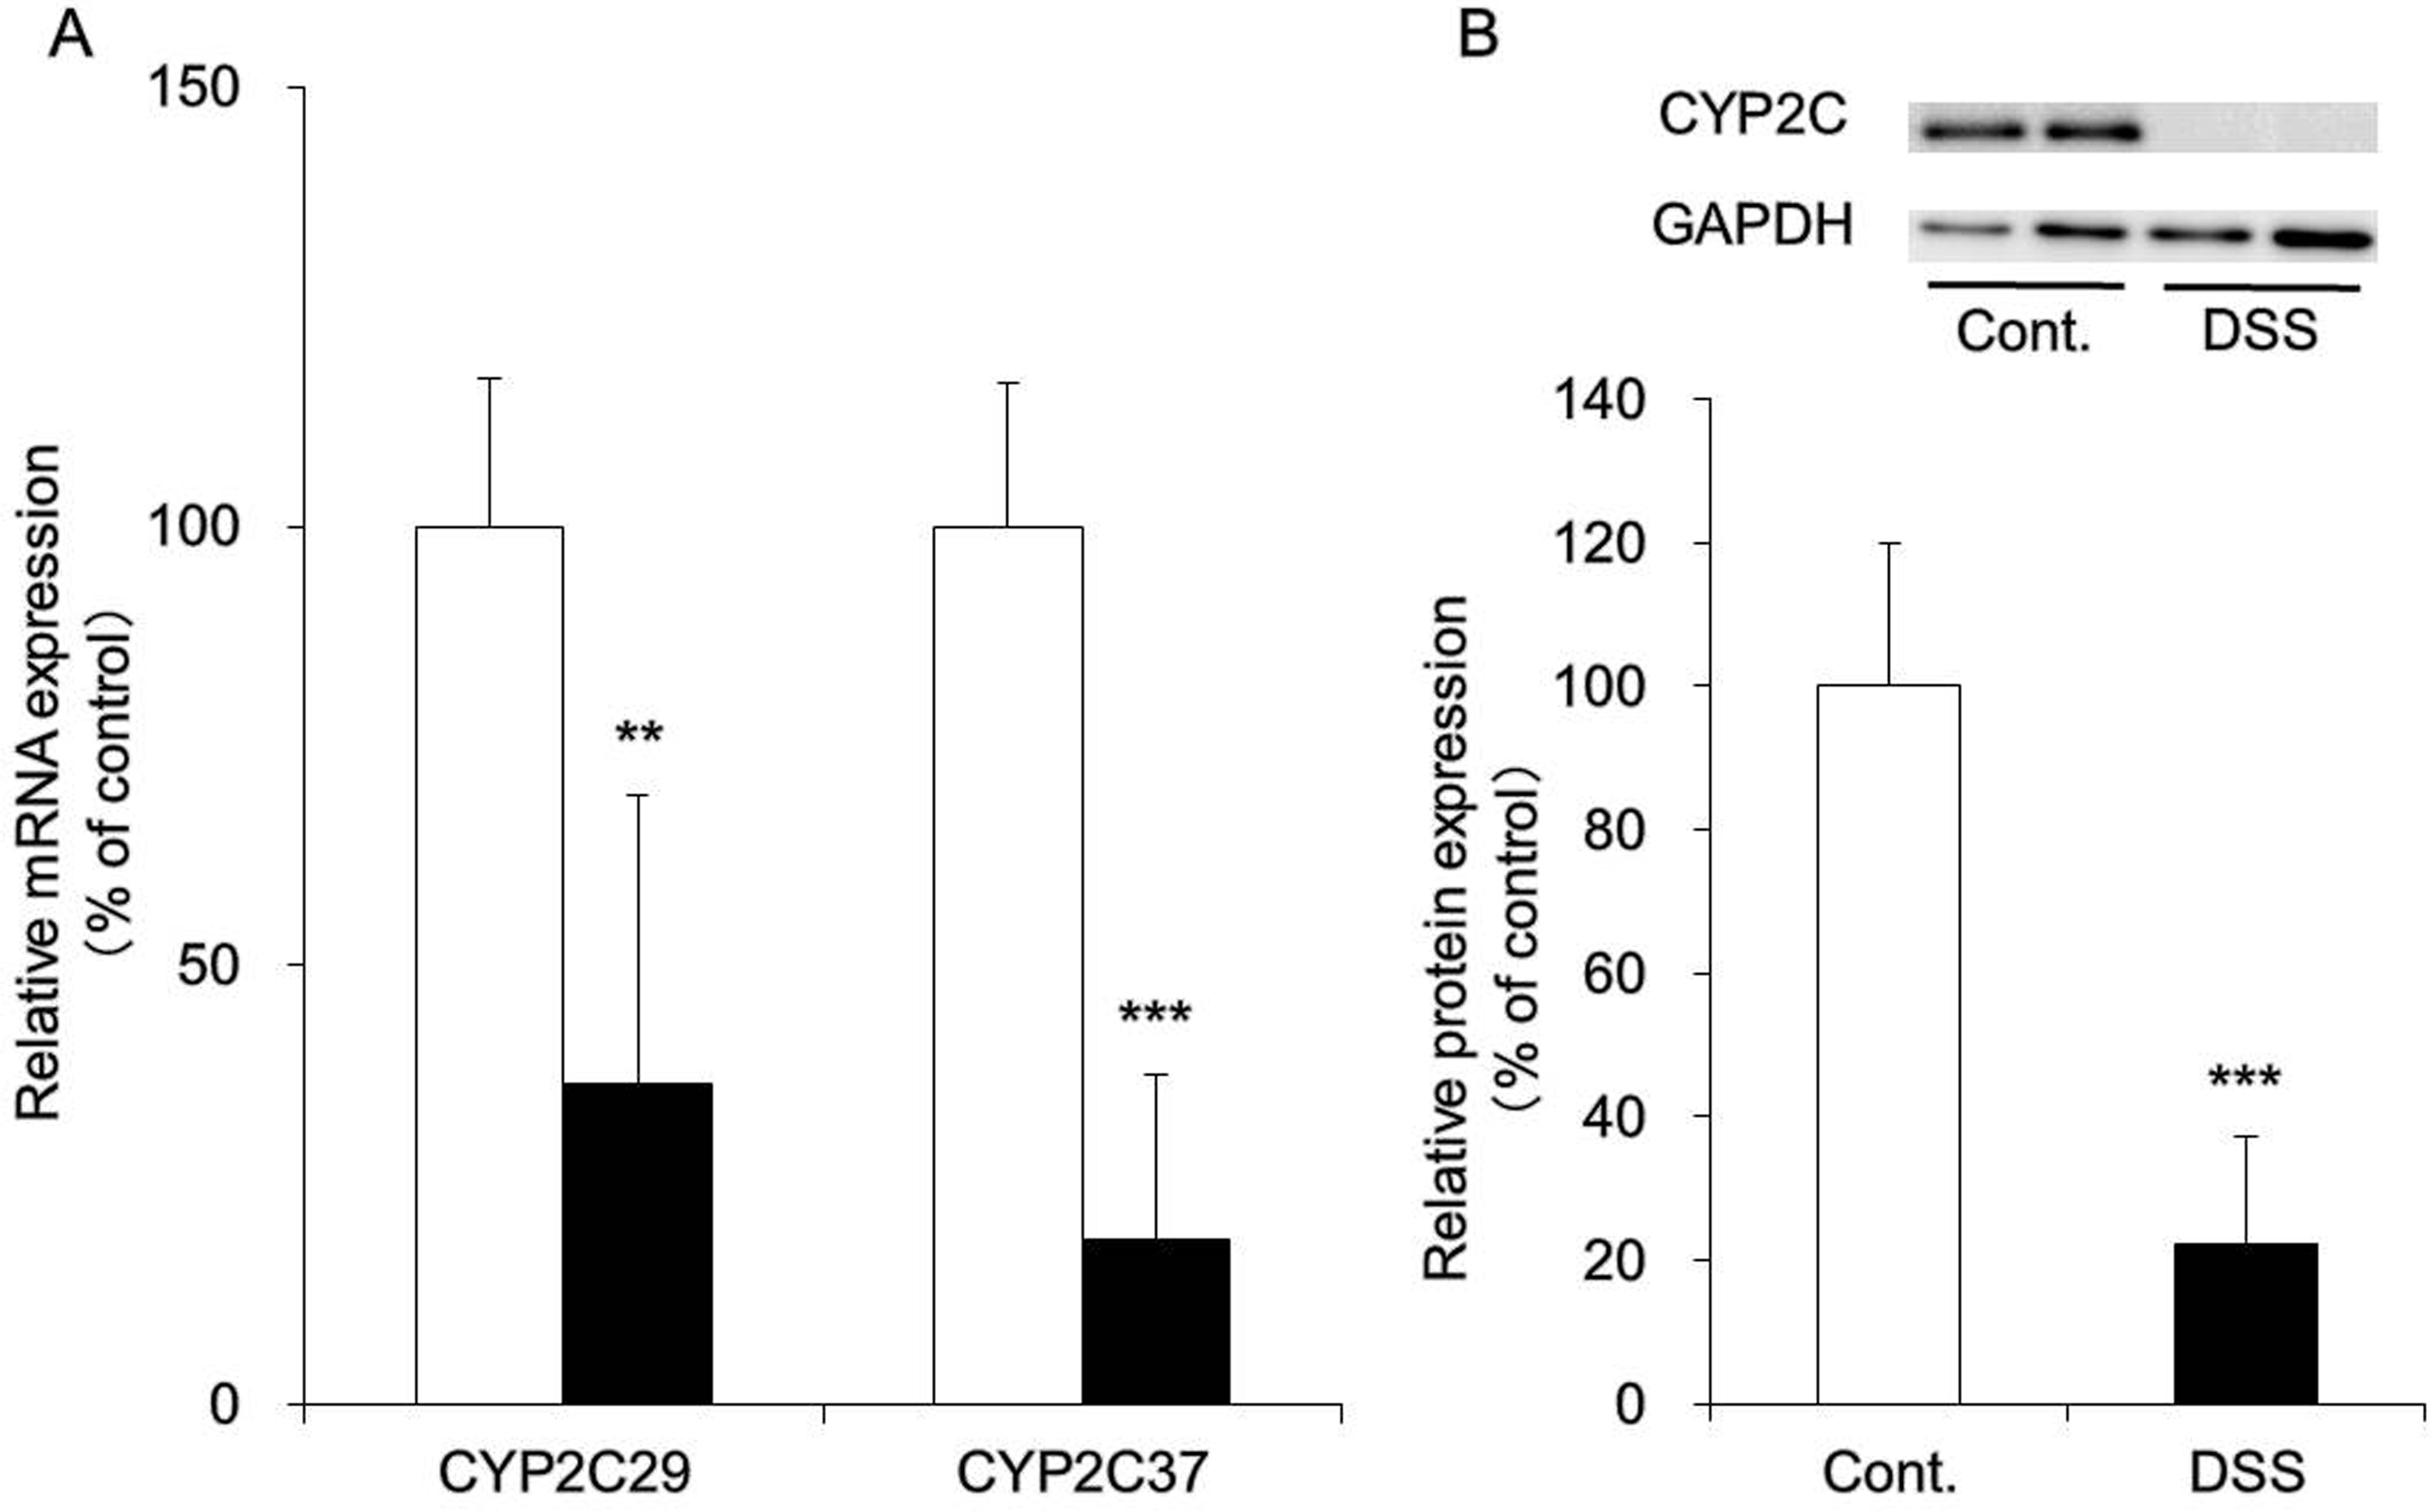
Messenger RNA (mRNA) and protein expression levels of CYP2C in the liver. Mice were provided with 3.5% dextran sulfate sodium (DSS) dissolved in drinking water for 10 days ad libitum (DSS group, black). Control mice received water without DSS (white). A, The liver was removed, and mRNA expression levels of CYP2C29 and CYP2C37 were measured using real-time reverse transcription–polymerase chain reaction (RT-PCR). β-Actin was used as a housekeeping gene, and the averages of values derived from the control mice were expressed as 100%. B, Microsomal fractions were prepared from the liver, and protein expression levels of CYP2C were determined via Western blotting. Glyceraldehyde-3-phosphate dehydrogenase (GAPDH) was used as a housekeeping gene, and the averages of values derived from the control mice were expressed as 100%. Data are presented as the means (standard deviation [SD]) and were obtained from 5 mice per group. Student t test was performed to determine the statistical significance of between-group differences. Differences with **P < 0.01 and ***P < 0.001 versus the control group were determined to be statistically significant.
We then investigated how the pharmacokinetics of a substrate drug for CYP2C would fluctuate in the presence of UC. CYP2C is the second most abundantly expressed CYP isoform in the liver after CYP3A. Substrate drugs for CYP2C include phenytoin, an antiepileptic drug. Phenytoin is designated as a drug for therapeutic drug monitoring and follows nonlinear pharmacokinetics with respect to dose and plasma concentration. 20 In addition, phenytoin has severe adverse effects (blood disorders, hepatic disease, and tremor, among others). Moreover, because interactions between phenytoin and many other drugs have been reported, the use of phenytoin requires the utmost consideration. 21,22 Phenytoin is highly bound to albumin in blood in humans 23 and mice, 24 with little difference between humans and animals in this respect; therefore, in this study, we measured plasma concentrations of phenytoin without separating albumin-bound and unbound phenytoin. For mice treated with DSS, the AUCinf of phenytoin was increased by approximately 1.5-fold and total systemic clearance was decreased to approximately 60% (Figure 3 and Table 2). Phenytoin was administered to mice at a dose of 30 mg/kg in this study. This dose is equivalent to approximately 5-fold the dose used for humans and corresponds to a dose that can inhibit epileptic seizures in mice. 25 In addition, although phenytoin exhibits nonlinear pharmacokinetics, it has been confirmed that the dose of phenytoin used in this study is not associated with nonlinear pharmacokinetics in mice. 25 Phenytoin has a low hepatic extraction rate and capacity-limited hepatic clearance. In the small intestine, CYP2C29 and CYP2C37 mRNA expression and CYP2C protein were not observed in either control mice or DSS-treated mice (data not shown); thus, expression levels of these molecules are extremely low in the small intestine. Therefore, it was presumed that the increase in the AUCinf of phenytoin following treatment with DSS was attributable to decreased expression levels of CYP2C in the liver. This finding suggests the possibility that patients with UC in the active stage who receive phenytoin may experience adverse effects resulting from elevated blood concentrations of this drug. In the DSS-treated group, T max was prolonged, and the following explanation of this finding was proposed. In general, inhibition of intestinal peristaltic movement is associated with drug absorption retardation, which causes the prolonging of T max. Reports have indicated that intestinal peristaltic movement was inhibited in DSS-treated UC model animals 26 and in patients with UC. 27 This peristaltic movement inhibition is regarded as the reason for the prolonged T max for phenytoin in the DSS-treated group.
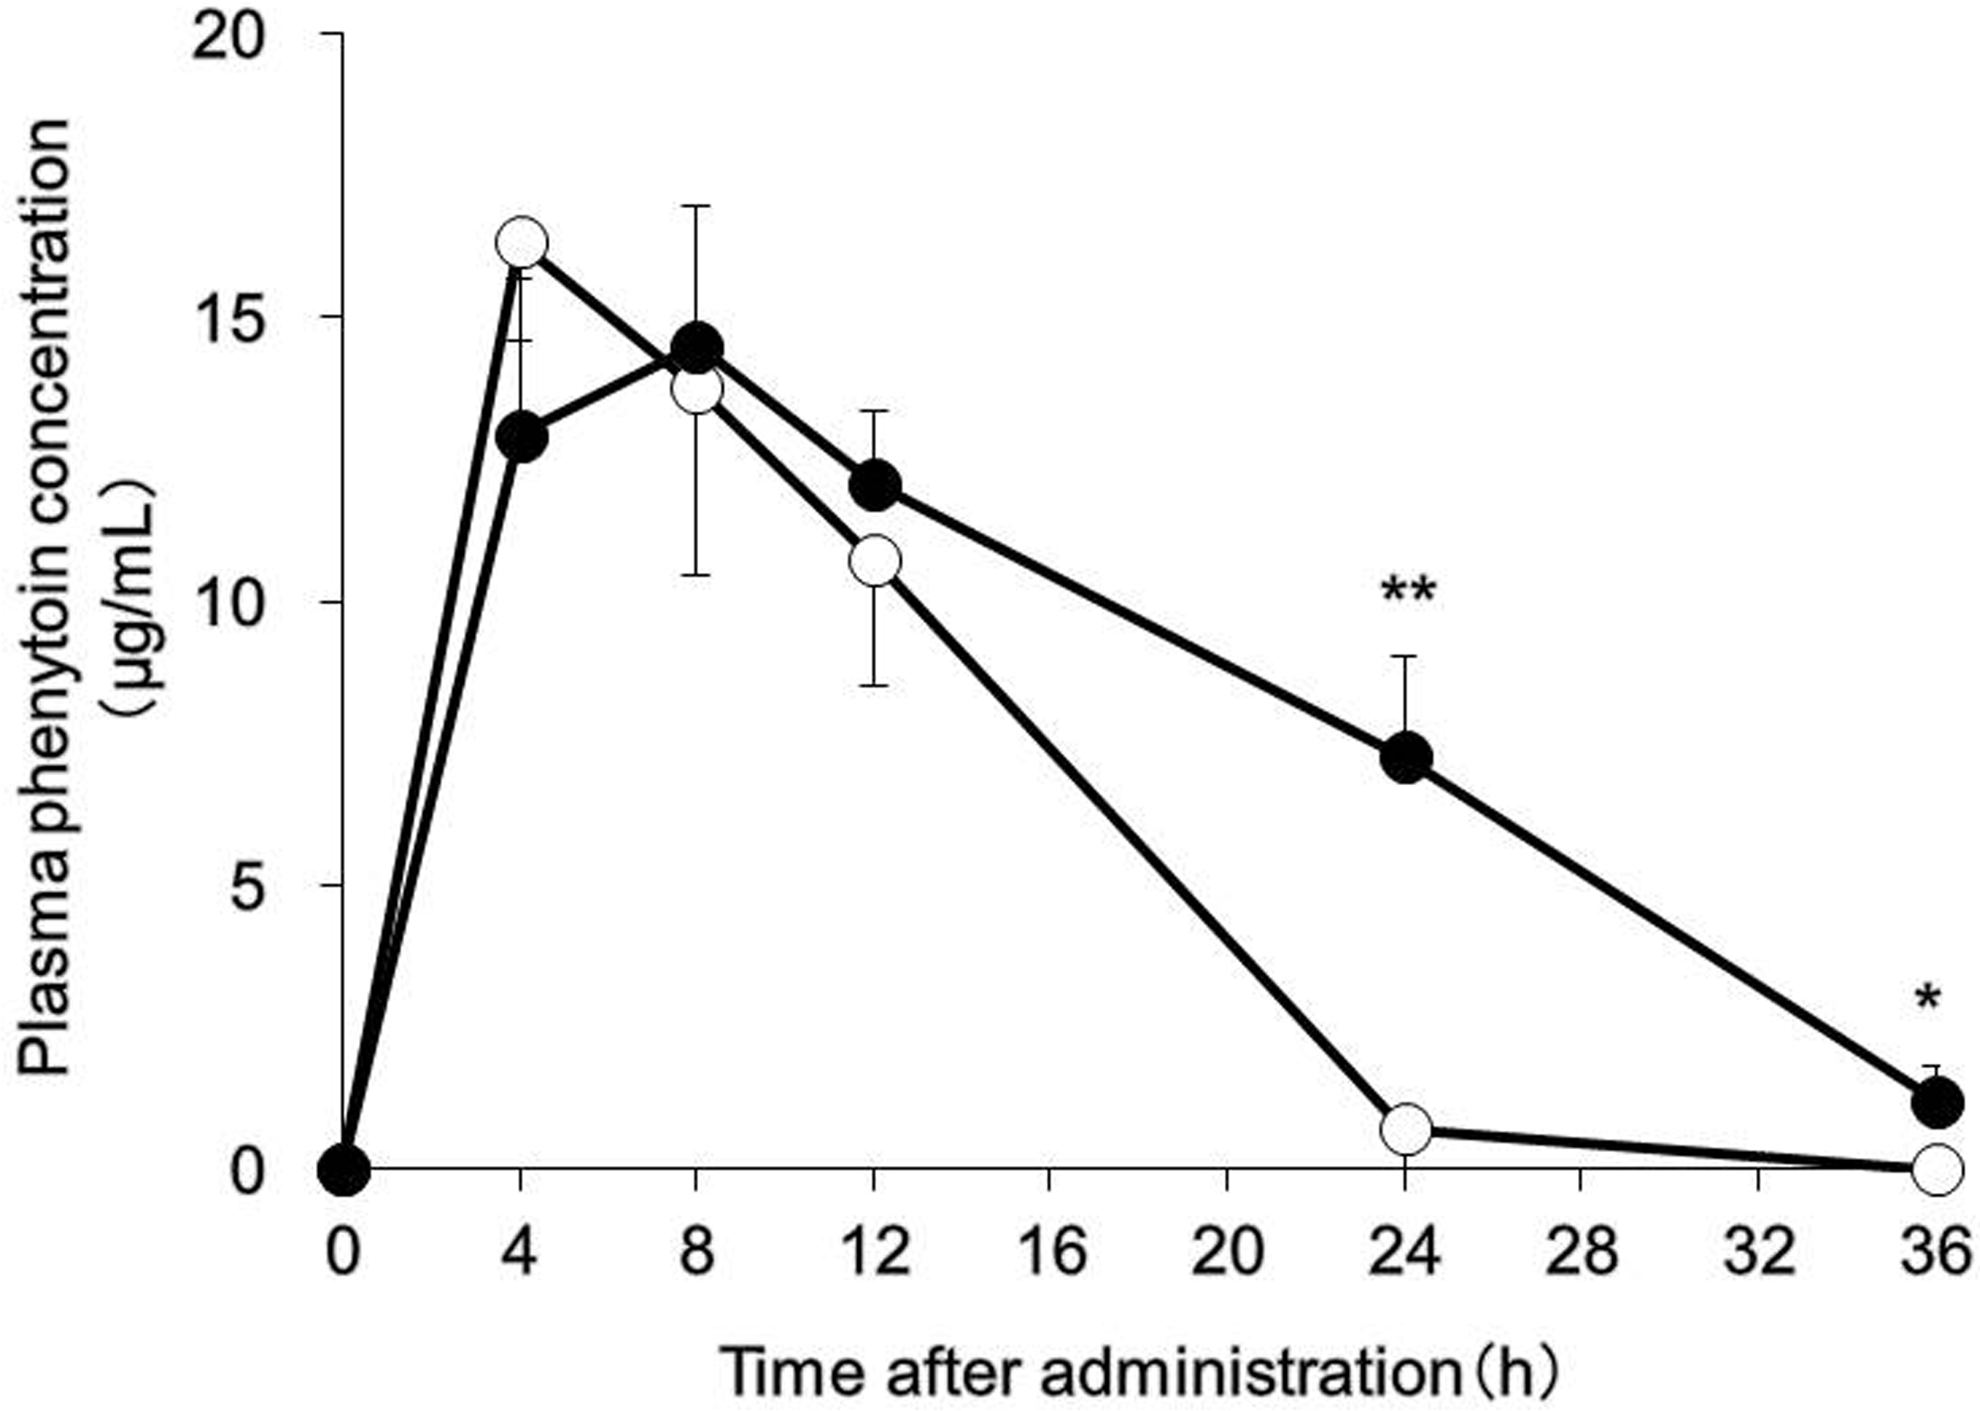
Phenytoin pharmacokinetics. The mice were provided with 3.5% dextran sulfate sodium (DSS) dissolved in drinking water for 10 days ad libitum (DSS group, black). Control mice received water without DSS (white). Phenytoin (30 mg/kg) was orally administered, and high-performance liquid chromatography (HPLC) was used to measure plasma concentrations of phenytoin for up to 36 hours after drug administration. Data are presented as the means (standard deviation [SD] and were obtained from 5 mice per group. Tukey test were used to assess between-group differences; *P < 0.05 and **P < 0.01 versus the control group.
Phenytoin Pharmacokinetic Parameters.a
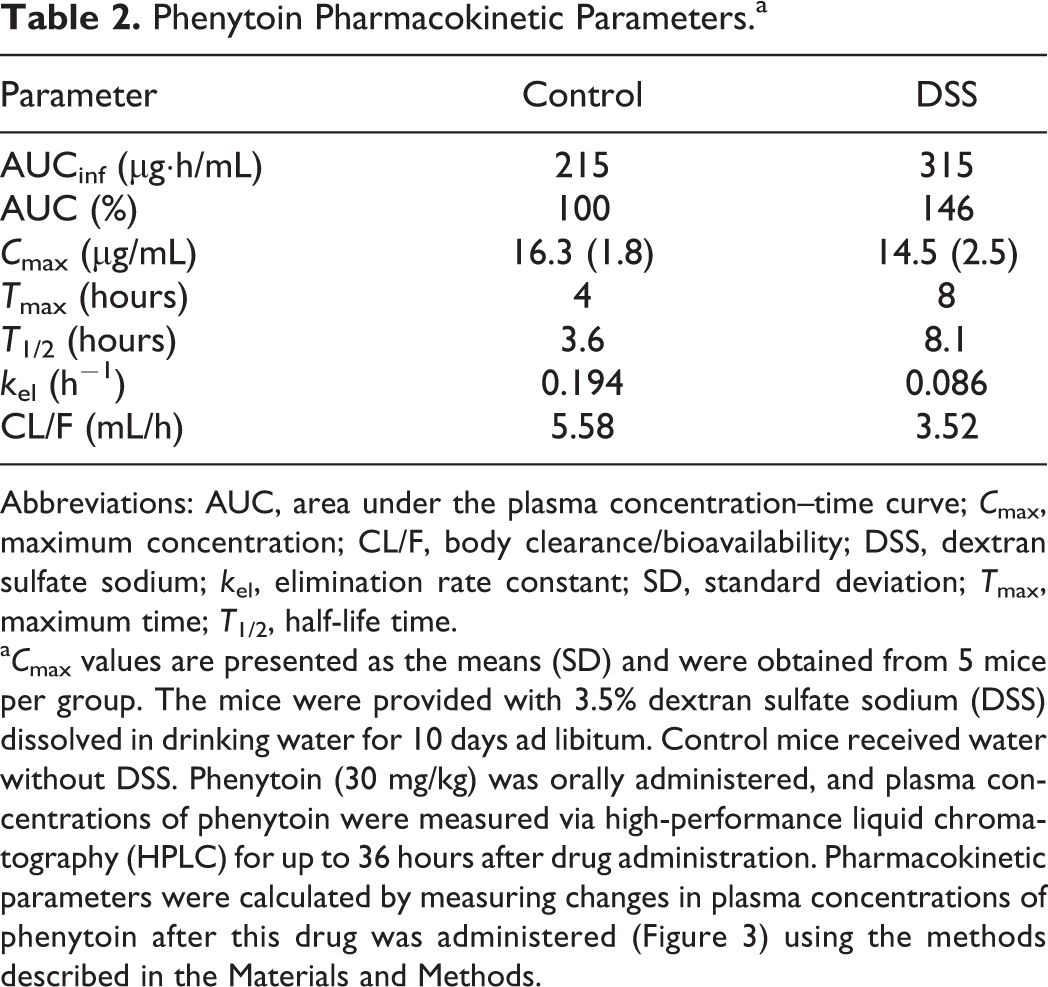
Abbreviations: AUC, area under the plasma concentration–time curve; C max, maximum concentration; CL/F, body clearance/bioavailability; DSS, dextran sulfate sodium; k el, elimination rate constant; SD, standard deviation; T max, maximum time; T 1/2, half-life time.
a C max values are presented as the means (SD) and were obtained from 5 mice per group. The mice were provided with 3.5% dextran sulfate sodium (DSS) dissolved in drinking water for 10 days ad libitum. Control mice received water without DSS. Phenytoin (30 mg/kg) was orally administered, and plasma concentrations of phenytoin were measured via high-performance liquid chromatography (HPLC) for up to 36 hours after drug administration. Pharmacokinetic parameters were calculated by measuring changes in plasma concentrations of phenytoin after this drug was administered (Figure 3) using the methods described in the Materials and Methods.
Our study has shown that during the active stage of UC, expression levels of CYP2C in the liver are decreased and blood concentrations of CYP2C substrates are increased. Prior studies on UC have mainly focused on the elucidation of etiology and the development of therapeutic drugs, and a limited number of studies have investigated the appropriate use or safety of existing drugs. Masubuchi and Horie reported reduced activity of CYP in the liver in a mouse model of DSS-induced UC. 28 We also reported delayed metabolism of triazolam, a substrate drug for CYP3A, in the presence of UC. 7 However, these reports described results from in vitro studies that utilized hepatic microsomal fractions and did not describe any results from in vivo studies on pharmacokinetic parameters. This study presented in vivo results involving detailed calculations of pharmacokinetic parameters and provided useful findings for the design of dosage regimens for patients with UC. Moreover, our study deeply investigated current drug therapy methods and thereby produced results with great significance in clinical practice.
In patients with UC, steroids are currently used concomitantly with omeprazole, which is a representative substrate for CYP2C. 29 In certain cases, a hypnotic drug, diazepam, 30 and an anti-inflammatory drug, diclofenac 31 (both of which are also substrates for CYP2C), are used in clinical settings. Therefore, in the presence of UC, the use of these drugs is likely to lead to elevated blood concentrations of these agents, thereby resulting in increased risks of adverse effects. To prevent adverse effects when these drugs are administered to patients during the active stage of UC, dose reduction or other measures may be required. On the other hand, since DSS model organisms merely exhibit symptoms of UC that are artificially induced by treatment with a drug, controversy remains regarding physiological differences between DSS model animals and humans with UC. Therefore, further clinical investigation is required to understand how the results of this study apply to humans.
Footnotes
Acknowledgments
The authors thank Ms Marin Yamashita and Mr Yuki Yoshikawa for their technical assistance.
Author Contributions
Yoshiki Kusunoki contributed to conception and design, contributed to acquisition, analysis, and interpretation, and drafted the manuscript. Yurika Kido contributed to conception and design, contributed to acquisition, analysis, and interpretation, and drafted the manuscript. Yuichi Naito contributed to conception and design and contributed to analysis. Risako Kon contributed to design and contributed to analysis. Nanaho Mizukami contributed to design and contributed to analysis. Miho Kaneko contributed to design and contributed to analysis. Nobuyuki Wakui contributed to design and contributed to analysis. Yoshiaki Machida contributed to conception and design, contributed to acquisition, analysis, and interpretation, and critically revised the manuscript. Nobutomo Ikarashi contributed to conception and design, contributed to acquisition, analysis, and interpretation, drafted the manuscript, and critically revised the manuscript. All authors gave final approval and agree to be accountable for all aspects of work ensuring integrity and accuracy.
Declaration of Conflicting Interests
The author(s) declared no potential conflicts of interest with respect to the research, authorship, and/or publication of this article.
Funding
The author(s) received no financial support for the research, authorship, and/or publication of this article.