
Abstract
Fatty acids exposure may increase sensitivity of intestinal epithelial cells to cytotoxic effects of zinc oxide (ZnO) nanoparticles (NPs). This study evaluated the synergistic effects of ZnO NPs and palmitic acid (PA) or free fatty acids (FFAs) mixture (oleic/PA 2:1) on toxicity to human colon epithelial (Caco-2) cells. The ZnO NPs exposure concentration dependently induced cytotoxicity to Caco-2 cells showing as reduced proliferation and activity measured by 3 different assays. PA exposure induced cytotoxicity, and coexposure to ZnO NPs and PA showed the largest cytotoxic effects. The presence of FFAs mixture did not affect the ZnO NPs-induced cytotoxicity. Filtration of freshly prepared suspension of NPs through a 0.45-µm pore size membrane significantly reduced the cytotoxicity, indicating a role of concentration or size of particles in cytotoxic effects. The ZnO NPs and PA coexposure induced production of mitochondrial reactive oxygen species (mROS) but not intracellular ROS production, whereas FFAs mixture exposure did not induce mROS and inhibited intracellular ROS. Both ZnO NPs and fatty acids (PA and FFAs mixture) promoted lysosomal destabilization, which was not correlated with cytotoxicity. These results indicated that PA can enhance ZnO NPs-induced cytotoxicity probably by the augmentation of mROS production, whereas FFAs mixture did not affect ROS production. Synergistic effects between ZnO NPs and fatty acids may be important when considering NPs toxicity via oral exposure.
Introduction
With the rapid development of nanotechnology and use of nanoparticles (NPs) in food technology, oral exposure to NPs is increasing. The health impact of NPs following oral exposure may therefore need careful evaluation. Zinc oxide (ZnO) NPs have antibacterial activity and can be used as food ingredients or in food packaging. 1 However, several studies have shown that ZnO NPs are toxic to human colon epithelial Caco-2 cells. 2 -6 To the best of our knowledge, the synergistic effects of ZnO NPs and nutrients on Caco-2 cells have not been previously studied, which may be relevant for any simultaneous uptake of NPs and nutrients. Nevertheless, a recent study indicated that exposure of Caco-2 cells to polystyrene NPs may affect iron transport due to disruption of the cell membrane, which highlighted the possibility that NPs exposure may interact with nutrient uptake. 7
The potential interactions between NPs and fatty acids may need careful evaluation. A number of in vitro studies have demonstrated that saturated fatty acids such as palmitic acid (PA) can induce toxicity to differentiated Caco-2 cells including cell death, decrease in transepithelial resistance, and loss of microvilli, whereas addition of monounsaturated fatty acids such as oleic acid may reduce the effects of PA. 8,9 Additionally, fatty acids may also affect permeability of the intestinal barrier. 10 Given the potential toxicity of NPs to intestinal mucosa, it is possible that the presence of fatty acids may influence NPs-induced toxicity to epithelial cells.
In this study, we evaluated the cytotoxicity of ZnO NPs to Caco-2 cells, with emphasis on the interaction between ZnO NPs and fatty acids. The cytotoxicity of ZnO NPs with or without the presence of fatty acids was evaluated by 3 different assays namely—5-bromo-2′-deoxyuridine (BrdU), 3-(4,5-dimethylthiazol-2-yl)-2,5-diphenyltetrazolium bromide (MTT), and 2-(4-iodophenyl)-3-(4-nitrophenyl)-5-(2,4-disulfophenyl)-2H-tetrazolium (WST-1). Increases in reactive oxygen species (ROS) production and lysosomal destabilization have been implicated in ZnO NPs-induced cytotoxicity, 11 hence mitochondrial ROS (mROS) and intracellular ROS production were assessed by staining cells with MitoSOX red and CellROX deep red, respectively, whereas lysosomes were stained by LysoTracker green and quantified by flow cytometry.
Materials and methods
Cell Culture and Exposure
The human colon epithelial Caco-2 cell line (ATCC, HTB-37), a widely used in vitro model for human intestine,
12
was used in this study. The Caco-2 cells were cultured in minimum essential medium Eagle (MEM; Sigma-Aldrich, St Louis, Missouri) supplemented with 10% (v/v) fetal bovine serum (FCS; BI Biological Industries, Israel), 1% (v/v) MEM nonessential amino acid (Sigma-Aldrich), 1% (v/v)
Particles
Zinc oxide NPs (BASF Z-Cote; uncoated, 100 nm), coded as NM110, were received from the European Commission Joint Research Centre Nanomaterials Repository. NM110 has been well characterized before by using transmission electron microscopy (TEM), x-ray diffractograms (XRDs), Brunauer Emmett Teller BET technology, and dynamic light scattering (DLS). 13 The XRD size is 70 to >100 nm. The TEM size is 20 to 250/50 to 350 nm. The DLS size in medium is 306 nm. The BET surface area is 14 m2/g. For the exposure, 2.56 mg/mL particle in double-distilled water containing 2% FCS was sonicated continuously for 16 minutes using a Branson Sonifier S-450D (Branson Ultrasonics Corp, Danbury, Connecticut) equipped with a disrupter horn (model number: 101-147-037) and then diluted in full medium to expose the cells.
The structure of NM110 in suspension was investigated after sonication in nanopure water with 2% FCS by scanning electron microscopy (SEM). A volume of 20 µL of suspension was applied on aluminum stubs and sputter coated with gold for 45 seconds. A FEI Quanta 3D SEM (Hillsboro, Oregon, USA) was utilized to image the particles under high vacuum conditions. The size of NM110 in different kinds of suspension medium was analyzed by using a NanoSight LM20 (NanoSight, Amesbury, United Kingdom) in triplicate on 3 independent days. Particles of 16 µg/mL were suspended in distilled water, 1% bovine serum albumin (BSA) water, or 1% BSA medium. The Nanoparticle Tracking Analysis (NTA) version 2.0 was used to track and analyze the particles.
Fatty Acids
Stock solutions of 200 mmol/L PA or free fatty acids (FFAs) mixture (oleic/PA 2:1) were prepared in 96% ethanol (EtOH) at 37°C and stored at −20°C. On the day of use, the stock solution was diluted to 5 mmol/L in Hanks solution containing 10% BSA at 37°C for about 60 minutes with occasional vortexing every 5 to 10 minutes and further diluted to 500 µmol/L in cell culture medium for exposure. The molar ratio of fatty acid to BSA is approximately 3.3:1. The final concentrations of BSA and EtOH in exposure medium were 1% and 0.25%, respectively. Equal volume of the Hanks solution/EtOH/10% fatty acid–free BSA was used as the control unless otherwise stated.
5-Bromo-2′-deoxyuridine Proliferation Assay
The proliferation of Caco-2 cells was assessed by the incorporation of BrdU into the DNA of proliferating cells. The assay was carried out using a commercial kit (Roche Diagnostics GmbH, Mannheim, Germany, according to the manufacturer’s instructions). Briefly, 1 × 10⁵/well Caco-2 cells seeded in 96-well plate were cultured for 48 hours before exposure to the ZnO NPs in the presence of 1% BSA (control), 500 µmol/L PA, or FFA with BrdU for 24 hours (2-128 µg/mL equals to 1.3-80 µg/cm2). Here the cells were seeded at lower density as free space is required for proliferation. After exposure, the cells were rinsed once, and the BrdU was quantified according to the instructions.
3-(4,5-Dimethylthiazol-2-yl)-2,5-diphenyltetrazolium bromide Viability Assay
The MTT assay measures the cytotoxicity based on enzymatic reduction of the tetrazolium salt MTT to formazan in metabolically active cells (Roche Diagnostics GmbH, with slight modifications). Briefly, after exposure, the cells were rinsed once and then incubated with 10% MTT (5 µg/mL) in fresh medium for 4 hours. The cells were rinsed in order to reduce the interaction between MTT and particles. After incubation, the purple formazan product was solubilized and measured by an enzyme-linked immunosorbent assay (ELISA) reader (Multiskan Ascent; Labsystems) according to the manufacturer’s instructions.
2-(4-Iodophenyl)-3-(4-nitrophenyl)-5-(2,4-disulfophenyl)-2H-tetrazolium Viability Assay
2-(4-Iodophenyl)-3-(4-nitrophenyl)-5-(2,4-disulfophenyl)-2H-tetrazolium is also a tetrazolium salt, which is enzymatically reduced to a water-soluble formazan in metabolically active cells (Roche Diagnostics GmbH, according to the instructions). Briefly, after exposure, the cells were rinsed once and then incubated with 10% WST-1 agent in fresh full medium for 2 hours. The product was then measured at 450 nm with 630 nm as reference by an ELISA reader.
To further investigate the role of particles/ions in overall toxicity, the cells were exposed to filtered sample or through the cell culture inserts. First, for the filtered experiments, the freshly prepared NM110 suspensions were passed through an Acrodisc 32 mm syringe filter with 0.45 µm Supor membrane (PALL Life Sciences, Michigan) before dilution in full medium. Various concentrations of unfiltered or filtered NM110 were applied to Caco-2 cells grown in 96-well plates in full medium. After 24 hours exposure, the cells were rinsed once, and viability was measured by the WST-1 as described previously. To test the efficiency of filters in the removal of particles especially the large agglomerates, NTA version 3.0 was used to analyze the size distribution of 16 µg/mL filtered or unfiltered NM110 diluted in full medium. In addition, Caco-2 cells were also exposed to ZnCl2 for WST-1 assay (25-1600 µmol/L in full medium, which equals to the same amount of zinc in ZnO NPs from 2 to 128 µg/mL). In a second set of experiments, the Caco-2 cells were exposed to the NPs through cell culture inserts in a 12-well plate format. The cells were incubated with 2 mL fresh full medium, before exposure to 1 mL full medium containing 64 or 128 µg/mL ZnO NPs directly added to the cells (no inserts control) or onto cell culture inserts with 3 or 0.4 µm pore size (transparent PET membrane; BD Biosciences, Erembodegem, Belgium). After 24 hours exposure, the cells were rinsed and then incubated with 1 mL 10% WST-1 medium for 2 hours. The supernatant was transferred to a 96-well plate (100 µL/well, totally 8 wells for each sample) and read by an ELISA reader.
Calcein AM Living Cell Staining
Calcein AM is used to visualize the morphology and living cells after ZnO NPs exposure. Calcein AM can be converted by intracellular esterases in living cells (from nonfluorescence to a green fluorescence). For the experiment, cells were seeded on 0.1% gelatin precoated 8-well microscopy chamber slides (Ibidi, Munich, Germany) and cultured for 2 days. The cells were then exposed to 0, 4, 16, and 32 µg/mL ZnO NP in 1% BSA medium for 24 hours, rinsed, and stained by 0.5 µg/mL calcein AM (Life Technologies, Grand Island, New York) in serum-free medium for 30 minutes. The cells were examined by combined differential interference contrast and fluorescence microscopy in a Leica AF6000 inverted widefield microscope with 40× magnifications (Leica Microsystems GmbH, Wetzlar, Germany).
Reactive Oxygen Species Measurement
ROS including mROS and intracellular ROS were measured using MitoSOX red (Invitrogen, Eugene, OR, USA) and CellROX deep red (Invitrogen, Carlsbad, CA, USA) in flow cytometry according to manufacturer’s instructions, respectively. Briefly, Caco-2 cells in 12-well plate were exposed to 0, 4, and 16 µg/mL ZnO NPs in the presence of 1% BSA (control), 500 µmol/L PA, or FFA for 24 hours. The cells were rinsed and stained by 2.5 µmol/L MitoSOX or CellROX in serum-free medium at 37°C for 30 minutes and rinsed again to remove the excessive free probe. The Caco-2 cells were harvested by trypsin and applied to a flow cytometer (BD Accuri C6, Cambridge, UK) with CFlow plus to analyze the data. In total, 1 × 10⁵ events were analyzed for each sample, with unexposed and unstained sample used as the negative control. The fluorescence from MitoSOX and CellROX was collected from FL2 and FL4 channel, respectively, and percentage increase in median FL2 or FL4 was calculated from 3 independent experiments.
Lysosomal Destabilization
Lysosomal destabilization was measured as decrease in LysoTracker green fluorescence by flow cytometry. After exposure, the Caco-2 cells in 12-well plates were stained with 50 nmol/L LysoTracker (Invitrogen, Carlsbad, CA, USA) in serum-free medium at 37°C for 30 minutes. The green fluorescence was measured from FL1 channel and a percentage decrease in median FL1 was calculated from 3 independent experiments.
Data Analysis
For the cytotoxicity data obtained by BrdU, MTT, and WST-1 assay, half maximal effective concentration (EC50) was calculated using 4 parameter logistic equations by SigmaPlot 12.5 (Systat Software Inc, Germany). To analyze the interactions between particle and fatty acid, 2-way analysis of variance (ANOVA) was used with concentrations of particles and types of fatty acid as categorical factors by R 3.0.2. For the flow cytometry data, 2-way ANOVA was used to analyze interaction between particle and fatty acids, followed by post hoc test to compare the difference in R 3.0.2. A P value <.05 is considered as statistically significant.
Results
The Morphology of ZnO NPs
Figure 1 depicts the morphology of ZnO NPs (NM110) after sonication in SEM images. It is clearly evident that ZnO NPs agglomerate in the dispersion medium following sonication and over time.
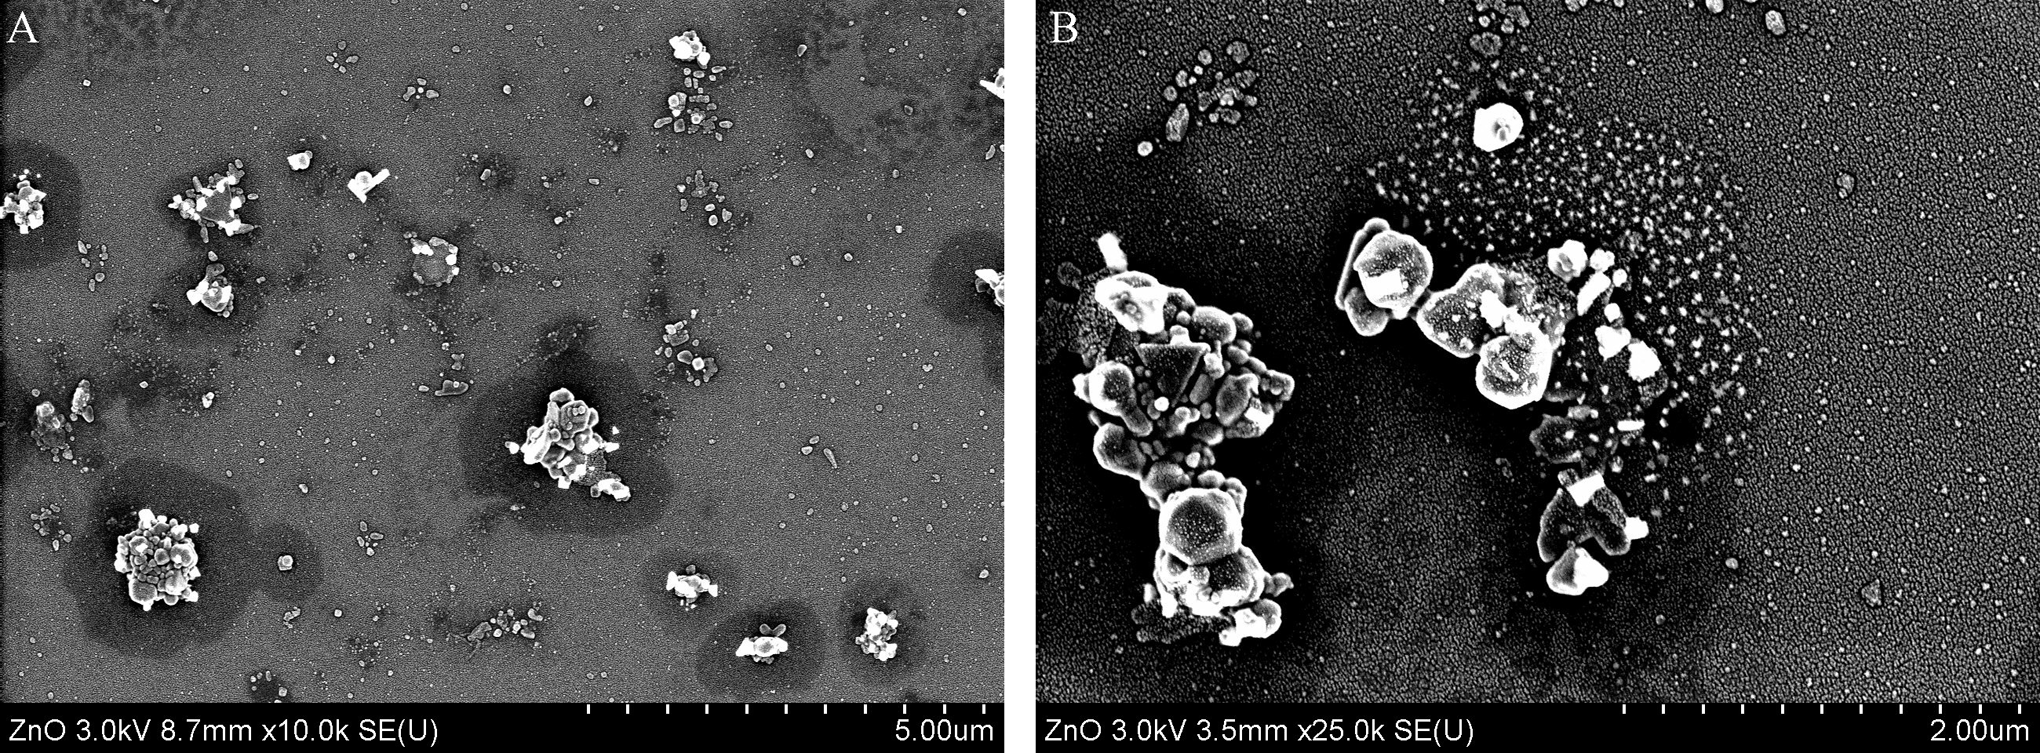
Scanning electron microscopy (SEM) images of ZnO NP (NM110) morphology. A, 10,000× magnification; (B) 25,000× magnification. ZnO NP indicates zinc oxide nanoparticle.
Bovine Serum Albumin Increased Size of ZnO NPs
The size of ZnO NPs in water, 1% BSA water, or 1% BSA medium analyzed by NTA is summarized in Table 1. In water, the mean and mode particle size of ZnO NPs were approximately 150 nm, which indicated that the size of most frequently occurring particles was close to the mean size of particles. In 1% BSA water or 1% BSA medium, the mean size of particles increased significantly, whereas the mode remained unaltered. The increased mean size of particles could be due to protein corona formation on particles 14 or ion corona formed between particles and irons present in cell culture medium, 15 both of which may affect biological response of NPs. The effect of fatty acids on particle size was not further examined in this study.
The NTA Size of ZnO NPs (NM110) in Water, 1% BSA Water, or 1% BSA Medium.a
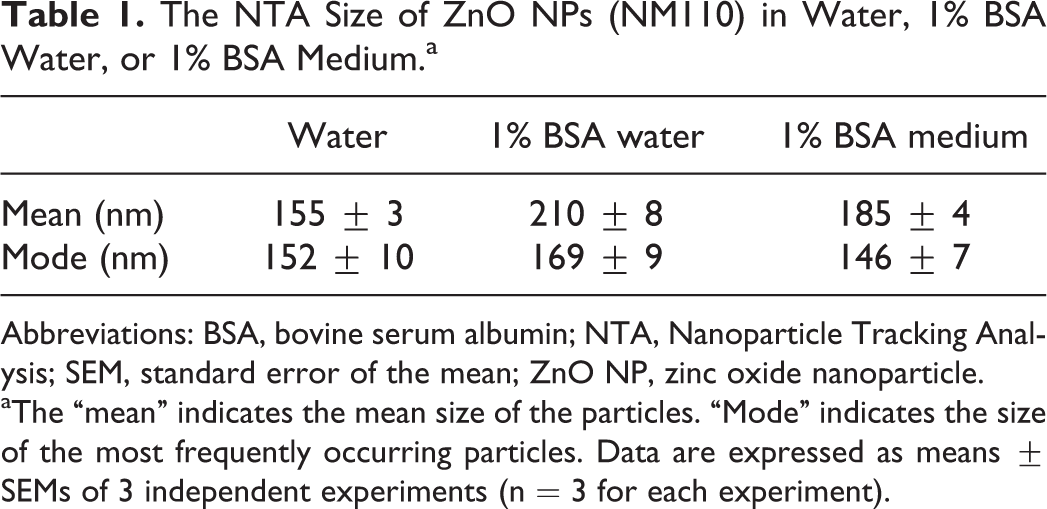
Abbreviations: BSA, bovine serum albumin; NTA, Nanoparticle Tracking Analysis; SEM, standard error of the mean; ZnO NP, zinc oxide nanoparticle.
aThe “mean” indicates the mean size of the particles. “Mode” indicates the size of the most frequently occurring particles. Data are expressed as means ± SEMs of 3 independent experiments (n = 3 for each experiment).
Zinc Oxide NPs Induced Cytotoxicity and Interactions With Fatty Acids
Figure 2 shows the concentration–response curve of ZnO NPs assessed by BrdU (Figure 2A), MTT (Figure 2B), and WST-1 (Figure 2C) assays. The ZnO NPs induced a significant concentration-dependent decrease in BrdU incorporation and MTT and WST-1 formation (P < 0.01) in 1% BSA control condition. The PA treatment reduced proliferation to 91% (95% confidence interval [CI]: 76%-103%) measured by the BrdU assay. In addition, the PA treatment was associated with cytotoxicity as determined by only 75% (95% CI: 60%-90%) and 64% (95% CI: 53%-75%) formazan formation in the MTT and WST-1 assays, respectively. The FFA exposure increased proliferation to 104% (95% CI: 91%-117%) measured by BrdU and formazan formation to 105% (95% CI: 90%-120%) and 88% (95% CI: 77%-99%) in the MTT and WST-1 assays. Coexposure of ZnO NPs and PA to Caco-2 cells showed the largest cytotoxic effects as indicated by the lowest EC50 value, whereas FFA had a higher EC50 value than PA (Table 2). In addition, ANOVA demonstrated a significant interaction between exposure to particles and fatty acids by MTT (P < 0.05) and WST-1 (P < 0.01) but not by BrdU (P > 0.05).
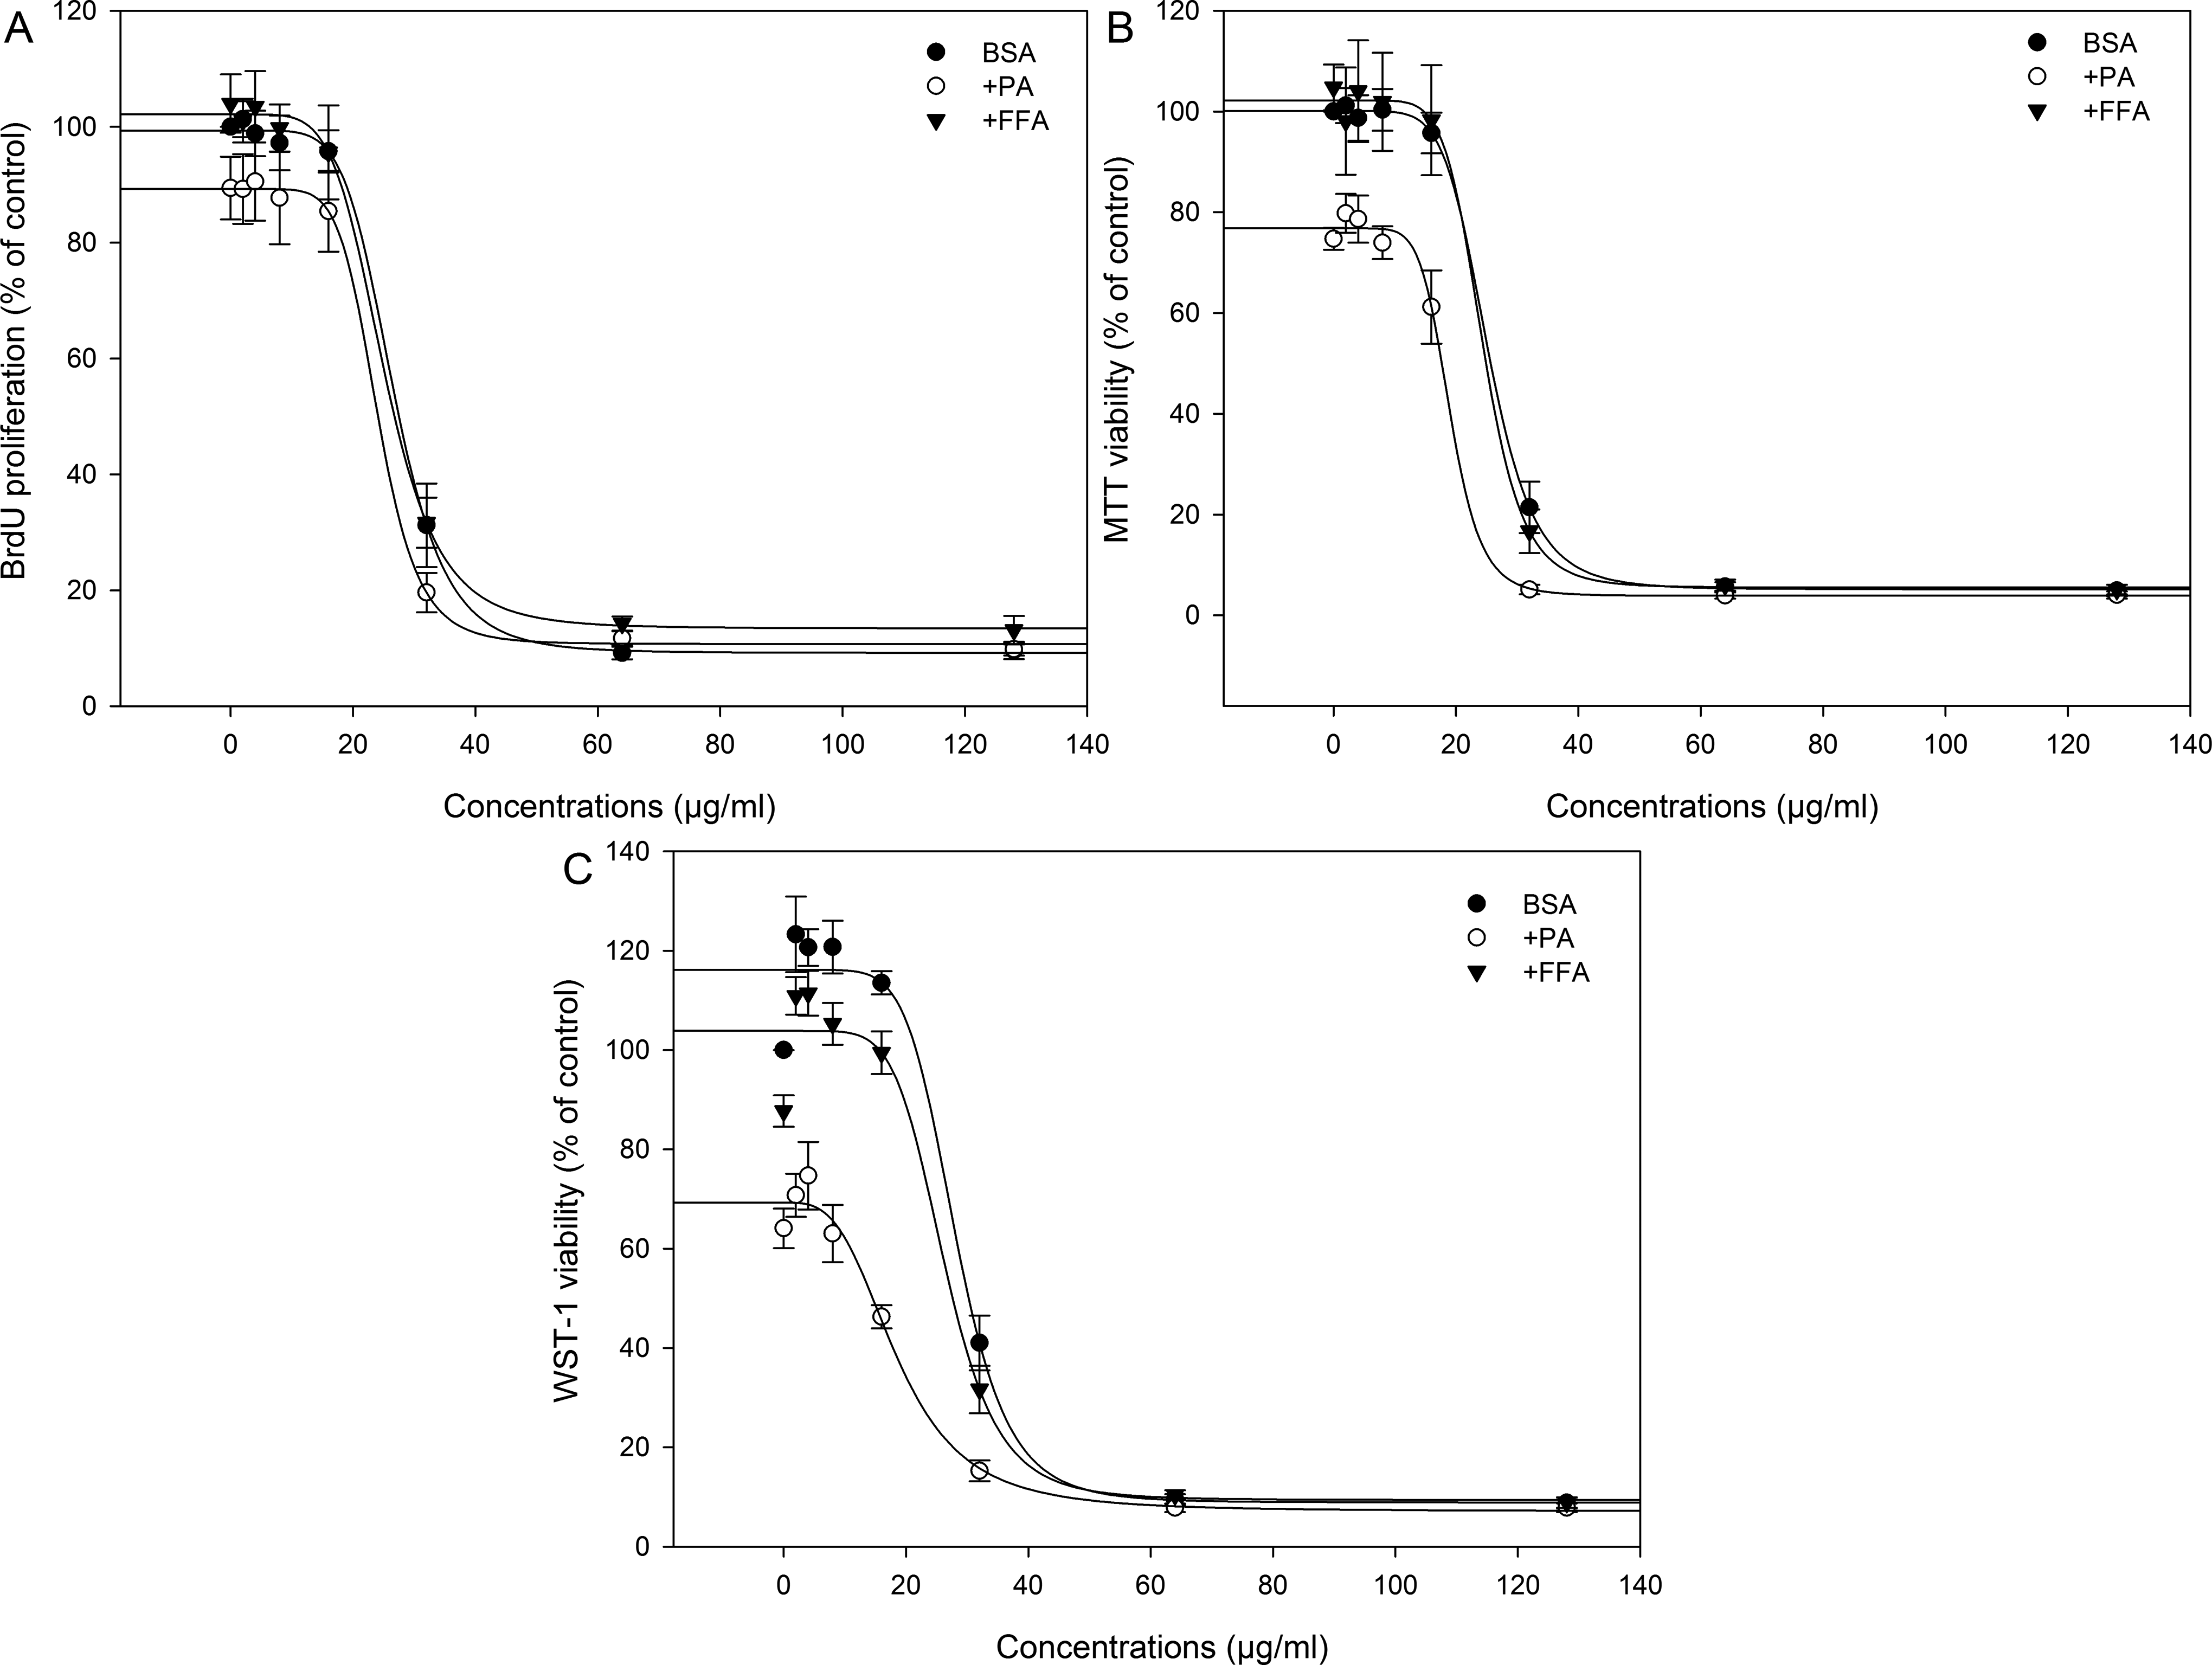
The concentration–response curves of ZnO NPs (NM110) by BrdU (A), MTT (B), and WST-1 (C) assay in the presence of BSA (control), palmitic acid (PA), or free fatty acid (FFA) mixture (oleic/palmitic acid 2:1). The data are represented as mean ± SEM of 4 independent experiments (n = 4 for each). The lines indicate the dose–response curve calculated by the 4 parameter logistic equation. ZnO NP indicate zinc oxide nanoparticles; BrdU, 5-bromo-2′-deoxyuridine; MTT, 3-(4,5-dimethylthiazol-2-yl)-2,5-diphenyltetrazolium bromide; WST-1, 2-(4-iodophenyl)-3-(4-nitrophenyl)-5-(2,4-disulfophenyl)-2H-tetrazolium; BSA, bovine serum albumin; SEM, standard error of the mean.
Zinc Oxide Nanoparticle (NM110) Induced EC50 Values (µg/mL) in Caco-2 Cells 24 Hours Postexposure With Different Treatments as Measured by BrdU, MTT, and WST-1 Assays.a
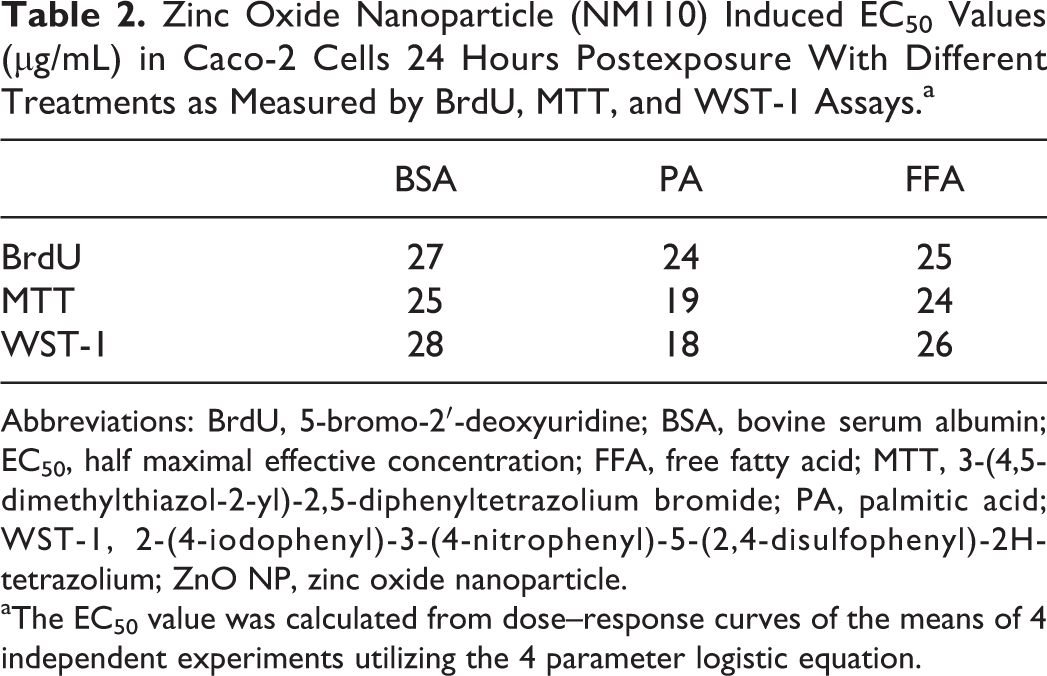
Abbreviations: BrdU, 5-bromo-2′-deoxyuridine; BSA, bovine serum albumin; EC50, half maximal effective concentration; FFA, free fatty acid; MTT, 3-(4,5-dimethylthiazol-2-yl)-2,5-diphenyltetrazolium bromide; PA, palmitic acid; WST-1, 2-(4-iodophenyl)-3-(4-nitrophenyl)-5-(2,4-disulfophenyl)-2H-tetrazolium; ZnO NP, zinc oxide nanoparticle.
aThe EC50 value was calculated from dose–response curves of the means of 4 independent experiments utilizing the 4 parameter logistic equation.
Figure 3 illustrates the morphology and living cell staining after 24 hours exposure to 0, 4, 16, and 32 µg/mL ZnO NPs in 1% BSA medium. Exposure of the cells to the NPs up to 16 µg/mL resulted in no obvious change in the morphology and calcein AM staining. However, at concentration of 32 µg/mL, most of the cells were detached from the slides, with the remainder of cells appeared to be larger than the control cells, probably due to lack of contact with other cells. The green fluorescence of live cells by calcein AM staining confirmed the cytotoxicity of ZnO NPs at concentrations ≥32 µg/mL in 1% BSA medium.
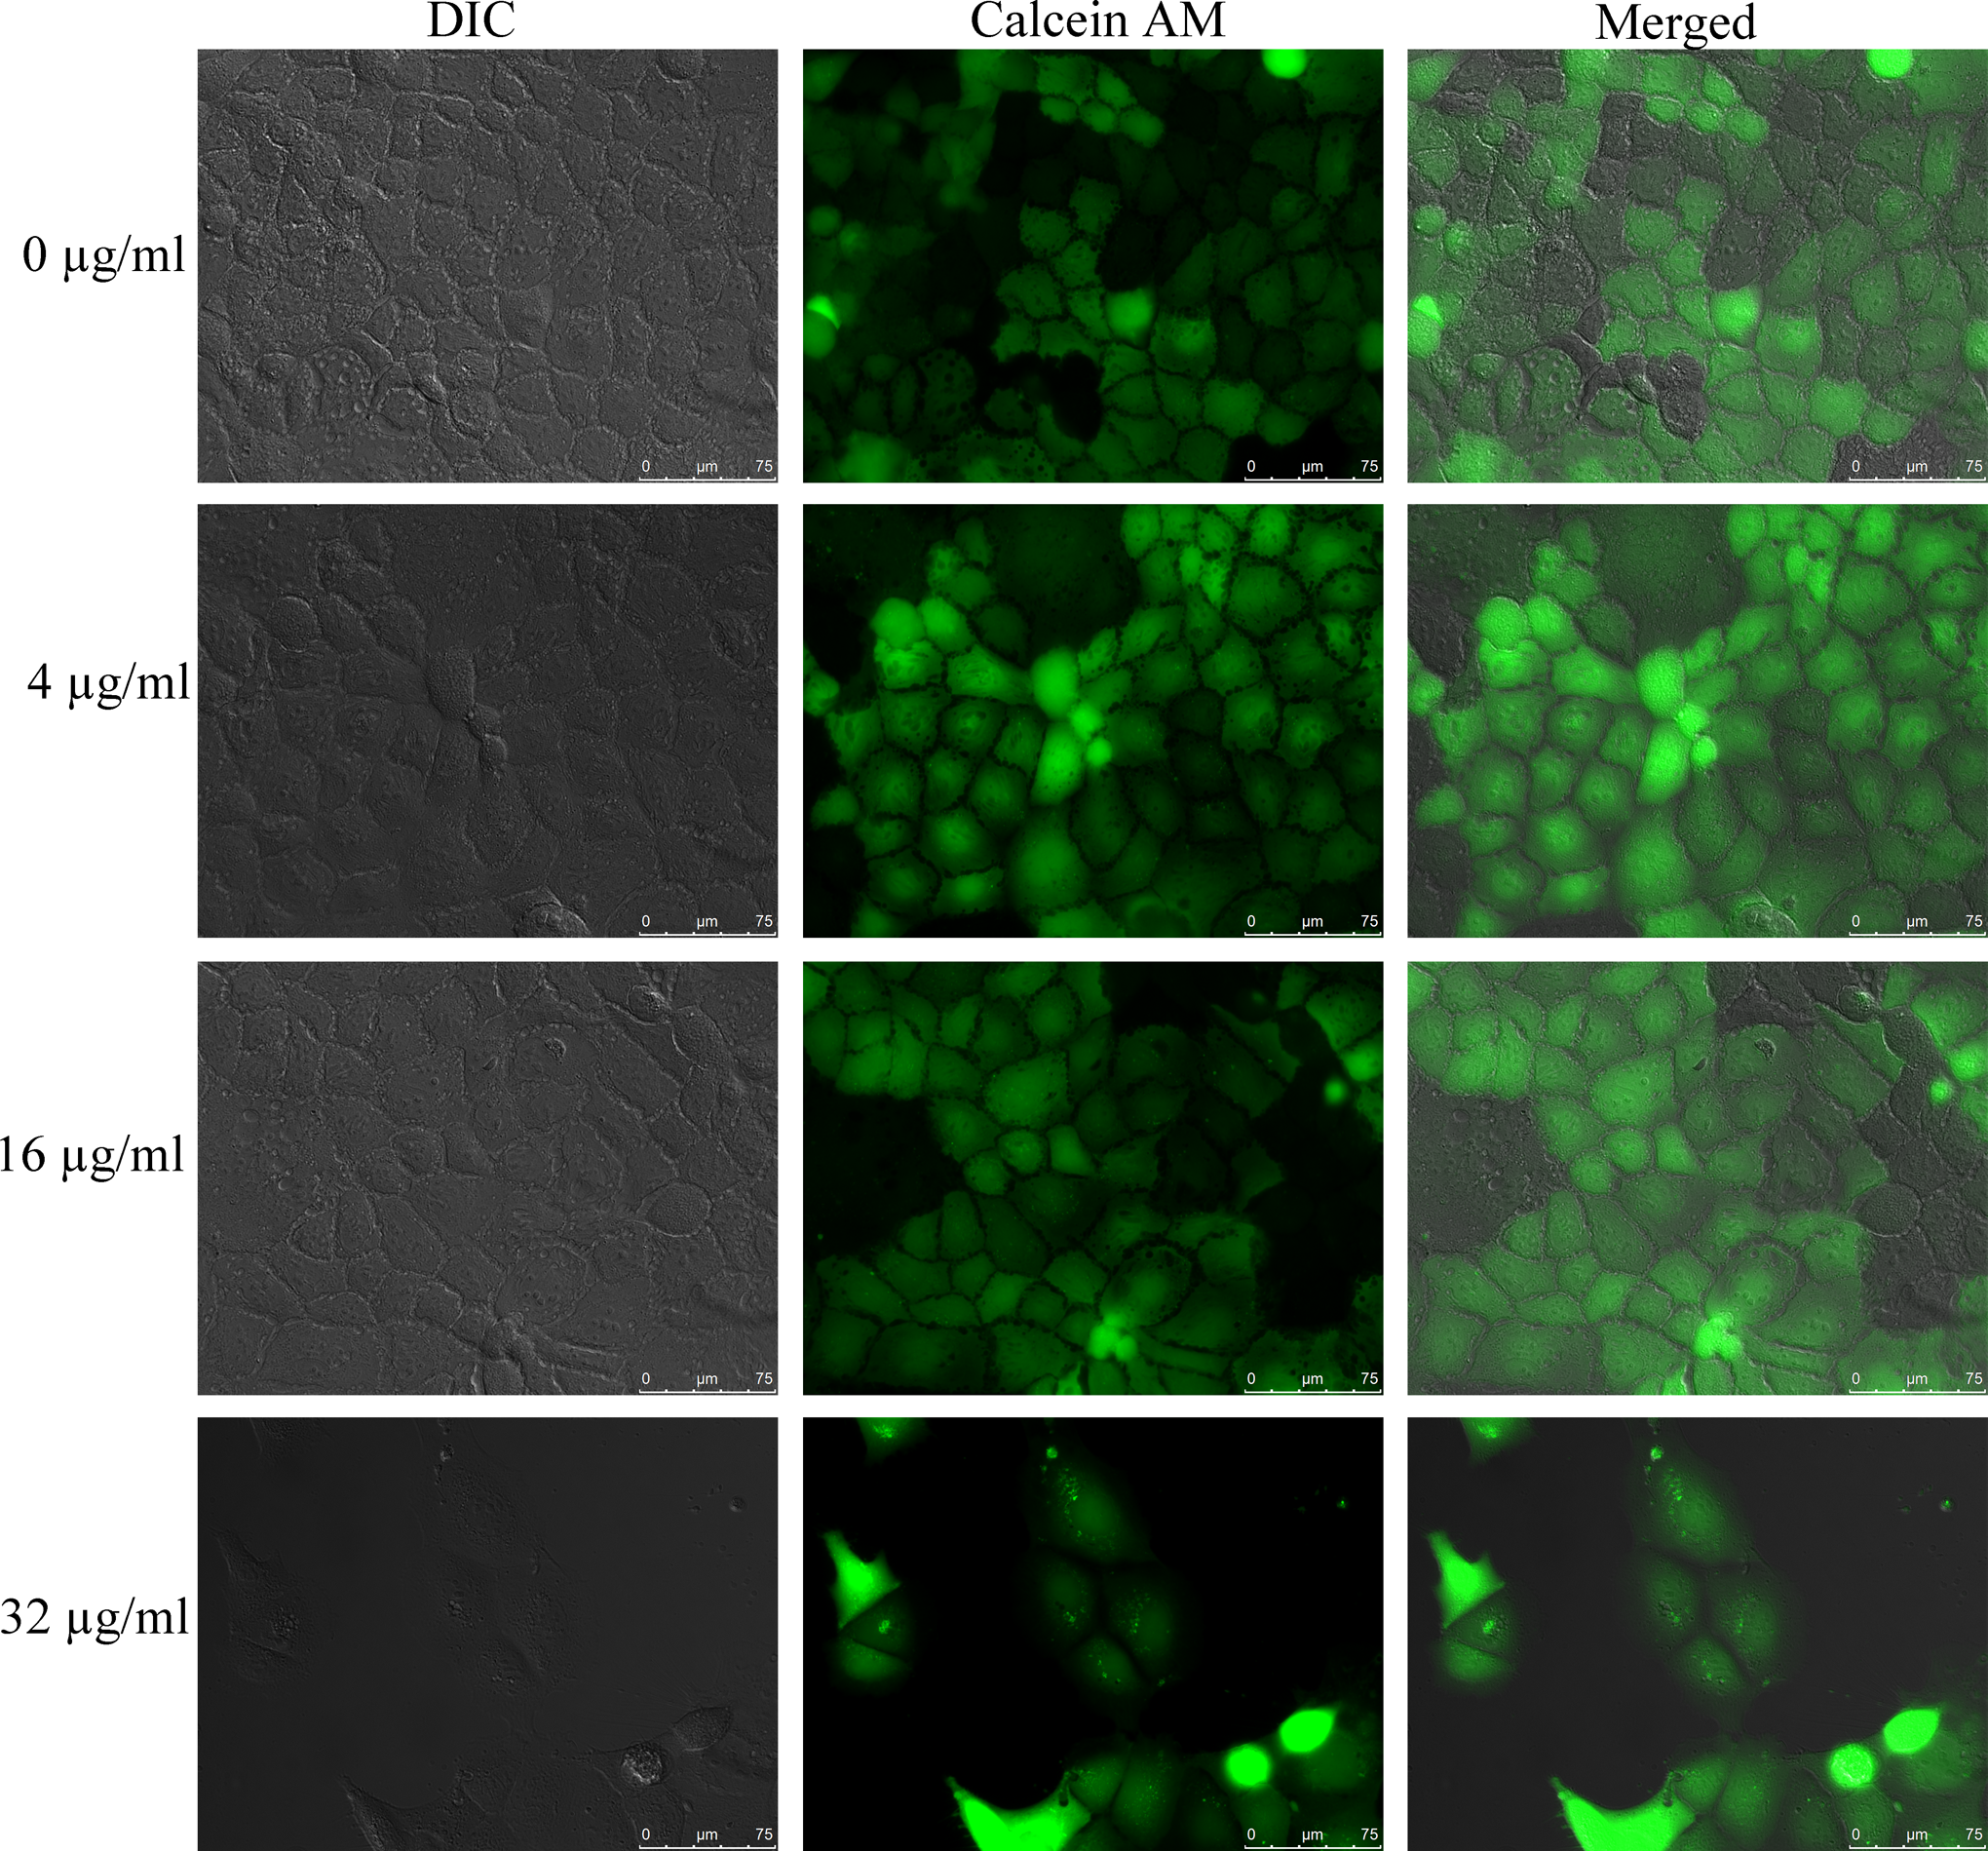
The morphology and living cell staining after 24 hours exposure to ZnO NPs (NM110; 0, 4, 16, and 32 µg/mL). The Caco-2 cells were stained by calcein AM to indicate the living cells (green fluorescence). Images are representative of 2 independent experiments showing differential interference contrast (DIC; the left column), calcein AM fluorescence (the middle column), and the combination of the 2 (the right column). ZnO NPs indicate zinc oxide nanoparticles.
Exposure to Filtered Samples or Through Cell Culture Inserts Reduced Cytotoxicity
Figure 4 shows the cytotoxicity of filtered ZnO NP suspension or exposure through cell culture inserts measured by WST-1 assay. The filtered ZnO NP suspensions induced much lower cytotoxicity than the unfiltered samples (Figure 4A). For the unfiltered samples, significant decrease in WST-1 activity was observed at concentrations ≥16 µg/mL (P < 0.01). In contrast, for the filtered samples, significant decrease in WST-1 activity was observed at concentrations ≥32 µg/mL (P < 0.01). At concentration of 16 µg/mL, the unfiltered sample exposure resulted in significantly higher cytotoxicity (WST-1 assay) compared with the filtered sample (P < 0.01). In addition, the cytotoxicity of ZnO NPs was clearly higher than that shown in Figure 2C. This could be due to the use of 1% BSA, which could coat and stabilize NPs and reduce the toxicity. 11,14
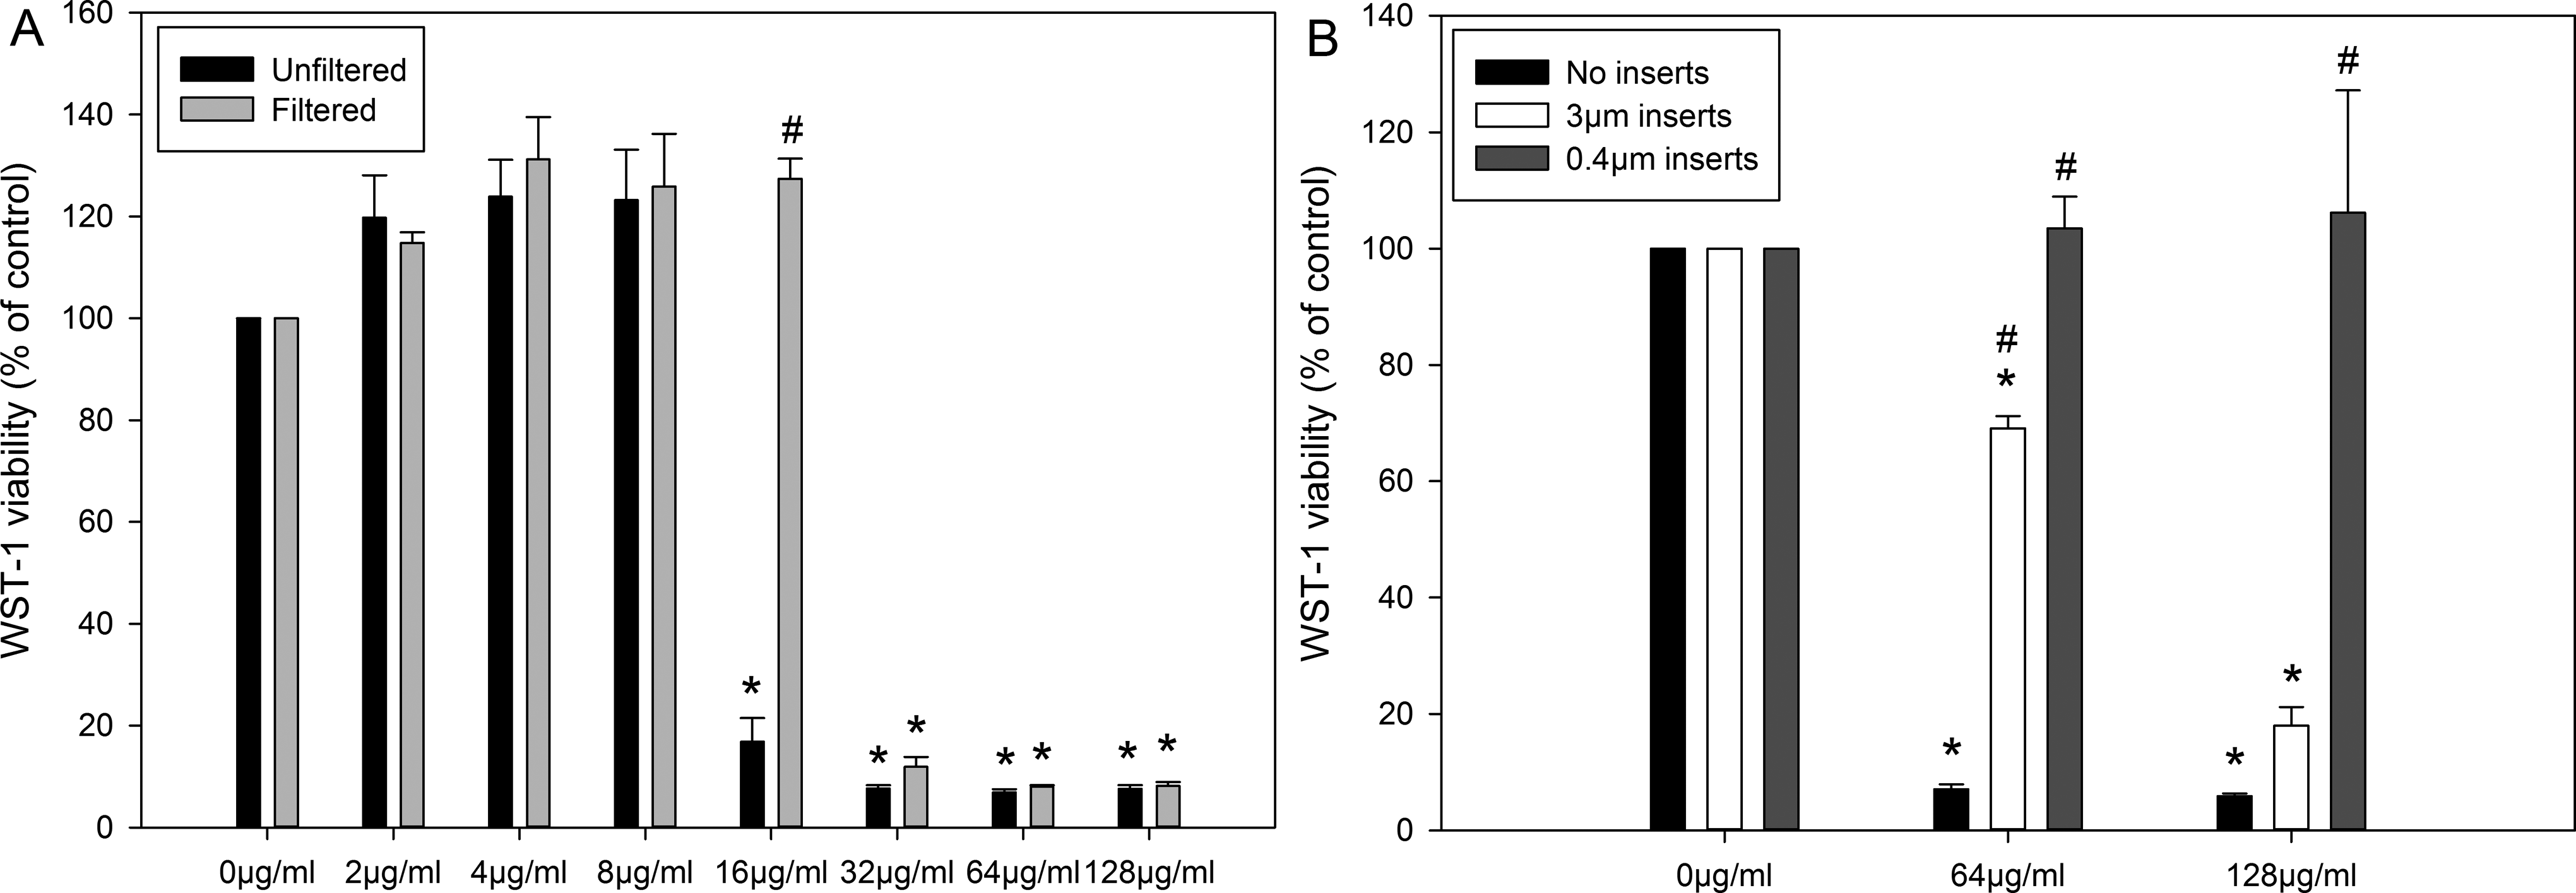
Cytotoxicity of ZnO NPs (NM110) to Caco-2 cells after ZnO NP filtration through a 0.45-µm membrane (A) or exposure through 3- or 0.4-µm cell culture inserts (B) measured by WST-1 assay. The data are presented as mean ± SEM of 3 independent experiments (n = 4 for A and n = 8 for B). *P < 0.05 compared with unexposed control cells. # P < 0.05 compared with unfiltered samples or direct exposure. ZnO NP indicates zinc oxide nanoparticle; WST-1, 2-(4-iodophenyl)-3-(4-nitrophenyl)-5-(2,4-disulfophenyl)-2H-tetrazolium; SEM, standard error of the mean.
Similar to the results obtained from filtered samples, ZnO NPs exposure to the cells through a cell culture insert also reduced the cytotoxicity of ZnO NPs (Figure 4B). The use of 0.4 µm cell culture inserts completely prevented ZnO NPs-induced cytotoxicity at both 64 and 128 µg/mL (P < .01, compared with direct exposure). The 3-µm pore size cell culture inserts were less effective than 0.4 µm insert, and they only partially prevented the cytotoxicity at 64 µg/mL (P < 0.01, compared with direct exposure).
Figure 5 shows the size distribution of filtered or unfiltered ZnO NPs diluted in full medium. Compared with unfiltered samples (Figure 5A), the filtered samples were associated with a lower concentration of particles in general, as well as a total removal of particles above 400 nm (Figure 5B).
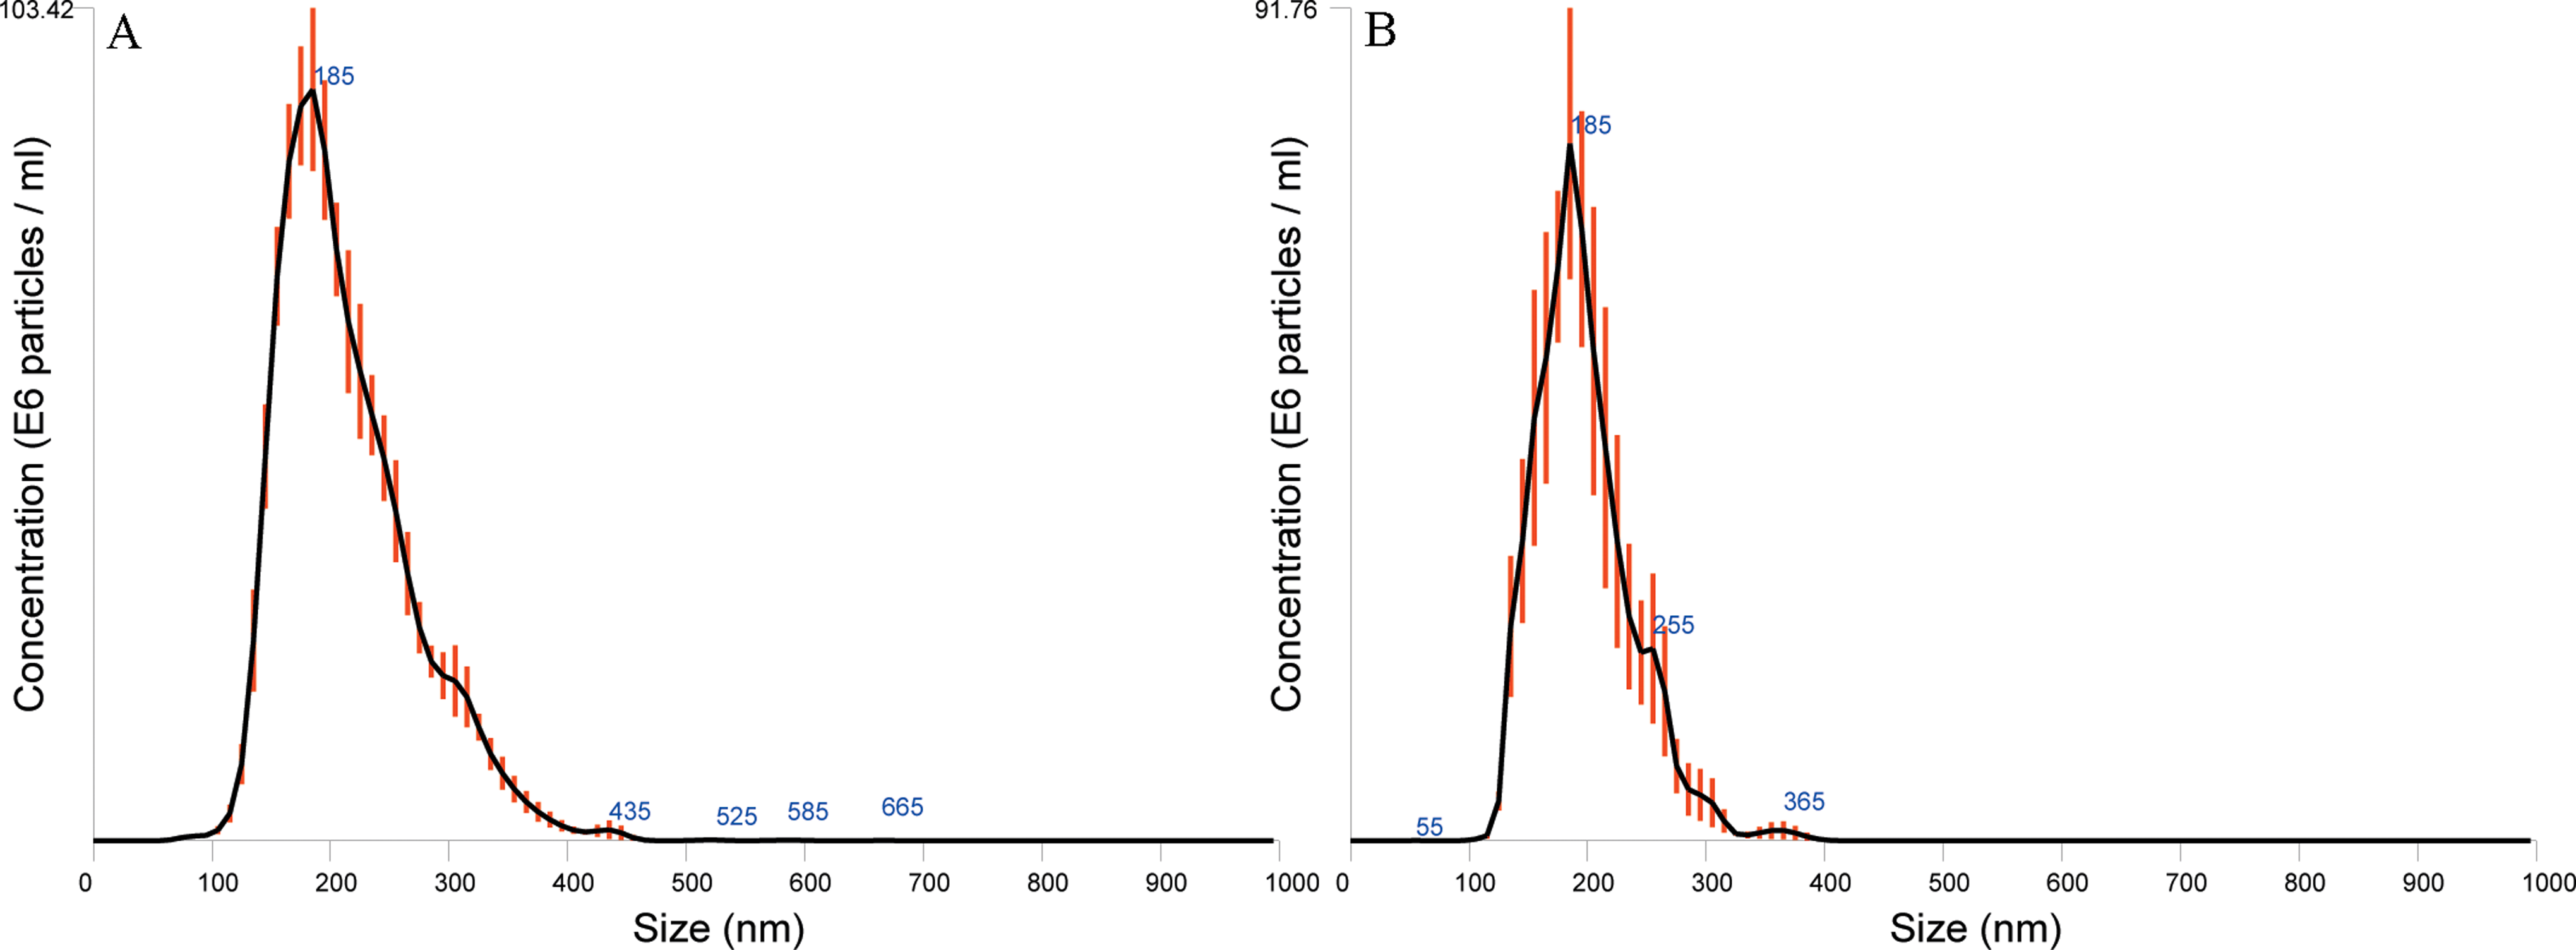
The NTA size distribution of filtered or unfiltered ZnO NPs (NM110) diluted in full medium. A, Unfiltered NM110 in full medium; (B) filtered NM110 in full medium. The lines indicate average size/concentration, and the red error bars indicate ±standard error of the mean. The data are representative of 2 independent experiments. NTA indicates Nanoparticle Tracking Analysis; ZnO NPs, zinc oxide nanoparticles
Figure 6 shows that ZnCl2 induced similar cytotoxic effect as ZnO NPs shown in Figure 4A, with significant increases in cytotoxicity at concentrations ≥200 µmol/L (200 µmol/L ZnCl2 equals to 16 µg/mL ZnO NPs; P < 0.01).
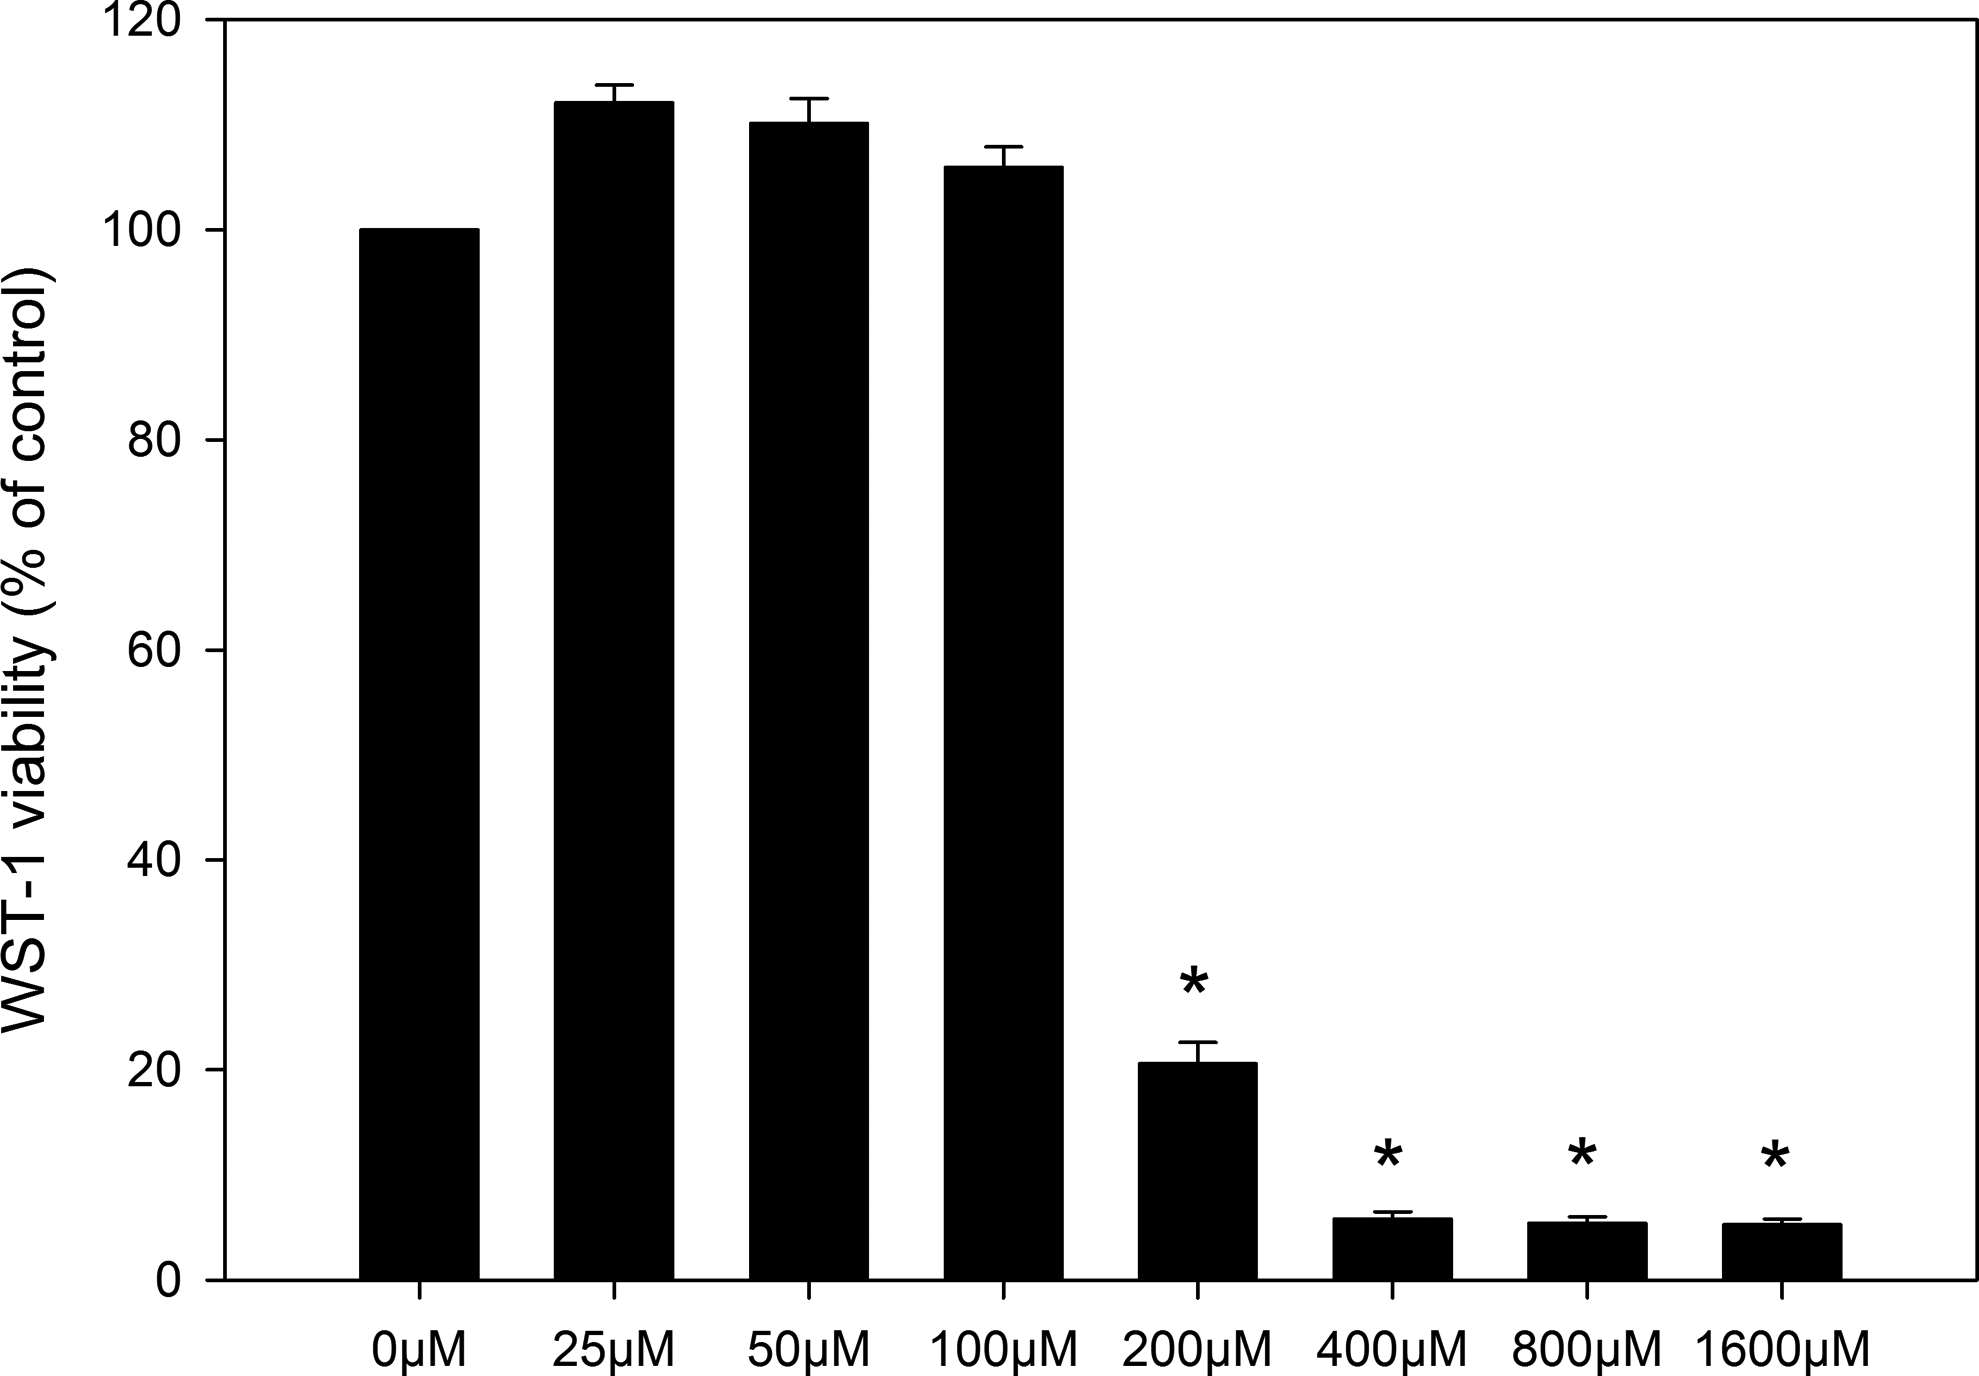
Cytotoxicity of ZnCl2 to Caco-2 cells as measured by WST-1 assay. The data represent mean ± SEM of 3 independent experiments (n = 4 for each). *P < 0.05 compared with unexposed control cells. WST-1 indicates 2-(4-iodophenyl)-3-(4-nitrophenyl)-5-(2,4-disulfophenyl)-2H-tetrazolium; SEM, standard error of the mean.
Zinc Oxide NPs and Fatty Acids Induced mROS But Not Intracellular ROS
Figure 7A depicts mROS production in Caco-2 cells after ZnO NPs and fatty acids exposure. In the 1% BSA control cells, no increase in mROS production was observed after ZnO NP exposure. The PA exposure (500 µmol/L) significantly increased mROS production (P < 0.01), which further enhanced the ZnO NPs-induced mROS production. At 16 µg/mL ZnO NPs exposure, the mROS level was significantly higher than the PA control (P < 0.05). Exposure to FFA or the coexposure of FFA and ZnO NPs did not induce mROS production above controls. Finally, ZnO NPs and PA did not significantly affect intracellular ROS production, whereas FFA significantly lowered intracellular ROS production (P < .01; Figure 7B).
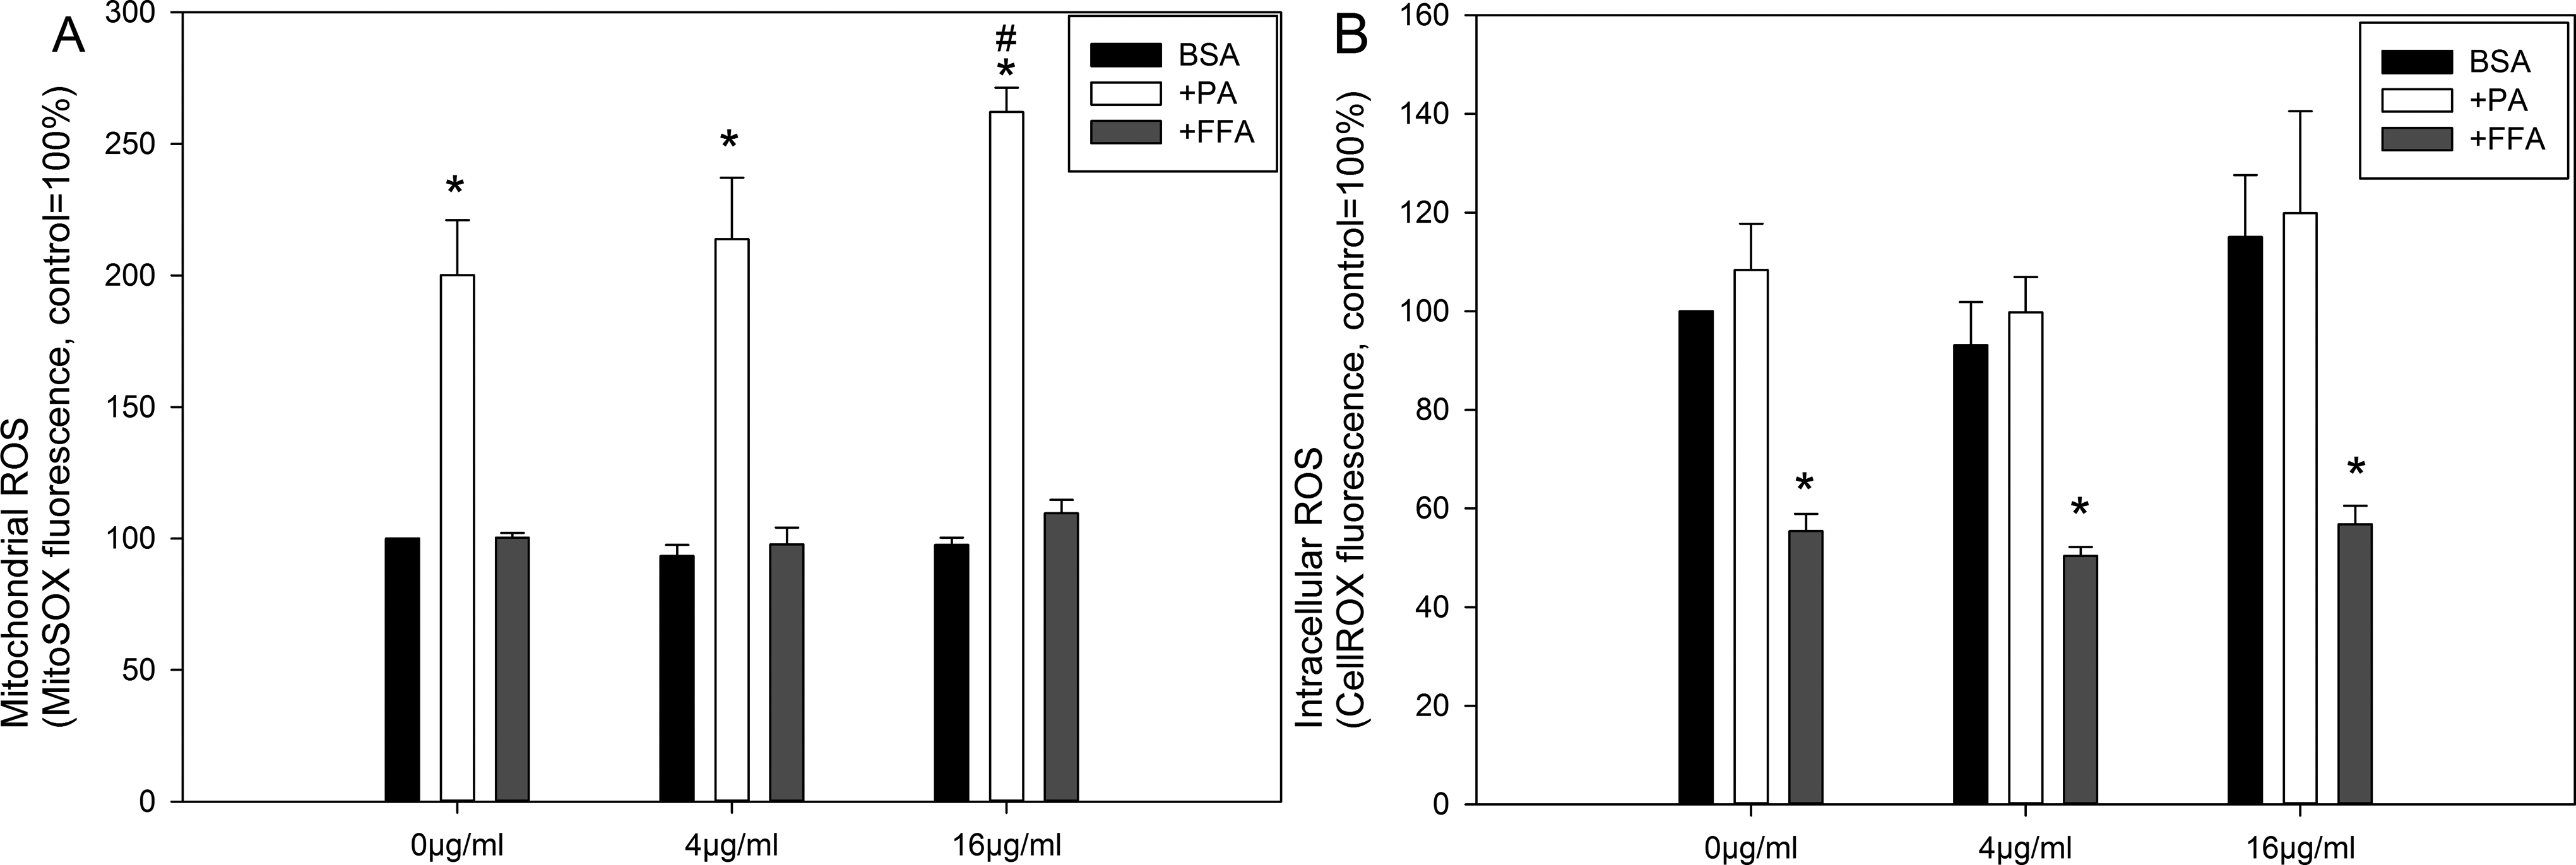
Mitochondrial ROS (A) and intracellular ROS (B) measured by MitoSOX red or CellROX deep red staining after ZnO NP (NM110) exposure in the presence of BSA (control), palmitic acid (PA), or free fatty acid (FFA) mixture (oleic/palmitic acid 2:1). The data are presented as mean ± SEM (n = 3; 1 × 10⁵ events were analyzed for each sample). *P < 0.05 compared with unexposed control cells. # P < 0.05 compared 0 µg/mL group with the presence of PA. ROS indicates reactive oxygen species; ZnO NP, zinc oxide nanoparticle; BSA, bovine serum albumin; SEM, standard error of the mean.
Zinc Oxide NPs and Fatty Acids Induced Lysosomal Destabilization
Figure 8 shows lysosomal destabilization of Caco-2 cells as indicated by the decrease in LysoTracker fluorescence after ZnO NPs and fatty acids exposure, with 4 and 16 µg/mL ZnO NPs significantly reduced fluorescence in the presence of BSA (P < 0.01). Additionally, both PA and FFA significantly reduced LysoTracker fluorescence (P < 0.01), and there was an interaction between the particles and fatty acids (P < 0.05).
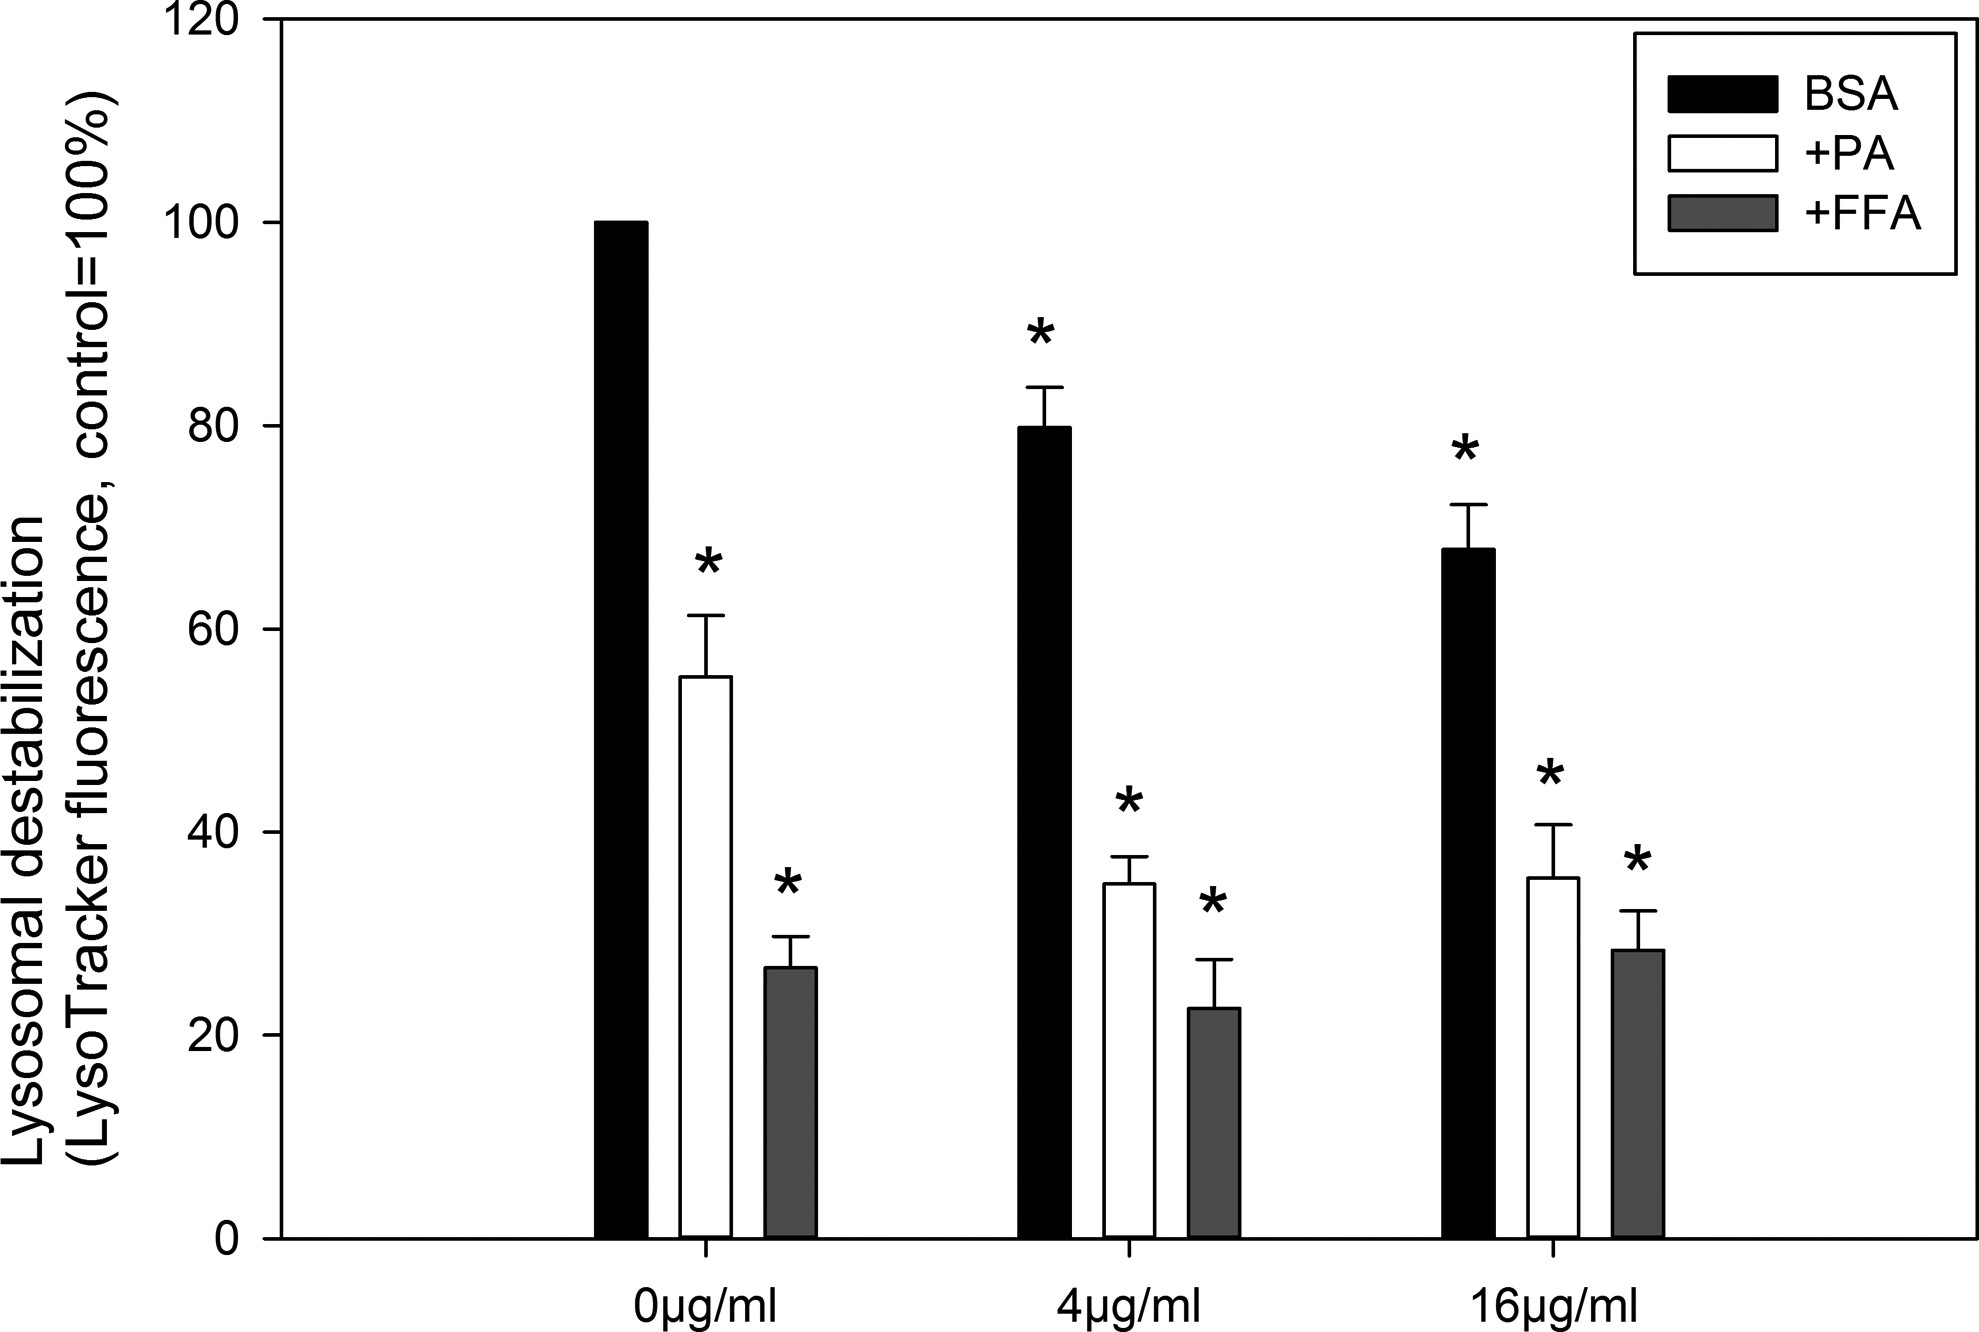
Lysosomal destabilization of Caco-2 cells measured by LysoTracker green staining after ZnO NP (NM110) exposure in the presence of BSA (control), palmitic acid (PA), or free fatty acid (FFA) mixture (oleic/palmitic acid 2:1). The data are presented as mean ± SEM (n = 3; 1 × 10⁵ events were analyzed for each sample). *P < 0.05 compared with unexposed control cells. ZnO NP indicates, zinc oxide nanoparticle; BSA, bovine serum albumin; SEM, standard error of the mean.
Discussion
In this study, we investigated the synergistic effects of ZnO NPs and fatty acids on toxicity to Caco-2 cells. The exposure to ZnO NPs was concentration dependently associated with cytotoxicity, as measured by 3 different methods, which is in concordance with previous reports using both differentiated and undifferentiated Caco-2 cells. 2 -6 PA, but not the FFA mixture, significantly induced cytotoxicity to Caco-2 cells (P < 0.01 for PA and P > 0.05 for FFA, compared with control), which is consistent with previous reports using differentiated Caco-2 cells. 8,9 Here, 500 µmol/L PA only induced a nonsignificant decrease (P > 0.05, compared with control) in the proliferation of Caco-2 as measured by BrdU assay, which is consistent with the observation that 48 hours exposure to 100 µmol/L PA did not affect proliferation of Caco-2 cells. 16 To the best of our knowledge, there is no previous report about synergistic effects of ZnO NPs and fatty acids on cytotoxicity to Caco-2 cells. We found a statistically significant interaction between fatty acids and ZnO NPs as measured by MTT (P < 0.05) and WST-1 (P < 0.01) assays, but not BrdU (P > 0.05) assay. Furthermore, ZnO NPs and PA coexposure exhibited the largest cytotoxic effect. Although the concentrations used in the study may be higher than the exposure level in real life, the data indicated that dietary saturated fatty acids may alter the sensitivity of intestinal mucosa cells to NPs exposure.
The ZnO NPs were shown to be partially soluble in suspensions. It has been shown that 50% to 60% of ZnO NPs can dissolute into soluble Zn2+, which may also induce cytotoxicity. 13 Indeed, ZnCl2 showed similar cytotoxicity to Caco-2 cells as ZnO NPs (Figure 6), which indicated that excessive Zn2+ is toxic to Caco-2 cells. However, it should be pointed out that it requires 100% of extracellular dissolution of ZnO NPs in our study to give the same toxic effects as ZnCl2, which is unlikely in medium with high levels of proteins, where binding of proteins with ZnO NPs will increase the stability. 5,11 To evaluate the role of particles in cytotoxicity, we used filtered samples or exposed cells through cell culture inserts. The analysis of size distribution showed that compared with the unfiltered samples, the filtered samples has a lower concentration of particles in general and did not have particles larger than 400 nm (Figure 5), indicating that large agglomerates of particles were removed from exposure after filtration. For the exposure through cell culture inserts, it is expected that Zn2+ could freely pass the membrane, whereas the larger particles could not pass through the membrane efficiently. 17 The results showed that the filtered sample or samples added onto cell culture inserts caused significantly reduced cytotoxicity (Figure 4), indicating that ZnO NPs may be more important determinants for cytotoxicity. Recent studies showed that Zn2+ released into cell culture medium is not responsible for ZnO NPs-induced cytotoxicity to human neuronal cells, 18 lung epithelial cells, 19 and liver cells, 20 due to the concentrations of Zn2+ in the medium being under the threshold to induce cell death. In addition, Xu et al 19 showed that high-speed centrifugation cannot completely remove ZnO NPs from suspension, which may overestimate the role of Zn2+ when using conditioned medium for exposure. The data generated here are also consistent with the reports in which ZnO NP exposure through cell culture inserts 21 or dialysis 22 was not toxic to human cells. Therefore, it appears that direct contact of cells with ZnO NPs is required for cytotoxicity.
It is generally understood that ROS production plays an important role in ZnO NP-induced toxicity to mammalian cells. 11 In this study, we used MitoSOX red and CellROX deep red to detect mROS and intracellular ROS production, respectively. In the presence of BSA, ZnO NP exposure did not significantly affect mROS production (P > 0.05, compared with control; Figure 7A). In a previous study, it has been demonstrated that ZnO NPs, but not comparable concentration of ZnCl2, significantly induced mROS production in human colon cancer RKO cells, which correlated with ZnO NPs-induced mitochondrial damage and cell death. 21 The lack of effects of ZnO NPs on mROS production in Caco-2 cells in the presence of BSA is probably due to the use of nontoxic concentrations of ZnO NPs. The results of this study also showed that PA significantly enhanced mROS production (P < 0.01, compared with control), whereas FFA had no effect. Furthermore, ZnO NPs and PA coexposure significantly induced mROS production than PA alone (P < 0.05). The PA exposure has been shown to induce mROS production in human monocytes 23 and skeletal muscle cells. 24 Interestingly, Yuzefovych et al 24 also showed that 500 µmol/L PA promoted mROS production in L6 skeletal muscle cells, whereas FFA ameliorated PA-induced mROS production as well as mitochondrial dysfunction and cell death. Intracellular ROS, measured by a cytoplasmic ROS detector CellROX deep red, was not significantly affected by ZnO NP and/or PA exposure (P > 0.05), whereas FFA significantly reduced intracellular ROS production (P < 0.01). A recent report by Shen et al 22 showed that ZnO NPs promoted mROS production in human monocytes, but intracellular ROS production measured by 2′,7′-dichlorofluorescin diacetate remained unaltered. The data from this study combined with previous reports suggest that ZnO NPs and PA can augment ROS production primarily from the mitochondria, which may play a pivotal role in NP-induced cytotoxicity.
The current paradigm for ZnO NPs cytotoxicity is that dissolution of NPs in lysosomes leads to increased concentrations of intralysosomal Zn2+ and lysosomal destabilization, which causes cytotoxicity. 11 A proposed model suggests that the exposure to NPs induces oxidative stress, triggers lysosomal dysfunction, and finally leads to toxicological consequence. 25 LysoTracker green-generated data showed that ZnO NPs concentration dependently caused lysosomal destabilization (Figure 8), which is consistent with a previous report showing ZnO NP-induced lysosomal destabilization in cultured macrophages. 26 However, the concentrations of ZnO NPs used in this study were not cytotoxic to Caco-2 cells as measured by various methods (Figures 2 and 3). It has been suggested that lysosomal destabilization is induced by exposure to PA, bile salts, and cholesterol oxidation products. 27 The PA treatment promoted lysosomal destabilization in mouse liver cells and inhibition of lysosomal destabilization reduced PA-induced apoptosis. 28 Similarly, in this study, we also found that PA induced lysosomal destabilization in Caco-2 cells. However, although FFA was less cytotoxic than PA, it promoted a stronger effect on lysosomal destabilization. These results combined indicate that lysosomal destabilization induced by ZnO NPs and fatty acids is not correlated with cytotoxicity, which is in contrast to previous findings that show a correlation between NP-induced lysosomal destabilization and cytotoxicity in macrophages. 26 The exact role of lysosomal destabilization in NP-induced toxicity to Caco-2 cells may need further investigation.
In conclusion, the results of the present study showed that PA can enhance ZnO NPs-induced cytotoxicity to Caco-2 cells probably by the induction of mROS production, whereas FFA had no effect on the ROS production. Both ZnO NPs and fatty acids could induce lysosomal destabilization in Caco-2 cells, but this effect did not correlate with cytotoxicity. The synergistic effects between ZnO NPs and fatty acids may be important in the consideration of toxicity of ZnO NPs and potentially other NPs via oral exposure.
Footnotes
Author Contributions
Y. Cao contributed to conception and design, acquisition, analysis, and interpretation, drafted the article, critically revised the article, gave final approval, and agreed to be accountable for all aspects of work ensuring integrity and accuracy. M. Roursgaard, S. Loft, and P. Møller contributed to interpretation, critically revised the article, gave final approval, and agreed to be accountable for all aspects of work ensuring integrity and accuracy. A. Kermanizadeh contributed to analysis and interpretation, critically revised the article, gave final approval, and agreed to be accountable for all aspects of work ensuring integrity and accuracy.
Declaration of Conflicting Interests
The author(s) declared no potential conflicts of interest with respect to the research, authorship, and/or publication of this article.
Funding
The author(s) disclosed receipt of the following financial support for the research, authorship, and/or publication of this article: This work was supported by the Danish Research Council for Health and Disease (grant no. 12-126262).