
Abstract
This study demonstrates that aspartame consumption and insulin treatment in a juvenile diabetic rat model leads to increase in cytochrome P450 (CYP) 2E1 and CYP3A2 isozymes in brain. Diabetes mellitus was induced in postweaned 21-day-old Wistar male rat by streptozotocin. Animals were randomly assigned to one of the following groups: untreated control, diabetic (D), D-insulin, D-aspartame, or the D-insulin + aspartame-treated group. Brain and liver tissue samples were used to analyze the activity of CYP2E1 and CYP3A2 and protein levels. Our results indicate that combined treatment with insulin and aspartame in juvenile diabetic rats significantly induced CYP2E1 in the cerebrum and cerebellum without modifying it in the liver, while CYP3A2 protein activity increased both in the brain and in the liver. The induction of CYP2E1 in the brain could have important in situ toxicological effects, given that this CYP isoform is capable of bioactivating various toxic substances. Additionally, CYP3A2 induction in the liver and brain could be considered a decisive factor in the variation of drug response and toxicity.
Introduction
Type 1 diabetes mellitus (DM) is a metabolic disease characterized by chronic hyperglycemia due to the total destruction of the β cells of the pancreas, resulting in absolute insulin deficiency and vital dependency on exogenous insulin. 1 The incidence of DM has consistently increased worldwide during the recent decades, with the most rapid increase among children younger than 5 years of age. 2,3 Moreover, recent evidence suggests that the developing brain is more susceptible to damage from diabetic insults. 4,5 In addition to insulin, patients with type 1 DM must undergo therapy based on the administration of numerous medications and follow a low-calorie diet, ideally combined with exercise and behavior modification. 6 Artificial sweeteners, such as aspartame, are therefore often included in the diet of diabetic patients because these compounds sweeten foods without adding calories or raising blood glucose levels. 7
It has been previously reported that the metabolism of various drugs is altered in patients with type 1 DM and in rats with experimental diabetes induced with chemical agents such as streptozotocin (STZ). 8 Cytochrome P450 (CYP) enzymes play a key role in the metabolism of drugs and xenobiotics, and several studies have shown that these changes are related to the variability of CYP enzyme activity. 9 The CYP enzyme system is the main catalyst of drug biotransformation reactions (oxidation and reduction) and is active in a group of chemically heterogeneous substrates. The CYP1, CYP2, and CYP3 are the main families involved in the metabolism of drugs and xenobiotics. 10 This system is expressed in different tissues and organs, such as the kidneys, lungs, skin, intestines, adrenal cortex, and brain but particularly active in the liver and intestines. 11,12 It has been shown that these enzymes are differentially expressed in the liver and intestines of diabetic patients due to their metabolic and hormonal changes; however, the exogenous administration of insulin partially or totally reverses these changes. 13 Previous studies have indicated that aspartame consumption in healthy (nondiabetic) rats has no effect on the expression or activity of CYP enzymes in liver microsomes, although CYP2E1 and CYP3A2 isoenzymes were significantly induced in the cerebrum and cerebellum. 14,15 The overexpression of brain CYP enzymes could constitute a local regulatory mechanism of enzyme activity. In tissues in developing and low regeneration capacity, such as the brain, CYPs induction may play toxicological role in the metabolism of psychoactive drugs, neurotoxins, neurotransmitters, and neurosteroids. 16 However, it is not yet known how CYP enzymes are modulated in the central nervous system (CNS) of diabetic rats treated simultaneously with insulin and aspartame. Therefore, the aim was to study the effects of aspartame administration and insulin treatment on the expression and activity of CYP2E1 and CYP3A2 on the brain of juvenile diabetic rats.
Materials and Methods
Chemicals
Streptozotocin, aspartame, 4-nitrophenol, and 4-nitrocatechol were purchased from Sigma Chemical Co (St. Louis, Missouri). InsulexN (NPH insulin) was provided by Pisa Pharmaceutical (Guadalajara, Mexico). All reagents used for electrophoresis were purchased from Bio-Rad Laboratories (Hercules, California, USA).
Antibodies
Polyclonal anti-CYP2E1 and anti-CYP3A2 antibodies (goat antirat) were purchased from Daiichi Pure Chemicals Co (Tokyo, Japan), and the rabbit antigoat immunoglobulin G coupled to peroxidase was purchased from Sigma Chemical Co.
Animals
Sixty male 21-day-old Wistar rats, housed in polycarbonate boxes with free access to food and water, with light–dark cycles of 12–12 hours were used. The animals were handled following the National Research Council Guidelines, United States (2011) for laboratory animals.
Experimental Groups and Treatment Regimens
Animals were separated into 5 groups of 12 each and treated as follows: Control group (C): administered 0.2 mL/kg of 0.1 mol/L sodium citrate at pH 4.5 (STZ vehicle) intraperitoneally (ip). Diabetic group (D): the induction of diabetes was achieved using a single dose (ip) of a solution of STZ (60 mg/kg) dissolved in a 0.1 mol/L sodium citrate buffer at pH 4.5. The animals included in the study were those having hyperglycemia ≥300 mg/dL continuously for a week after having been treated with STZ. Blood glucose from the caudal vein was measured daily at 4:00 Diabetic insulin group (D-insulin): rats treated daily with NPH insulin (12 UI/kg) subcutaneously (sc) for 11 weeks starting the first week after developing DM. This dose of aspartame was selected because it is the recognized acceptable daily intake, which is currently set authorized by Food and Drug Administration in the United States. Diabetic aspartame group (D-Aspartame): rats that were given aspartame (50 mg/kg) intragastrically (i.g.) and daily for six weeks starting on the sixth week after developing DM. Diabetic group treated with insulin and aspartame (D-Insulin + Aspartame): rats that were given NPH insulin (12UI/kg) daily for 11 weeks from the first week of having developed DM. Starting on the fifth week of insulin administration, all the rats in this group were also given aspartame (50 mg/kg/day i.g.) for six weeks.
At the end of the experimental phase for each group (91 days), the animals were killed by cervical dislocation, and the brain, cerebellum, and liver were immediately extracted.
Microsomes Preparation
Microsomal fractions from the brain, cerebellum, and liver were obtained according to the procedure described by Maron and Ames. 17 For each experimental group, 3 different batches (from 4 rats each one) of microsomes were prepared from cerebrum, cerebellum, and liver. Tissues were excised and homogenized in 150 mmol/L KCl (3 mL/g of wet tissue). Each homogenate was then centrifuged at 9000g for 10 minutes at 4°C. The supernatant was subsequently centrifuged at 105 000g for 60 minutes at 4°C. The precipitated pellet was resuspended in phosphate buffer (pH 7.4) containing EDTA (1 mmol/L), dithiothereitol (0.1 mmol/L), glycerol (20%), and pepstatin (1.0 mmol/L). The samples were stored at −70°C until used.
Protein Determination
The protein levels of the microsomal fractions of the brain, cerebellum, and liver were determined using the Lowry method. 18
Western Blot
Microsomal proteins from the liver (5 µg), brain, and cerebellum (40 µg) were separated by electrophoresis on sodium dodecyl sulfate-polyacrylamide gels at 7.5%. Subsequently, the proteins were transferred to nitrocellulose membranes (BioRad, Berkeley Ca, USA.), which were blocked with 5% skimmed milk in phosphate buffered saline. The membranes were incubated with polyclonal primary antibodies (1:1500), anti-CYP2E1, or anti-CYP3A2, and, subsequently, with a secondary antibody coupled to peroxidase. The antigen–antibody complexes were seen using 3′,3-diaminobenzidine and hydrogen peroxide. The band intensity was assessed by densitometric analysis in a HEROLAB gel documentation system (Ludwig-Wagner GmbH. Darmstand, Germany).
Catalytic Activities
Catalytic activities of CYP2E1 and CYP3A2 were measured spectrophotometrically using specific substrates; the CYP2E1 activity was assessed following the procedure reported by Koop, 19 where the formation of 4-nitrocatechol was measured by 4-nitrophenol hydroxylation, and the changes in absorbance were measured at 510 nm. Meanwhile, the CYP3A2 activity was determined by measuring the formation of formaldehyde at 412 nm using erythromycin N-demethylation according to the technique described by Alexidis et al. 20 Specific CYP2E1 and CYP3A2 activities were calculated from a 4-nitrocatechol (5-50 nmol/mL) and formaldehyde (2.5-80 nmol/mL) standard curve, respectively.
Statistical Analysis
Catalytic activities data are reported as means ± standard error of the mean. The data were not normally distributed so they were analyzed using Kruskal-Wallis, and post hoc Mann-Whitney U tests comprising C versus D groups, and D versus D-insulin, D-aspartame or D-insulin + aspartame groups. Differences with a P value <0.05 were regarded as significant.
Results
Determination of Blood Glucose
Animal blood glucose levels were measured weekly and are shown in Figure 1. All animals had normal glucose levels (84.6-102.2 mg/dL) at baseline. The animals in groups with STZ-induced DM (D, D-insulin, D-aspartame, and D-insulin + aspartame) had glycemia levels above 300 mg/dL a week later. However, diabetic animals treated later on with insulin (D-insulin and D-insulin + aspartame) had glucose levels equivalent to those at baseline (107.4-142.5 mg/dL). In contrast, the administration of aspartame (D-aspartame and D-insulin + aspartame groups) did not change blood glucose levels relative to the levels observed in D and D-insulin groups.
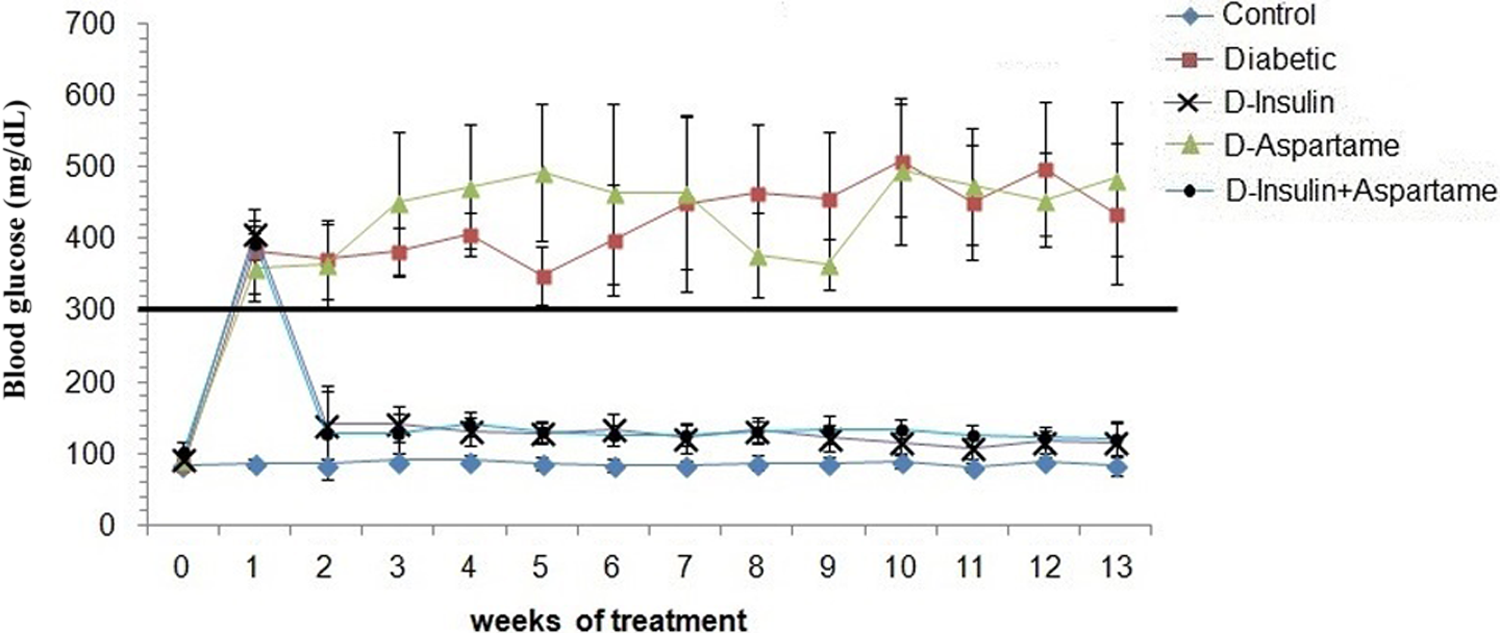
Blood glucose levels. Weekly blood glucose quantification determined in the different experimental groups. Groups: control (C), diabetic group (D), D-aspartame group, D-insulin group, and D-insulin + aspartame group (n = 12). The data represent the mean ± standard deviation of the blood glucose levels. The horizontal line indicates the glucose level threshold, above which animals can be considered diabetic.
Protein Levels of CYP2E1 and CYP3A2
Immunoblots in Figure 2 show CYP2E1 and CYP3A2 protein expression analyses of the various experimental groups. The CYP2E1 and CYP3A2 proteins were expressed in the liver microsomes of all experimental groups, whereas CYP2E1 was the only isoenzyme detected in the brain and cerebellum immunoblots.
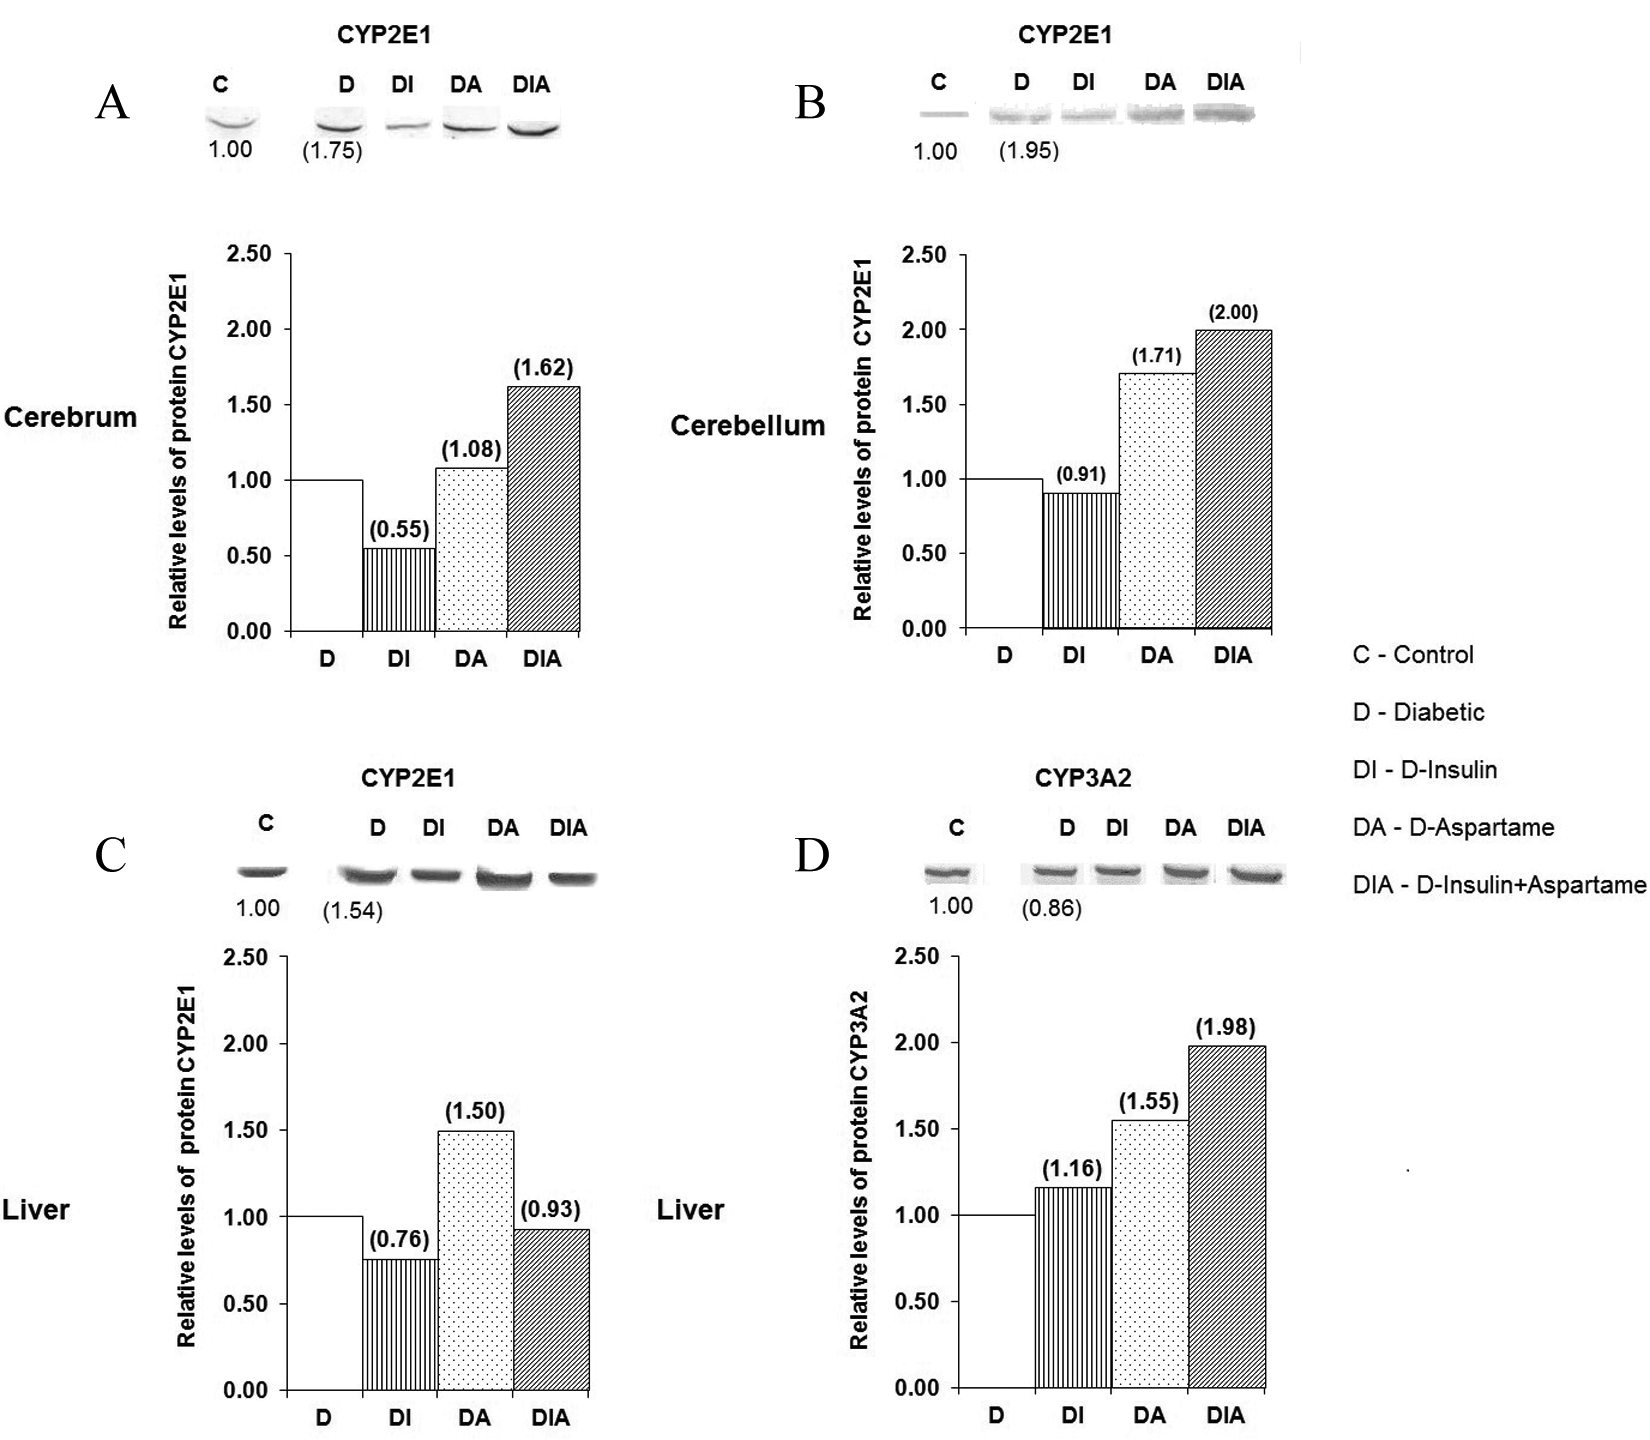
Effect of treatment with insulin and/or aspartame in the modulation of CYP2E1 and CYP3A2 proteins in the cerebrum, cerebellum, and liver of diabetic rats. The upper panel of each section presents the characteristic immunoblots for detecting each CYP isoform in the (A) cerebrum (40 μg), (B) cerebellum (40 μg), (C), and (D) liver (5 μg). Each band represents the aggregate of the respective tissue from 4 rats. The assay was performed in duplicate with similar results. The bottom panel of each section shows the corresponding densitometric analysis for each immunoblot, represented as the relative levels of protein expression. The values in parentheses indicate the differences in expression of each experimental group compared with the corresponding control group: C versus D, D versus D-insulin, D-aspartame, or D-insulin + aspartame. CYP indicates cytochrome P450.
Induction of DM by STZ (group D) caused an increase in the CYP2E1 protein in the liver (54%), brain (75%), and cerebellum (95%) compared to the control group (Figure 2: A, B, and C), while the expression of CYP3A2 in liver microsomes showed a slight decrease (Figure 2D).
In analyzing the relative expression of CYP2E1 in the D-insulin group, insulin caused a decrease in the CYP2E1 expression levels in the brain, cerebellum, and liver when compared to group D. In contrast, insulin caused an increase of 16% in the expression of the CYP3A2 protein in liver microsomes in the D-insulin group.
Treatment with aspartame (D-aspartame group) caused a marked induction of CYP2E1 (50%) and CYP3A2 (55%) in the liver microsomes, whereas CYP2E1 increased its expression in the cerebellum to over 70% compared to the D group.
Finally, combined treatment with insulin and aspartame in rats with type 1 DM (D-insulin + aspartame group) resulted in a considerable increase in CYP2E1 in the brain (62%) and cerebellum (100%) and of CYP3A2 (98%) in the liver.
Catalytic Activities of CYP2E1 and CYP3A2
Results of CYP2E1- and CYP3A2-dependent enzyme activity are shown in Table 1. Catalytic activity of CYP2E1 increased significantly in the brain, cerebellum, and liver of rats with DM (D group), when compared with the control group (nondiabetic), whereas the CYP3A2 activity decreased in all 3 tissues, being significantly different in the brain and liver.
Effect of Treatment With Insulin/or Aspartame in the Modulation of Catalytic Activity, Dependent on 4-Nitrophenol (4-NPH) and Erythromycin N-demethylase (END) in the Microsomes of the Cerebrum, Cerebellum, and Liver Diabetic Rats (D) in Different Experimental Groups.a,b
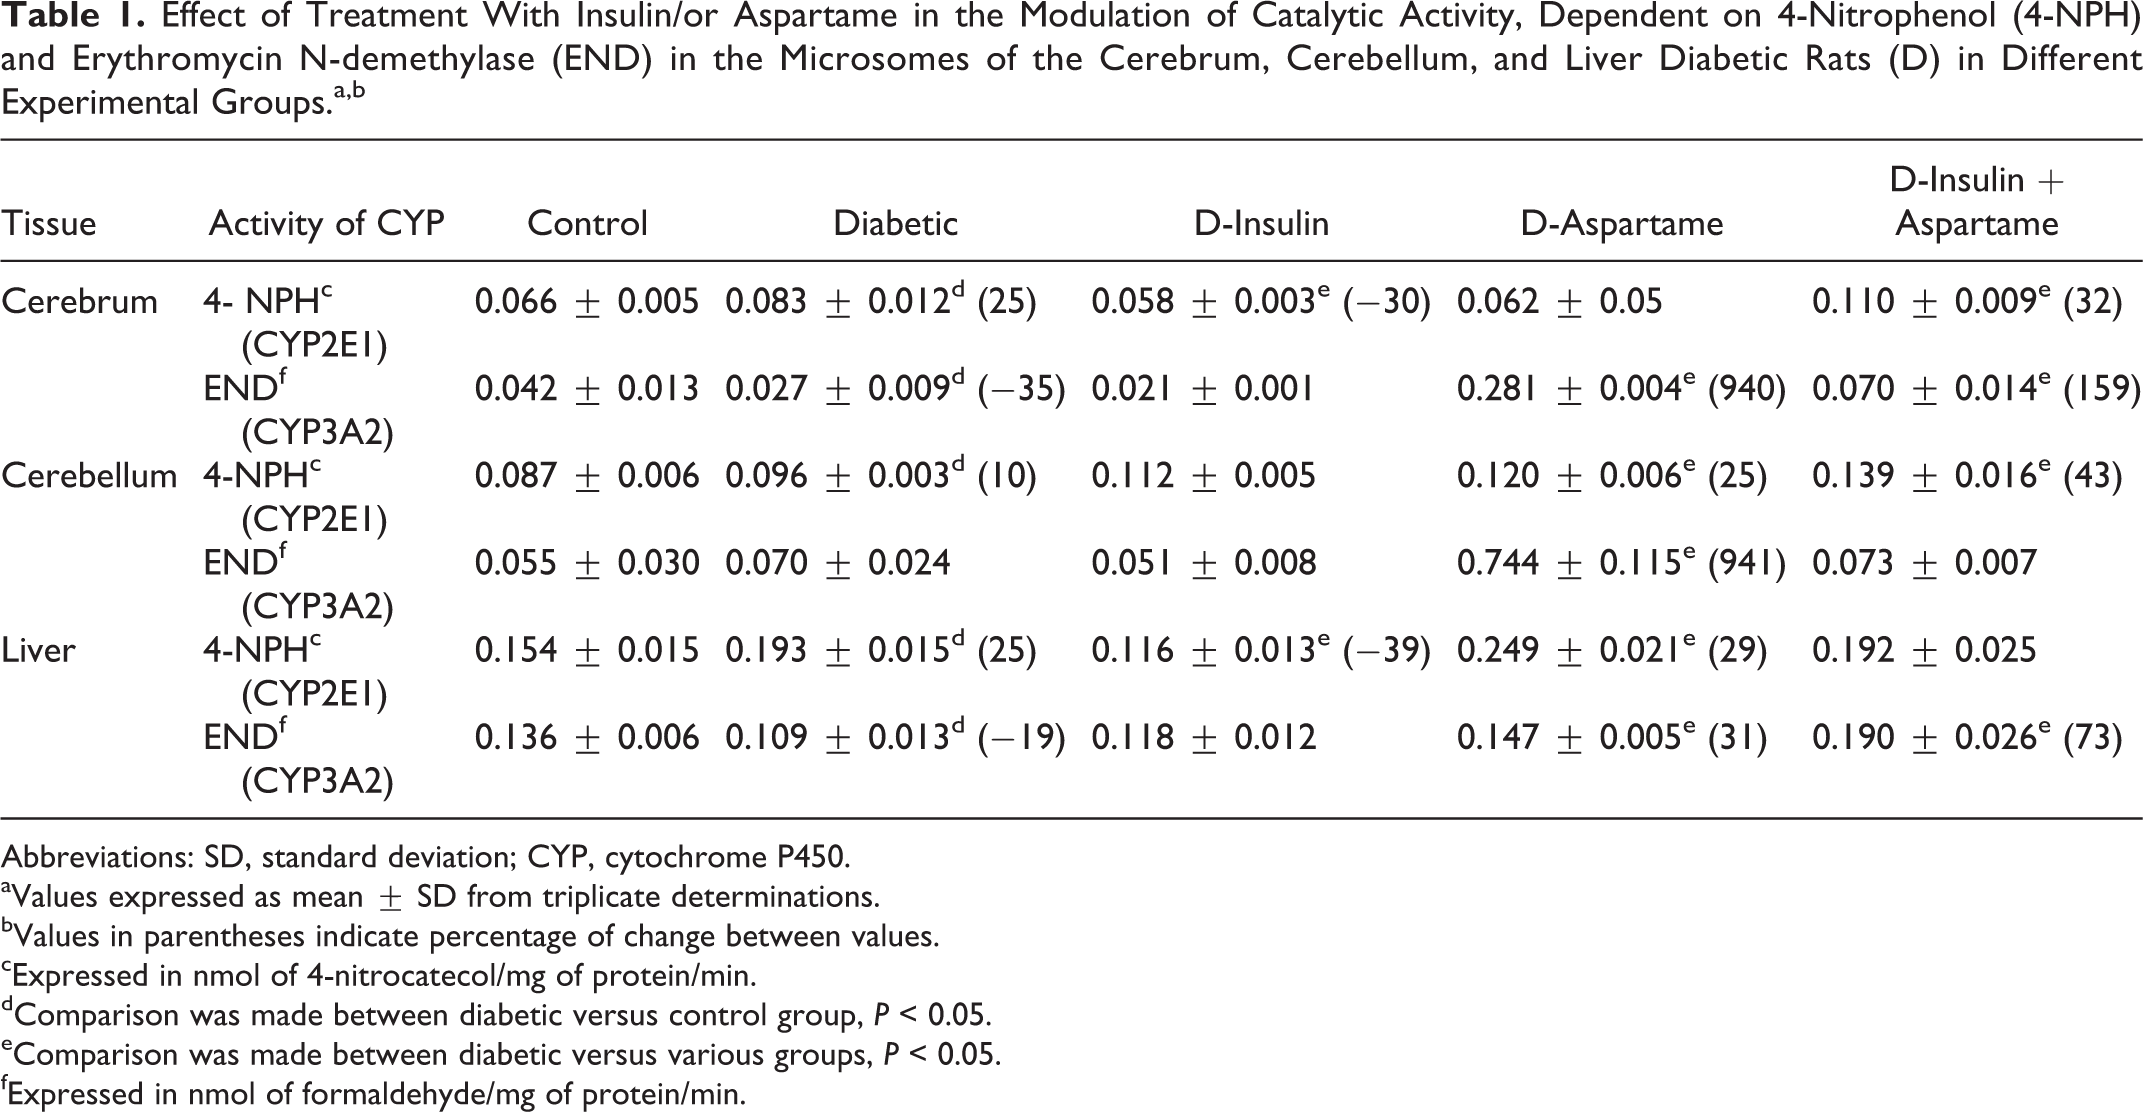
Abbreviations: SD, standard deviation; CYP, cytochrome P450.
aValues expressed as mean ± SD from triplicate determinations.
bValues in parentheses indicate percentage of change between values.
cExpressed in nmol of 4-nitrocatecol/mg of protein/min.
dComparison was made between diabetic versus control group, P < 0.05.
eComparison was made between diabetic versus various groups, P < 0.05.
fExpressed in nmol of formaldehyde/mg of protein/min.
With insulin (D-insulin group), the effects of diabetes on CYP2E1- and CYP3A2-dependent activities were reversed to levels similar to those of the control group. The CYP2E1 catalytic activity in the D-insulin group decreased significantly in the brain (30%) and liver (39%) compared to the D group.
In the D-aspartame group, there was an increase in the enzyme activities of the 2 isoforms assessed, with significant differences in the cerebellum (25%) and liver (29%) for CYP2E1. Enzyme activity for CYP3A2 increased in the liver (31%). However, CYP3A2 catalytic activity increased more than 9.0 times in the brain and cerebellum.
Simultaneous treatment with aspartame and insulin in animals (D-insulin + aspartame group) caused an increase in CYP2E1- and CYP3A2-dependent activities when compared to the D group, with significant differences in the cerebrum for both CYPs, in the cerebellum for CYP2E1 and in the liver for CYP3A2.
Discussion
It is known that the metabolism of some drugs is altered in diabetic patients and in rats with experimental diabetes induced by chemical agents, such as STZ. Marked changes in hepatic CYP system seen in DM seem contribute to this alteration, 21 but there are limited studies regarding the influence of DM on the regulation of CYP enzymes in extrahepatic tissues such as brain. Early age of onset of type 1 DM per se is associated with a high incidence of CNS alterations. 22 It was also previously shown that aspartame consumption, frequently used by diabetic patients, is a potent inductor of CYP enzymes in the brain of juvenile nondiabetic rats. 15 However, there are no studies on the effect of aspartame on the regulation of brain CYP enzymes in cases of diabetes.
Our results have shown that aspartame consumption (50 mg/kg) in juvenile controlled diabetic rats (D-insulin + aspartame group) significantly increases the protein level and enzymatic activity of CYP2E1 in brain, without modifying its expression in the liver. In addition, we observed an increase in the N-demethylation of erythromycin, indicating enhanced P450 2E1 activity, in cerebrum and liver. In uncontrolled diabetic rats with concomitant aspartame consumption (D-aspartame group) also showed significant induction of CYP2E1 in cerebellum and liver, while the CYP3A2 activity was significantly increased in cerebrum, cerebellum (9.4 times in both tissues), and liver (29 times) with respect to the diabetic group.
Previously, we demonstrated that aspartame consumption provokes a substantial increment in CYP2E1 and CYP3A2 enzymes on brain of nondiabetic rats 15 ; whereas, Tutelyan and colleagues 14 showed no alteration in the function of the hepatic microsomes enzymes in rats exposed to aspartame. Thus, aspartame may play a role in regulating of CYPs in brain, mainly in diabetic patients. The aspartame is hydrolyzed in the intestine to form the following 3 main breakdown metabolites: phenylalanine (50%), aspartic acid (40%), and methanol (10%), which are then absorbed into the circulation, elevating their levels in plasma and brain. 23 Various neurochemical effects of aspartame have been associated with increases in and persistence of their metabolites in CNS; those levels are controlled by blood–brain barrier. 24,25 Although phenylalanine and aspartic acid are known as amino acid isolates, changes in their brain content may exert an inducing effect on CYP enzymes. 26 In particular, the methanol metabolite can be responsive of CYP2E1 induction in brain in a similar way to that of the chronic administration of ethanol to increase CYP2E1 by protein stabilization. 27 In addition, it has been documented that diabetes differentially modulates CYP2E1 and CYP3A2 isozymes. 28,29 These findings are in agreement with the present investigation in which we showed STZ-induced diabetes increased CYP2E1 expression and activity in the cerebrum, cerebellum, and liver (D group) compared to controls, whereas CYP3A2 activity decreased in cerebrum and liver.
Different mechanisms have been proposed to account for the observed induction or suppression of CYPs in cases of diabetes, including elevated ketone bodies (CYP2E1 substrate), decreased growth hormone and testosterone levels, and increases in proinflammatory cytokines, noncytokine components, and oxidative stress. 30 In addition, our study showed that insulin plays a primary role in regulation of CYP2E1 expression and activity in brain and liver of diabetic rats administration; however, it didn’t be a mediator of CYP3A2 activity because its constitutive level was not reestablished. In the D-insulin + aspartame group, the insulin only modestly attenuated the CYP3A4-enhanced activity in cerebrum and cerebellum in comparison to the D-aspartame group. These findings suggest that insulin only has effect over CYP2E1 induction mediated by ketones.
Expression of brain CYPs is highly localized in specific cells, and induction of these CYPs may alter local substrate and metabolite concentrations of drugs. Therefore, brain induction of CYP2E1 and CYP3A2 by aspartame consumption in controlled diabetes may result in altered local metabolism from endogenous and exogenous substrates and major risk to neurotoxicity. 16
In brain, CYP2E1 is found in dopaminergic cells of the rat substantia nigra, and, recently, it was suggested that this enzyme might be involved in dopamine metabolism. 31 High CYP2E1 activity is known to produce toxic-free oxygen radicals, and ethanol induction of CYP2E1 has been shown to result in increased oxygen radical formation, oxidative stress, and lipid peroxidation in rat brain and cultured astrocytes. 32 Also, CYP2E1 in brain can activate tobacco smoke procarcinogens.
CYP3A has been identified in neurons, glial cells, and endothelial cells of the blood–brain barrier. Brain CYP3A is able to metabolize a variety of compounds, including many drugs that cross the blood–brain barrier to produce their pharmacological effects within the brain. 33 In addition, it has been known that diabetes progressively increases blood–brain barrier permeability. 34 CYP3A in rat brain microsomes is active in estradiol hydroxylation and it is also able to metabolize testosterone to a number of hydroxylated products. 35
In conclusion, this study demonstrates that combined treatment with insulin and aspartame in juvenile rats with STZ induced DM and significantly induced CYP2E1 in the cerebrum and cerebellum without modifying CYP expression in the liver. In contrast, CYP3A2 activity was increased both in the cerebrum and in the liver. Induction of these CYPs could be considered a decisive factor in the variation of drug response and/or neurotoxicity in brain.
Footnotes
Acknowledgments
We are grateful to Pisa Laboratory for its donation of InsulexN (NPH insulin).
Author Contributions
The work presented here was carried out in collaboration between all authors. Nosti-Palacio, Rosario contributed to conception, acquisition, drafted manuscript and gave final approval.Gómez-Garduño, Josefina drafted manuscript and critically revised manuscript. Molina-Ortiz, Dora contributed to acquisition and analysis, drafted manuscript and gave final approval. Calzada-León, Raúl contributed to design and drafted manuscript.
Declaration of Conflicting Interests
The author(s) declared no potential conflicts of interest with respect to the research, authorship, and/or publication of this article.
Funding
The author(s) received no financial support for the research, authorship, and/or publication of this article.