
Abstract
Mouse Slc39a8 and Slc39a14 genes encode ZIP8 and ZIP14, respectively, which are ubiquitous divalent cation/(HCO3 –)2 symporters responsible for uptake of Zn2+, Fe2+, and Mn2+ into cells. Cd2+ and other toxic nonessential metals can displace essential cations, thereby entering vertebrate cells. Whereas Slc39a8 encodes a single protein, Slc39a14 has 2 exons 4 which, via alternative splicing, give rise to ZIP14A and ZIP14B; why differences exist in cell type-specific expression of ZIP14A and ZIP14B remains unknown. Inflammatory stimuli have been associated with upregulation of ZIP8 and ZIP14, but a systematic study of many tissues simultaneously in a laboratory animal following inflammatory cytokine exposure has not yet been reported. Herein, we show that C57BL/6J male mice––treated intraperitoneally with lipopolysaccharide or the proinflammatory cytokines tumor necrosis factor (TNF) or interleukin-6 (IL6)––exhibited quantatively very different, highly tissue-specific, and markedly time-dependent up- and downregulation of ZIP8, ZIP14A, and ZIP14B messenger RNA (mRNA) levels in 12 tissues. The magnitude of inflammatory response was confirmed by measuring the proinflammatory cytokine TNF, IL6, and interleukin-1β mRNA levels in the same tissues of these animals. Our data suggest that most if not all tissues use ZIP8, ZIP14A, and/or ZIP14B for Zn2+ uptake, some tissues under basal conditions and others moreso when inflammatory stressors are present; collectively, this might lead to substantial alterations in plasma Zn2+ levels due to Zn2+ redistribution not just in liver but across many vital organs. In the context of cadmium-mediated toxicity, our data suggest that tissues other than liver, kidney, and lung should also be considered.
Introduction
Characterization of the ZIP8 and ZIP14 transporters has led to greater appreciation of interactions between Zn2+ uptake, intracellular Zn2+ levels, and inflammation. Following discovery of variable response to cadmium toxicity among inbred strains of mice, the Cdm locus was shown to be primarily associated with this phenotypic difference. 1,2 Subsequently, the mouse Slc39a8 gene was identified 3 and its encoded ZIP8 protein was found to be a divalent metal/bicarbonate symporter. 4,5 Direct proof that the Slc39a8 gene was indeed the Cdm locus was confirmed by bacterial artificial chromosome (BAC) transgenesis; a BAC carrying only the Slc39a8 gene plus 87 kb 5′- and 18 kb 3′-flanking regions from a “cadmium-sensitive” mouse––inserted into the genome of a “cadmium-resistant” mouse––reverted the phenotype to cadmium sensitivity. 6,7
The SLC39 family comprises 14 genes highly conserved between mouse and human; phylogenetic analysis showed mammalian SLC39A8 was evolutionarily most closely related to SLC39A14, the 2 genes having diverged from one another less than 420 million years ago. 7,8 The Slc39a14 gene encodes ZIP14, also a divalent metal/bicarbonate symporter. 8 Both ZIP8 and ZIP14 transport 5,9 an electroneutral complex, Zn2+/(HCO3 –)2, in which Zn2+ can be displaced by Fe2+ or Mn2+ as well as nonessential metal cations including Cd2+, Hg2+, Pb2+, Pt2+, and U2+. 9 Others have also demonstrated that ZIP8 10 –13 and ZIP14 12 –16 function to import endogenous Zn2+, Fe2+, and/or Mn2+ into the cell. In fact, a hypomorphic mouse line––expressing ∼10% of wild-type ZIP8 levels in all tissues and exhibiting markedly lowered Zn2+ and Fe2+ tissue levels––suffers severe defects in hematopoiesis and in multiple-organ organogenesis, which are neonatal-lethal. 17
From the beginning of mammalian ZIP8 and ZIP14 studies, there has been a close association with inflammatory stimuli. Mammalian ZIP8 was discovered when a complementary DNA (cDNA) library––prepared from human monocytes stimulated with Mycobacterium bovis Bacillus Calmette-Guerin cell wall––was screened to identify novel genes induced by inflammatory danger signals; inflammatory cytokines such as tumor necrosis factor (TNF) were shown to be potent inducers of the ZIP8 transcript. 18
Subsequent cytokine-activation studies include: lipopolysaccharide (LPS), TNF, and interleukin-6 (IL6) induction of ZIP14 in mouse liver but not small intestine or spleen 19 ; TNF-mediated upregulation of ZIP8 but not ZIP14 in human lung 10 ; effects of ZIP8 overexpression versus small interfering RNA-mediated ZIP8 knockdown on Zn2+ levels during expression of interferon-γ in human T-cells 20 ; recognition of ZIP14 participation in gluconeogenesis as well as G-protein-coupled receptor-mediated signaling in mouse bone, pituitary gland, and liver 21 ; LPS-induced endotoxemia stimulating ZIP14 levels in liver, white adipose tissue, and muscle of Slc39a14(–/–) knockout mice 22 ; importance of increased Zn2+ levels during ZIP14- or nitric oxide-mediated resistance to LPS-induced apoptosis in sheep pulmonary artery endothelial cell cultures 23 ; identification of a negative feedback loop in fetal fibroblasts from Slc39a8-hypomorphic mice––involving ZIP8, inhibitor of κB kinase, and nuclear factor κB––which directly regulates innate immune function through coordination of Zn2+ metabolism 24 ; demonstration of LPS as a strong inducer of ZIP14 in human macrophages 25 ; and recent demonstration that “the Zn2+-ZIP8-MTF1 axis” represents an essential catabolic regulator during the pathogenesis of osteoarthritis. 26
These studies demonstrate the ubiquitous nature of inflammatory cytokine-induced ZIP8 and/or ZIP14 in numerous mammalian tissues and cell types; however, these previous ZIP8 and ZIP14 studies had shown LPS or TNF treatment usually at 32 hours, and IL6 treatment at 16 hours, only in a few tissues. Thus, a systematic examination of numerous tissues in the same animal, as a function of time following administration of inflammatory stimuli, has not yet been reported. Herein, we show quantitative real-time polymerase chain reaction (qRT-PCR) measurements of ZIP8 and ZIP14 and cytokine messenger RNA (mRNA) levels in 12 tissues of C57BL/6J mice over a 32-hour period after LPS and TNF administration and over a 16-hour period following IL6 treatment.
Materials and Methods
Chemicals
Lipopolysaccharide, TNF, and IL6 were purchased from Sigma-Aldrich (St Louis, Missouri). Dilutions were made in 0.09% NaCl (saline) solution and filtered through a 0.22-μm syringe prior to injection into the mice.
Treatment of Animals and Harvesting of Tissues
C57BL/6J male mice between 6 and 8 weeks of age were purchased from The Jackson Laboratory (Bar Harbor, Maine); following acclimation to our mouse colony for 5 to 7 days, these mice were studied. All mouse experiments were conducted in accordance with the National Institutes of Health standards for the care and use of experimental animals and University Cincinnati Medical Center Institutional Animal Care and Use Committee (protocol #11-09-12-01; approved 5 September 2008 → 4 Sept 2011 → 3 Sept 2014).
Subsequent to intraperitoneal treatment with LPS (5 mg/kg), TNF (5 μg/kg), or IL6 (100 μg/kg), the mice (N = 3 per time point) were killed at 2, 4, 8, 16, or 32 hours; untreated mice provided the 0-hour time point and all experiments were repeated at least twice. The 12 tissues (collected at the 6 time points) included liver, proximal small intestine (PSI), kidney, lung, heart, brain, pancreas, spleen, testis, urinary bladder, skin, and preputial gland duct (PGD). PSI samples represent the first 4 cm beyond the pyloric sphincter. PGD samples were isolated from tissues under the skin of the penis; surrounding fat was carefully separated so that the preputial gland could be harvested without breaking as well as with virtually no other attached tissue (surrounding skin, cartilage, collagenous tissue, or muscle).
Total RNA Preparation
With Tri-Reagent (TR18; Molecular Research Center, Inc, Cincinnati, Ohio), total RNA was isolated from the 12 above-mentioned organs or tissues, following the protocol recommended by the vendor.
Reverse Transcription and qRT-PCR
Total RNA (2.5 μg) from each sample was used as template for reverse transcription and primed with oligo(dT), using the Verso cDNA kit, AB-1453/B (Thermo Scientific, Waltham, Massachusetts). Total RNA (2.5 μg) was added to reactions containing 3.8 μmol/L oligo(dT)20 and 0.77 mmol/L deoxynucleotide to a final volume of 13 μL; reactions were incubated at 65°C for 5 minutes and then 4°C for 2 minutes. Next, we added 7 μL of solution containing 14 mmol/L dithiothreitol and 40 units of RNaseOUT Recombinant RNase inhibitor (Verso cDNA kit). After incubation at room temperature for 2 minutes, 1 μL of reverse transcriptase was added to each sample. Reaction tubes were incubated at 42°C for 30 minutes, followed by 75°C for 10 minutes (to inactivate reverse transcriptase), and placed immediately on ice. Diethylpyrocarbonate-treated distilled water (80 μL) was added to dilute the cDNA that had been generated, and the resultant mixture was stored at −80°C until use.
We performed qRT-PCR in the Bio-Rad DNA Engine Opticon 2 (Bio-Rad Laboratories, Hercules, California), using iQ SYBR Green Supermix (170-8882; Bio-Rad Laboratories). The housekeeping gene’s β-actin mRNA (ACTB) was employed as the internal control. Standard curves using serial dilutions of total RNA resulted in excellent linearity (r = 0.99), indicating our qRT-PCR results were valid. All primers used are available upon request.
Statistics
All experiments were confirmed in at least triplicate and repeated twice. Statistical analysis was performed using the sofware SPSS version 13.0 (Microsoft; Somers, New York). Data are presented as mean ± standard error of the mean of triplicate samples. P values <.05 are regarded as statistically significant.
Results and Discussion
Although SLC39A8 and SLC39A14 originated from 1 ancestral gene in fish, they diverged into 2 distinct genes (on different chromosomes) after the sea animal/land animal split. 7,8 Although the gene structures are similar, that is, both mouse genes having 3 noncoding alternative exons 1 and 8 coding exons, Slc39a14 contains alternative exons 4a and 4b. Thus, different amino acids in exons 4a and 4b were found to cause 2 distinct proteins having differential expression patterns in various tissues. 7,8 To date, no antibody has been generated that distinguishes between the 2 proteins. Km values for Zn2+, Fe2+, and Cd2+ uptake in Xenopus oocytes, nonetheless, were shown to be distinctly very different between ZIP14A and ZIP14B 9 : 0.36 μmol/L vs 0.78 μmol/L for Zn2+, respectively; 0.19 μmol/L vs 0.64 μmol/L for Fe2+, respectively; and 0.54 μmol/L vs 0.31 μmol/L for Cd2+, respectively. The significance of tissue-specific functions of these 2 ZIP14 distinct proteins remains to be determined. It should be noted that, however, using different primers, one can quantify ZIP14A and ZIP14B mRNA levels by qRT-PCR in various tissues.
Effects of LPS, TNF, and IL6 on ZIP mRNA Levels
Lipopolysaccharide treatment
ZIP8 mRNA induction by LPS was highest in bladder at 2 and 16 hours; ZIP14A mRNA highest in skin at 8 hours but was elevated during the first 16 hours; and ZIP14B mRNA elevated highest in lung at 16 hours but slightly elevated at all time points (Figure 1A; Table 1; Supplementary Table S1.A). All induced ZIP mRNA levels peaked between 2 and 16 hours and usually were headed toward baseline by 32 hours; exceptions included ZIP14B in lung and kidney, which remained substantially elevated at 32 hours. Other than bladder, LPS-induced ZIP8 was negligible in the other 11 tissues; actually, ZIP8 was significantly downregulated in liver, heart, and brain. In liver mRNA levels of both ZIP14A and ZIP14B were also downregulated by LPS treatment, significantly at the 16-hour time point.
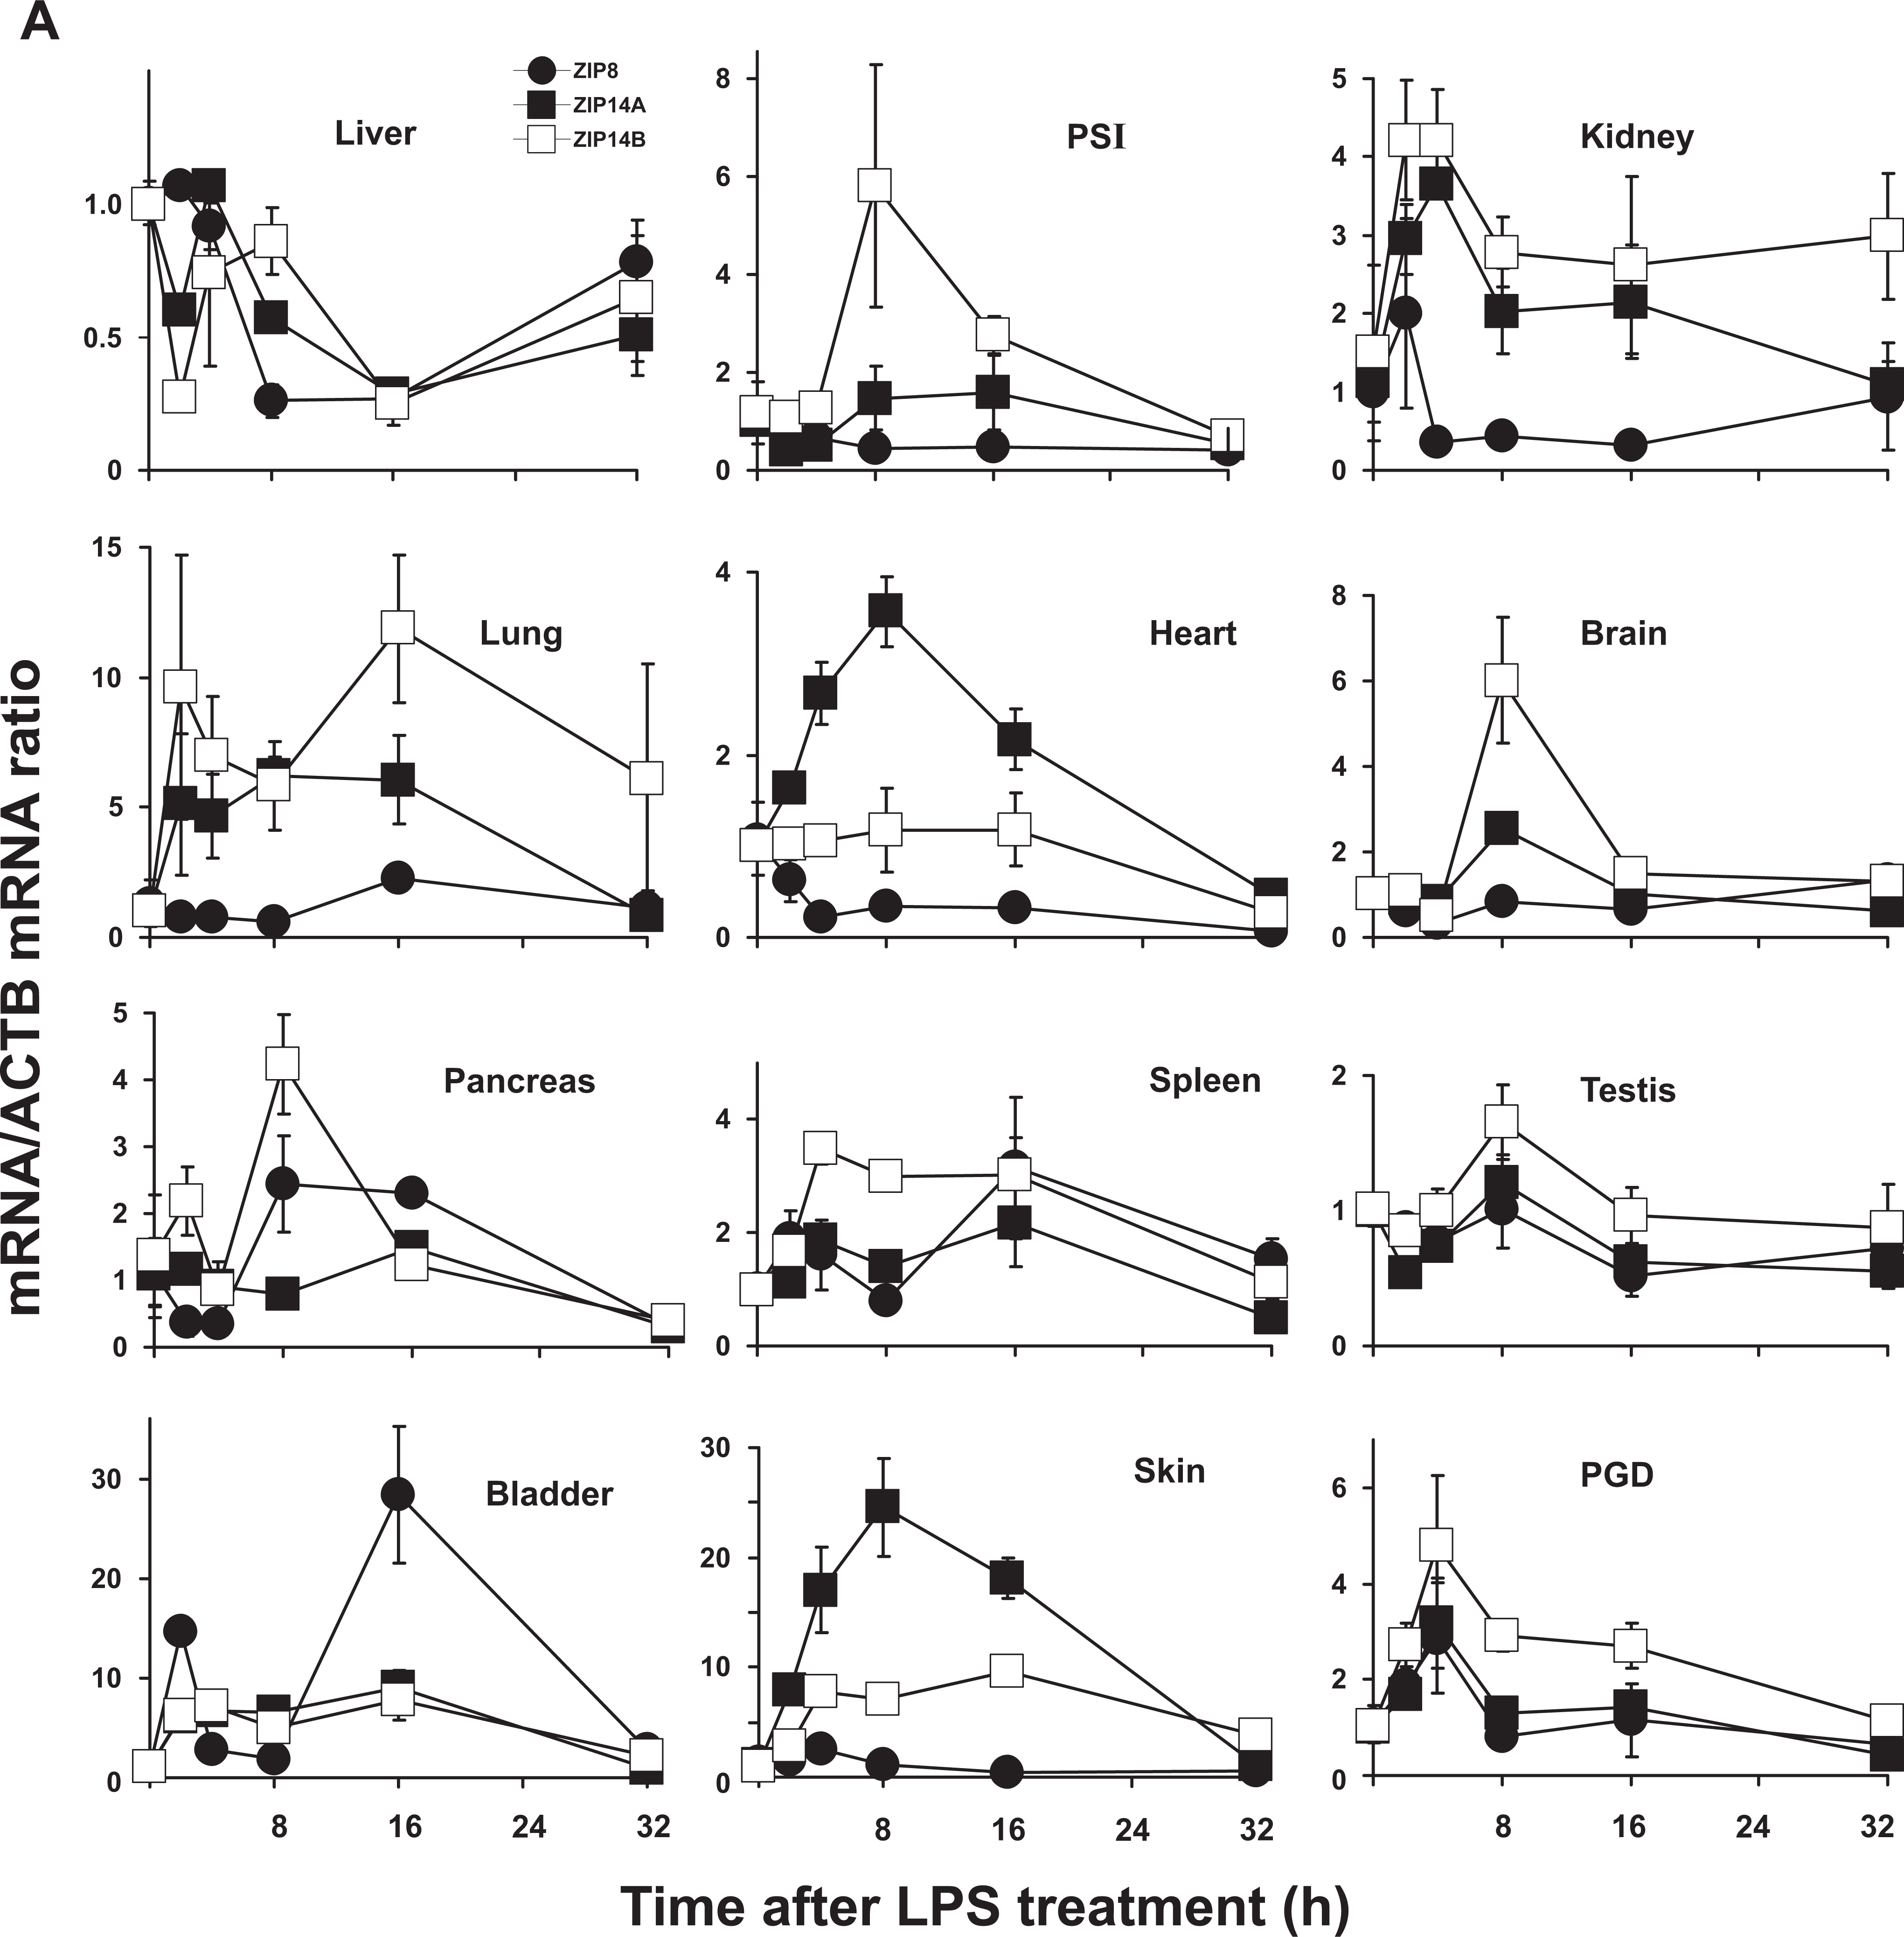
Relative ZIP8, ZIP14A, and ZIP14B mRNA levels in mice following treatment with LPS, TNF, or IL6. ZIP8 (closed circles, •), ZIP14A (closed squares, □), and ZIP14B (open squares, □ ) mRNA levels were quantified in each of the 12 tissues as a function of time after the single dose of LPS or cytokine, as indicated. N = 3 per time point and all experiments were repeated twice; β-actin (ACTB) mRNA was employed as the control. Results were normalized using the nontreated mRNA/ACTB mRNA ratio. Note the 2- to ∼30-fold differences in values on the ordinates. Statistical analysis of all time points is summarized in Supplementary Table S1. A, LPS treatment. B, TNF treatment. C, IL6 treatment. IL6 indicates interleukin-6; LPS, lipopolysaccharide; mRNA, messenger RNA; TNF, tumor necrosis factor.
Relative Increases in Upregulation of mRNA, as Measured by qRT-PCR: Data From Figures 1A and 2A (LPS Treatment).a
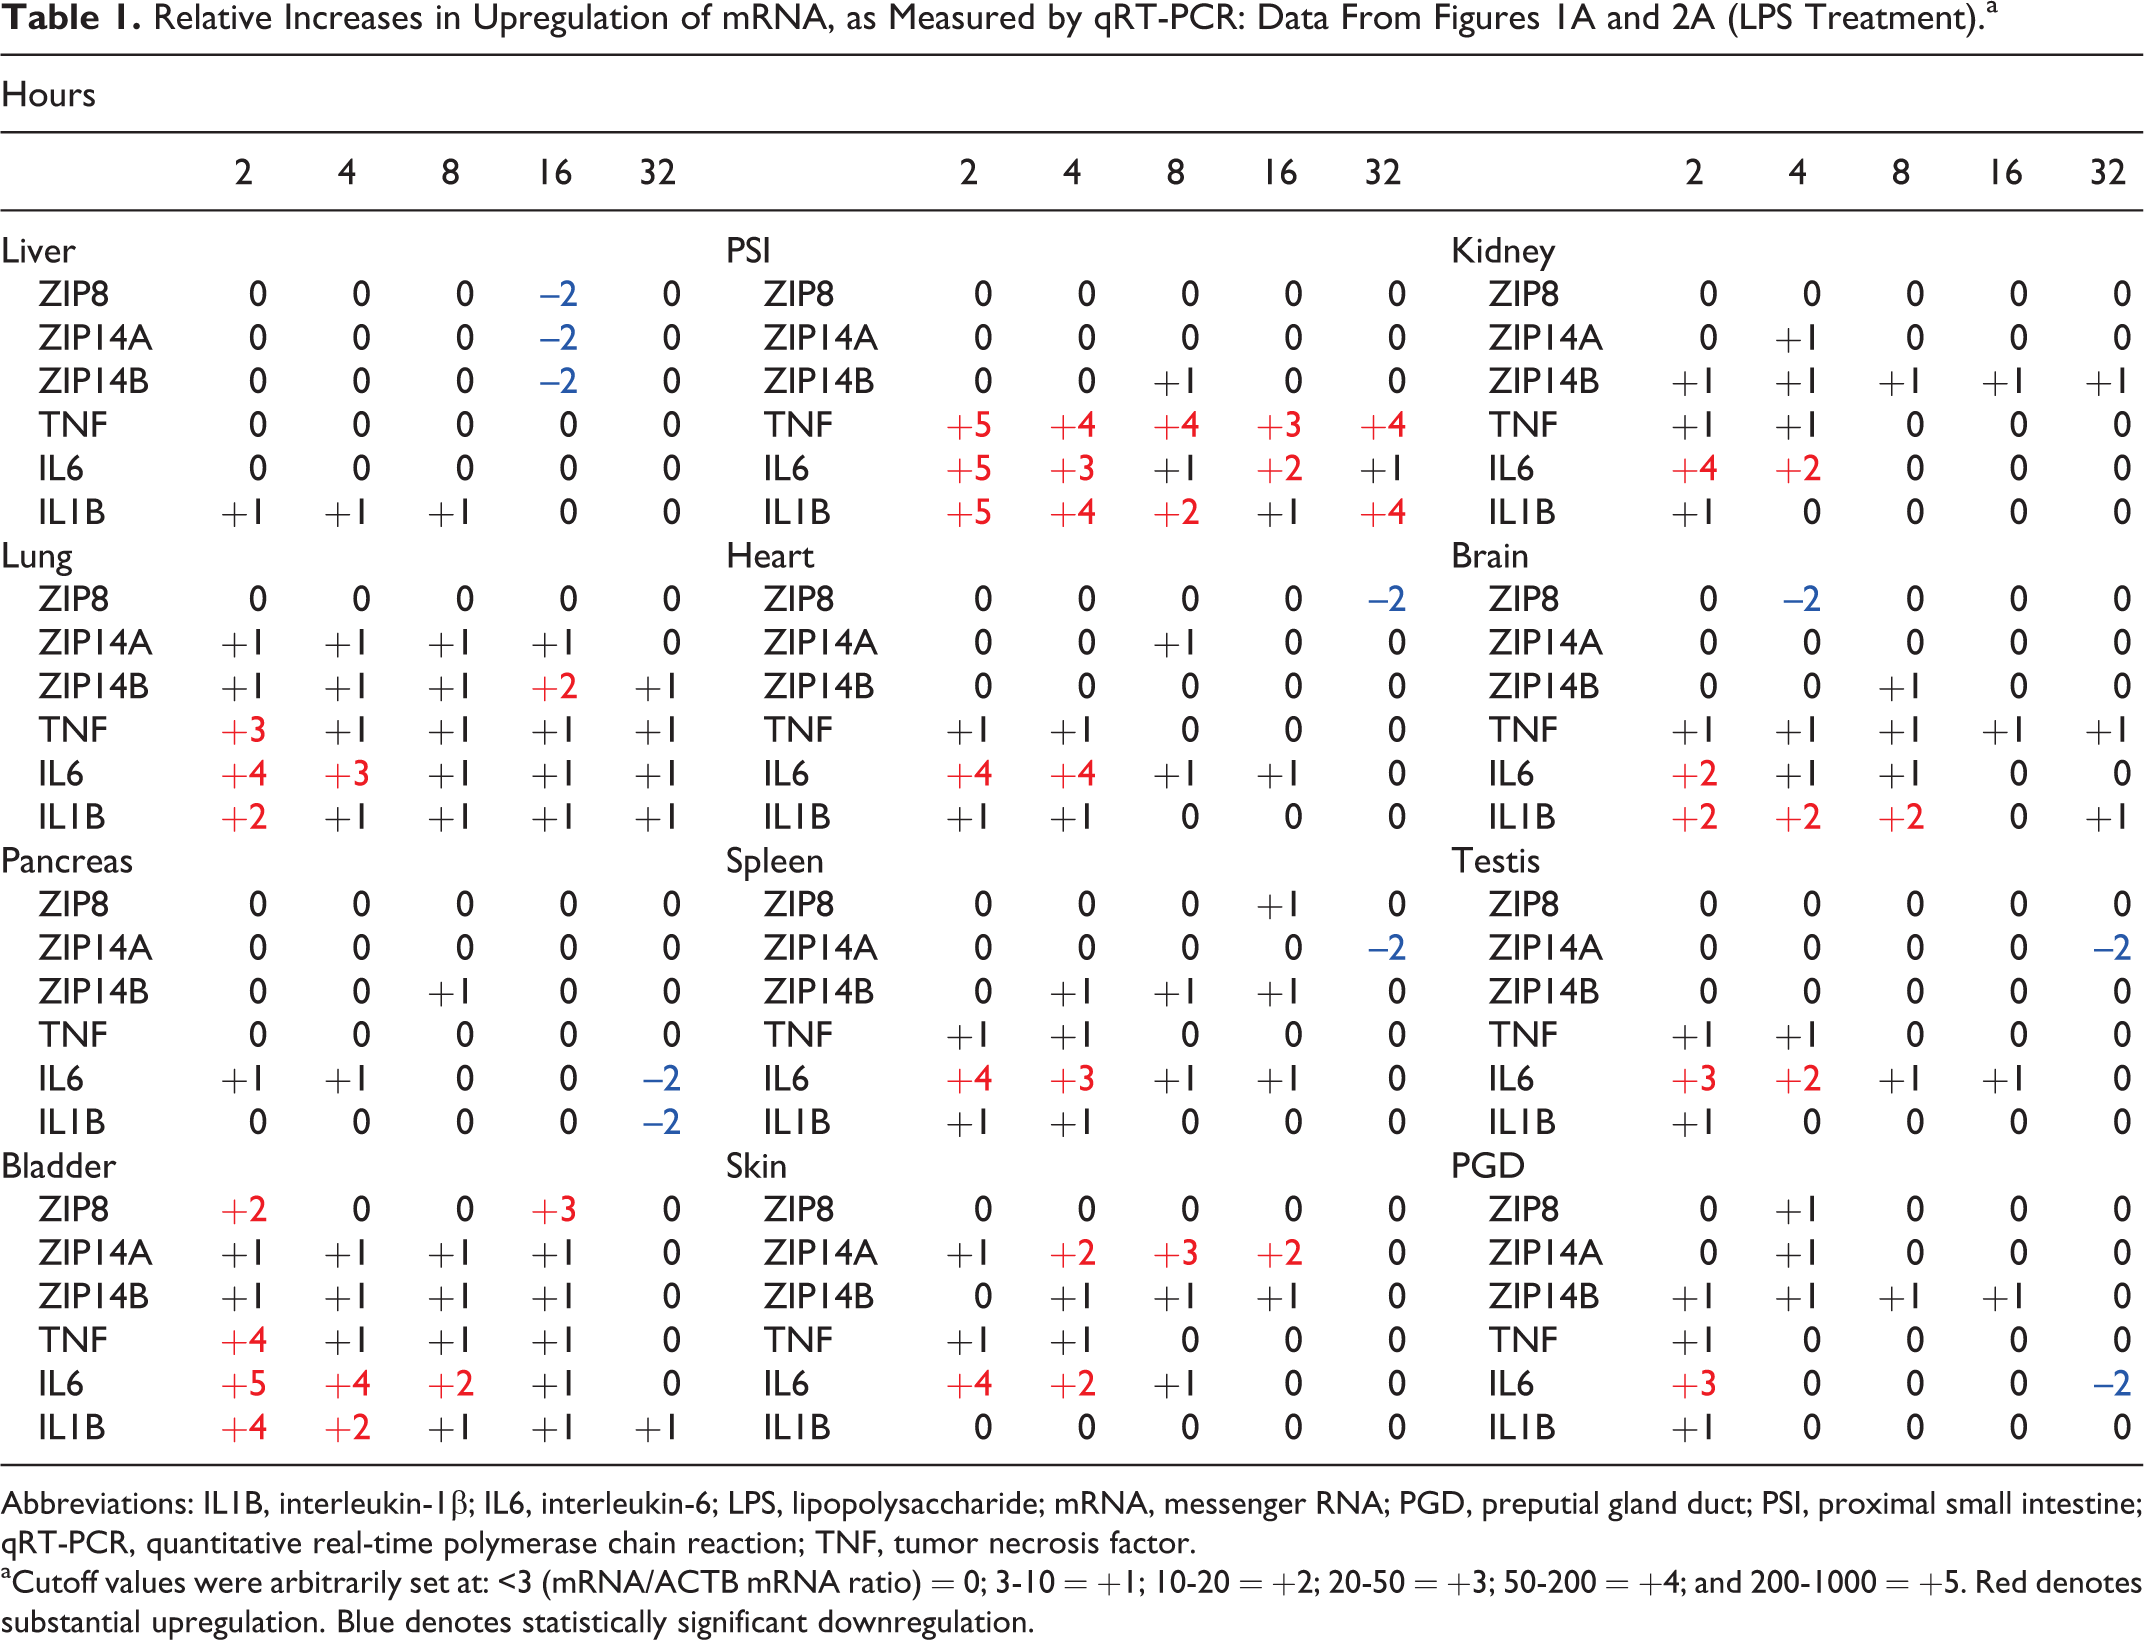
Abbreviations: IL1B, interleukin-1β; IL6, interleukin-6; LPS, lipopolysaccharide; mRNA, messenger RNA; PGD, preputial gland duct; PSI, proximal small intestine; qRT-PCR, quantitative real-time polymerase chain reaction; TNF, tumor necrosis factor.
aCutoff values were arbitrarily set at: <3 (mRNA/ACTB mRNA ratio) = 0; 3-10 = +1; 10-20 = +2; 20-50 = +3; 50-200 = +4; and 200-1000 = +5. Red denotes substantial upregulation. Blue denotes statistically significant downregulation.
Tumor necrosis factor treatment
The levels of ZIP8 mRNA were extremely high in pancreas at 4, 8, and 16 hours, both ZIP14A mRNA and ZIP14B mRNA highest in skin at all early time points, and ZIP14B in pancreas at 16 hours (Figure 1B; Table 2; Supplementary Table S1.B). The TNF-induced ZIP mRNAs were negligible over the 32-hour period in: for ZIP8 in liver, PSI, lung, spleen, testis, and skin; for ZIP14A in liver, kidney, lung, pancreas, spleen, testis, bladder, and PGD; for ZIP14B in lung, brain, spleen, testis, bladder, and PGD. ZIP8 mRNA levels were significantly downregulated at early time points in kidney, brain, and PGD. ZIP14A was significantly downregulated by TNF in brain at 8 hours and ZIP14B in kidney at 4 hours.
Relative Increases in Upregulation of mRNA, as Measured by qRT-PCR: Data From Figures 1B and 2B (TNF Treatment).a
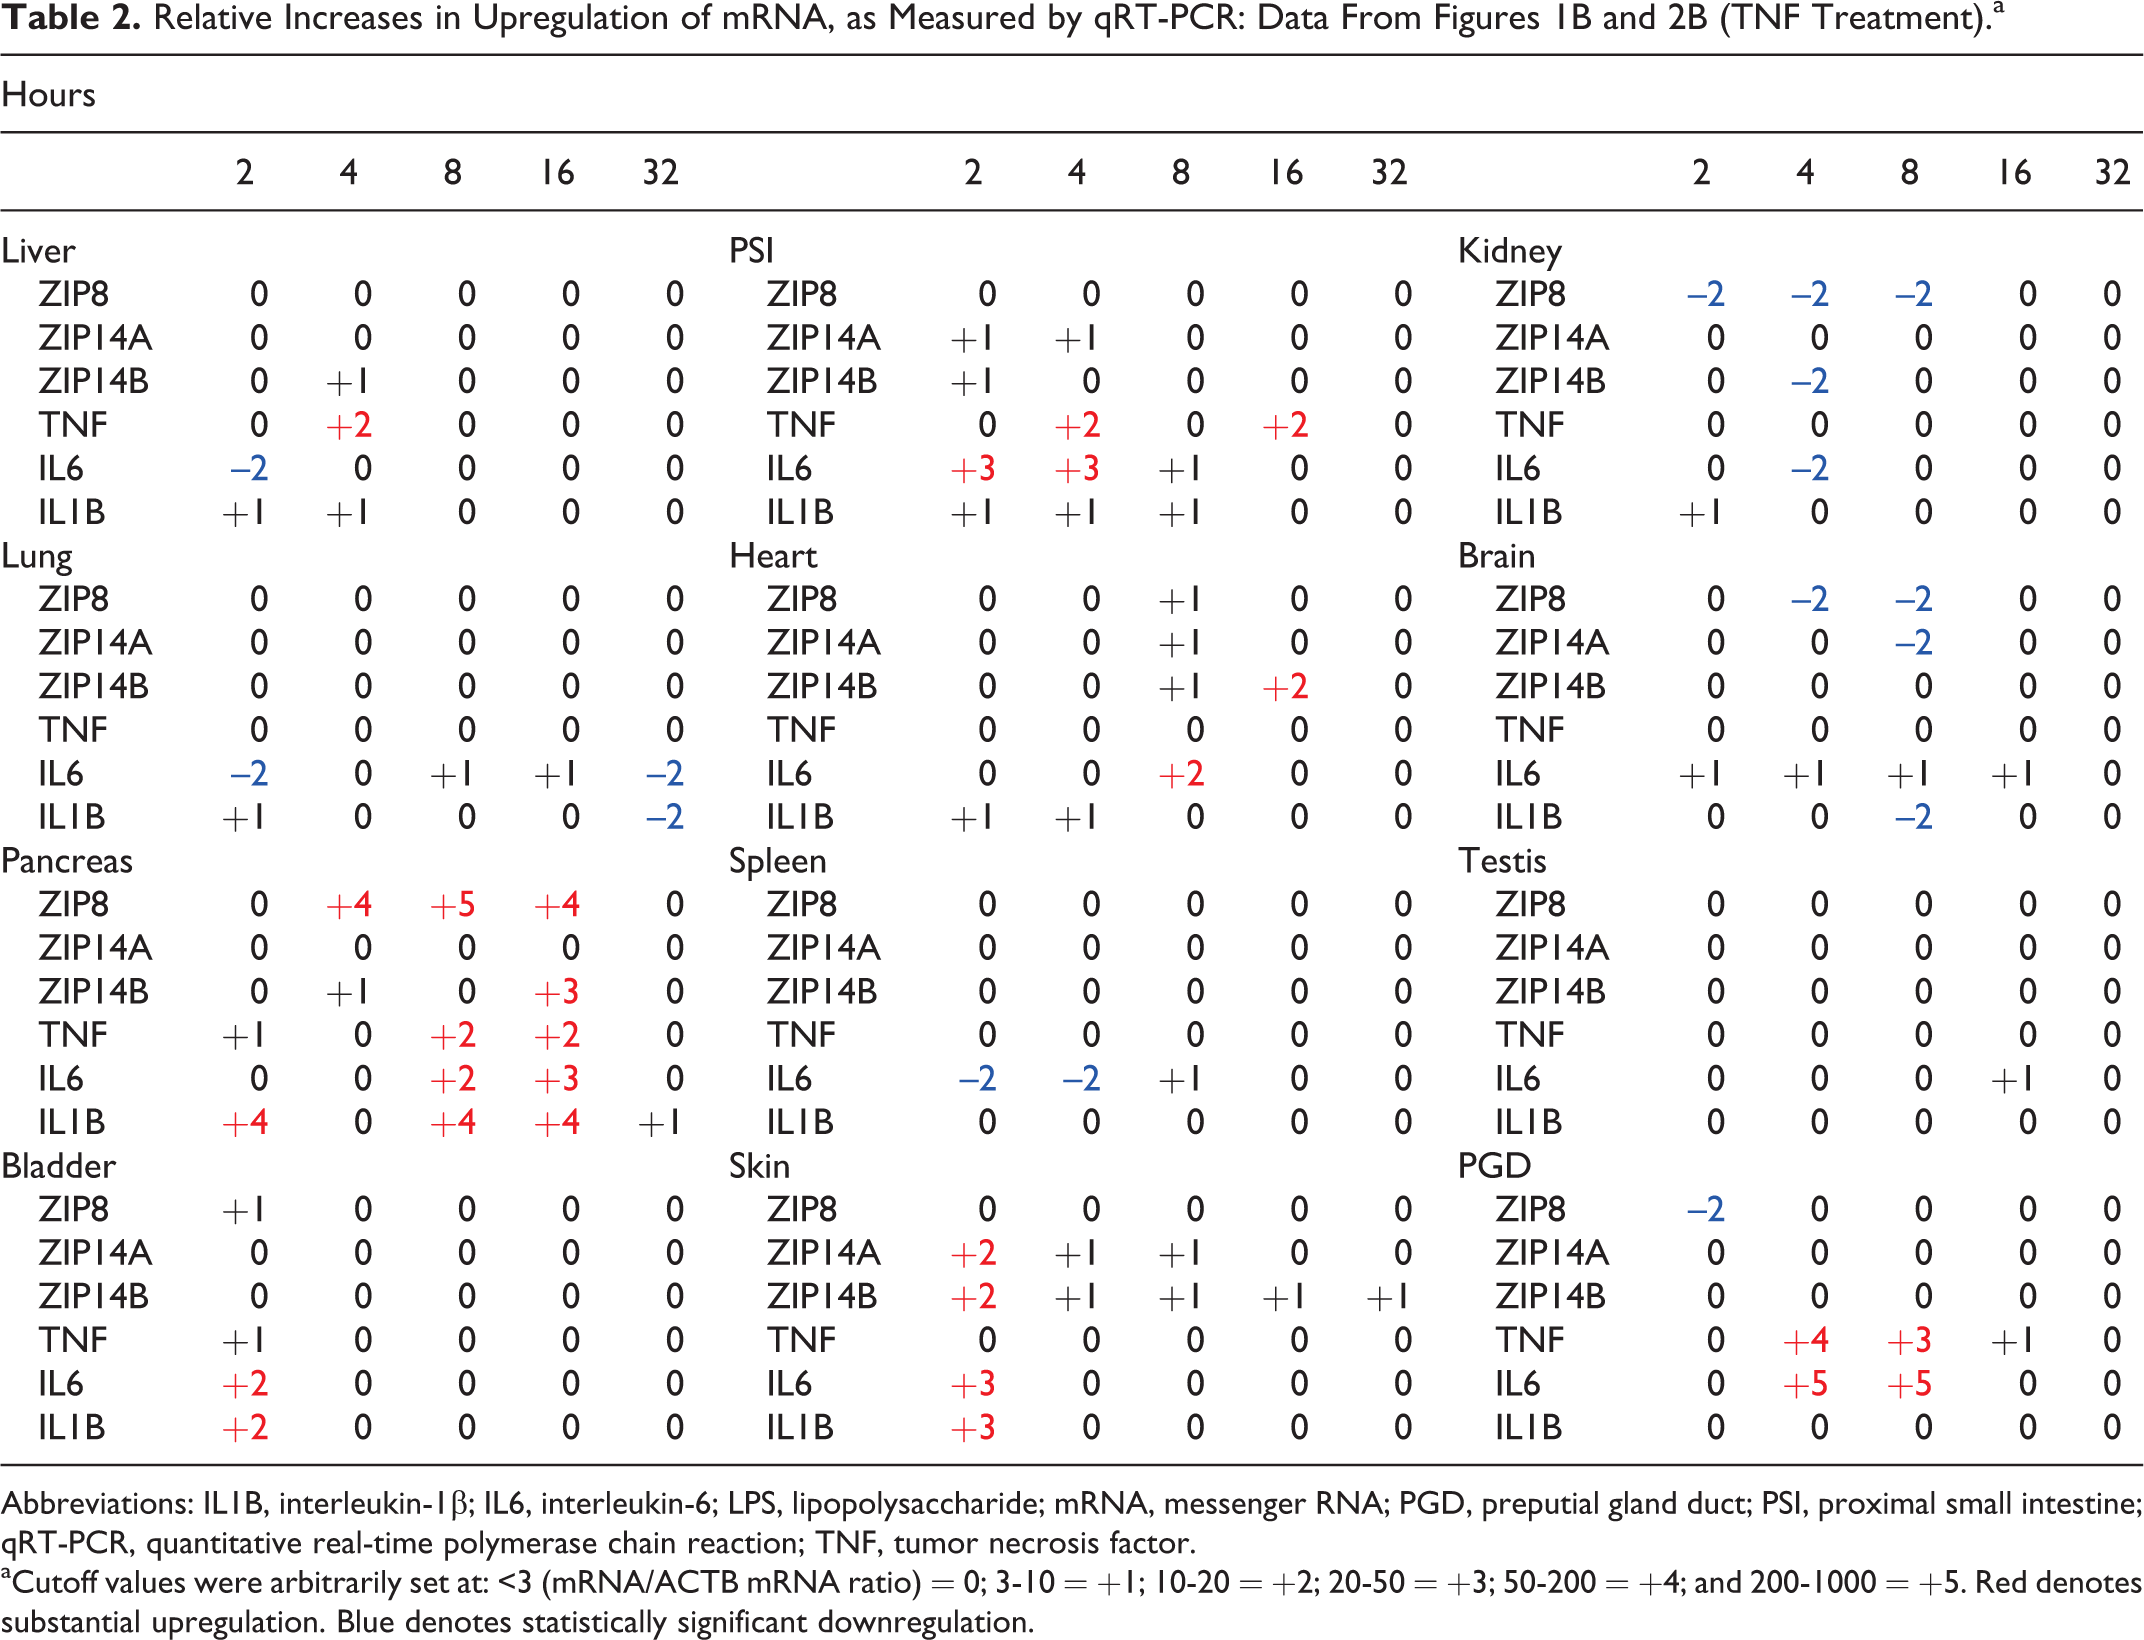
Abbreviations: IL1B, interleukin-1β; IL6, interleukin-6; LPS, lipopolysaccharide; mRNA, messenger RNA; PGD, preputial gland duct; PSI, proximal small intestine; qRT-PCR, quantitative real-time polymerase chain reaction; TNF, tumor necrosis factor.
aCutoff values were arbitrarily set at: <3 (mRNA/ACTB mRNA ratio) = 0; 3-10 = +1; 10-20 = +2; 20-50 = +3; 50-200 = +4; and 200-1000 = +5. Red denotes substantial upregulation. Blue denotes statistically significant downregulation.
Interleukin-6 treatment
There was no significant upregulation by IL6 of ZIP8, ZIP14A, or ZIP14B mRNA in any of the 12 tissues over the 16-hour experiment (Figure 1C; Table 3; Supplementary Table S1.C). Significant downregulation was observed for ZIP8 in liver, lung, brain, and urinary bladder at 8 and/or 16 hours; for ZIP14A in liver, lung, and heart at 16 hours; and for ZIP14B in liver and heart at 16 hours and testis at 4 hours.
Relative Increases in Upregulation of mRNA, as Measured by qRT-PCR: Data From Figures 1C and 2C (IL6 Treatment).a
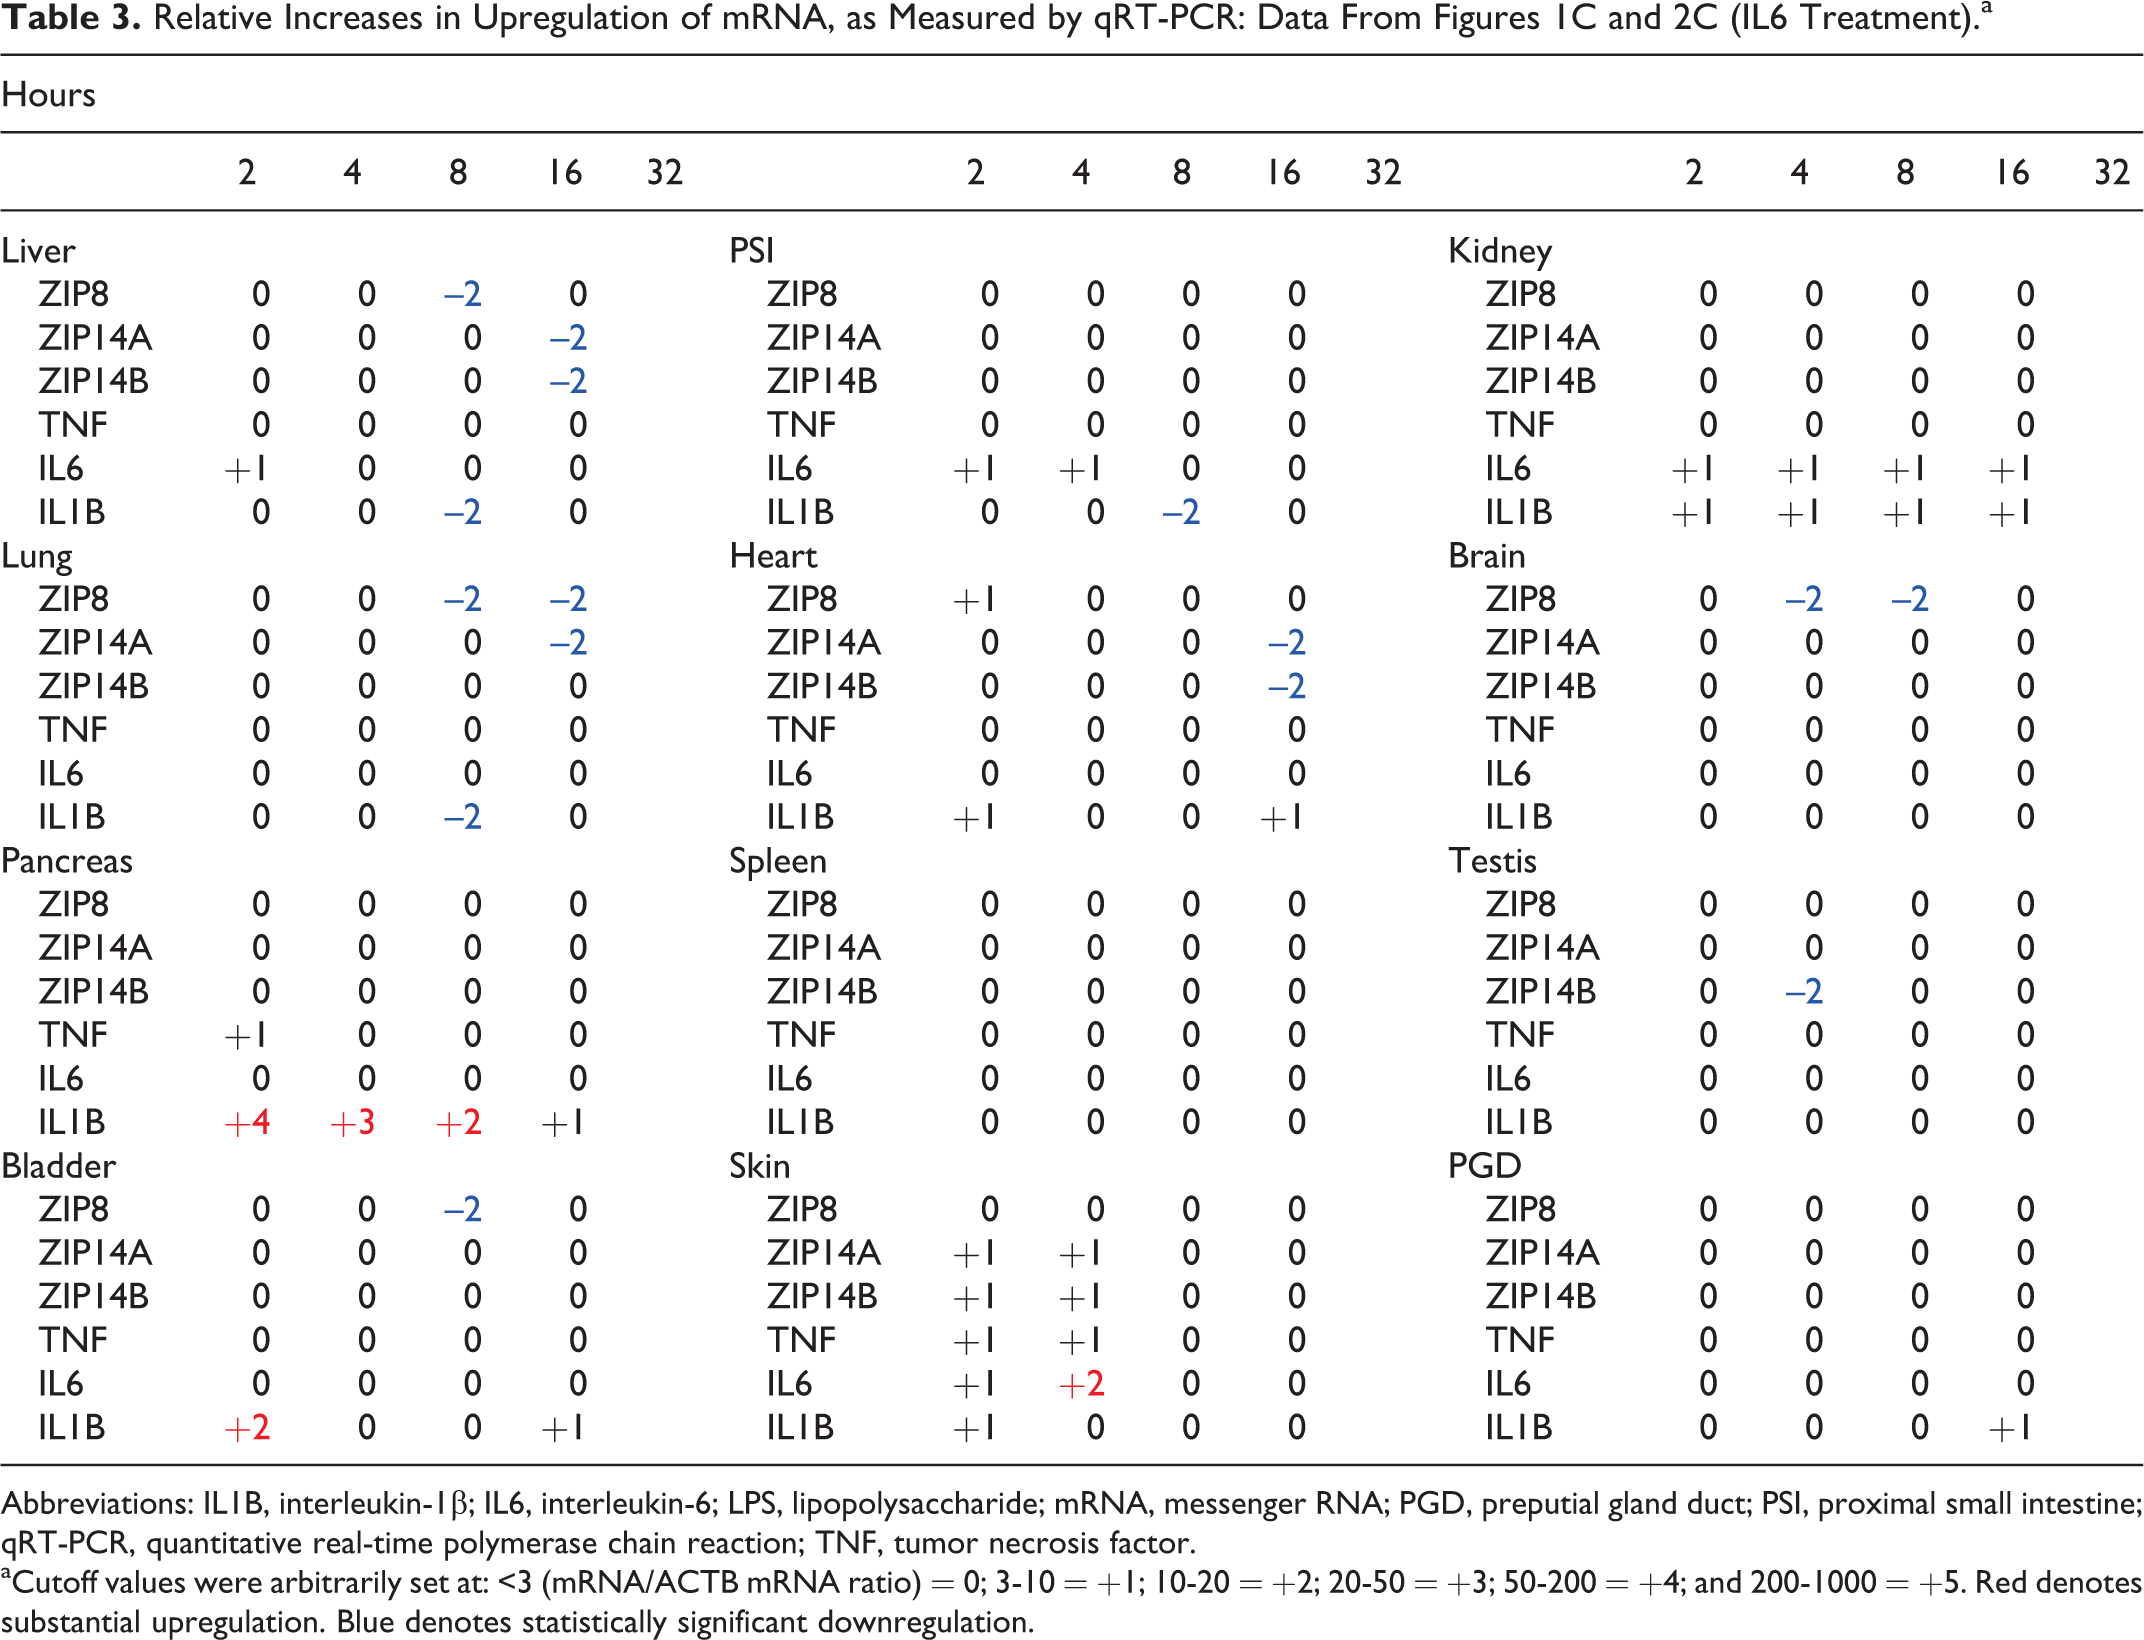
Abbreviations: IL1B, interleukin-1β; IL6, interleukin-6; LPS, lipopolysaccharide; mRNA, messenger RNA; PGD, preputial gland duct; PSI, proximal small intestine; qRT-PCR, quantitative real-time polymerase chain reaction; TNF, tumor necrosis factor.
aCutoff values were arbitrarily set at: <3 (mRNA/ACTB mRNA ratio) = 0; 3-10 = +1; 10-20 = +2; 20-50 = +3; 50-200 = +4; and 200-1000 = +5. Red denotes substantial upregulation. Blue denotes statistically significant downregulation.
Effects of LPS, TNF, and IL6 on Cytokine mRNA Levels
Lipopolysaccharide treatment
The levels of TNF, IL6, and interleukin-1β (IL1B) mRNA were all highest in PSI and urinary bladder at 2 hours, remaining significantly elevated throughout the 32-hour experiment in PSI, and through the first 16 hours in bladder for TNF and IL6 mRNA (Figure 2A; Table 1; Supplementary Table S1.A). The TNF mRNA was also significantly upregulated in lung at 2 hours. The IL6 mRNA was also was elevated at early time points in kidney, lung, heart, brain, spleen, testis, skin, and PGD. Lipopolysaccharide-mediated stimulation of IL1B mRNA was also significantly increased in lung and brain persistently through the 32-hour experiment. Significant downregulation was seen only for IL6 mRNA in pancreas and PGD at 32 hours and for IL1B mRNA in pancreas at 32 hours.
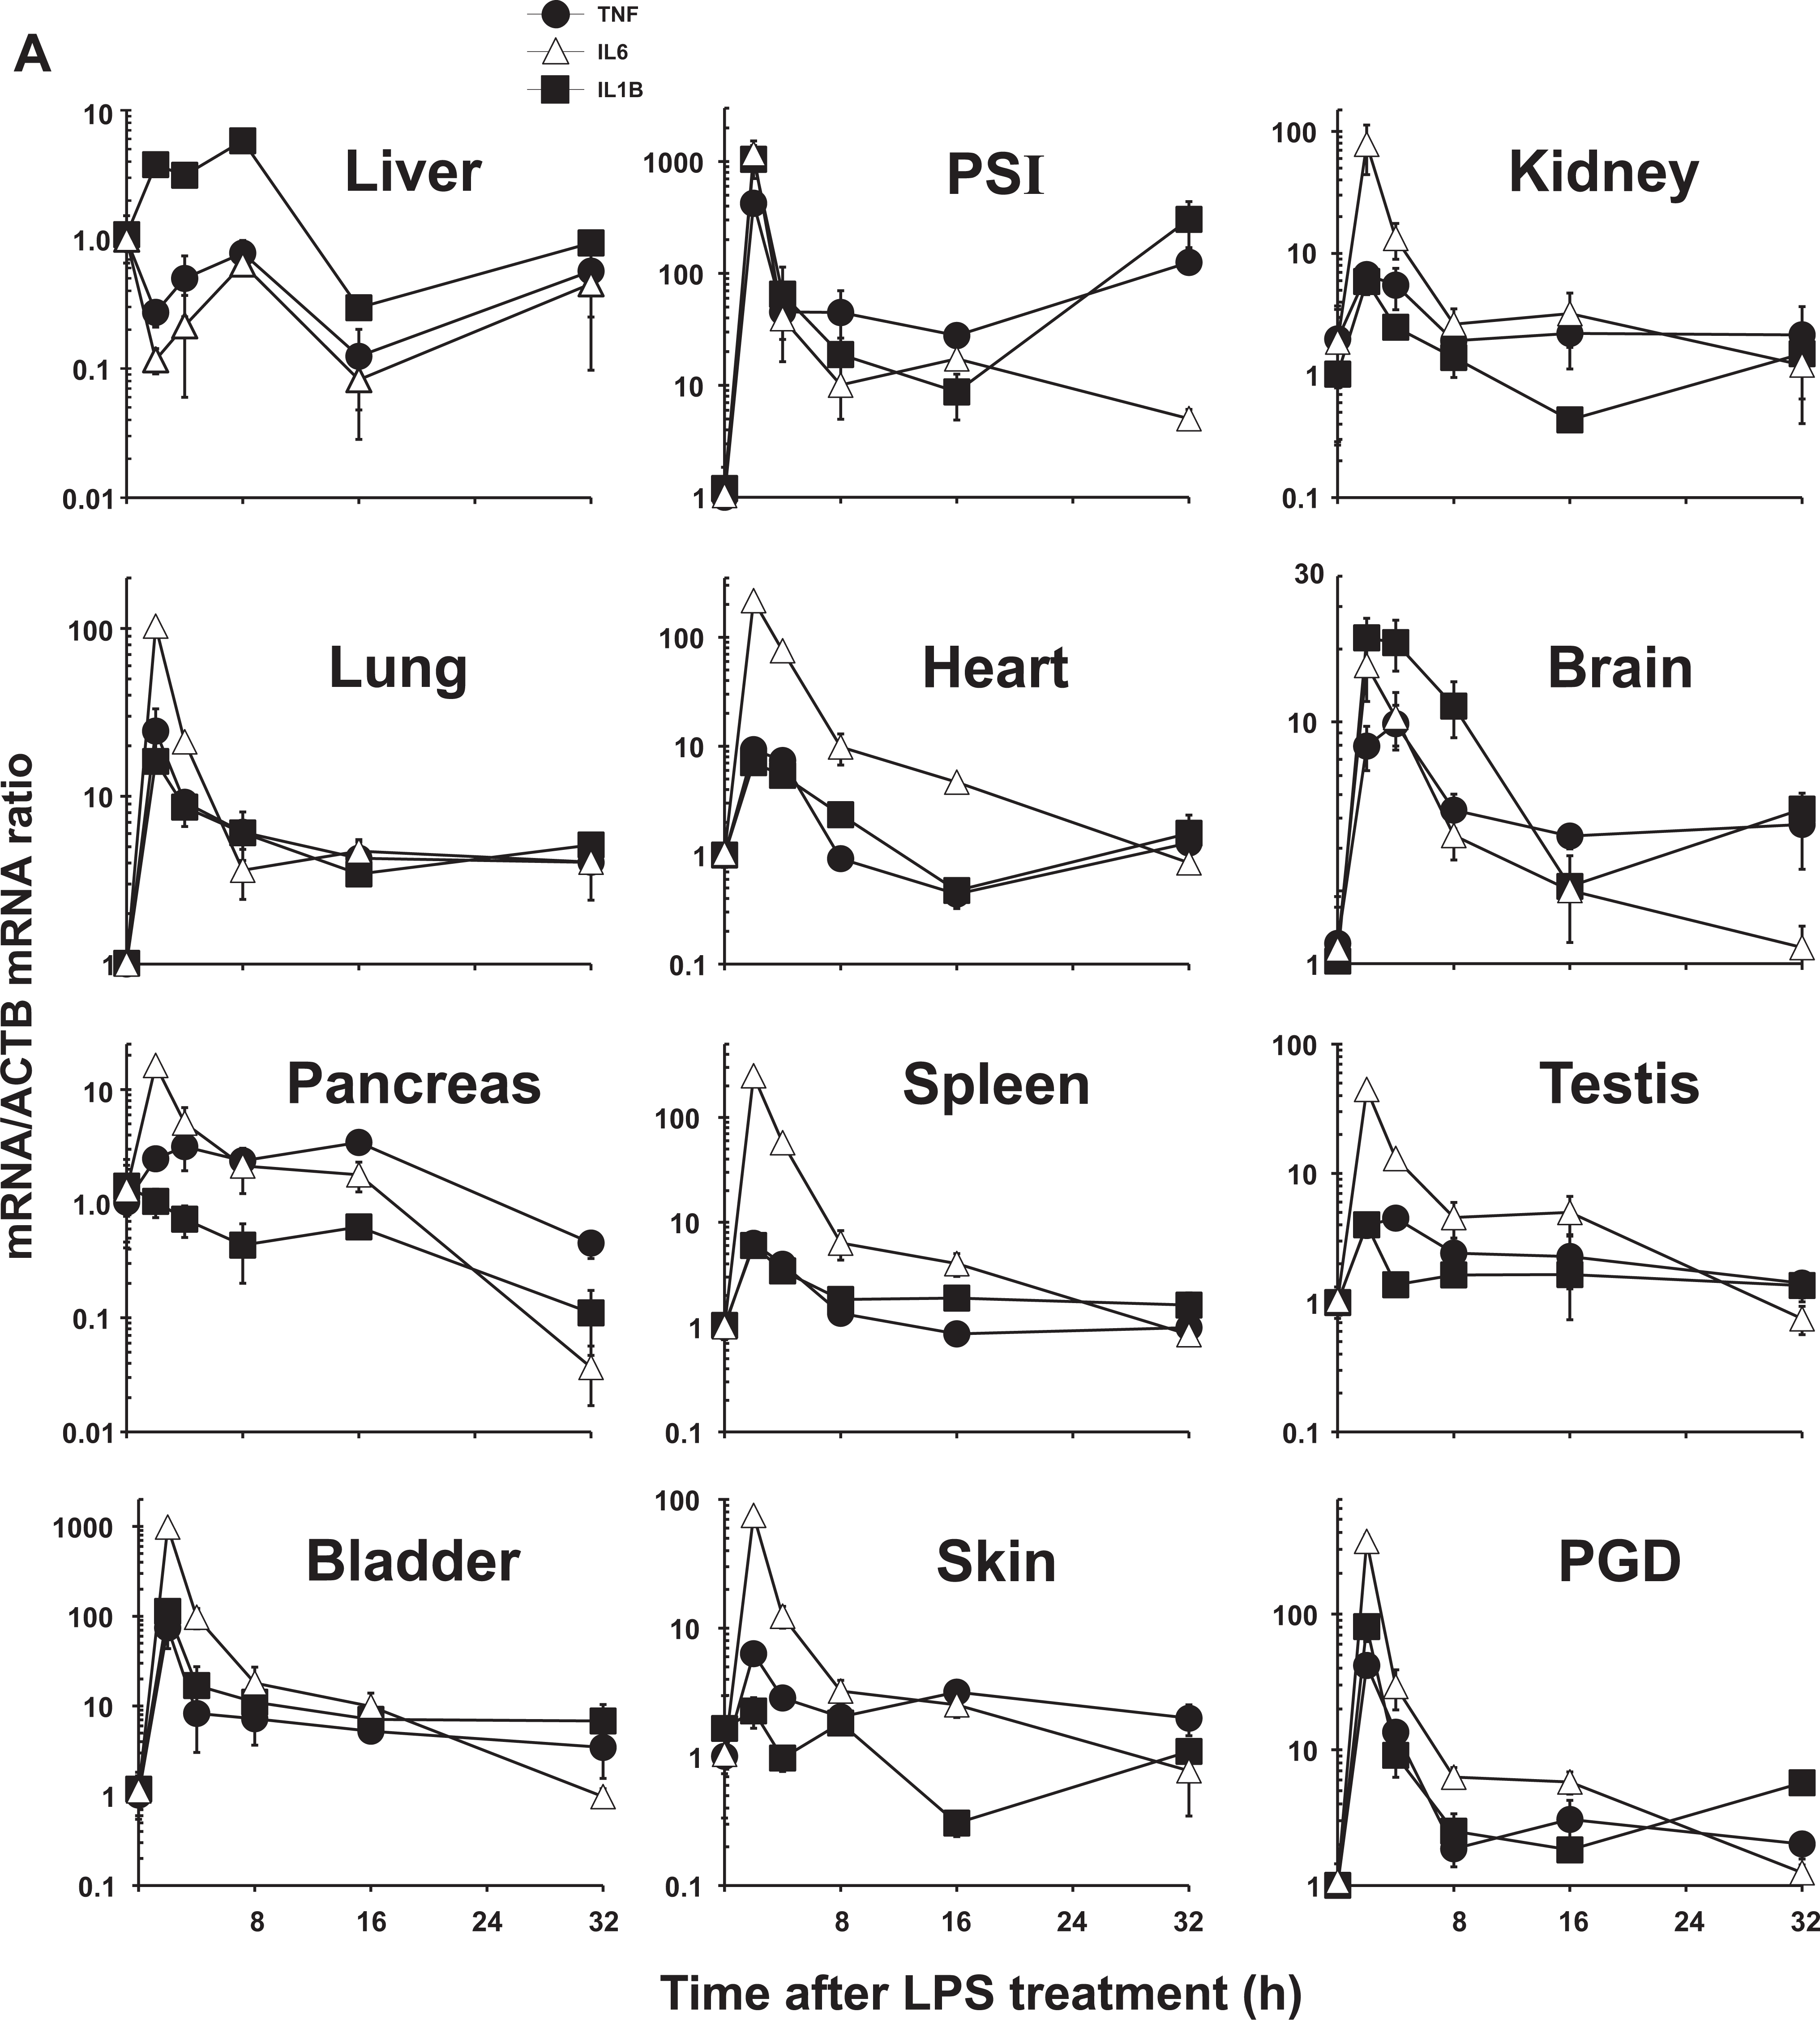
Relative cytokine mRNA levels in mice following treatment with LPS, TNF, or IL6. The same mice shown in Figure 1 were used to address the correlation between ZIP mRNA and cytokine mRNA levels. TNF mRNA (closed circles, •), IL6 mRNA (open triangles, ▵), and IL1B mRNA (closed squares, □). Results were again normalized using the nontreated mRNA/β-actin (ACTB) mRNA ratio. Note the 2- to ∼1000-fold differences in values on the ordinates; whereas, Figure 1 data were plotted on a linear scale; the data in this figure are plotted on a logarithmic scale. Statistical analysis is included in Supplementary Table S1. A, LPS treatment. B, TNF treatment. C, IL6 treatment. IL6 indicates interleukin-6; LPS, lipopolysaccharide; mRNA, messenger RNA; TNF, tumor necrosis factor.
Tumor necrosis factor treatment
The levels of TNF-induced TNF mRNA were greatest in PGD at 4 and 8 hours, next highest in pancreas at 8 and 16 hours, and smaller increases in PSI at 4 and 16 hours and in liver at 4 hours (Figure 2B; Table 2; Supplementary Table S1.B). The TNF-mediated induction of IL6 mRNA was significantly highest in PGD at 4 and 8 hours, in PSI at 2 and 4 hours, and in pancreas at 8 and 16 hours. Significant IL6 mRNA induction was also seen in skin and bladder at 2 hours and in heart at 8 hours. Induction of IL1B mRNA after TNF was highest in pancreas throughout the 32-hour experiment and in skin and bladder at the 2-hour time point. Significant downregulation by TNF was found only for IL6 mRNA in liver at 2 hours, kidney at 4 hours, lung at 2 and 32 hours, and spleen at 2 and 4 hours and for IL1B mRNA in lung at 32 hours and brain at the 8-hour time point.
Interleukin-6 treatment
The levels of TNF mRNA following IL6 administration were not significantly upregulated in any of the 12 tissues––except for small increases in pancreas and skin at early time points (Figure 2C; Table 3; Supplementary Table S1.C). The IL6-induced IL6 mRNA was significantly increased only in skin at 4 hours. The IL6-stimulated IL1B mRNA levels were highest in pancreas at 2 and 4 hours, which persisted throughout the 16-hour experiment. Induction of IL1B mRNA by IL6 was also significantly increased in bladder at 2 hours. Downregulation by IL6 treatment was found in liver, PSI, and lung––in each case only at the 8-hour time point.
Brain-Specific Differences
Interestingly, in brain, we observed that LPS and TNF but not IL6 enhanced ZIP14B mRNA selectively (Figure 1), and similarly, LPS and TNF but not IL6 altered the proinflammatory cytokine profile (Figure 2). It is well known that the ligand and its corresponding receptor include LPS and toll receptor 4; TNF and TNF receptor; and IL6 and IL6 receptor. Of what relevance might this be in brain?
Fever reflects a multiphasic response (elevation and decline in the body core temperature) that is regulated by central thermoregulatory mechanisms localized to the preoptic area of hypothalamus. Several proinflammatory cytokines including TNF and IL6 act as endogenous pyrogens, whereas other cytokines can act as antipyretic agents; these findings confirm the link between the immune and the central nervous systems. 27 Cytokine levels in serum and cerebral spinal fluid are associated with fever. In the brain, presence of specific cytokine receptors on various cell types––and the effects of pharmacological application of cytokines and of their neutralizing antibodies––are known to alter the fever response via eicosanoid and other second-messenger lipid mediators 28,29 ; these findings are supported by cytokine- and cytokine receptor transgenic mouse models. 27
Overall, data in the present study imply that tissues have different levels of responsiveness to ligands probably as a result of the receptors to which they specifically bind; moreover, ZIP14B is likely to be transcriptionally regulated in a manner differently from ZIP14A, perhaps at the spliceosome level as had been previously suggested by observed differences in tissue-specific regulation of ZIP14B versus ZIP14A. 7,8 Further investigations––using chromatin immunoprecipitation and electrophoretic mobility shift assays and reporter genes, which has been previously done for ZIP8 24 ––will be required to tease out regulatory differences between ZIP14B and ZIP14A. It is exciting to speculate that ZIP14B versus ZIP14A expression might be triggered by tissue- and cell type-specific cytokines and lipid mediators.
Conclusions
The LPS-, TNF-, and IL6-mediated induction of ZIP8, ZIP14A, and ZIP14B mRNA levels, as well as stimulation of the inflammatory cytokine TNF, IL6, and IL1B mRNA levels, was found to be extremely variable depending on the inflammatory stressor given, quantitatively very different, highly tissue-specific, and also markedly time dependent. It is also worth noting that expression of ZIP14A versus ZIP14B mRNA concentrations varied widely among the different treatments, tissues, and time points––providing further evidence that these 2 splice variants from the same gene must be associated with distinct functions in each cell type. 7,8
In summary, these data suggest that all these tissues likely use ZIP8 and ZIP14 transporters for Zn2+ uptake––some tissues without cytokine treatment, others moreso when inflammatory danger (cytokine treatment) is present. Collectively, inflammatory-stimulated alterations in ZIP8-, ZIP14A-, and ZIP14B-mediated transporter expression levels would probably lead to substantial decreases in plasma Zn2+ concentrations, due to the redistribution of Zn2+ not just in liver but across most vital organs. An extension of the present study would be to precisely measure intracellular Zn2+ levels at all time points following LPS, TNF, or IL6 treatment and in all 12 tissues. It seems intuitive that all major organs would require Zn2+ uptake, to varying degrees, in response to conditions of stress such as cytokine exposure. In the context of Cd2+-mediated (or other toxic environmental metal mediated) toxicity, this opens the door for studying pathogenesis across a broad range of tissues, beyond simply kidney or lung.
Footnotes
Acknowledgments
We thank our colleagues, especially Lei He, for valuable discussions and careful reading of this article. We are grateful to Dr Marian Miller for excellent help with graphics. We thank Cynthia M. Williams for technical help.
Author’s Note
Marina Gálvez-Peralta and Zhifang Wang should be considered as equal first authors.
Declaration of Conflicting Interests
The author(s) declared no potential conflicts of interest with respect to the research, authorship, and/or publication of this article.
Funding
The author(s) disclosed receipt of the following financial support for the research, authorship, and/or publication of this article: This work was funded, in part, by NIH R01 HL118268 (DLK), R01 ES010416 (DWN), T32 ES016646 (MG-P), and P30 ES06096 (DWN).