
Abstract
Exposure to environmental contaminants induces the activation of cytochrome P450s (CYP) which lead to the hydroxylation of contaminants and endogenous hormones such as estrogens. The hydroxylation of estrogens forms catecholestrogens (CEs), one of them being the mutagenic 4-hydroxyestradiol-17β (4−OH−E2). Catecholestrogens are transformed by catechol-o-methyltransferases (COMTs) into nonreactive methoxyestrogens. To investigate the hepatic metabolism of estradiol-17β in female offspring at postnatal day (PND) 21, pregnant rats were dosed daily from gestation day 1 until PND 21 with 2 dose levels of organochlorine pesticides (OCPs; 0.019 or 1.9 mg/kg per d), methylmercury (MeHg; 0.02 or 2 mg/kg per d), polychlorinated biphenyls (PCBs; 0.011 or 1.1 mg/kg per d), or a mixture (M; 0.05 or 5 mg/kg per d) including all 3 groups of chemicals. Concentrations of organochlorines in the mixture M were based on their proportions in serum of the Canadian Arctic population. The messenger RNA (mRNA) expressions of CYP and COMT were analyzed by quantitative reverse transcriptase–polymerase chain reaction (qRT-PCR). High-performance thin layer chromatography and phosphor imaging were used to measure the transformation of 14C substrates into estrogen metabolites. The low-dose treatments or the MeHg groups had no effect. The high-dose OCP, PCB, and M group increased the production of 2-OH-E2 and 6α-OH-E2, while only the PCB and M groups increased the 2-OH-CE/methoxyestrogen ratio. In all groups, the cytosolic COMT activity exceeded the microsomal production rate of 4-OH-E2. Although the M treatment included the PCB and OCP mixtures, it did not modify the estrogen metabolism more than did the PCB mixture alone. This endocrine disruption information contributes to our understanding of chemical interactions in the toxicology of chemical mixtures.
Introduction
Organochlorines include large classes of ubiquitous chemicals such as polychlorinated biphenyls (PCBs) and organochlorine pesticides (OCPs). Through life, some of these chemicals accumulate in the human body and reach concentrations measurable in human blood and breast milk. 1 –3 These persistent chemicals are in higher concentrations in human samples from populations of circumpolar regions. 4,5 Northern populations are also more exposed to methylmercury (MeHg) than Southern populations, given that this metal is present in fish that are part of Northern traditional diet. 6 The accumulated body burden of these chemicals, which can be transferred to the children through the womb and breast milk, raises the need to investigate their potential health effects.
The liver, by the activity of phase I and phase II detoxification enzymes, transforms environmental contaminants into metabolites excretable through fecal or urinary pathways. The cytochrome P450 (CYP) hydroxylase enzymes are detoxification phase I enzymes induced by environmental chemicals through binding the aryl hydrocarbon receptor or other nuclear receptor systems (eg, constitutive androstane receptor [CAR], pregnane X receptor [PXR], retinoid X receptor [RXR], peroxisome proliferator-activated receptor alpha [PPARα]). 7 The activity of these CYP hydroxylase enzymes is not specific; and in addition to xenobiotic transformation, they also metabolize endogenous hormones, such as estrogens. 8,9
Imbalance in estrogen metabolism and signaling can adversely affect the functions of estrogen target tissues and be involved in various diseases (eg, endometriosis, osteoporosis, atherosclerosis) and cancers (breast, endometrium, ovary, prostate, liver, kidney, lung, and brain). 10 –16 The most active estrogen, estradiol-17β, is considered a full carcinogen acting at all stages of carcinogenesis (initiation, promotion, and progression). Two pathways are responsible for the carcinogenic effects of estrogens. 12,17 The first is the estrogen receptor (ER)-mediated pathway stimulating cell division and proliferation of cells bearing mutations. Interactions of various chemicals with the ER leading to estrogenic 18 and antiestrogenic 19 effects have been reported. The second pathway is the non-ER-mediated pathway involving an imbalanced metabolism of estrogens leading to the production of estrogens hydroxylated on carbon (C)-16α and the production of catecholestrogens (CEs), which are estrogens hydroxylated in position C2 (2-OH-E2) or C4 (4-OH-E2; Figure 1). Oxidation of 4-OH-E2 induces the formation of the CE-3,4-quinones which can react with DNA and form depurinating estrogen–guanine and adenine DNA adducts and mutations. Estrogen quinones can be back converted to CE which involves redox cycling, generation of oxygen free radicals, and DNA damage. 20,21 This imbalance in estrogen metabolism is due to tissue-specific excess activities of hydroxylase (CYP families) not compensated by phase II detoxification enzymes (eg, catechol-o-methyltransferases [COMTs], quinone oxidoreductases, glutathione S-transferase P1, glucuronosyl transferases, sulfotransferases). A major mechanism for deactivating CE (2-OH-E2, 4-OH-E2) is the methylation of the CE by the enzyme COMT, which exists as a membrane bound (mb) and soluble (s) form. 22 For example, the methylation of 2-OH-E2 by COMT produces 2-methoxy-estradiol-17β (2-Me-E2). 2-Methoxy-estradiol-17β is a major estrogen metabolite with no estrogenic activities 23 ; it has antioxidant, antiangiogenic, and proapoptotic (inhibit microtubule polymerization) properties protective against tumor progression 24 –27 and has beneficial effects for the renal 28 and cardiovascular system. 29,30
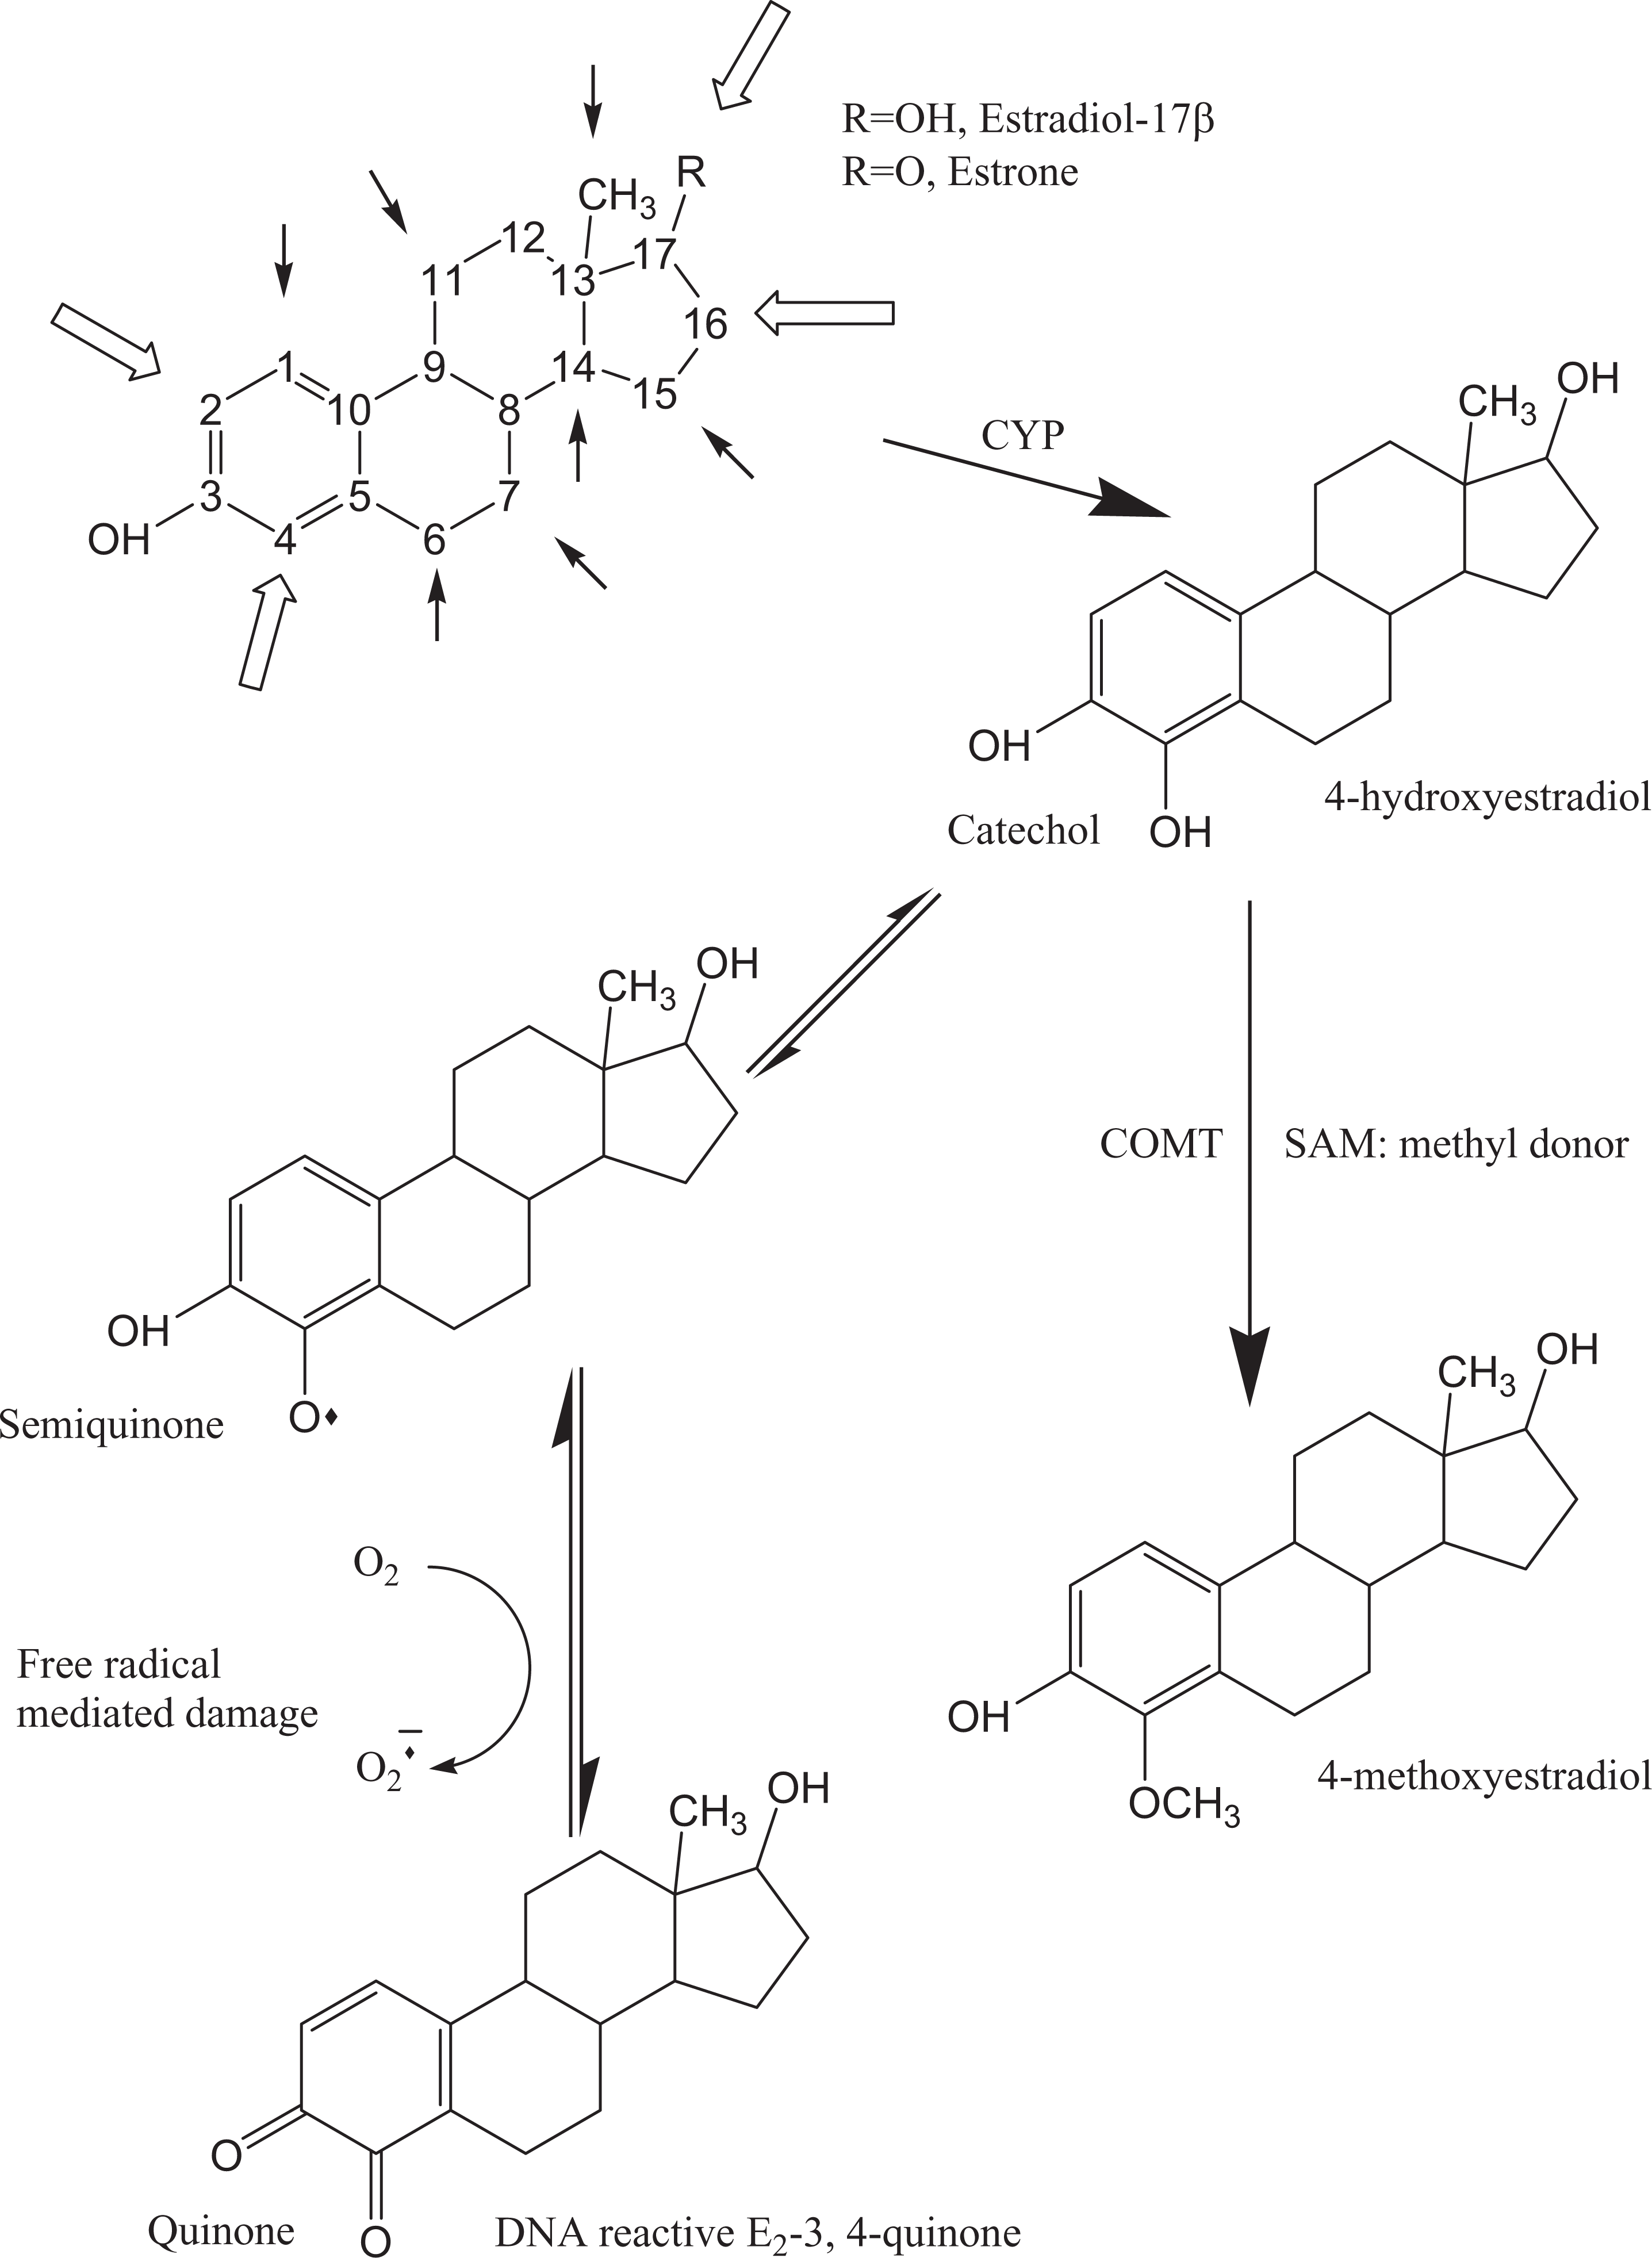
Schematic representation of the reactive sites on the estrogen molecule. The estrogen parent molecule has 18 carbons with numerous sites of oxidative metabolism (small arrows) by NADPH-dependent cytochrome P450 enzymes (CYP). Important sites of hepatic transformation are shown with the open arrows. As an example, this figure illustrates CYP-mediated formation of the catecholestrogen 4-hydroxyestradiol, then its transformation into 4-methoxyestradiol by the catechol-o-methyltransferase (COMT) catalyzing the transfer of a methyl group received from the universal methyl donor S-adenosylmethionine (SAM). Alternatively, the catechol moiety of catecholestrogens can form semiquinone, undergo metabolic redox cycling, and generate free radical–mediated damage on macromolecules (DNA, proteins, lipids). The estrogen-3, 4-quinones have greater ability to form estrogen-DNA adducts compared to estrogen-2, 3-quinones originating from 2-OH-E2. Adapted from 2 reviews 12,16 .
The liver is the major organ regulating the biotransformation of estrogens for their elimination. In addition, the liver is a nontraditional estrogen target where estrogens play beneficial roles in hepatic injury repair, diseases, and cancers 31,32 and modulate hepatic gene expression during development and adulthood. 33 Exposures to environmental pollutants, such as organochlorines and pesticides, have been shown to increase CYP activities and to disrupt the normal estrogen metabolism pathway in rodent livers 34 –38 and in human breast cancer cells. 39 –41 In addition to increasing CYP activities, metabolites of PCB are suspected of preventing the inactivation of CE by COMT in the rat. 35 Long-term exposure to PCBs was demonstrated to be hepatocarcinogenic in female rats and is suspected to be hepatocarcinogenic in women. 42
There is a lack of information about the effects of the complex mixture of environmental contaminants detected in human tissues. The objective of the current study conducted in Sprague Dawley rats was to test the effects of developmental exposure to a complex mixture of human blood contaminants on the hepatic transformation of estrogens in female offspring at postnatal day (PND) 21. The effects of MeHg, PCB, and OCP administered either separately or as part of a complex mixture “M” were compared. The activity of microsomal hydroxylase enzymes was monitored by studying the transformation of
14
C-E2 into radioactive estrogen metabolites, while the methylation activity of cytosolic COMT was investigated by monitoring the transfer of
14
C from S-adenosyl-
Materials and Methods
Chemicals and Reagents
Fifteen estrogens (Estrone [E1], estradiol-17β [E2], 16α-hydroxyestradiol [16α-OH-E2 or estriol], 2-hydroxyestradiol [2-OH-E2], 4-hydroxyestradiol [4-OH-E2], 2-hydroxyestrone [2-OH-E1], 4-hydroxyestrone [4-OH-E1], 16α-hydroxyestrone [16α-OH-E1], 6α-hydroxyestradiol [6α-OH-E2], 2-methoxyestradiol [2-Me-E2], 4-methoxyestradiol [4-Me-E2], 2-methoxyestrone [2-Me-E1], 4-methoxyestrone [4-Me-E1], 2-hydroxy-3-methoxyestradiol [2-OH-3-Me-E2], 3-methoxy-4-hydroxyestradiol [3-Me-4-OH-E2]) were purchased from Steraloids, Inc (Newport, Rhode Island). 17β-Estradiol (E2), reduced nicotinamide adenine dinucleotide phosphate (β-NADPH) tetrasodium salt, and S-adenosyl-
Animal Treatment
Animal manipulation, housing conditions, and preparation of the mixtures were previously described. 43,44 Briefly, the mixtures of environmental contaminants were prepared in corn oil (Table 1) based on the relative proportion of PCB and OCP found in the serum of Inuit from the Canadian Arctic. Methylmercury was also added, given that this metal is present in fish that are part of Northern traditional diet. 6 Adult female Sprague-Dawley rats were mated and upon detection of vaginal plug or sperms in vaginal smear, the chemical treatments were initiated and continued until weaning so that the pups were exposed in utero and through lactation. A measured volume of the dosing solution was adjusted daily for the dam body weight and applied onto a small cookie that was consumed by the dam each day. The experiment included 9 treatment groups. The control group received corn oil as vehicle, 2 groups received OCPs (12 chemicals) at either 0.019 or 1.9 mg/kg per d, 2 groups received MeHg chloride at either 0.02 or 2 mg/kg per d, 2 groups received PCBs (14 congeners) at 0.011 or 1.1 mg/kg per d, and 2 groups received the complete mixture (M) including all these previous chemicals for a total dose of 0.05 or 5 mg/kg per d. The current investigation was performed using samples from 2 experiments designed for neurotoxicity projects. In the first experiment, pups were sacrificed at PND 21, a period associated with maximal exposure to chemicals through lactation. In the second experiment, pups were weaned at PND 22, and the female offspring (1 per litter) were sacrificed at PND 29 for messenger RNA (mRNA) analysis. Post natal day 29 was selected for practical reasons to accommodate neurobehavioral testing following weaning and also because it is near the full development of neurochemical systems (eg, dopaminergic system 46 ). One female per litter was euthanized at both time points. The livers were collected and stored at –80°C. Experimental protocols were approved by the Health Canada Animal Care Committee in accordance with the Canadian Council on Animal Care guidelines. 47
Chemical Composition of the High-Dose Treatmentsa
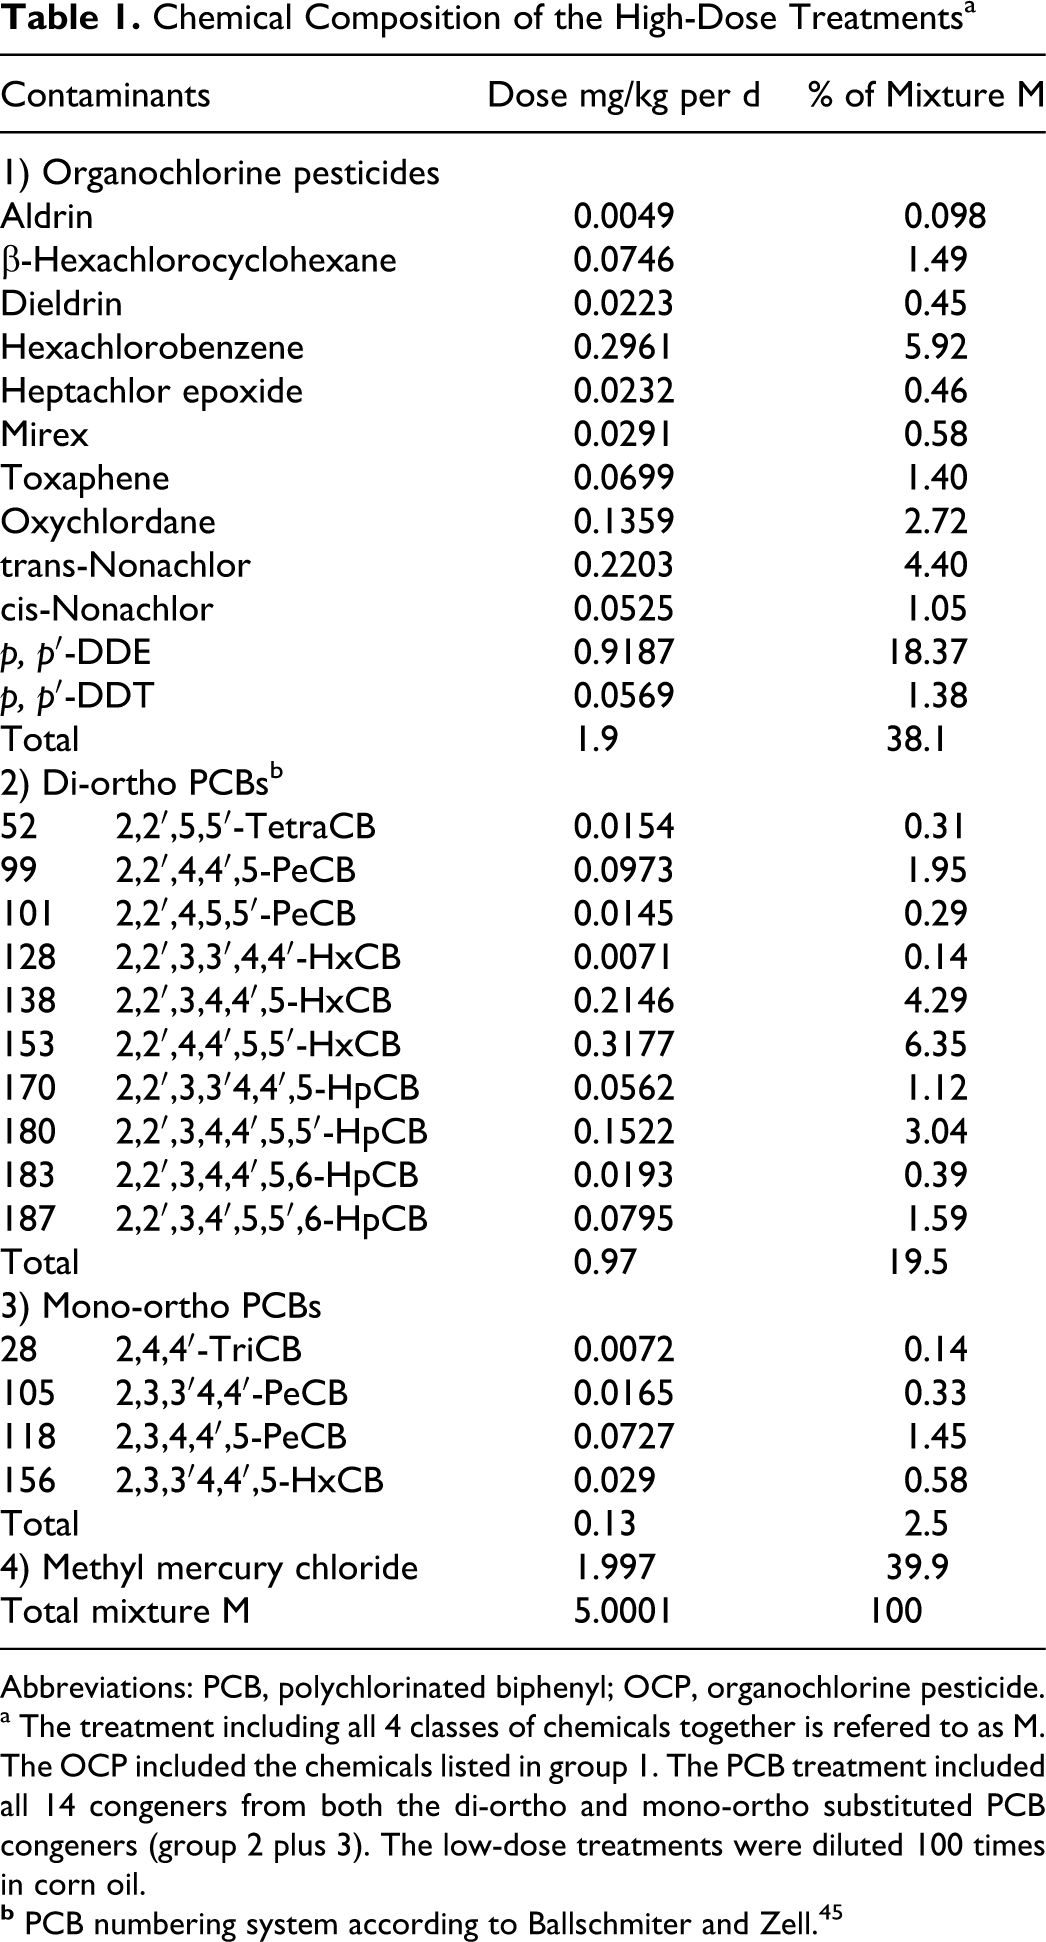
Abbreviations: PCB, polychlorinated biphenyl; OCP, organochlorine pesticide.
a The treatment including all 4 classes of chemicals together is refered to as M. The OCP included the chemicals listed in group 1. The PCB treatment included all 14 congeners from both the di-ortho and mono-ortho substituted PCB congeners (group 2 plus 3). The low-dose treatments were diluted 100 times in corn oil.
Messenger RNA Analysis by Real-Time Reverse Transcriptase–Polymerase Chain Reaction
Total RNA was isolated and purified using the RNeasy mini kit and RNase-free DNase set (Qiagen, Mississauga, Ontario). The Qiagen Omniscript RT kit was used for reverse transcription (RT) reaction. Complementary DNAs (cDNAs) were amplified by quantitative real-time polymerase chain reaction (PCR) on a BioRad iCycler PCR machine (Bio-Rad Laboratories, Mississauga, Ontario), using QuantiTect SYBR Green PCR Master Mix (Qiagen), RT products, and primers. The PCR primers were designed using Beacon Designer 2.0 (Primer Biosoft, Palo Alto, California) and NCBI published rat gene sequences using locus U09742 for Cyp3A2, NM 031144 for β-actin, U09540 for Cyp1B1, RATCYP450-J00719 for Cyp2B1, NM_012531 for Comts, and X61098 for ERα. The forward and reverse primers were 5′-CAATGAGCTGCGTGTGGC-3′ and 5′-GGGTCATCTTTTCACGGTTGG-3′ for β-actin, 5′-GCGGCGTCTGTTGGC-3′ and 5′-CCTGATGGATGGCACTCTC-3′ for Cyp1B1, 5′-TGATCTTTGCCAATGGGGAAC-3′ and 5′-CCGTTCTTCCACACTCCTCT-3′ for Cyp2B1, 5′-TTCAGCTCTCACACTGGAA-3′ and 5′-AAAGGCAGAGGTTTTGGC-3′ for Cyp3A2, 5′-GCCAGGCTTCTCACCATG-3′ and 5′-CGTCGTACTTCTTCTTCAGCT-3′ for Comt (s+mb)], and 5′-CTCATTGGGTCTCCTGTTGTTG-3′ and 5′-AGGTTGTGGACTGGCTGC-3′ for Comt (mb), 5′-GCGCCGCCTACGAGTTCA-3′ and 5′-GACCGTAAGTGATGCTCGACTG-3′for ERα. Agarose gels were used to verify that a single product of the expected size was generated by each primer set. The amount of mRNA was calculated for each sample (analyzed in duplicates) based on a calibration curve included in each plate and the results were normalized to the abundance of β-actin mRNA in each sample. Two assays were required to analyze all samples; the first assay compared control rats to low-dose groups, the second assay included again the same control rat in addition to the high-dose groups. The results are reported as percentages to the control group.
Separation of Hepatic Microsomal and Cytosolic Fractions
The CYP enzymes inducing the hydroxylation of estrogen molecules are found mostly in the microsomal fraction. The COMT enzyme responsible for the transformation of hydroxylated estrogens into methoxyestrogens exists under 2 forms originating from 2 promoters on the same gene. The shorter soluble form is present in the cytosol and is responsible for most of the hepatic COMT activity. The longer microsomal membrane-bound form has lower activity. 48,49 The enzyme activity of COMT was measured here from the cytosolic fraction. All procedures were performed at 4°C. Each liver sample (approximately 1 g) was homogenized in 4 parts (w:v) of Tris buffer 1 (0.05 mol/L Tris, 0.15 mol/L KCl, pH 7.4, 5 mmol/L ascorbic acid, 0.1 mmol/L EDTA) and then centrifuged (10 000g, 20 minutes, 4°C). The supernatant was further centrifuged (176 000g max, 1 hour, 4°C) to separate the cytosol and microsomes. Tris buffer 1 (0.5 mL) was added to the microsomal pellet and the sample was resuspended using a sonicator. Protein contents of the microsomal and cytosolic samples were determined using the Bio-Rad Protein Assay (Bio-Rad Laboratories, Hercules, California) with a standard curve of bovine serum albumin (50-800 ug/mL). Microsomal samples were used immediately for the E2 metabolism procedure and the cytosol preparations were frozen at −80°C until ready to assay.
Microsomal Metabolism of E2
Liver microsomes (one mg protein) were preincubated with Tris buffer 1 in a shaking water bath at 37°C for 5 minutes, then 20 μL of ethanol containing 50 μmol/L of E2 including 0.1 μCi of purified [4- 14 C] E2 was added followed by 0.1 ml of 0.25 mmol/L NADPH to initiate the enzymatic reaction. The total incubation volume was 1 mL. For the negative control, heat-inactivated samples were prepared by boiling control microsomes for 5 minutes. After 30 minutes of gentle shaking at 37°C, the reaction was terminated by transferring the tubes into ice-cold water and then 1 mL of cold methanol containing 5 mmol/L ascorbic acid and 1.5 μg/mL of each estrogen standards, to provide chromatographic markers, were added to every tube. Tubes were centrifuged (3000g, 15 minutes) and the supernatants were extracted using Oasis HLB 3cc/60 mg columns. The supernatant was applied to a column preconditioned with 2 mL methanol and 2 mL of methanol–water (1:1), washed with 1 mL of methanol:water (1:1), and eluted with 2 mL of methanol. The methanol was evaporated using a Speed Vac (ThermoSavant, Holbrook, New York), and the residue was resuspended in 20 μL of chloroform–methanol (1:1 v/v) for high-performance thin layer chromatography (HP-TLC) application. These incubation conditions provided linearity for the extent of E2 metabolism versus time (5-30 minutes) and the amount of proteins (0.125-2 mg). At the final selected assay conditions (30 minutes, 1 mg protein), less than 10% of the radioactive substrate was metabolized.
Cytosolic Metabolism of 2-OH-E2 and 4-OH-E2 by COMT
To assess COMT activity, the hepatic cytosol fraction (1 mg of protein) was preincubated with Tris buffer 2 (0.05 mol/L Tris-HCl, 0.15 mol/L KCl, pH 8.0, 2 mmol/L MgCl2, 1 mmol/L dithiothreitol) in a shaking water bath at 37°C for 5 minutes; 20 μL of 1.25 mmol/L 2-OH-E2 or 4-OH-E2 in ethanol was added (2 separate incubations) followed by 0.1 mL of 0.6 mmol/L S-adenosylmethionine (SAM; 0.1 uCi of [ 14 C-methyl]) in Tris buffer 2 to start the reaction. The total incubation volume was 1 mL. For the negative control, heat-inactivated samples were prepared by boiling control cytosol for 5 minutes. After 20 minutes, the tubes were transferred to an ice water bath and 1 ml of cold methanol containing standards, 3.0 ug/mL of each, to provide chromatographic markers, was added to each tube. Samples were centrifuged (3000g, 15 minutes, 4°C), and the supernatant was applied to an Oasis HLB 60 mg column and extracted as described above for the microsomal samples. These incubation conditions provided linearity for the extent of 2-OH-E2 and 4-OH-E2 metabolism versus time (5-30 minutes) and protein concentration (0.125-2 mg). A 20-minute incubation with 1 mg protein was chosen for the final assay conditions.
High-Performance Thin Layer Chromatography and Phosphorimaging Analysis
Each sample was analyzed on HP-TLC plates (Merck HP-TLC Silica Gel 60, Whatman Int. Ltd, Maidstone, England). Radioactive sample extracts were applied at the origin of the plates, which were developed in a pre-equilibrated chamber using chloroform–acetone (4:1) as the mobile phase, and then allowed to dry in the fume hood. To detect the radioactive spots, the HP-TLC plates were placed in an exposure cassette along with a storage phosphor general purpose (GP) screen (Amersham Biosciences, Piscataway, New Jersey) for 48 hours, then the screen was scanned using a Typhoon Trio+ scanner (Molecular Dynamics, Sunnyvale, California) using a pixel resolution of 100 um.
The identification of the radioactive estrogen metabolites was performed based on the retardation factor values (Rf) of cold estrogen standards. The Rf values calculated for all estrogen standards are equal to the distance traveled by the estrogen divided by the distance traveled by the solvent front. In all experiments, cold estrogen standards were applied to a lane of the same HP-TLC plates used for the radioactive samples, cold standards were visualized by exposing the HP-TLC plate to iodine vapor, and cold standard Rf values were calculated. The spots of radioactive estrogen metabolites detected by the Typhoon scanner were visualized using the ImageQuant TL software (Amersham Biosciences), which was used to calculate their Rf values and to identify the metabolites based on those of the cold standards.
Radioactive spots were quantified using a plate on which a standard curve was generated by applying serial dilutions of purified [4- 14 C] E2. This plate was developed at the same time as the sample plates. The spots of radioactive estrogen on this standard curve plate were detected by the Typhoon scanner, and volume measurements were obtained using the ImageQuant TL software. The amount of radioactivity in each band was obtained by liquid scintillation counting (Beckman LS6500 counter), after scraping off each band from the plate (wetted to prevent dispersion) into scintillation liquid. Standard curves were generated with linear relationship between the volume and dpm measurements for each experiment. Examples of the data used to build a standard curve (Table 2), HP-TLC plates showing the separation of estrogen metabolites produced by microsomal (Figure 2), and cytosolic preparations (Figure 3) are included.
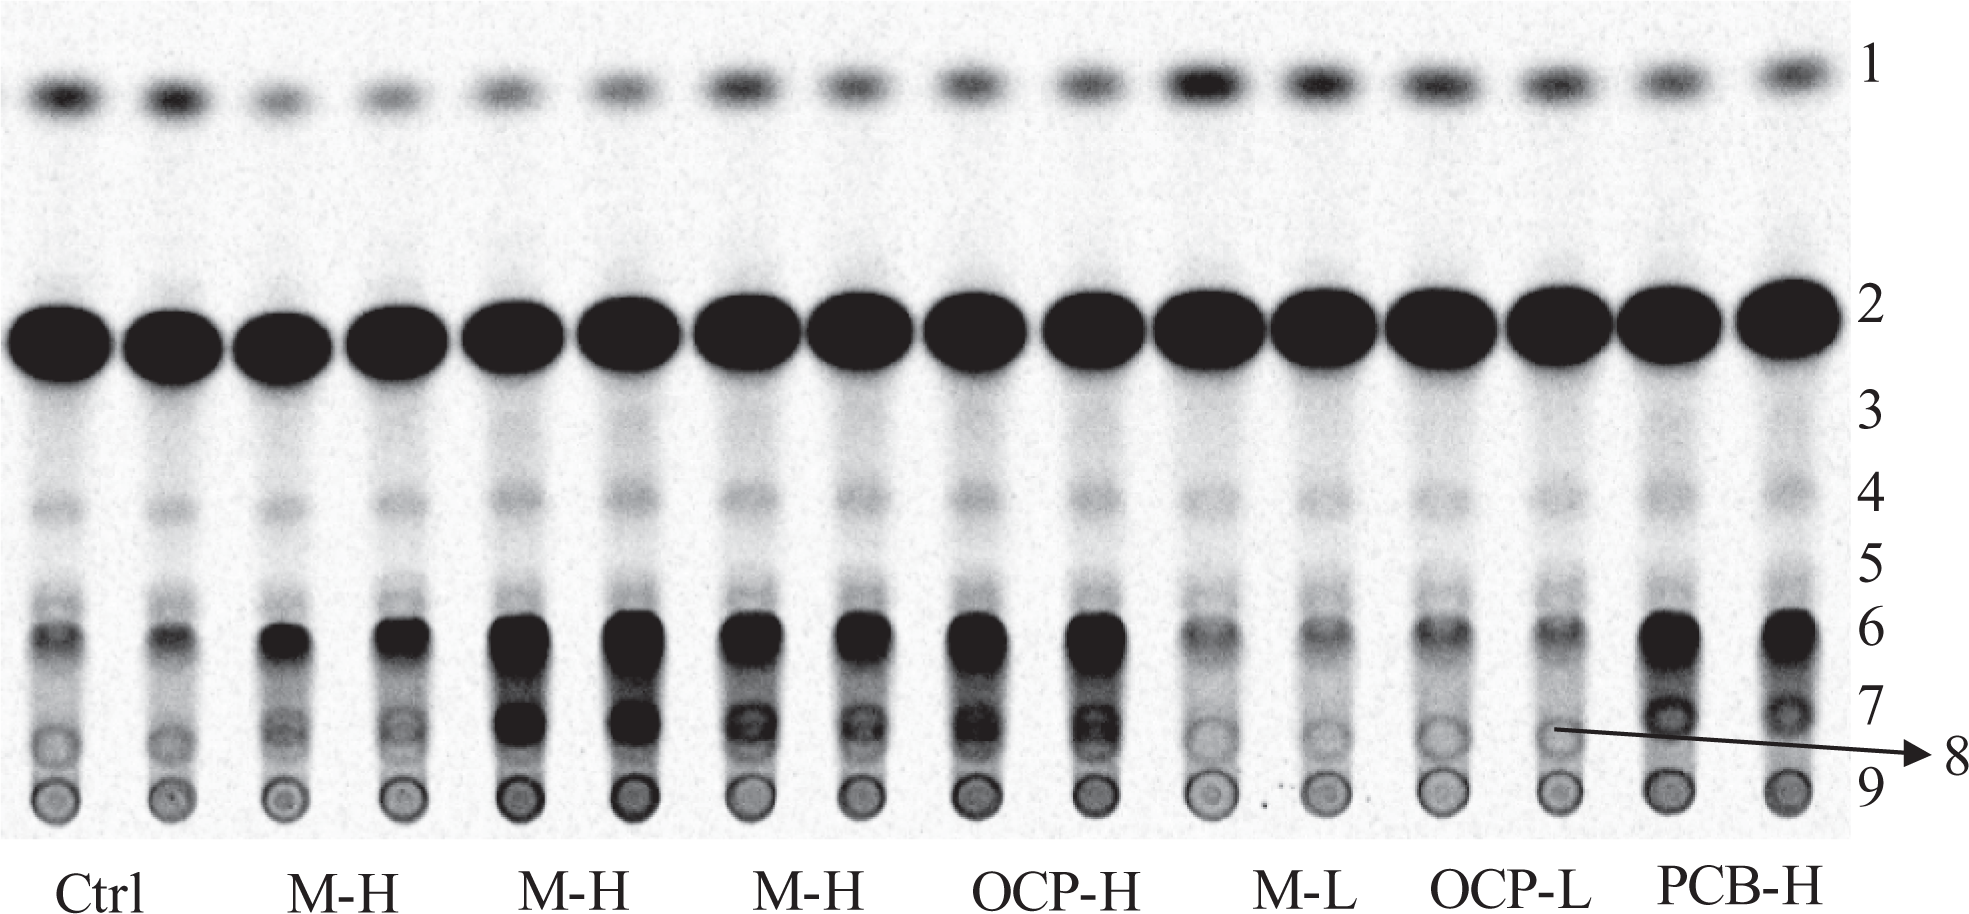
Example of a phosphorimage from an HP-TLC plate showing the separation of radioactive estrogen metabolites formed by 21-day-old female hepatic microsomes (samples are applied in duplicates). This HP-TLC plate shows differences between some control, low-, and high-dose treated rats and interindividual variability among high-dose treated rats. The numbers to the right refer to the following metabolites: (1) E1; (2) residual radioactive E2 substrate; (3) 2-OH-E1, more like a shadow; (4) 4-OH-E2; (5) an unknown metabolite that could not be associated with any of the RF values of the estrogen standards; (6) 2-OH-E2; (7) 6α-OH-E2; (8) E3; and (9) the origin where the samples are deposited on the plate, including radioactive metabolites that did not migrate with the solvent. Note that 6α-OH-E2 and E3 overlapped in some cases preventing absolute quantification. This, however, does not prevent the detection of a treatment effect on the production of 6α-OH-E2, as illustrated here. 2-OH-E1 indicates 2-hydroxyestrone ; HP-TLC, high-performance thin layer chromatography.
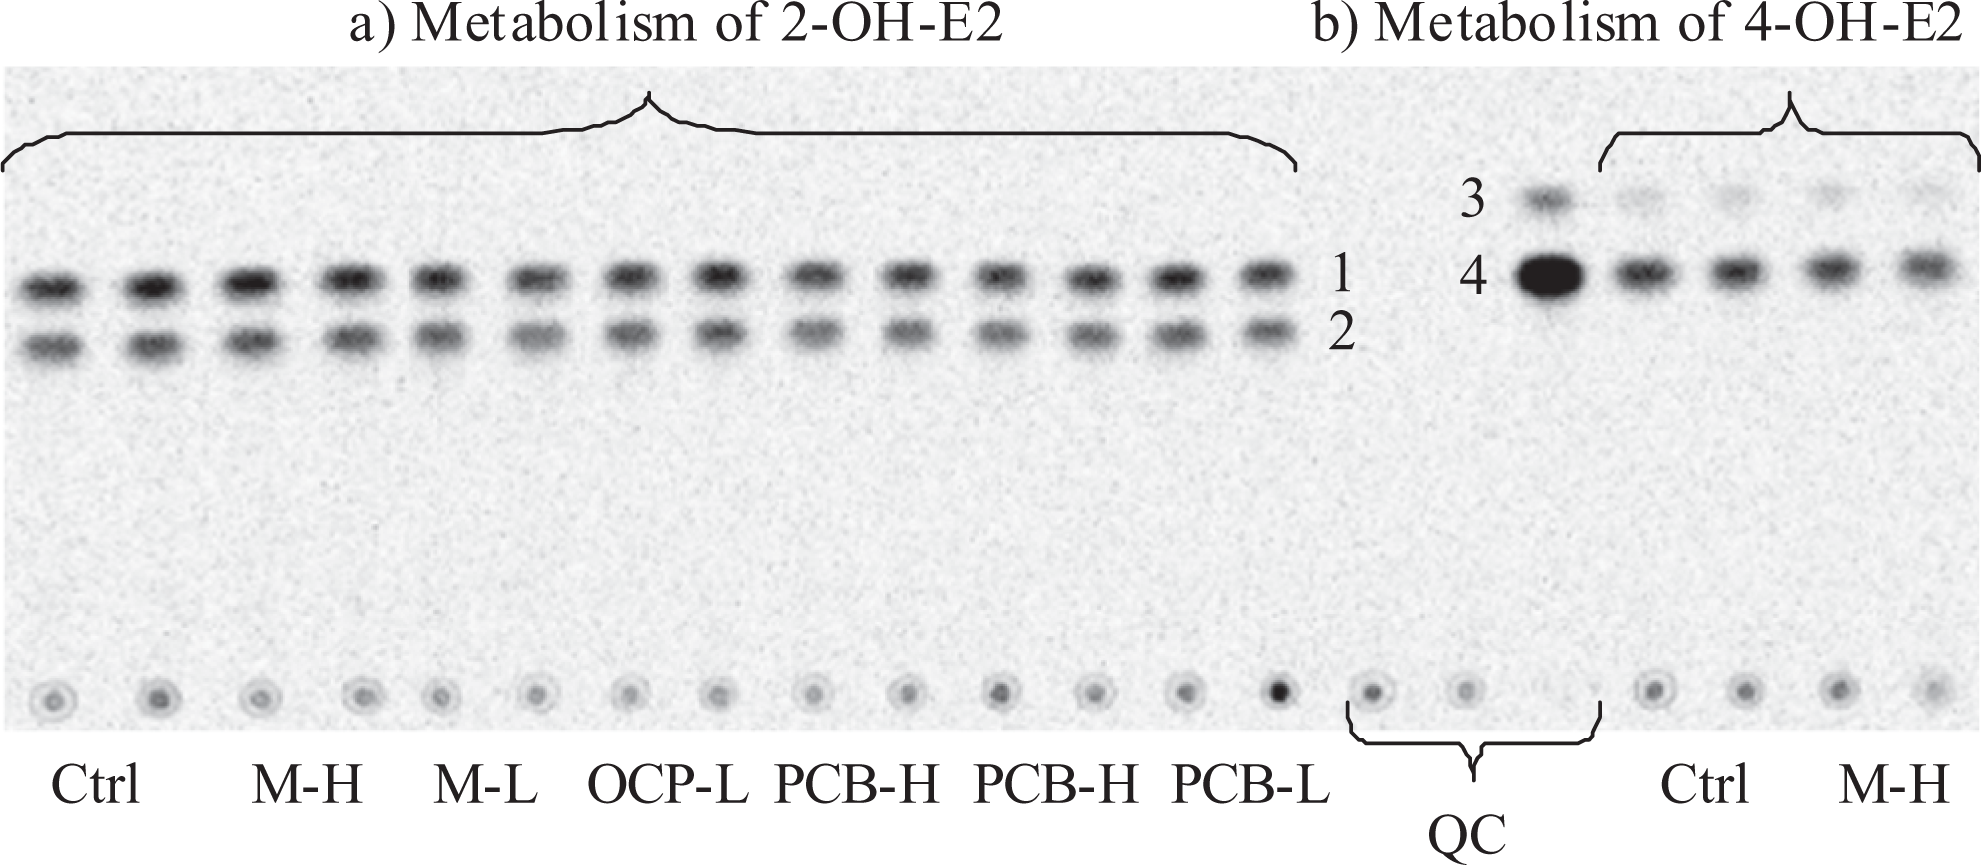
Example of a phosphorimage from an HP-TLC plate showing the separation of radioactive methoxyestrogens produced by cytosolic COMT activity from 21-day-old female livers (samples are applied in duplicates). The metabolic reactions included (A) 2-OH-E2 or (B) 4-OH-E2, as substrate. No statistically significant effect of treatments could be detected. 2-OH-E2 was the preferential substrate of COMT as it can be seen here by the more abundant cumulative metabolites produced from 2-OH-E2 than 4-OH-E2. The numbers refer to (1) 2-Me-E2, (2) 2-OH-3-Me-E2, (3) 3-Me-4-OH-E2, (4) 4-Me-E2. QC: 2 heat-inactivated and one positive quality control. The origin, where the samples are deposited at the bottom of the plate, includes radioactive metabolites that did not migrate with the solvent. 2-OH-E1 indicates 2-hydroxyestrone ; HP-TLC, high-performance thin layer chromatography; COMT, catechol-o-methyltransferase; 2-OH-3-Me-E2, 2-hydroxy-3-methoxyestradiol; 2-Me-E, 2-methoxyestradiol; 3-Me-4-OH-E2, 3-methoxy-4-hydroxyestradiol; 4-Me-E2, 4-methoxyestradiol.
Example of the Data Used to Build a Standard Curve for the Quantification of Estrogen Metabolitesa
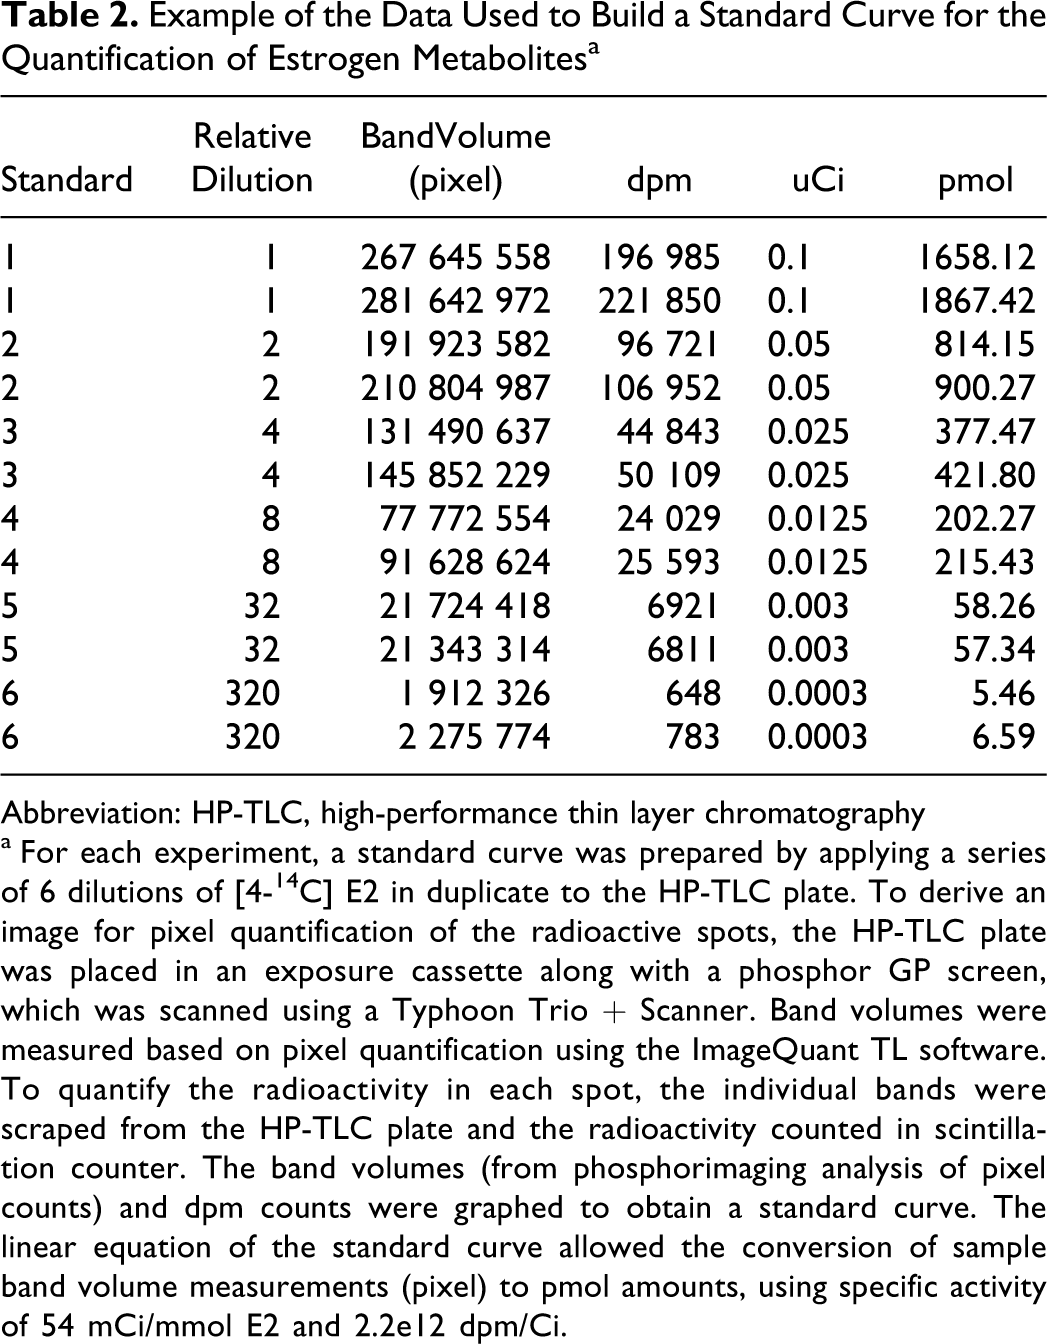
Abbreviation: HP-TLC, high-performance thin layer chromatography
a For each experiment, a standard curve was prepared by applying a series of 6 dilutions of [4- 14 C] E2 in duplicate to the HP-TLC plate. To derive an image for pixel quantification of the radioactive spots, the HP-TLC plate was placed in an exposure cassette along with a phosphor GP screen, which was scanned using a Typhoon Trio + Scanner. Band volumes were measured based on pixel quantification using the ImageQuant TL software. To quantify the radioactivity in each spot, the individual bands were scraped from the HP-TLC plate and the radioactivity counted in scintillation counter. The band volumes (from phosphorimaging analysis of pixel counts) and dpm counts were graphed to obtain a standard curve. The linear equation of the standard curve allowed the conversion of sample band volume measurements (pixel) to pmol amounts, using specific activity of 54 mCi/mmol E2 and 2.2e12 dpm/Ci.
Data Analysis
All analyses were performed using the software JMP (Version 5.0; SAS Institute Inc. Cary, NC). 50 The data were verified for normality using the goodness-of-fit Shapiro-Wilk test and for equality of variance by O′Brien and Brown-Forsythe tests. The data were log transformed if these tests failed. Data that conformed to normality and homogeneity of variance were analyzed using analysis of variance (ANOVA), then, significantly different treatment groups were identified using the Tukey-Kramer HSD test. Otherwise the original data sets were analyzed using the nonparametric Kruskal-Wallis and Wilcoxon rank-sum tests. The data were considered to be significantly different when P ≤ .05.
Results
Hepatic mRNA Analysis
Hepatic CYP mRNA expressions of CYP1A1, 1B1, 2B1 and 3A2 were measured at PND 29. The increases in CYP1A1 mRNA abundance in the current samples have already been published. 51 These data are summarized here again given their importance for the metabolism of estrogens and for comparison with CYP1B1. Briefly, CYP1A1 mRNA abundance in the low-dose groups were significantly increased 2.6, 4.7, and 6.0 times above control in the MeHg-, PCB-, and M-treated rats but were not statistically affected by the OCP treatment. In the high-dose MeHg, OCP, PCB, and M treatment groups, CYP1A1 mRNA abundance was 4, 5, 64, and 158 times above control, respectively. CYP1B1 mRNA abundance was not affected by the low-dose groups, confirming lower response threshold of CYP1A1 in the liver. CYP1B1 mRNA abundance increased 3, 109, and 485 times above control in the high-dose groups treated with OCP, PCB, and M, respectively (Figure 4). As expected the control levels differ between both enzymes (the median constitutive expression for CYP1A1 and CYP1B1 were 2.55 and 0.27 attoM/μg RNA, respectively), and even though the high-dose treatments induced larger fold increases for CYP1B1 than CYP1A1, the abundance of CYP1A1 mRNA was greater than CYP1B1 (CYP1A1, 158-fold increase by M = 403 attoM/μg RNA; CYP1B1, 485-fold increase by M = 131 attoM/μg RNA). The amounts of mRNA for CYP2B1 were 7, 10, and 22 times above control in the the high-dose OCP, PCB, and M treatment groups. There was no significant difference across treatment groups on the mRNA abundance for CYP3A2 (P = .06, log transformed), or for COMT (mb; data not shown). Nonparametric statistical analyses suggest significant increases in COMT (s + mb) mRNA abundance in the high-dose PCB group (Figure 4), and small but statistically significant (P = .008) increase in the expression of ERα only in the high-dose group treated with OCP (control 100 ± 22; low dose 163 ± 24; high dose 269 ± 56).
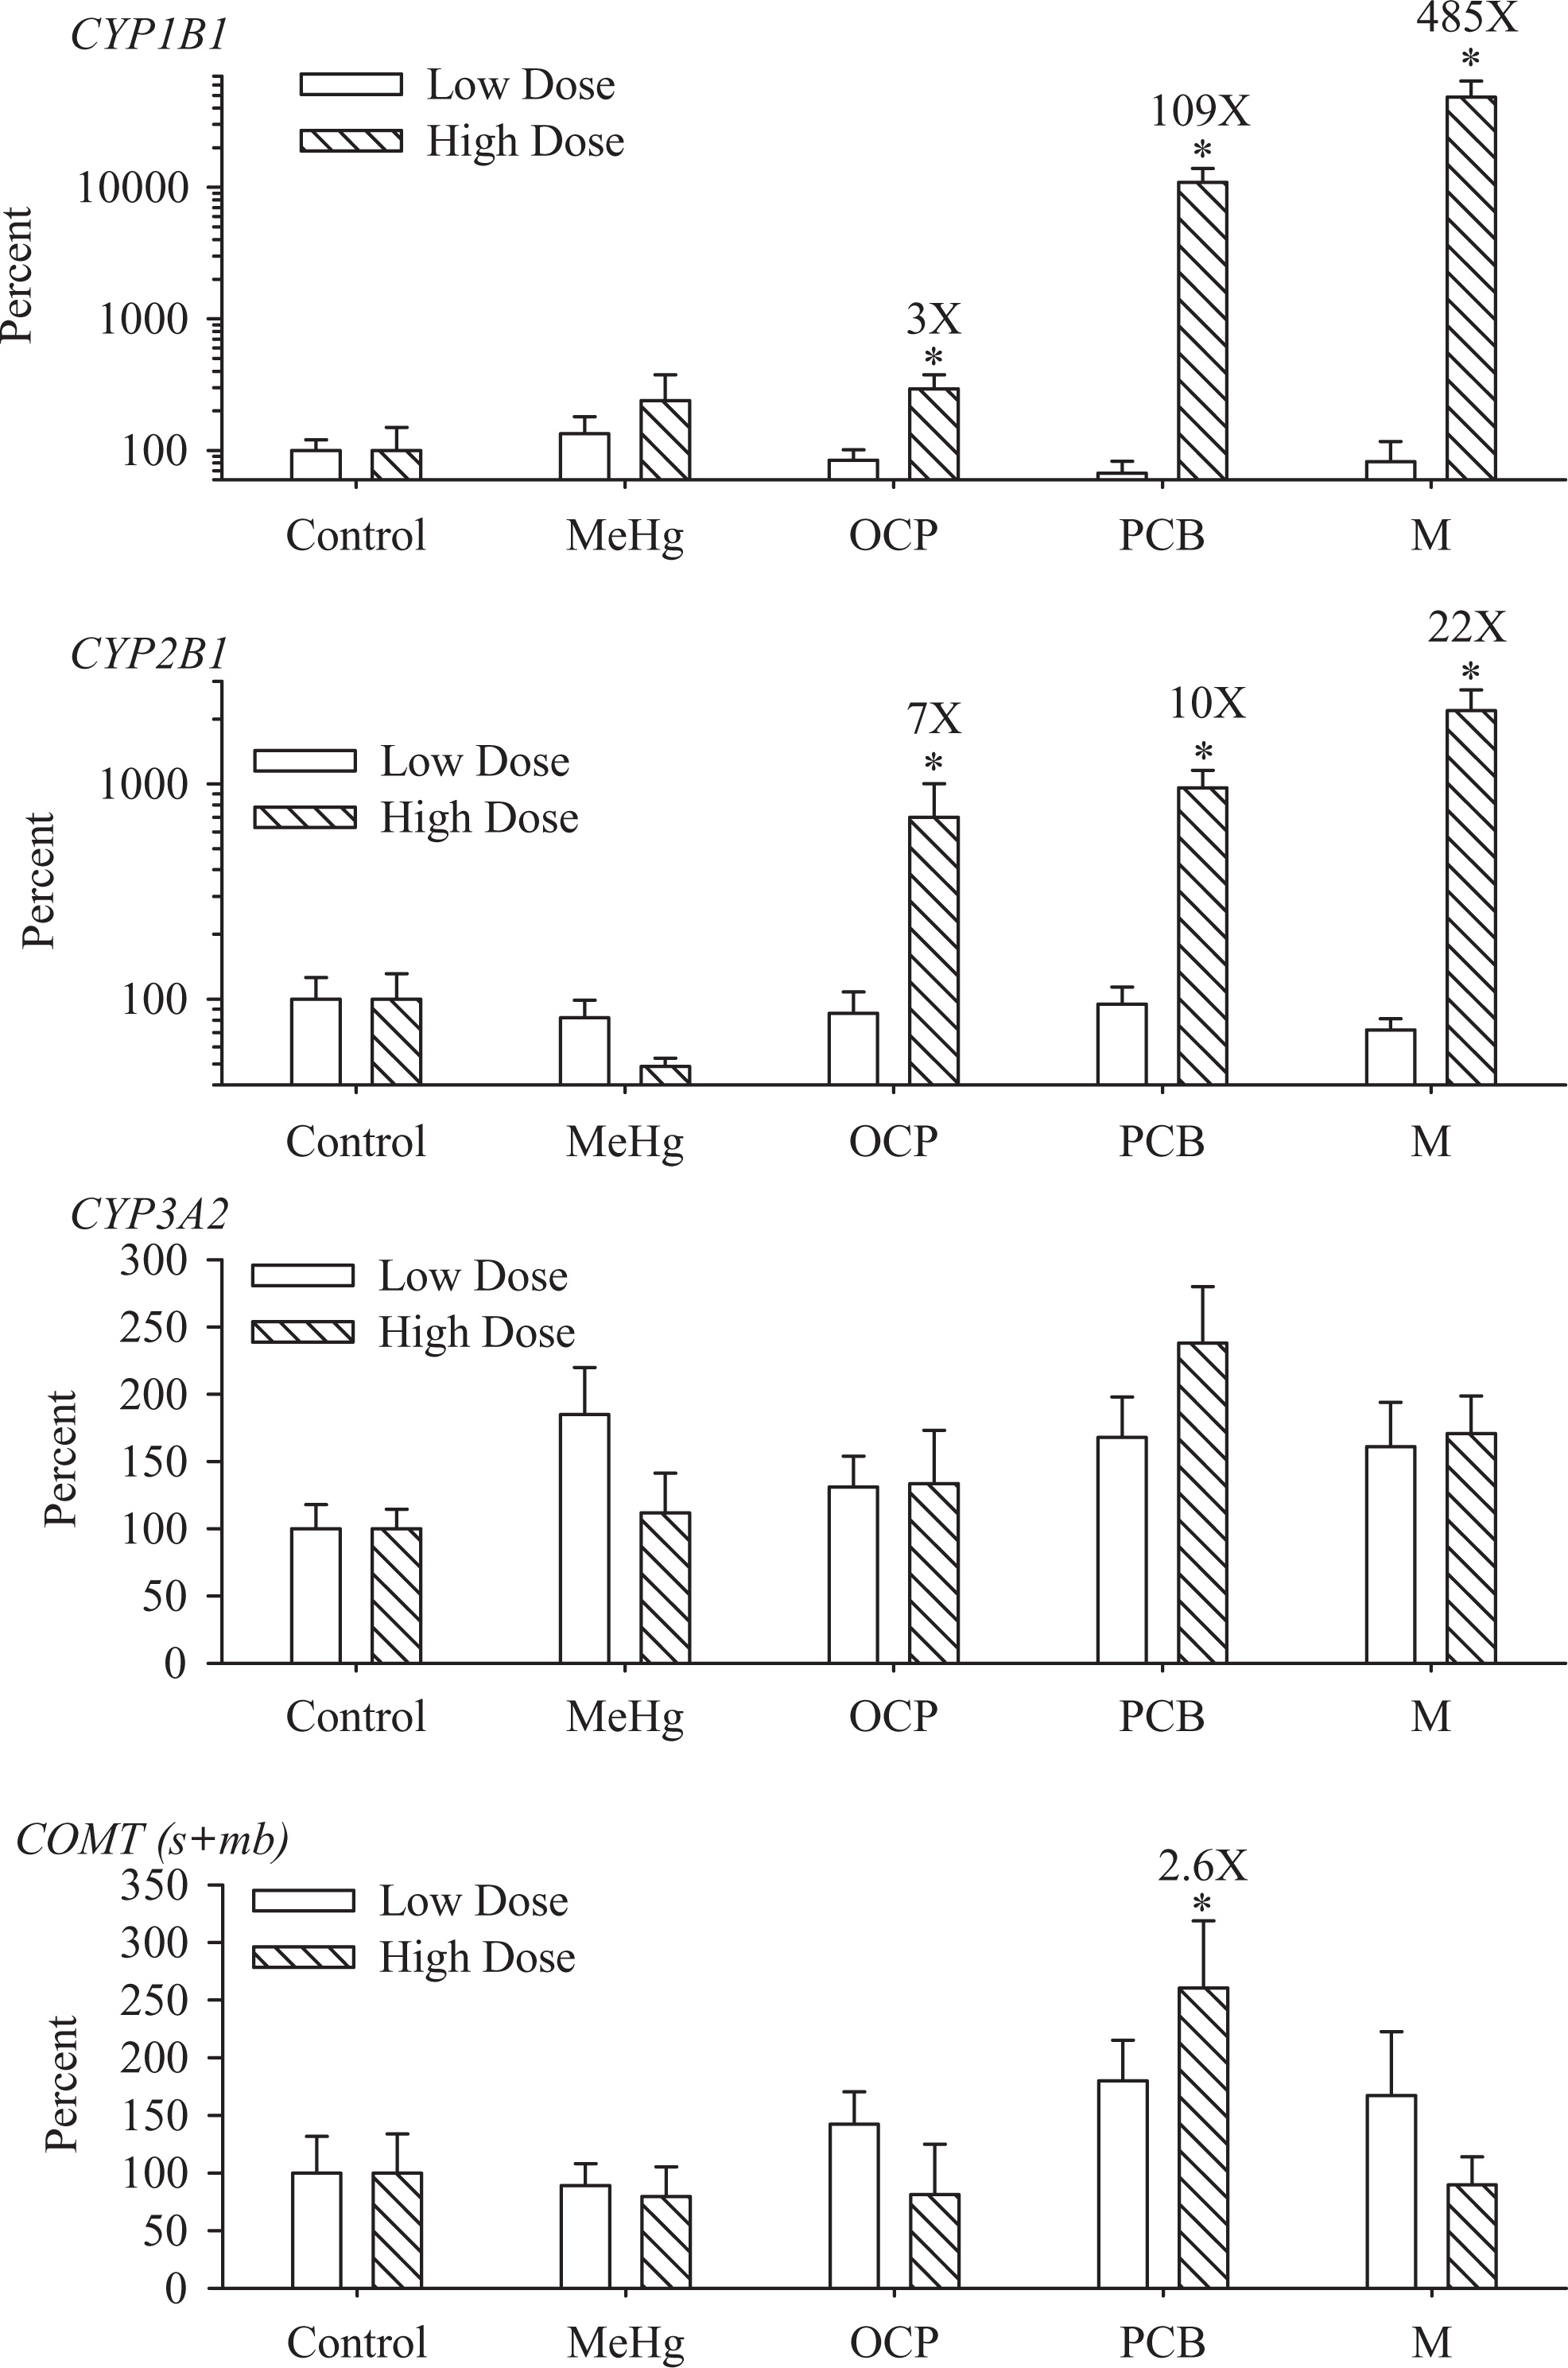
Effects of treatments on hepatic mRNA abundance of CYP1B1, CYP2B1, CYP3A2, and COMT (s + mb) at PND 29 (mean + stdandard error). The results were normalized to the abundance of β-actin mRNA in each sample. Two assays were conducted, one for the low-dose samples and the other for the high-dose samples. Both assays included all the control rats, explaining the presence of 2 bars for the control group. Fold increases are indicated in numbers only for the treatments inducing significant effects. *Groups significantly different from their respective control, P < .05 (n = 9-11 per treatment group). mRNA indicates messenger RNA; PND, postnatal day; COMT, catechol-o-methyltransferase.
Effects on the Metabolism of Estrogens
There was no difference in the metabolism of estrogens between the control group and any of the low-dose treatment groups (data not shown). High-dose treatment groups increased the microsomal production of 2-OH-E2, 4-OH-E2, 6α-OH-E2, and 2-OH-E1 (Table 3). The OCP, PCB, and M treatments increased (P < .05) the production rate 6.1, 10.5, and 7.6 times above control for 2-OH-E2, and 6, 10.6, and 7 times above control for 6α-OH-E2, respectively. The production of 4-OH-E2 was similar between the control and high-dose treatment groups, but a 2-way ANOVA comparing high- and low-dose treatment groups revealed a significant effect of dose (P < .0004). Post hoc Tukey-Kramer test revealed that the production of 4-OH-E2 in the high-dose PCB group (0.119 ± 0.019 pmol/mg per min) was significantly higher (P < .05) than that of the low-dose PCB (0.046 ± 0.007 pmol/mg per min, n = 8) or low-dose M group (0.052 ± 0.007 pmol/mg per min, n = 12). The data for the production of 2-OH-E1 were not normally distributed and nonparametric analysis revealed no differences relative to the control group but increases in the production rate between the low- and high-dose groups (MeHg medians 0.036 [n = 3] vs 0.10 pmol/mg per min; OCP medians 0.032 [n = 3] vs 0.08 pmol/mg per min; PCB medians 0.036 [n = 5] vs 0.11 pmol/mg/min) that reached statistical significance only in the M groups (P = .02; 0.054 [n = 8] vs 0.085 pmol/mg per min; high-dose data and n values are given in Table 3).
Production Rate of Estrogen Metabolites (pmol/mg/min) From the Incubation of 14 C-E2 With Hepatic Microsomes From PND 21 Female Rats Exposed to the High-Dose Treatmentsa
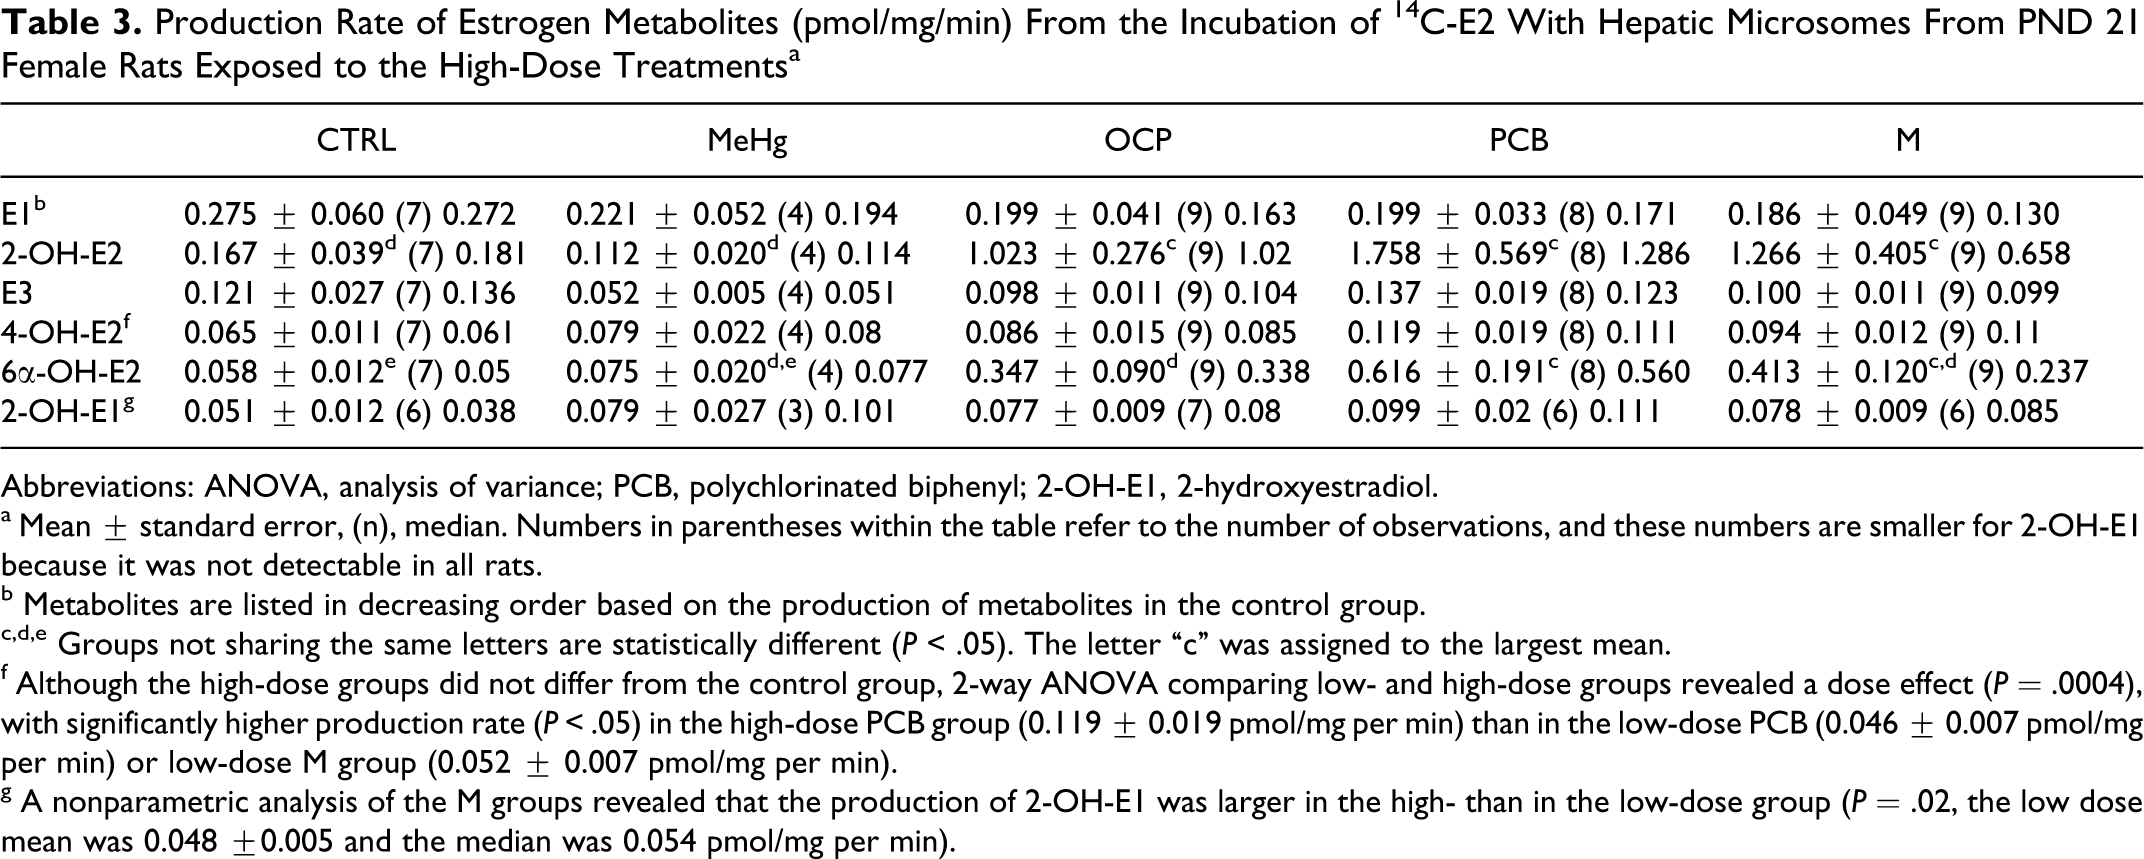
Abbreviations: ANOVA, analysis of variance; PCB, polychlorinated biphenyl; 2-OH-E1, 2-hydroxyestradiol.
a Mean ± standard error, (n), median. Numbers in parentheses within the table refer to the number of observations, and these numbers are smaller for 2-OH-E1 because it was not detectable in all rats.
b Metabolites are listed in decreasing order based on the production of metabolites in the control group.
c,d,e Groups not sharing the same letters are statistically different (P < .05). The letter “c” was assigned to the largest mean.
f Although the high-dose groups did not differ from the control group, 2-way ANOVA comparing low- and high-dose groups revealed a dose effect (P = .0004), with significantly higher production rate (P < .05) in the high-dose PCB group (0.119 ± 0.019 pmol/mg per min) than in the low-dose PCB (0.046 ± 0.007 pmol/mg per min) or low-dose M group (0.052 ± 0.007 pmol/mg per min).
g A nonparametric analysis of the M groups revealed that the production of 2-OH-E1 was larger in the high- than in the low-dose group (P = .02, the low dose mean was 0.048 ±0.005 and the median was 0.054 pmol/mg per min).
Although there was no statistically significant treatment effect on the cytosolic COMT-dependant production of individual methoxyestrogens (2-Me-E2, 2-OH-3-Me-E2, 4-Me-E2, and 3-Me-4-OH-E2; Table 4), a further analyses of these data suggest treatment effects on the substrate preference of COMT. First, the larger sum of 2-Me-E2 + 2-OH-3-Me-E2 (both originating from the transformation of 2-OH-E2) compared to the sum of 4-Me-E2 + 3-Me-4-OH-E2 (both originating from 4-OH-E2) suggests that 2-OH-E2 is the preferential substrate for COMT (Figures 3, 5A, and 5B). This is illustrated by the (2-Me-E2 + 2-OH-3-Me-E2)/(4-Me-E2 + 3-Me-4-OH-E2) ratios, which exceed 1 in all groups (Figure 5B). This methoxyestrogen ratio was significantly higher in the low-dose M group than in the control or high-dose PCB or M groups (nonparametric tests, P < .05). Collectively, these results suggest that the PCB and M treatments modified the enzymatic context and/or catalytic preference of COMT.
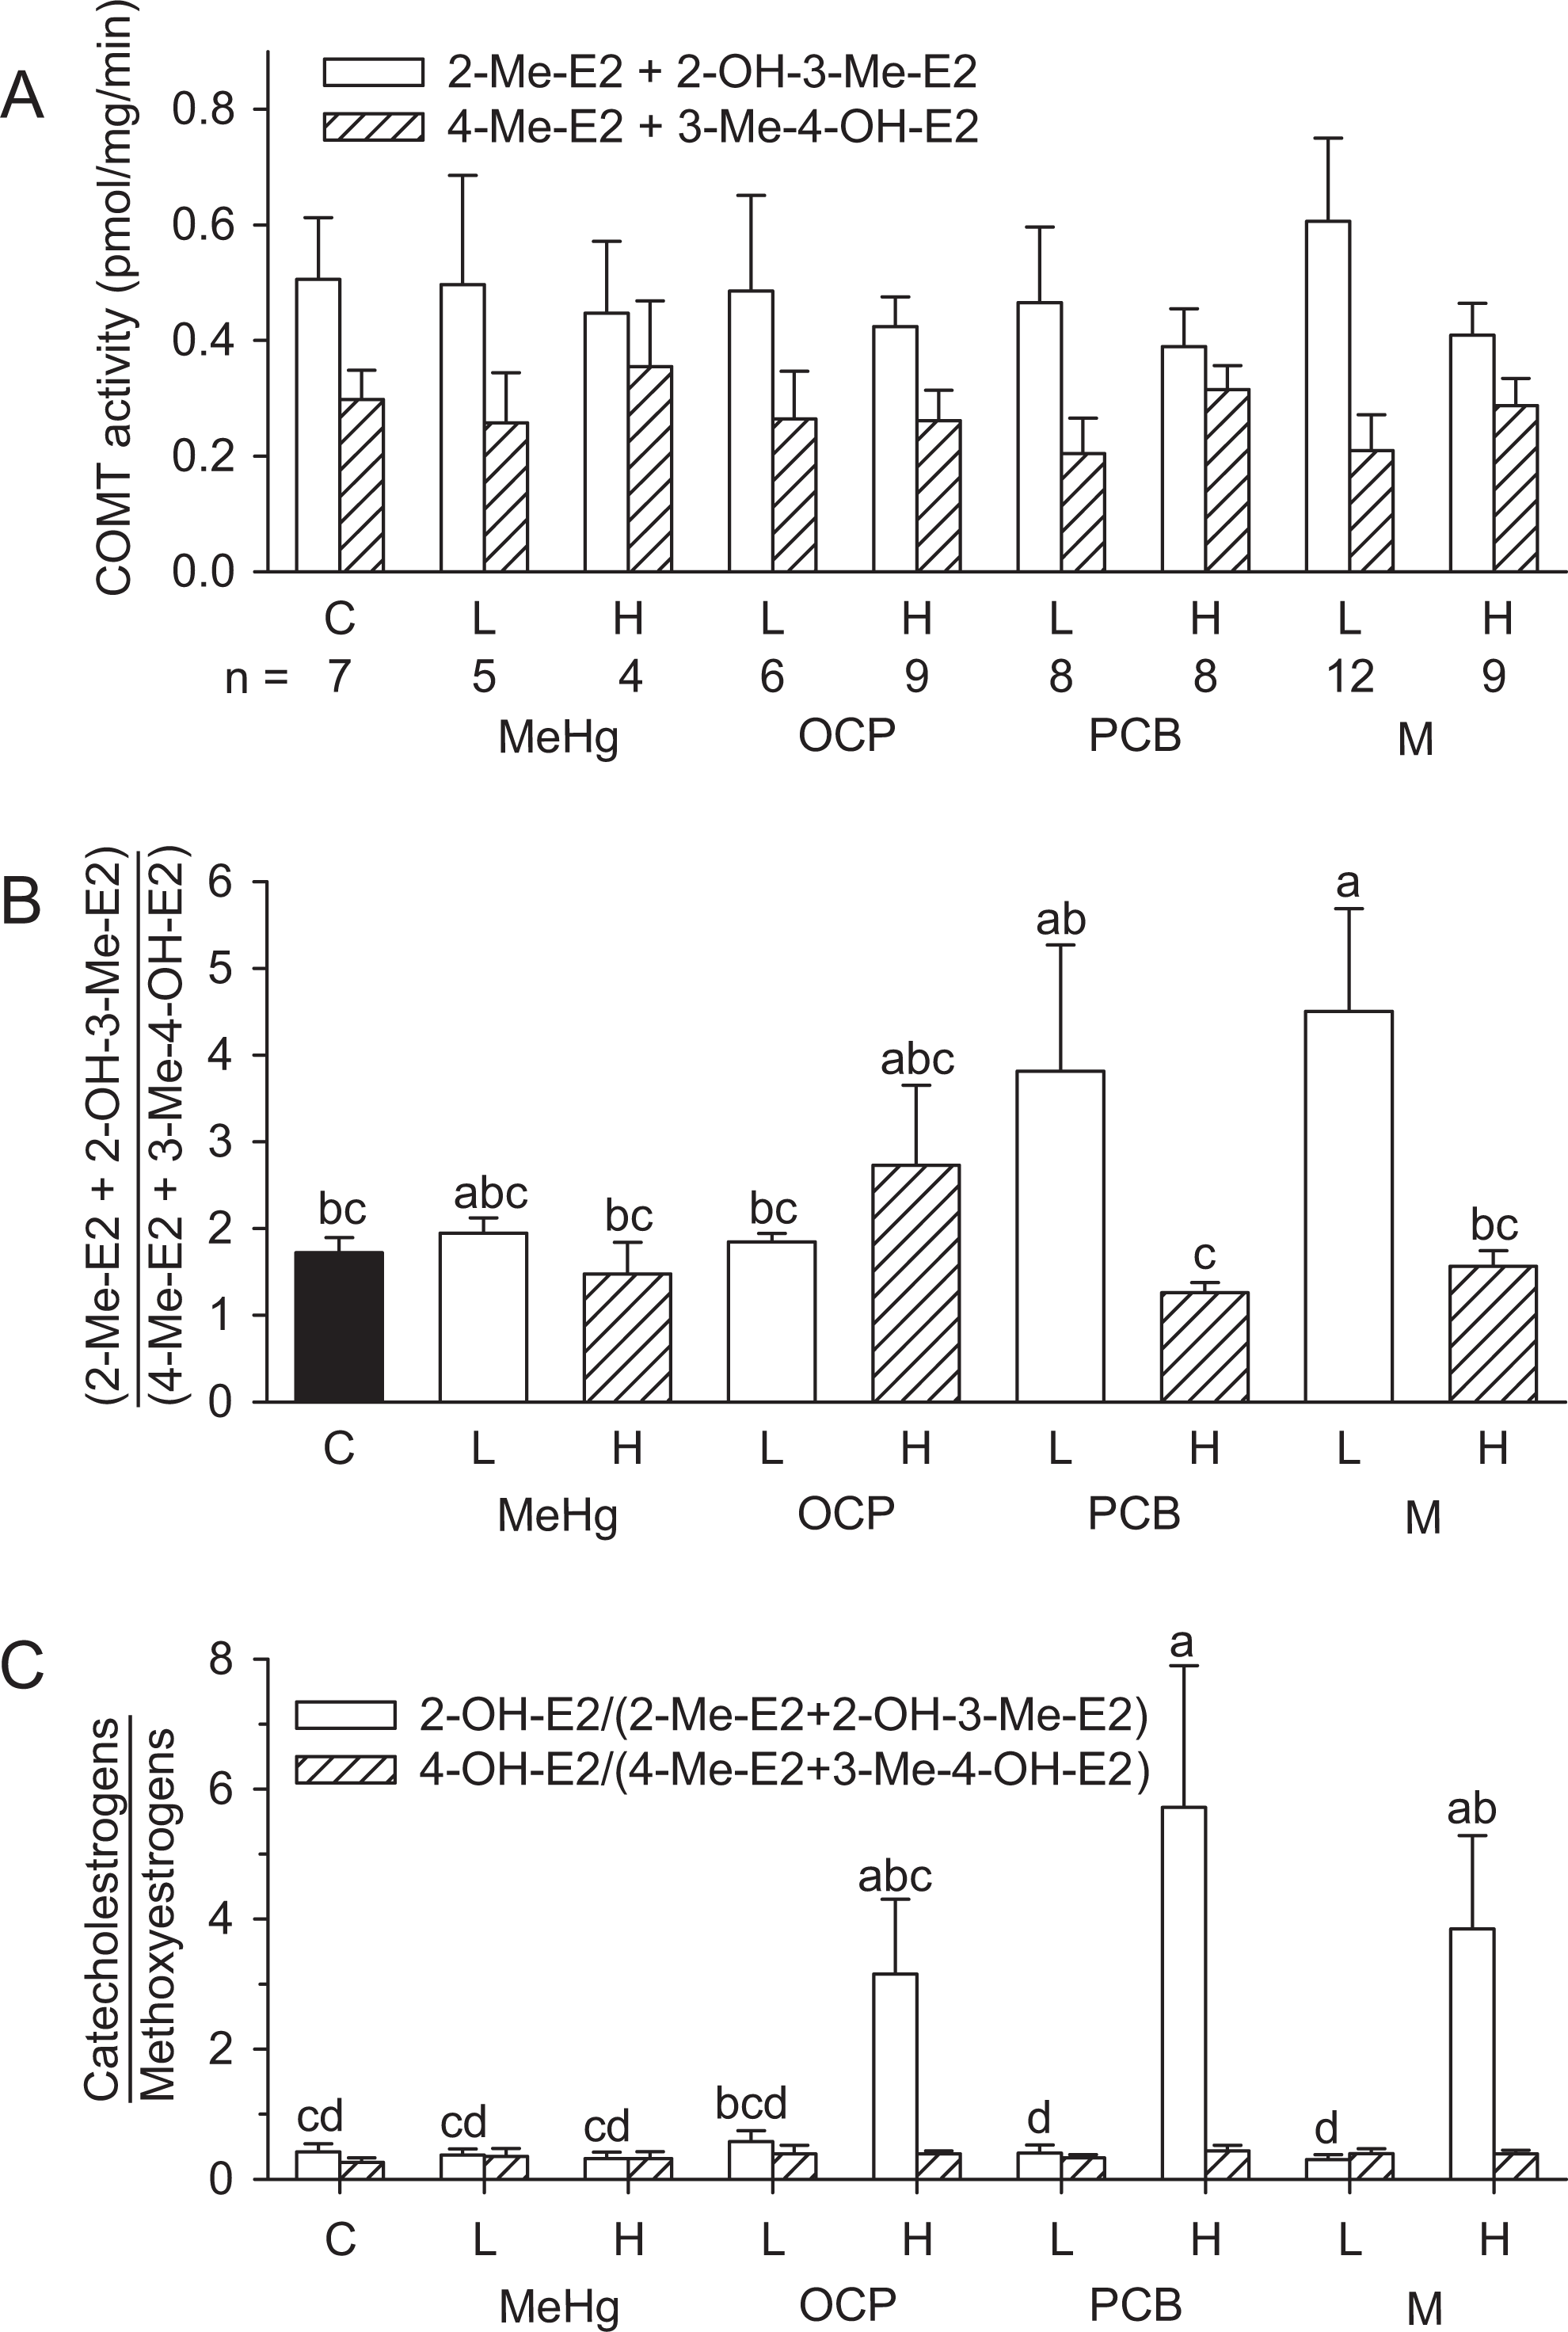
Analysis of treatment effects on the production of methoxyestrogens by hepatic cytosolic fractions from females at PND 21. (A) Production of methoxyestrogens (2-Me-E2 + 2-OH-3-Me-E2, open bars; 4-Me-E2 + 3-Me-4-OH-E2, hatched bars) from the transformation of catecholestrogen substrates (2-OH-E2 or 4-OH-E2) by cytosolic COMT preparations supplemented with 14 C-SAM as methyl donor. (B) Effects of treatments on the ratios of methoxyestrogens (2-Me-E2 + 2-OH-3-Me-E2)/(4-Me-E2 + 3-Me-4-OH-E2) in control (black bar), low-dose (open bars), and high-dose groups (hatched bars). (C) Comparison of the catecholestrogen/methoxyestrogen ratios. The ratios 2-OH-E2/(2-Me-E2 + 2-OH-3-Me-E2) (open bar) and 4-OH-E2/(4-Me-E2 + 3-Me-4-OH-E2) (hatched bars) were analyzed separately. There were no statistically significant differences across groups for the ratio 4-OH-E2/(4-Me-E2 + 3-Me-4-OH-E2) which always remain below 1. Treatment groups that do not share the same identifiers are statistically different (P < .05; mean + stdandard error. The letter “a” was assigned to the largest mean. The number of observations per group is indicated on the X-axis of Figure 5A. C, control; L, low dose; H, high dose. 2-OH-E1 indicates 2-hydroxyestrone ; HP-TLC, high-performance thin layer chromatography; PND, postnatal day; COMT, catechol-o-methyltransferase; 2-OH-3-Me-E2, 2-hydroxy-3-methoxyestradiol; 2-Me-E, 2-methoxyestradiol; 3-Me-4-OH-E2, 3-methoxy-4-hydroxyestradiol; 4-Me-E2, 4-methoxyestradiol
Production of the Methoxyestrogens 2-Me-E2 and 2-OH-3-Me-E2, or 4-Me-E2 and 3-Me-4-OH-E2 (pmol/mg per min) From the Transformation of Catecholestrogen Substrate 2-OH-E2 or 4-OH-E2, respectively, by Cytosolic Preparations Including 14 C-SAM as Methyl Donor and Endogenous COMT From PND 21 Female Rats From High-dose Treatment Groupsa
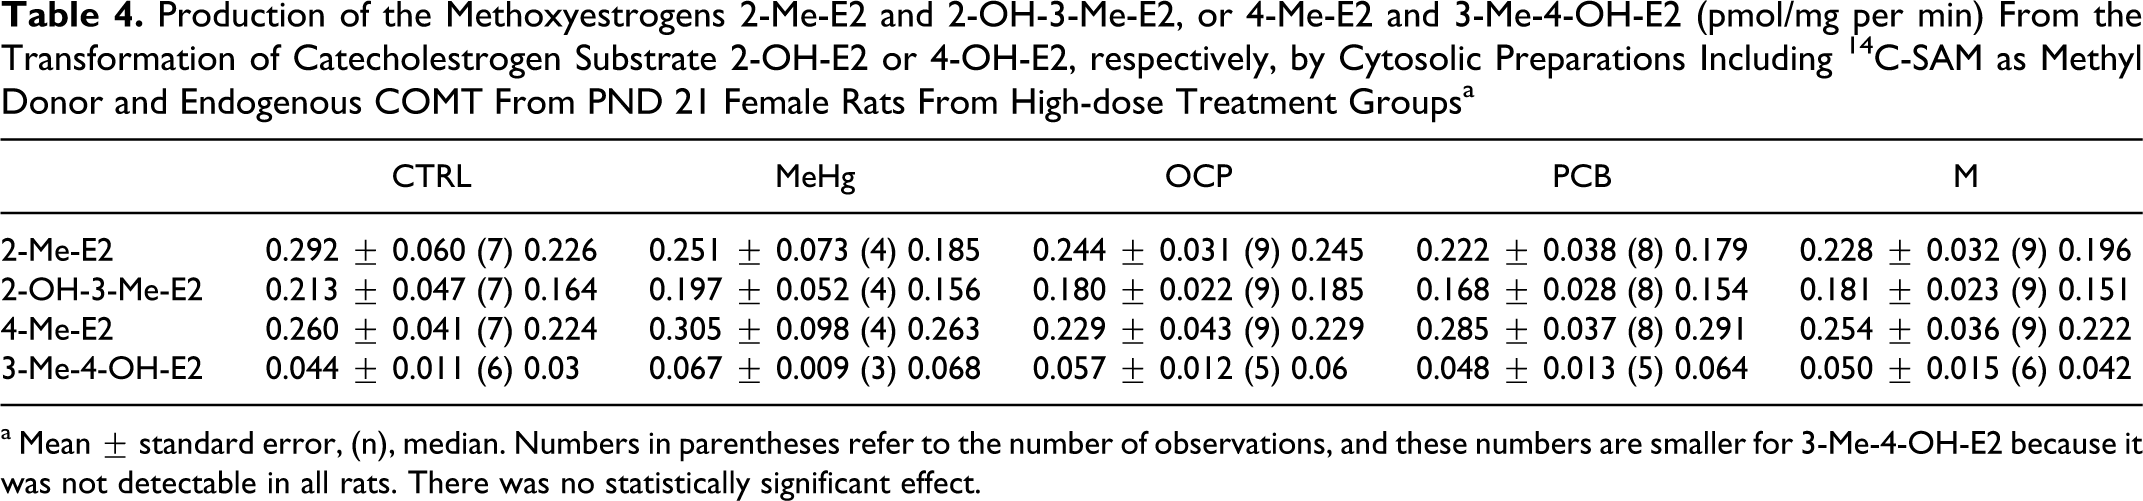
a Mean ± standard error, (n), median. Numbers in parentheses refer to the number of observations, and these numbers are smaller for 3-Me-4-OH-E2 because it was not detectable in all rats. There was no statistically significant effect.
The same data from the individual rats were also used to estimate whether the catalytic activity of cytosolic COMT can exceed the production of CEs by microsomal CYPs. This analysis is shown in Figure 5C by comparing the ratios of CEs/methoxyestrogens (2-OH-E2/(2-Me-E2 + 2-OH-3-Me-E2) and 4-OH-E2/(4-Me-E2 + 3-Me-4-OH-E2)). There was no significant effect of treatments on the 4-OH-E2/(4-Me-E2 + 3-Me-4-OH-E2) ratios, which always remained well below 1. This supports the suggestion that cytosolic COMT activity always exceed the microsomal production of the potentially mutagenic 4-OH-E2. The 2-OH-E2/(2-Me-E2 + 2-OH-3-Me-E2) ratio in the control group was 0.42, also well below 1, but in the high-dose PCB and M group, the ratios were significantly increased 13.6 and 9.1 times above control (log transformed, P < .05). These results suggest that the microsomal capacity to produce 2-OH-E2 in these high-dose groups exceed the cytosolic capacity to metabolize this CE.
Discussion
This report demonstrates that in utero and lactational exposure to mixtures of environmental contaminants can modify the metabolism of estrogens in the liver of female offspring at PND 21. The experiments revealed 4 major findings. (1) The high-dose OCP, PCB, and M treatments increased the production of the CE, 2-OH-E2. (2) The cytosolic COMT activity, which inactivates CEs, exceeded the microsomal production rate of 4-OH-E2. (3) In contrast, the microsomal production rate of 2-OH-E2 exceeded the catalytic activity of COMT in the high-dose PCB- and M-treated groups. (4) These results add to our understanding of the toxicology of chemical mixtures. The PCB mixture was the most potent, followed by the OCP mixture, and MeHg being the least potent in modifying the metabolism of estrogens. While M treatment included the same PCB and OCP mixtures, it did not modify the metabolism of estrogens more than the PCB mixture.
Changes in the microsomal production of hydroxylated estrogen metabolites can be associated with the changes in the expression of CYP enzymes. Many CYP enzymes are involved in the oxidative metabolism of estrogens but with varying degree of carbon position selectivity and catalytic activity. CYP1A1 and CYP1A2 are the main p450 enzymes responsible for 2-hydroxylation of estrogens, 16 while CYP1B1 is reported to be the major hydroxylase for C-4 in humans, 52 and C-2 in the rats. 53 Hydroxylation of estradiol at the 6α-, 6β-, and 2- positions is catalyzed by CYP2B1 and CYP2B2. 16 The expression of CYP1 enzymes is increased by the interaction of chemicals with the aryl-hydrocarbon receptor. In the current study, measurements of enzymes responsible for hydroxylation of E2 at position 2 (CYP1A1, 1B1, and 2B1) showed large increases in mRNA expression in the high-dose PCB, OCP, and M groups but not in the MeHg-treated group, consistent with the effects observed on the production of 2-OH-E2. The production of 4-OH-E2 was low; only the PCB treatment induced a statistically significant increase in 4-OH-E2 above the low-dose groups. This observation is consistent with the report that the amount of 4-OH-E2 produced by CYP1B1 is low compared with the amount of 2-OH-E2 produced by CYP1A enzymes. 52 The high dose of OCP, PCB, and M increased both CYP2B1 mRNA and the abundance of the 6α-OH-E2 metabolite. 6α-OH-E2 is commonly detected in estrogen metabolism reactions, 54 –56 but little information is available regarding its biological role. Along with 4-, 16α-, and 6β- metabolites of E2 and E1, 6α-OH-E2 may be involved in the enhancement of estrogen-dependent cancers. 57 It also has the ability to form DNA adducts in cells following sulfonation at the C-6 position, thus overall, the formation of this metabolite could be linked with detrimental effects. 58 , 59
Effects of complex mixtures can be difficult to explain. PCBs are mixed inducers well known to increase the expression of many detoxification enzymes. Similarly, the OCP mixture included 12 OCPs with some previously shown to be mixed inducers (eg, hexachlorobenzene, 60 chlordane family 61 ), or CYP1A1 inducers such as trans-nonachlor. 61 As expected, both the PCB and OCP treatments increased mRNA expression of CYPs and also altered the metabolism of estrogens. Interestingly, although the M treatment included the PCB and OCP mixtures, it did not modify the metabolism of estrogens more than the PCB mixture. Also, the abundance of CYP3A2 and COMT (s + mb) mRNA were increased by the PCB but not by the M treatment. These results suggest interactions among the PCB, the OCP, and MeHg in the mixture M, given that the increase in mixture complexity was not associated with an increase in its activity. Perhaps the PCB treatment alone was sufficient to induce saturation (downstream of mRNA expression) of the mechanisms leading to the expression of CYP protein abundance and measured enzymatic response. Antagonism was previously suggested among chemical groups in this mixture, 44 in mixtures of PCBs, 62 and in other mixtures of PCBs and MeHg. 63 Although our data showed that the high dose of MeHg increased the abundance of CYP1A1 mRNA 51 but had no effect on the metabolism of estrogens on its own, MeHg might have reduced PCB-induced CYPs activities. This hypothesis is supported by 3 observations: (1) MeHg gets demethylated in the intestine and mercury returns to the blood through the enterohepatic recirculation, 64 (2) in vitro observations indicate that mercury alone increases CYP1A1 mRNA expression with no changes to protein and activity levels, and (3) mercury decreased 2,3,7,8-tetrachloro-dibenzodioxin (TCDD)-induced CYP1A1 catalytic activity. 65 Other divalent metal ions were previously shown to affect the metabolism of estrogens (Cu2+ and Zn2+), while others had no effects (Fe2+, Co2+, Ni2+, and Ca2+). 66
The current analysis of the methoxyestrogen ratio (2-Me-E2 + 2-OH-3-Me-E2)/(4-Me-E2 + 3-Me-4-OH-E2) indicated that COMT has higher catalytic activities toward 2-OH-E2 than 4-OH-E2, as previously demonstrated by others. 67 This ratio also revealed statistically significant effects between low- and high-dose PCB and M treatments. These treatment effects were not detected from the analyses of individual methoxyestrogens and thus are subtle. The mechanisms responsible for these treatment effects are not clear; they are not associated with substrate availability given that the same concentrations of 2-OH-2- and 4-OH-2-substrate were provided in these assays, thus they likely originate in vivo from changes in the enzymatic context of COMT as evidenced by effects on CYP and COMT (s + mb) mRNA abundance. Others reported that rats treated with PCBs had reduced COMT activity mediated by catechol metabolites of PCBs acting as inhibitors of COMT, 35 and that estrogenic PCBs reduce COMT protein expression. 68
There is strong evidence indicating that CE 4-OH-E2 is carcinogenic. 17 To avoid potential adverse effects from this estrogen, the microsomal production of CEs should be compensated by deactivating enzyme systems, including COMT. The ratio of 4-OH-E2/(4-Me-E2 + 3-Me-4-OH-E2) always remained below 1 across all groups, whereas the ratio 2-OH-E2/(2-Me-E2 + 2-OH-3-Me-E2) was significantly increased by the high-dose PCB and M treatments (Figure 5C). This suggests that the catalytic activity of microsomal CYPs that produces 4-OH-E2 remained below the cytosolic catalytic activity of COMT; in contrast, the microsomal production rate of 2-OH-E2 exceeds the catalytic activity of COMT. These hepatic observations raise the hypothesis that COMT can counteract the production of the potentially mutagenic 4-OH-E2 but not the high production of 2-OH-E2. Under in vivo conditions, given the concommittent production of 2-OH-E2 and 4-OH-E2 acting simultaneously as competitive substrates for COMT, and given that 2-OH-E2 is the preferential substrate for COMT, it remains to be determined whether activities of COMT and other phase II enzymes are sufficient to metabolize the mutagenic 4-OH-E2.
There are limitations in the interpretation of these data. (1) This HP-TLC technique has limitations in metabolite resolution and cannot provide definitive identification of all metabolites or absolute enzyme activities. Nevertheless, this approach detected clear treatment differences in the relative abundance of major metabolites. (2) These results reflect the in vitro capacity of microsomal or cytosolic enzymatic systems at transforming substrates available in excess amounts. This is not representative of an in vivo liver where substrates and enzymatic products are circulating and subjected to other transformations (eg, sulfation, glucuronidation, glutathione conjugation). (3) The current hepatic data cannot be used to suggest that similar estrogen metabolism imbalances can be created in other tissues where diseases might originate, given that other organs are equipped with tissue-specific sets of enzymes to deactivate circulating or locally produced molecules. The current manuscript demonstrates that exposure to chemical mixtures prepared based on the concentrations reported in the Canadian Arctic population 69 can potentially change the relative abundance of adverse and beneficial estrogen metabolites (eg, 4-OH-E2 vs 2-OH-E2 vs 2-Me-E2). Speculating on the adversity of this endocrine disruption requires an understanding of the role of these metabolites acting together under normal condition. Sensitive liquid chromatography/mass spectroscopy (LC/MS/MS) assays were recently developed to measure estrogen metabolites accumulating in tissues, 70 and such assay should lead to significant progress in this field. (4) Although subtle effects occurred at low dose (eg, changes in the methoxyestrogen ratios and in the abundance of CYP1A1 mRNA), obvious effects were observed at the high dose. A more complete dose–response study would be required. According to a study performed in our institution, 43 the high dose of the mixture M can generate circulating levels of organochlorines in the maternal rat serum that were approximately 100 times higher than the circulating levels found in human population.
In summary, in utero and lactational exposure to mixtures of environmental contaminants at high doses can modify the hepatic metabolism of estrogens in PND 21 female offspring. The MeHg treatment had no effect on its own, but the OCP, PCB, and M treatments increased, in particular, the production of the CE 2-OH-E2. The comparisons of the microsomal production of reactive CEs to the cytosolic COMT activity (which deactivate CEs) raise the hypothesis that the activity of cytosolic COMT exceeds the microsomal production of the potentially mutagenic 4-OH-E2 but not the production rate of 2-OH-E2. The PCB treatment was the most potent in altering the metabolism of estrogens. Although the M treatment included the same PCB and OCP mixtures, it did not modify the metabolism of estrogens more than did the PCB mixture. This suggests potential chemical interaction and contributes to our understanding of the toxicology of chemical mixtures.
Footnotes
Acknowledgment
This work was supported by the Northern Contaminants Program, Ministery of Aboriginal Affairs and Northern Development and by Health Canada. The authors are grateful to Dr Nanqin Li for the preparation and analysis of the dosing solutions; to Bruce Martin, Susan Kelly, and Kelly Brennan for their technical assistance; to Dr Gerald M. Cooke and Dr Premkumari Kumarathasan for carefully reviewing this manuscript.
Declaration of Conflicting Interests
The author(s) declared no potential conflicts of interest with respect to the research, authorship, and/or publication of this article.
Funding
This work was supported by the Northern Contaminants Program, Ministery of Aboriginal Affairs and Northern Development and by Health Canada.