
Abstract
Chronic exposure to arylamines through diet and/or smoking has been associated with genetic changes and tumorigenesis. Cellular proliferation, apoptosis, and histological changes in liver tissue were investigated in Gambusia affinis (G affinis) after chronic dietary exposure to 6.9 mM and 0.069 mM concentrations of benzidine (BZ), 2-aminofluorene (2AF), and their combination for 4, 8, and 12 weeks, respectively. The proliferation assay indicated non–dose-dependent increases in cellular proliferation over the controls for all treatment groups at 4 and 12 weeks but not at 8 weeks except for the low dose of 2AF. The apoptosis assay showed effects in the low-dose group of 2AF and BZ at 4 weeks only. Hematoxylin/eosin staining of liver tissue revealed an increase in oval/spindle cell proliferation and altered foci formation in the treated groups compared with controls. These results demonstrate a mammalian-like response to 2AF and BZ in G affinis liver.
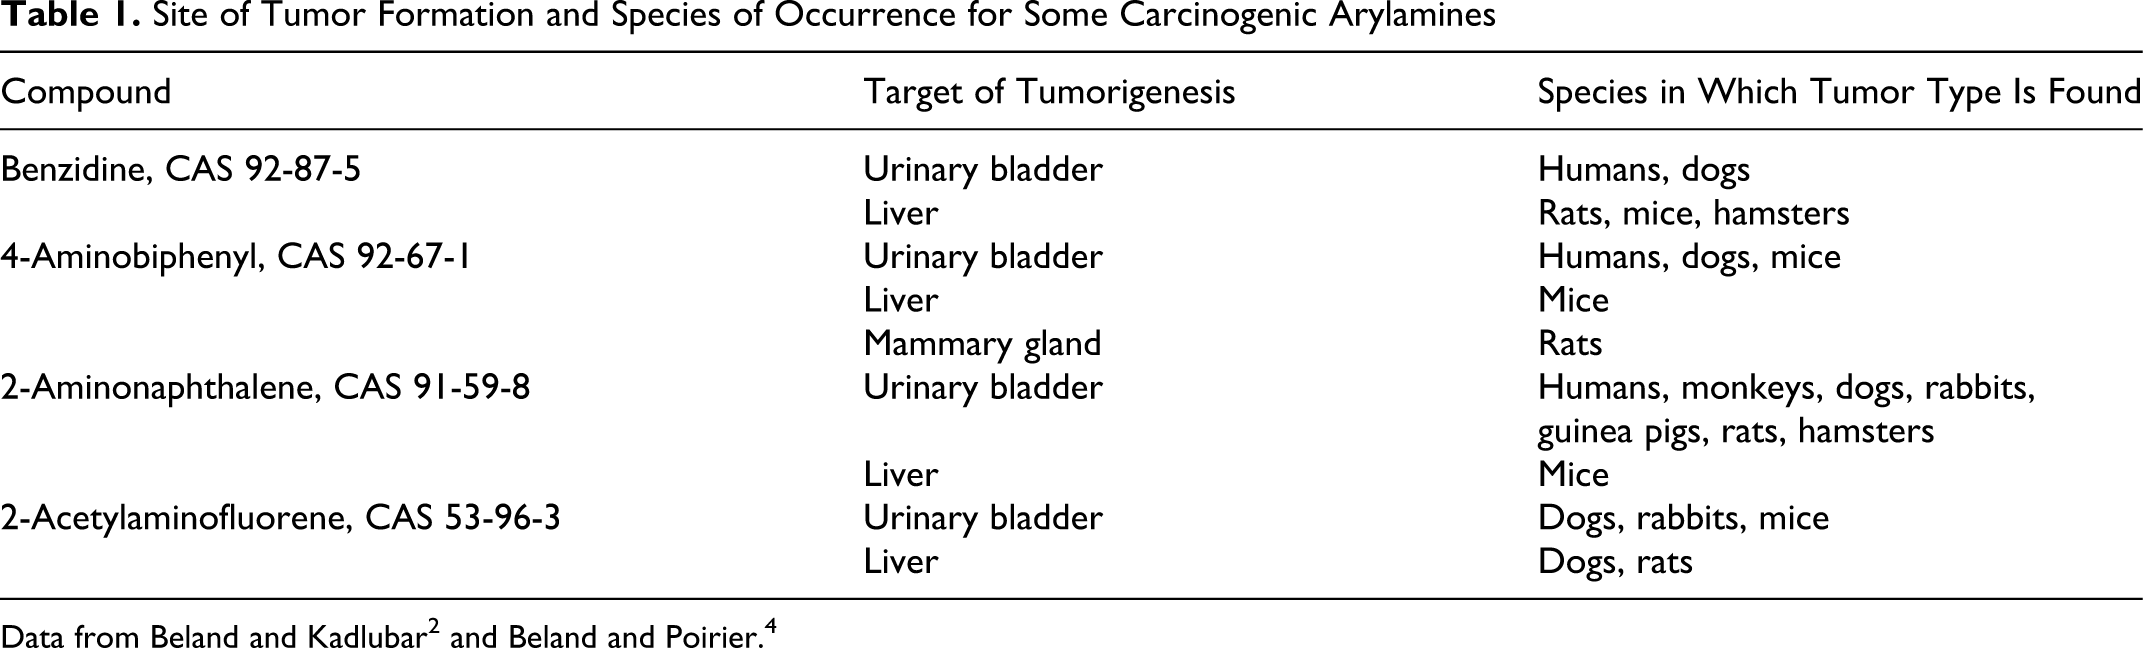
Nitrogen-containing polycyclic aromatic hydrocarbons (PAHs), including primary aromatic amines (arylamines), occur intermittently with other PAHs that are ubiquitous in the environment and are prevalent in coal and its refined products. 1 They have been used extensively in the dye, rubber, and plastics industries, and some can be found in tobacco smoke and cooked foods. Both 2-aminonaphthalene and 4-aminobiphenyl may be found in nanogram quantities in cigarette smoke, and additional arylamines may be found in amounts as high as micrograms. 2,3 During the cooking process, amino acids and other biologically active molecules such as glucose and creatinine are pyrolyzed to form potent heterocyclic arylamine mutagens. Some nitro-aromatic hydrocarbons, found in diesel emissions and other combustion products, such as wood smoke, are metabolized differently but damage DNA by an almost identical mechanism as arylamines. Arylamines have been found to be carcinogenic in a variety of mammals, primarily in organ systems associated with their metabolism (Table 1 ). From this table it can be seen that most of these amines form tumors in the bladders of humans and dogs, but in rodents they are associated with the development of primary liver tumors. 2,4
Site of Tumor Formation and Species of Occurrence for Some Carcinogenic Arylamines
Small fish species are well suited to act as sentinel organisms for monitoring of harmful chemicals in the aquatic environment (eg, ponds, streams, lakes) and have been used as sentinel species for chemical carcinogens. Typically, aquatic ecosystems are monitored by collecting water or sediment samples from specific sites and evaluating the samples for acute toxicity. However, this toxicity testing approach does not reflect the dynamic changes occurring in aquatic ecosystems that organisms encounter, such as tide, temperature, and sediment disturbance that may modify exposure effects. 5 Furthermore, these assays do not yield information on early chronic changes that may lead to long-term effects such as tumorigenesis. The demonstrated capacity for neoplastic lesion development in aquatic species is useful in comparison studies for investigating common mechanisms in carcinogenesis. 6 –8 Collaborative efforts by the US Environmental Protection Agency, National Cancer Institute, and the US Army Medical Research and Development Command have revealed that fish have metabolic pathways similar to mammals, develop neoplasms in laboratory settings in relatively short time periods, exhibit hardiness under experimental conditions, and are easily maintained. 6,7,9,10
The Western mosquitofish, Gambusia affinis (G affinis), a small fish species, is an excellent sentinel species for biomonitoring aquatic habitats given its hardiness in tolerating large ranges of water parameters such as temperature, salinity, and dissolved oxygen. Also advantageous are its nonmigratory or philopatric nature, allowing for accurate representation of risk at a restricted location; its geographic diversity, permitting use in a wide range of testing sites; and its ability to develop tumors in relatively short periods of time. 11 –14 Although tumor formation occurs in numerous small fish species, their limited tolerance to low water quality, the narrow geographic distribution of many exotic small fish species (eg, Japanese medaka), and the migratory nature of other fish species impose severe restrictions on direct biomonitoring of those species in geographically diverse or nonnative aquatic environments. Although hepatic neoplasms have been observed in G affinis, an extensive literature search revealed that the only carcinogen class tested on G affinis is the alkylating carcinogen methylazoxymethanol acetate (MAM-Ac). 14 Therefore, a basic need exists to ascertain G affinis responses to different metabolic classes of carcinogens. 15 Here, the polycyclic arylamines metabolic class of carcinogens was selected for testing using 2-aminofluorene (2AF) and benzidine (BZ) as representative compounds.
The objective of this study was to examine the early potential precarcinogenic effects of 2AF and BZ, both individually and combined in mixtures, on cellular proliferation, cell death, and histopathological changes in G affinis livers. To accomplish this task, liver tissue sections were exposed to proliferating cell nuclear antigen (PCNA) antibodies for immunohistochemical (IHC) detection of proliferating cells (reported as the PI Index), terminal deoxynuclotidyl transferase-mediated dUTP-biotin nick end labeling (TUNEL) of DNA strand breaks (reported as the TI Index) to reveal cell death, and hematoxylin and eosin (H&E) staining for histological examination. To determine whether cellular proliferation exceeds cellular death in carcinogenesis, a number of studies have examined the differences and indexes between PI and TI 16 –18 (reported as the PI-TI index). The PI-TI index is important in carcinogenic investigations because of the fine balance that exists between positive and negative regulation of cell growth. This balance is essential in normal development and growth, whereas a disruption in this balance during carcinogenesis results in tumor formation. 19
Both PCNA and TUNEL are well-established biomarkers for cellular proliferation and cell death and have been successfully investigated for use in G affinis carcinogenesis studies. 20
Materials and Methods
Chemicals
All chemicals and solvents used in these studies were reagent grade except as noted in the article. Benzidine (CAS 92-87-5) and 2-aminofluorene (CAS 153-78-6) were purchased from Sigma Chemical (St Louis, Mo) and were more than 98% pure. These toxic chemicals were protected from light during storage in both pure form and after preparation of the diets.
G affinis Care and Dosing
Male G affinis aged 12 to 24 weeks post hatch were purchased from Aquatic Research Organisms (Hampton, NH) and treated in accordance with an animal use protocol approved by the Institutional Animal Care and Use Committee of Western Michigan University. The fish were housed in 40-L aquaria in a flow-through dual-filtered water system and acclimated to the laboratory and standard aquarium flake food diet for 4 months prior to exposure to arylamine treatments. General health and environmental conditions were monitored daily, whereas alkalinity (30 ± 2 mg/L), ammonia (<1 ppm using dipstick), pH (6.8 ± 0.05), dissolved oxygen (8 ± 1 ppm), nitrites (<0.1 mg/L using dip stick), chloride (50 ± 5 ppm), chlorine (<0.1 ppm using dipstick), and hardness (325 ± 25 mg/L) of the aquarium water were monitored weekly. Fish were administered a mild anesthetic (MS222) and weighed weekly to determine general health and growth and to determine food weights. Fish were fed freshwater aquarium flake food (TetraMin, Blacksburg, Va; protein, 45%; fat, 5%; fiber, 2%; phosphorus, 1.3%; vitamin C, 183 mg/kg; moisture, 6%) twice daily at a ratio of approximately 1% of their averaged weight. Temperature was held at 20°C ± 1°C, and fish were maintained in a 12-hour light/12-hour dark photo period.
To assess the early-stage potential precarcinogenic effects of 2AF and BZ in G affinis liver, 21 fish were transferred from holding tanks in groups of 3 to 5 fish at a time and then randomly selected for assignment to 1 of 6 treatment or 2 control groups and placed in 8 different 40-L aquaria (21 fish per chemical dose treatment with 7 fish per exposure time). The 8 aquaria were randomly distributed across the surfaces of 2 stainless steel exposure racks. Treated fish were exposed daily for 4, 8, or 12 weeks to a dietary dose of 6.9 mM or 0.069 mM 2AF and BZ individually and 6.9 mM and 0.069 mM of these compounds combined. These doses were based on carcinogenic studies in previous aquatic research. 21 –25 Treatment group food was prepared by dissolving 2AF and/or BZ in ethanol (EtOH) (vehicle), thoroughly mixing the solution with flake food, and drying the mixture in a vacuum chamber at 30°C over night. The diets were then broken up into flakes before administration. The chemical content of the food was verified by gas chromatography/mass spectrometric analysis. There were 2 control groups: a nontreated control diet (standard flake food) and a vehicle (flake food with ethanol) control diet. Food for the nontreated control group was processed in the same manner as the treated food but without the addition of EtOH and the arylamines. The vehicle control food was treated with EtOH because EtOH was used as a vehicle for solubilizing and delivering 2AF and BZ to the treatment group food. During feeding, plastic partitions were inserted into the aquaria to separate the fish into groups of 3 to 4 animals, which helped to ensure that fish were fed the appropriate amount of food. In preliminary studies investigating the potential for losses of 2AF and BZ into aquarium water, the 2 chemicals remained associated with the food for up to 30 minutes. The fish were observed to consume the food in 5 minutes or less. When treatment periods were complete, 7 fish from each treatment were given a mild anesthetic (MS222) and sacrificed by placing them on ice for 45 minutes and decapitating them before liver removal.
Liver Tissue Processing
Livers were excised and immediately fixed in 10% neutral buffered formalin (Sigma Aldrich, St. Louis, Mo) for 24 hours and then placed in cassettes for tissue processing and paraffin embedding. Tissue was processed in a Fisher 266MP Histomatic tissue processor (Fisher Scientific, Pittsburgh, Pa). Processed tissues were embedded in paraffin using the Fisher HistoCenter (Fisher Scientific). From each block, 10 to 12 serial tissue sections were cut at 5 μm using a microtome (model 1512; Ernst Leitz Wetzlar GmbH, Germany), transferred to poly-L-lysine poly prep slides (Sigma Aldrich), and then incubated at 57°C overnight.
PCNA and TUNEL Labeling
The protocol used for detection of PCNA in G affinis was based on a previously published protocol that had been optimized for PCNA detection in 3 small fish species including G affinis. 20,26 There were 2 variations in the protocol as follows. For antigen retrieval, slides were immersed in 3% H2O2 with 0.1% sodium azide and microwaved in an 850-W, 1200-cm2 oven run at 80% power for 2 minutes, rested 1 minute, and microwaved again for 30 seconds. Immunodetection included the use of the Mouse Super-sensitive Detection Kit (BioGenex Laboratories, San Ramon, Calif), which was applied to the tissue sections for 30 minutes.
TUNEL labeling of the liver sections was carried out in accordance with the protocol from the ApopTag Apoptosis Detection Kit (Serologicals Corp, Norcross, Ga). Slight modifications to the protocol were as follows: diaminobenzidine solution was used as the peroxidase substrate and was applied for 10 minutes. Cover slips were adhered to the slides using Cytoseal XYL mounting media (VWR Scientific, South Plainfield, NJ).
PCNA and TUNEL slides of liver tissue sections were observed under a light microscope containing a 19-mm eyepiece graticle with a 1-mm grid containing 10 vertical and horizontal lines (Electron Microscopy Sciences, Ft Washington, Pa). This grid was used for tracking fields and counting cells. It was also used to maintain a representative distribution of PCNA and TUNEL-positive cells when changing from the lower magnification, which typically encompassed more 50% of the section, to the higher magnification necessary for the actual counts. The most standardized of methods in the literature for counting PCNA-positive cells is to count the number of PCNA-positive cells/1000 cells rather than per unit area of tissue examined. 20,26 Counting of PCNA-labeled cells was reported as a PCNA index (PI), the number of PCNA-positive cells per 1000 cells, and that index was used here for reporting the number of proliferating cells in each tissue section. 27 –29 A similar index was used for reporting the number of TUNEL-positive cells per 1000 cells in each tissue section. All positive cells were counted, including those lightly stained, as established in the guidelines of the Registry of Industrial Toxicology Animal-data Cell Proliferation and Apoptosis (RITA CEPA) group. 30 The RITA CEPA (http://www.item.fraunhofer.de/reni/public/rita/index.html) group assists its members in the uniform conduct of proliferation studies for comparison and interpretation of results in accordance with self-established standardized protocols for the subsequent formation of a cell proliferation and apoptosis database. Slides were assigned a 3-number code, randomized, and read blinded for exposure conditions. Furthermore, PCNA- and TUNEL-positive cell counts were spot checked by a trained light microscopist from the Biological Imaging Center at Western Michigan University to avoid scoring bias.
Hematoxylin and Eosin (H&E) Staining
For histological examination, tissue sections were deparaffinized in xylenes, twice for 3 minutes each, rehydrated (15 dips in 100% EtOH, 15 dips in 95% EtOH, and 10 dips in 70% EtOH), and rinsed for 3 minutes in running tap water. Sections were stained with Mayer’s modified hematoxylin (Newcomer Supply, Middleton, Wisc) for 5 minutes, rinsed in running tap water for 2 minutes, and stained blue in phosphate-buffered saline plus Tween (PBS-T) with 0.5% ammonium acetate (Sigma Aldrich, St. Louis, Mo) for 1 minute. Sections were counterstained with eosin (Sigma Aldrich) for 3 minutes and rinsed in running tap water for 2 minutes. Slides were then dehydrated (3 dips in 70% EtOH, 5 dips in 95% EtOH, twice in 100% EtOH, for 3 minutes each, and twice in xylenes, for 3 minutes each), and cover slips were adhered to slides with Cytoseal XYL mounting media (VWR Scientific, South Plainfield, NJ). The PCNA-positive focal regions were selected on these sections and their morphology was examined.
Differential Interference Contrast (DIC) Microscopy
To determine whether the cells observed in the PCNA-positive focal regions were associated with other histological phenomena (eg, basophilic foci, tumors), 2 representative groups, the 4-week EtOH vehicle control and BZ low-dose group, of PCNA-stained sections were observed and compared using DIC microscopy. PCNA-stained cells on glass slides were observed using the Nikon-FXA epifluorescent research microscope with a 100-W mercury light source (Nikon, Tokyo, Japan). The red (propidium iodide) fluorescence was observed using a G-2A filter cassette to identify dead cells, and the blue (Hoechst 33342) fluorescence was observed using a UV-1A filter cassette to differentiate apoptotic cells from live cells. Immediately following fluorescence detection of red (dead), dim blue (live), or bright blue (apoptotic) cell samples with the epifluorescent microscope, the cells were observed using DIC microscopy. DIC microscopy was used to identify and confirm additional morphological characteristics of live, necrotic, and apoptotic cells.
Statistical Methods and Analysis:
The PCNA PI data contained several outliers and did not have a normal distribution as revealed by the lack of linearity in a Q-Q plot of studentized residuals (data not shown). 31,32 To allow for inclusion of outliers and to deal with the lack of a normal distribution of the data, a robust nonparametric statistical analysis of the data was performed. Therefore, a Wilcoxon’s robust 2-way analysis for time, treatment effects, and their interaction was performed. The discrete nature of the data and the presence of zero values in the raw data set prohibited the robust Wilcoxon 2-way analysis from yielding a true statistical analysis. To overcome this difficulty, a value between –0.05 and 0.05 was randomly added to all of the actual raw TI values to create nonzero “noise” in the data set; this is referred to as smoothing or jittering the data. 33 To ensure that this manipulation of the data did not significantly change the true statistical values resulting from the raw data, a comparison of the raw data and the adjusted data, using the least squares method of 2-way analysis, was used.
Results
PCNA Labeling for Cellular Proliferation
PCNA staining appeared restricted to the nuclei and varied in the intensity of staining. PCNA-positive staining was widely distributed in some tissue sections, focally located in other tissue sections, or found in a combination of these 2 patterns. The PI means for each dose group along with standard deviations for each treatment were determined (Table 2 ). The number of PCNA-positive cells varied greatly between dose and time groups (Figure 1 ). The overall effects of exposure time intervals were significant at a P value of 3.14e-05 and F statistic of 11.2, whereas chemical treatments were significant at a P value of <1.0e-06 and F statistic of 8.39 (the P value was so small the statistical software program assigned it a zero). The interaction between times and chemical treatments was significant at a P value of 3.42e-05 and F statistic of 3.64. Further statistical analysis was conducted on the differences between controls and treatments by using Fisher’s paired least significant difference test. Statistically significant differences (>95% confidence) in control–treatment or treatment–treatment pairs are reported (Table 3 ). No significant differences were observed between the no-treatment control and EtOH vehicle control.
Effect of Dietary Exposure to 2AF and/or BZ on the Cellular Proliferation (PCNA Index Mean), Apoptosis (TUNEL Index Mean), and Net Cell Growth (PI-TI Index Mean) of G affinis Liver Cells
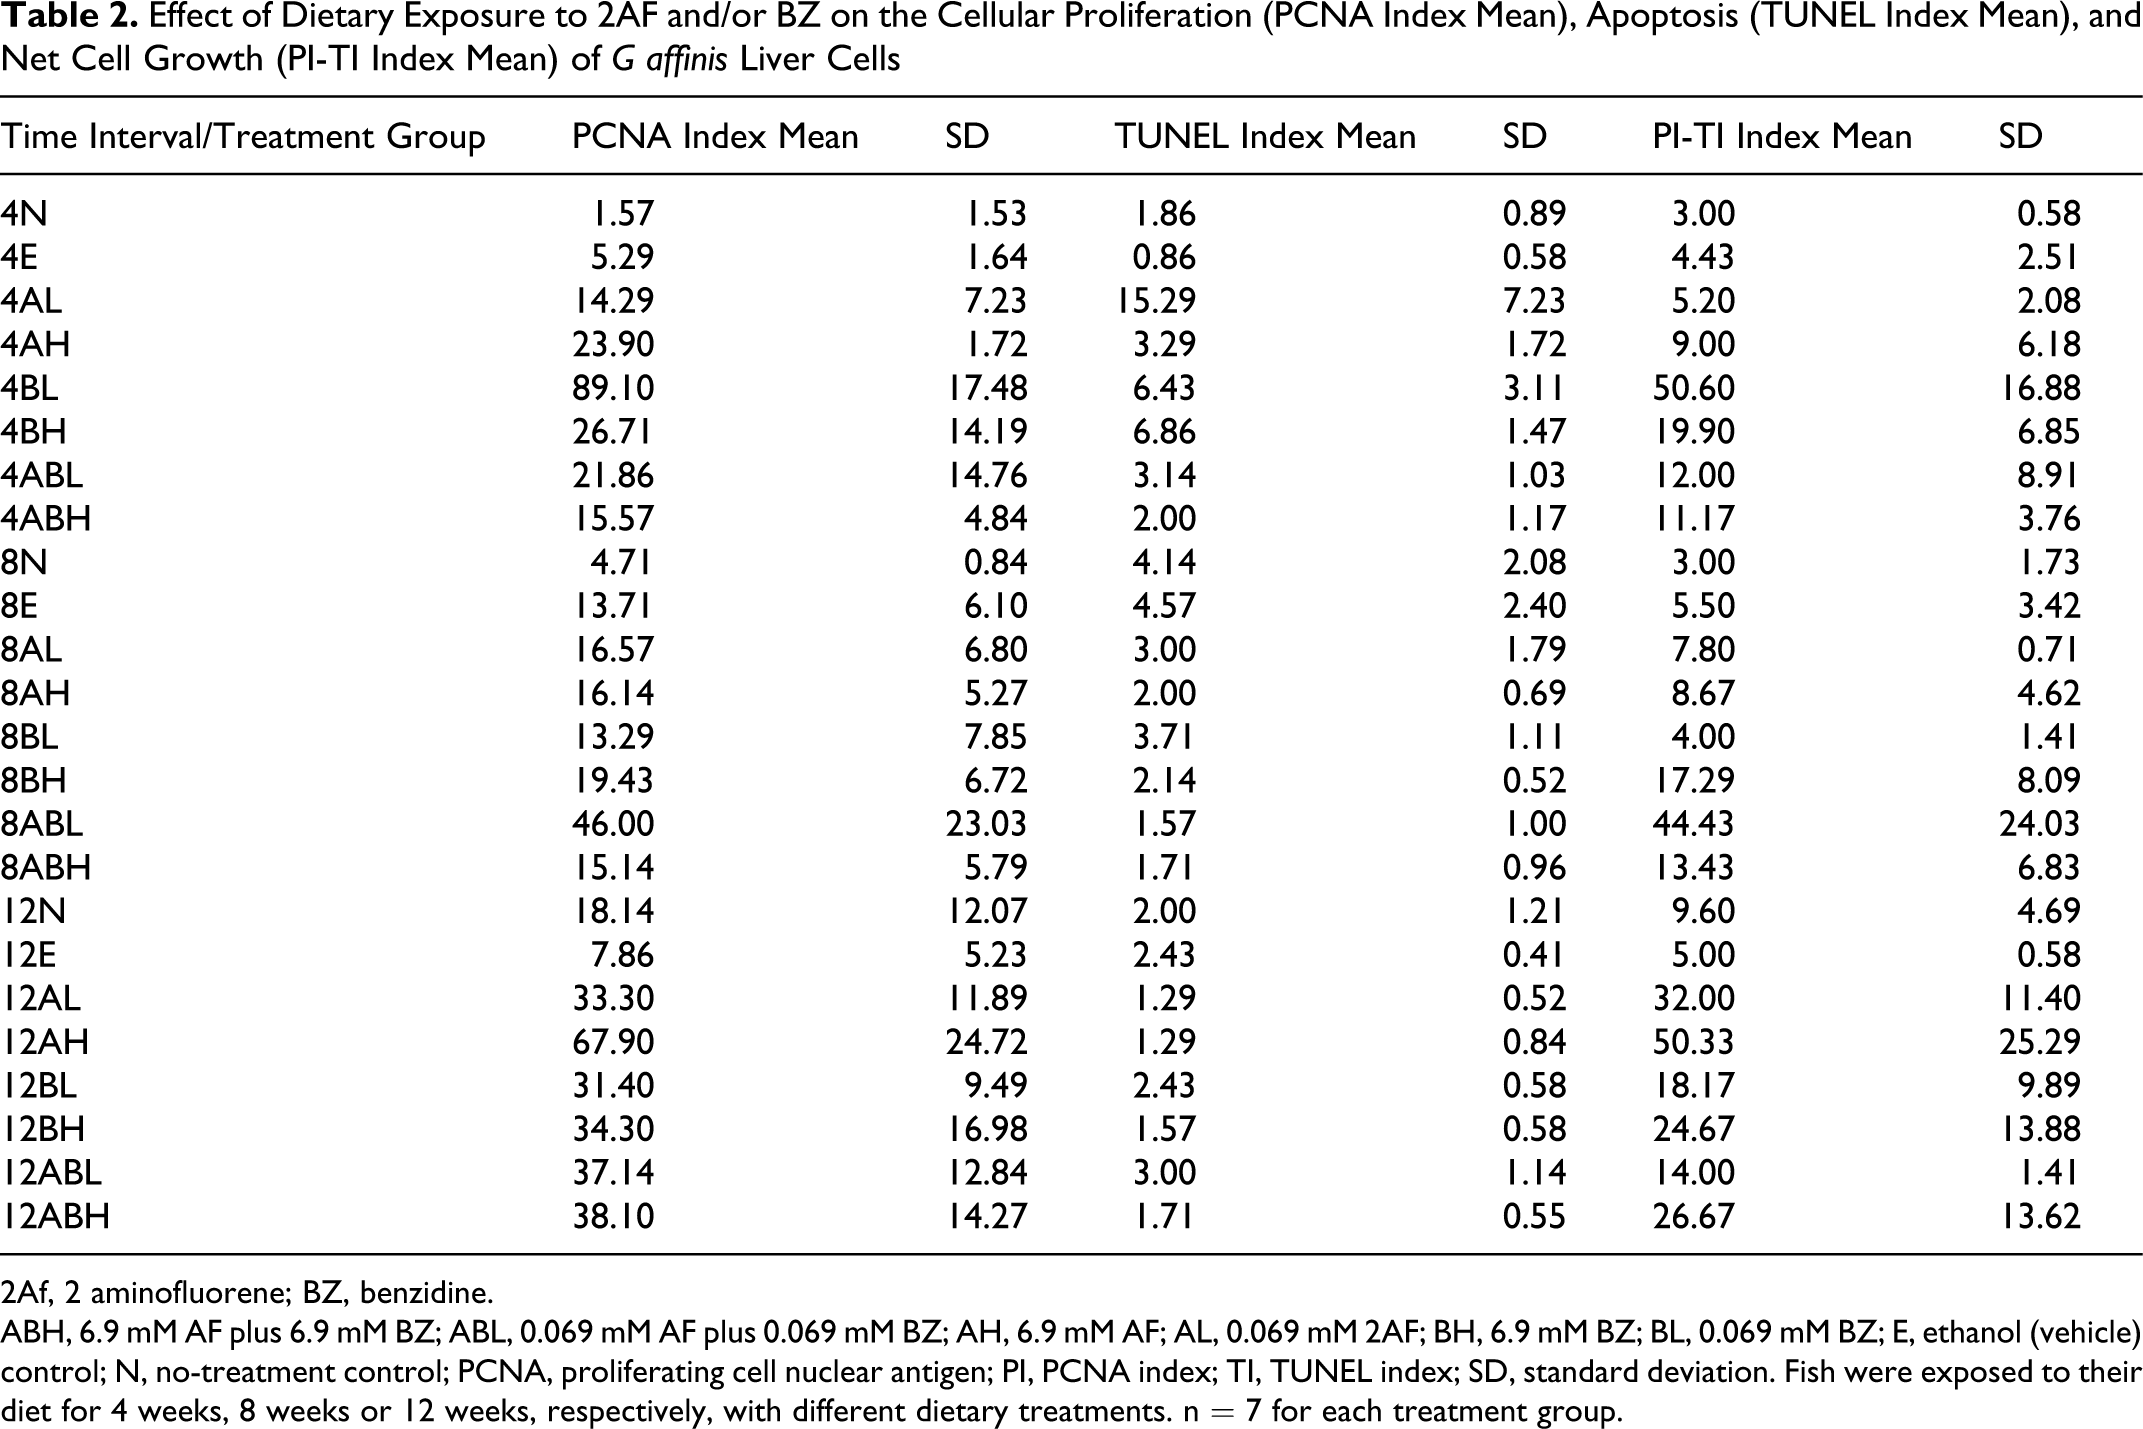
2Af, 2 aminofluorene; BZ, benzidine.
ABH, 6.9 mM AF plus 6.9 mM BZ; ABL, 0.069 mM AF plus 0.069 mM BZ; AH, 6.9 mM AF; AL, 0.069 mM 2AF; BH, 6.9 mM BZ; BL, 0.069 mM BZ; E, ethanol (vehicle) control; N, no-treatment control; PCNA, proliferating cell nuclear antigen; PI, PCNA index; TI, TUNEL index; SD, standard deviation. Fish were exposed to their diet for 4 weeks, 8 weeks or 12 weeks, respectively, with different dietary treatments. n = 7 for each treatment group.
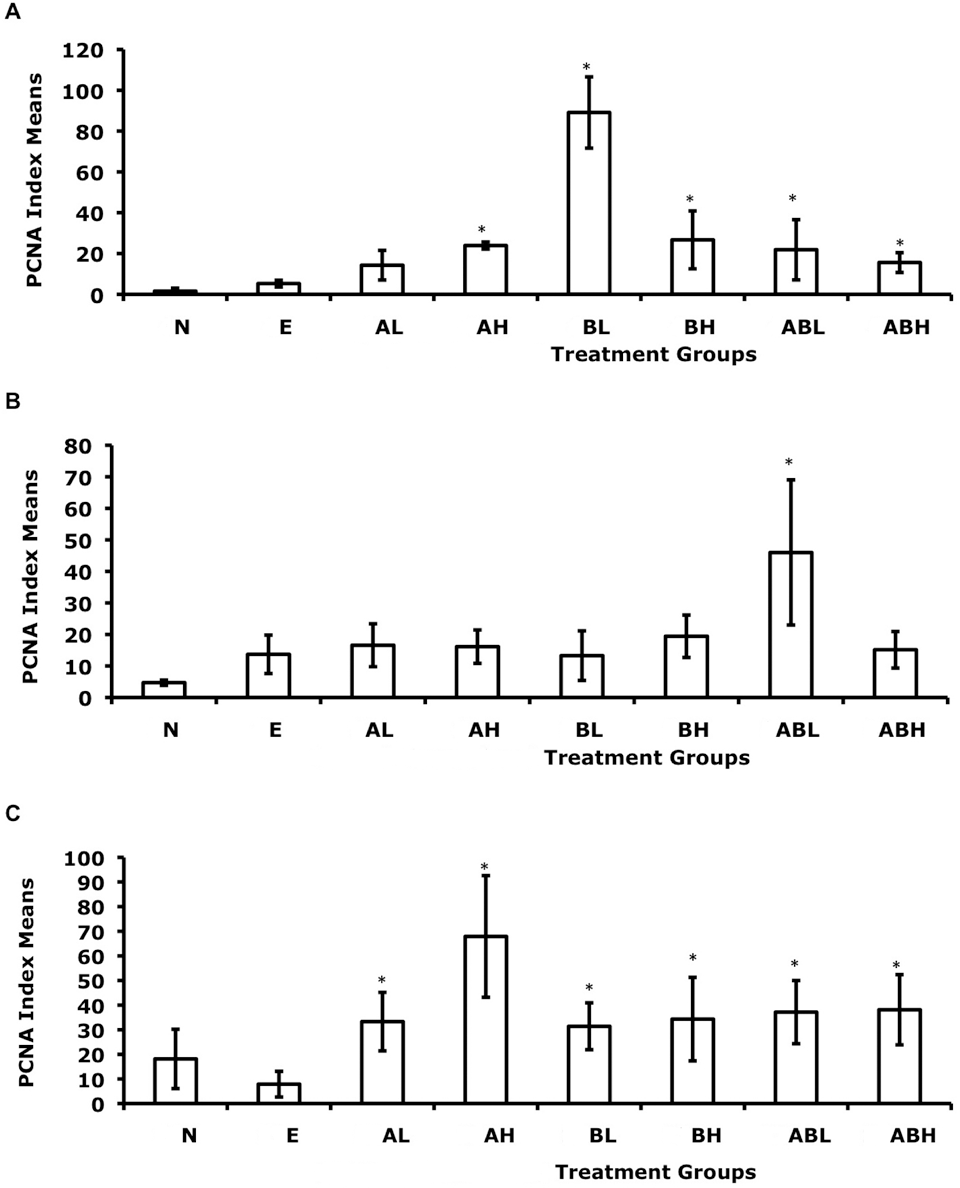
Effect of dietary exposure to 2-aminofluorene (AF) and/or benzidine (BZ) on the cellular proliferation (PCNA index means) of G affinis liver cells. Fish were exposed to their diet for (A) 4 weeks, (B) 8 weeks, or (C) 12 weeks. The different dietary treatments consisted of N, no-treatment control; E, ethanol (vehicle) control; AL, 0.069 mM 2AF; AH, 6.9mM AF; BL, 0.069 mM BZ; BH, 6.9 mM BZ; ABL, 0.069 mM AF plus 0.069 mM BZ; and ABH, 6.9 mM AF plus 6.9 mM BZ. Error bars indicate standard deviations. n = 7 for each treatment group. *P < .05.
Proliferating Cell Nuclear Antigen: Fisher’s Paired Least Significant Differences
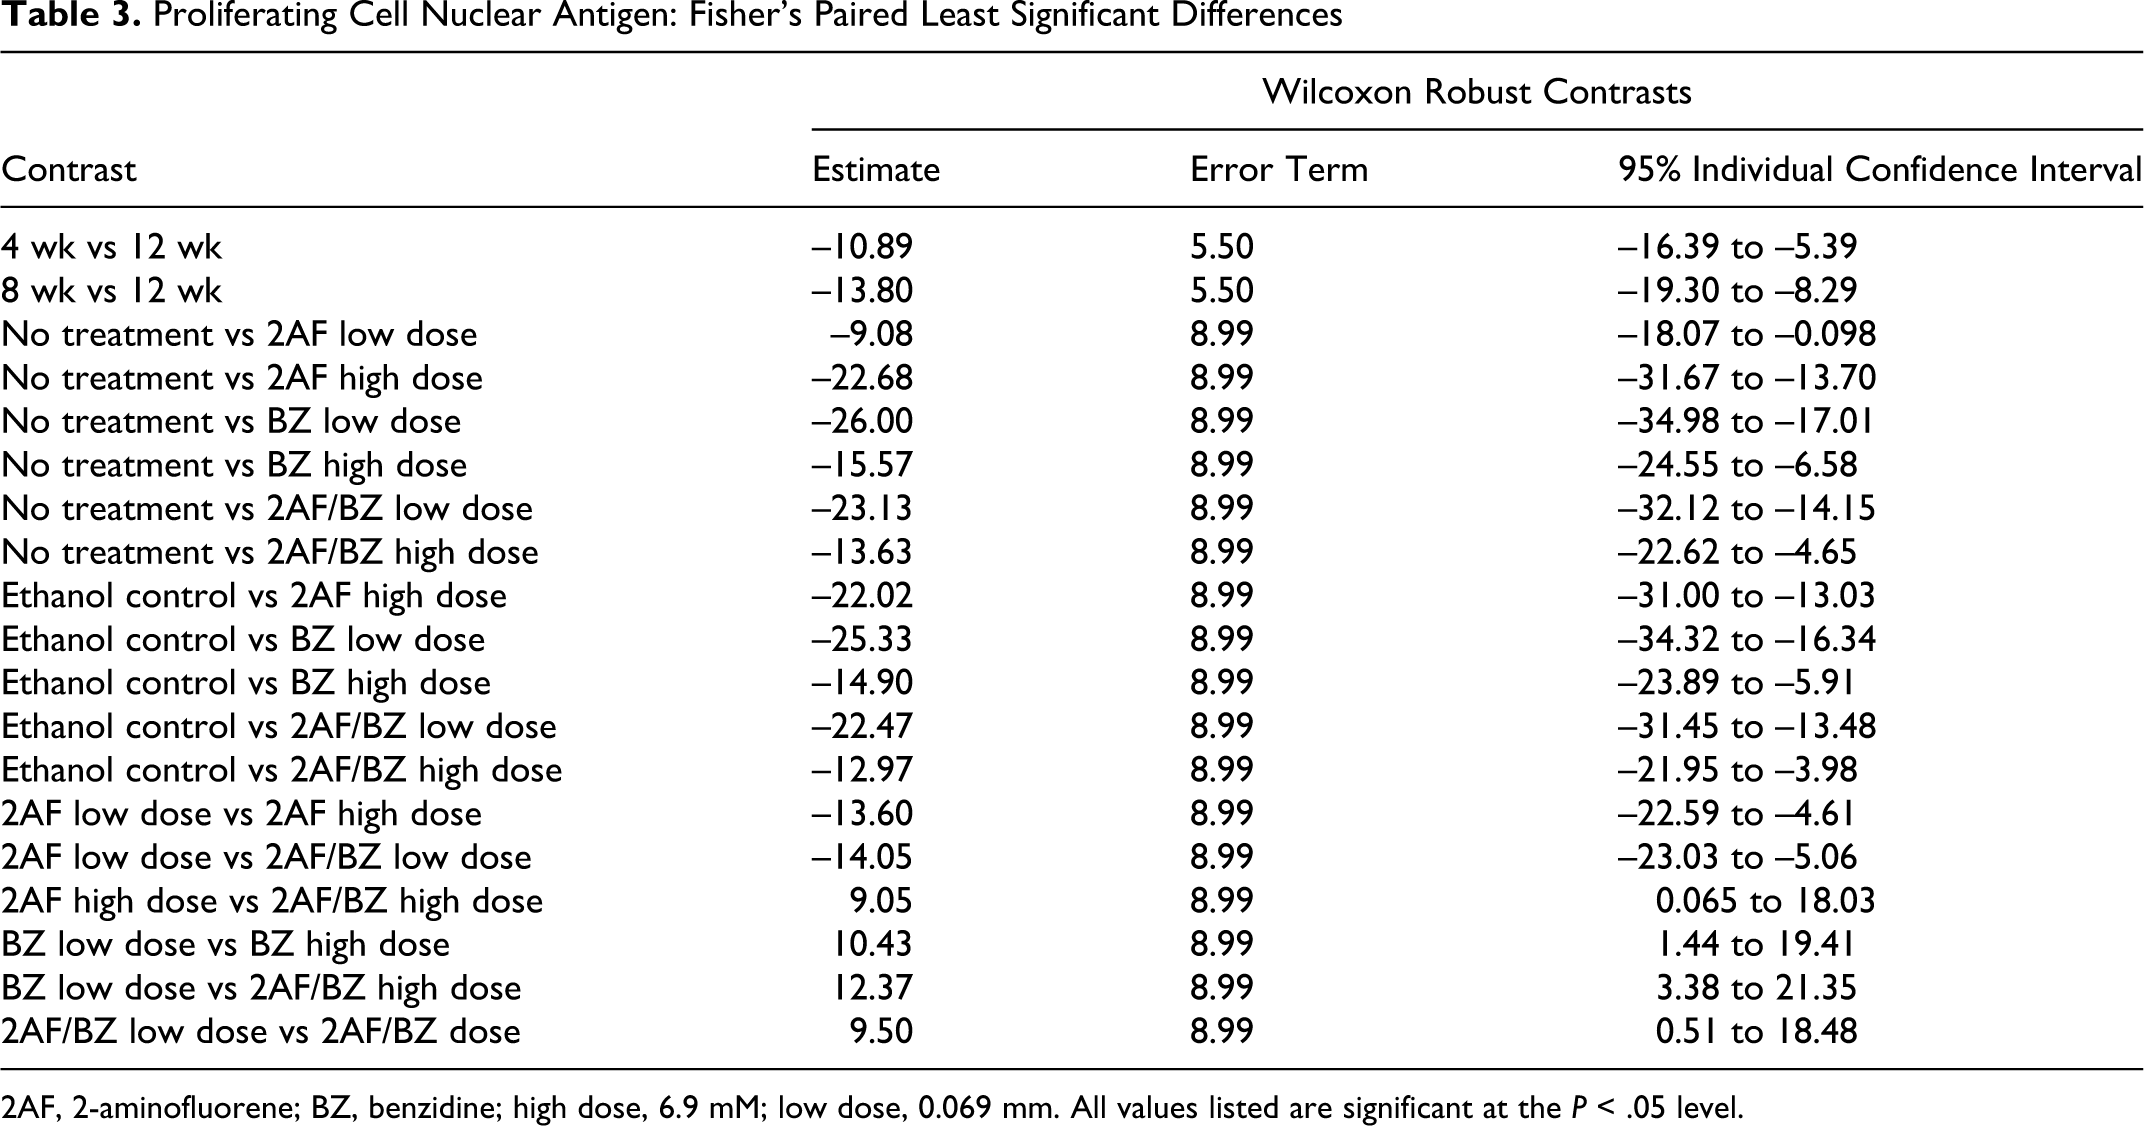
2AF, 2-aminofluorene; BZ, benzidine; high dose, 6.9 mM; low dose, 0.069 mm. All values listed are significant at the P < .05 level.
TUNEL Labeling for Measurement of Cellular Death
TUNEL staining was localized in the nuclei and stained at varying intensities. TUNEL-positive cells were widely distributed in most tissue sections with rare focal occurrences. The TI means for all exposures along with standard deviations for each treatment group were calculated (Table 2). TI-positive means and their standard deviations are represented in Figure 2 . More than 75% of the 168 tissue sections examined exhibited a low TI (0-3), whereas 20% exhibited TIs from 4 to 12 and only 5% had TIs between 12 and 74. These counts resulted in discrete data clusters. The upper 5% of the TI values resulted in outliers as plotted in the box plot of Wilcoxon studentized residuals. These data did not have a normal distribution as indicated in the nonlinear Q-Q plot of studentized residuals (data not shown). 31,33 For the overall effects of exposure time, the least squares P value was not significant (.0586; F statistic 2.89). For chemical treatment effects, the P value was also not significant (0.399; F statistic 1.05) nor was the interaction of time and chemical treatment (P value 0.226; F statistic 1.28). The least squares 2-way analysis was comparable to the adjusted (jittered) data statistics: P value of .0598 and F statistic of 2.88 for time effects; P value of .397 and F statistic of 1.05 for treatment effects and P value. Because there were no significant changes to the data, we continued our analysis with the adjusted data.
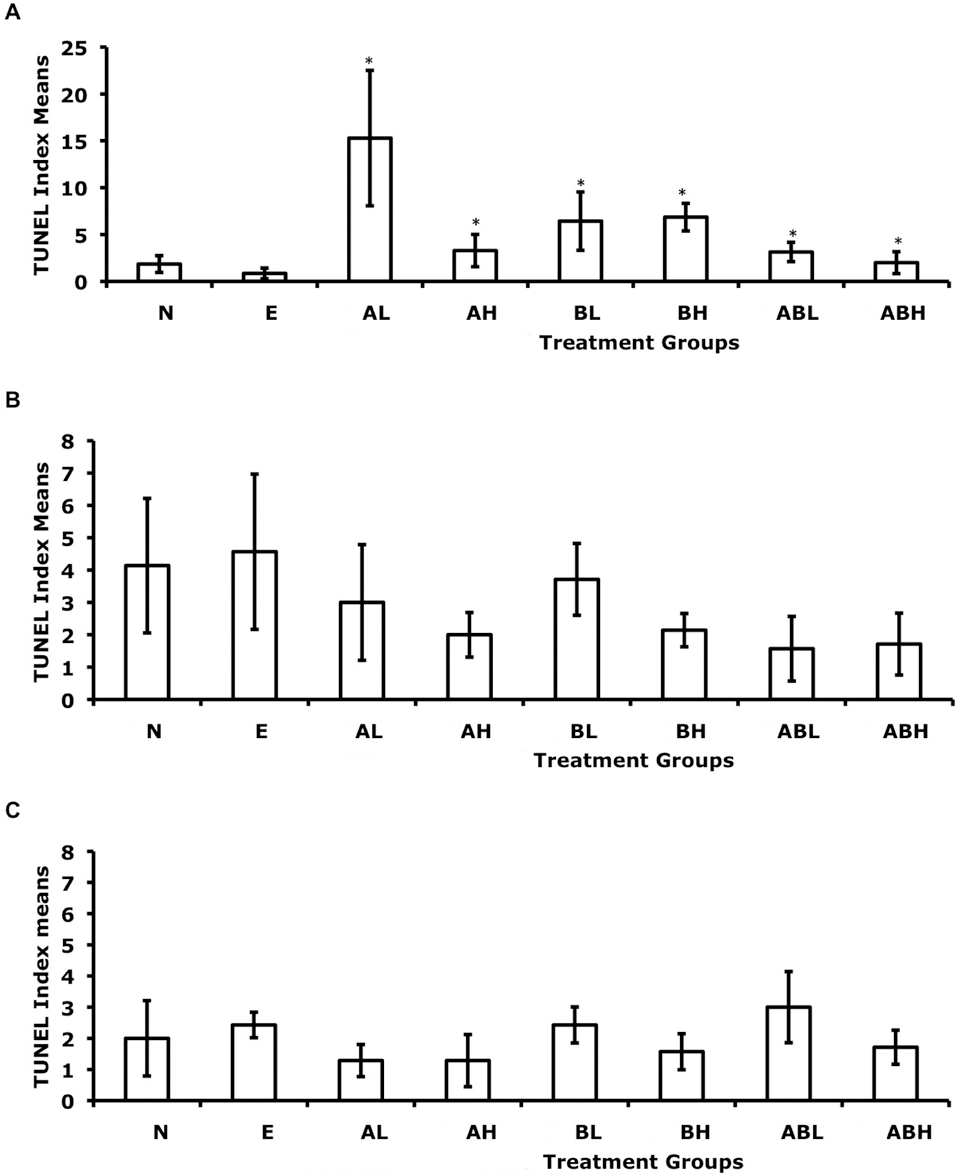
Effect of dietary exposure to 2-aminofluorene (AF) and/or benzidine (BZ) on the apoptosis (TUNEL index means) of G affinis liver cells. Fish were exposed to their diet for (A) 4 weeks, (B) 8 weeks, or (C) 12 weeks. The different dietary treatments consisted of N, no-treatment control; E, ethanol (vehicle) control; AL, 0.069 mM 2AF; AH, 6.9 mM AF; BL, 0.069 mM BZ; BH, 6.9 mM BZ; ABL, 0.069 mM AF plus 0.069 mM BZ; and ABH, 6.9 mM AF plus 6.9 mM BZ. Error bars indicate standard deviations. n = 7 for each treatment group. *P < .05.
Wilcoxon 2-way analysis of the adjusted data yielded statistical significance for chemical treatment effects with a P value of .00556 and F statistic of 3.01 and its interaction with time (P value .0248; F statistic 1.96) but not for the time effects alone (P value .219; F statistic 1.53). This indicates that treatments were statistically significant as was their interaction with time but that time alone did not have a statistically significant effect on cell death. The Fisher’s protected least square differences test was conducted to determine statistically significant differences between time intervals and between chemical treatment groups (Table 4 ). No significant contrasts were observed between time intervals. No significant contrasts were observed between the no-treatment control and EtOH vehicle control.
TUNEL: Fisher’s Paired Least Significant Differences
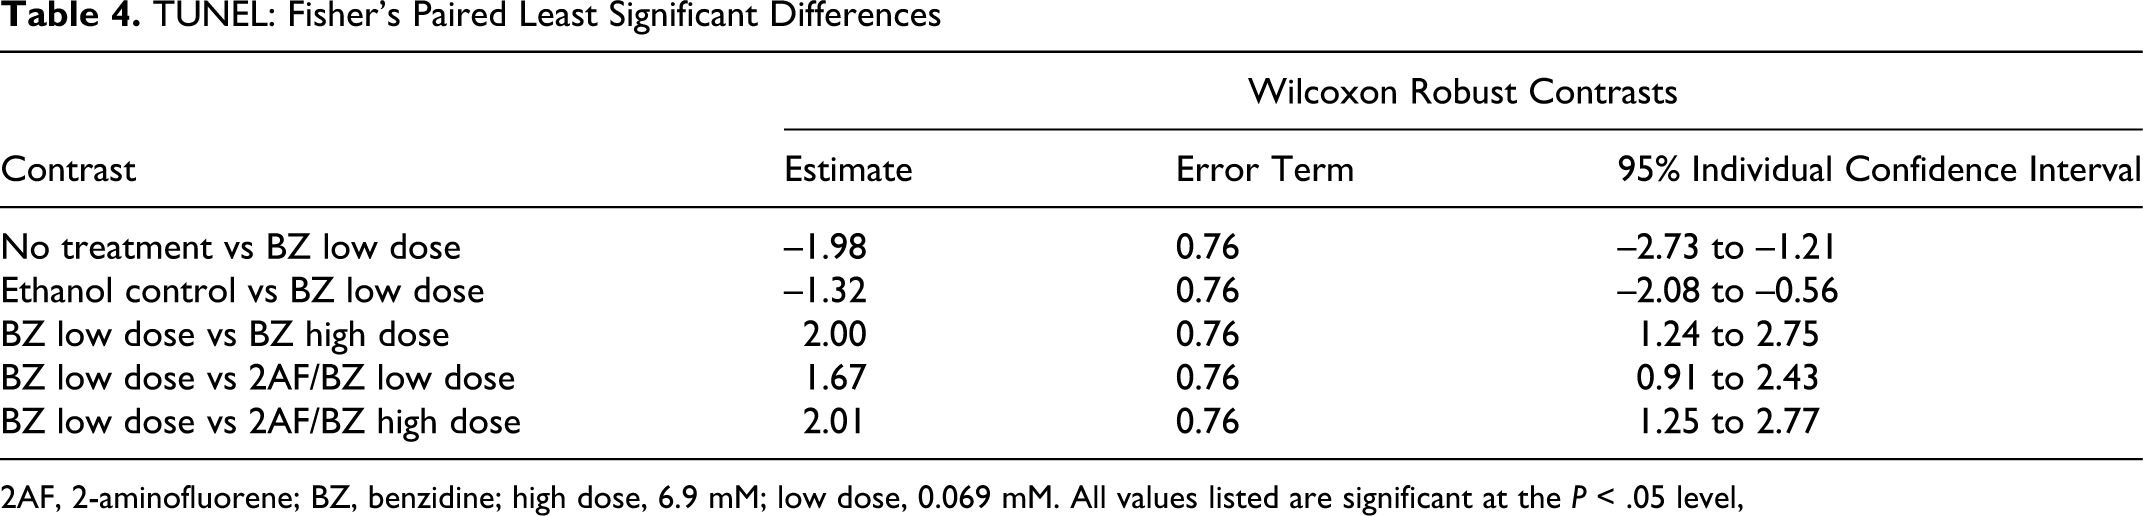
2AF, 2-aminofluorene; BZ, benzidine; high dose, 6.9 mM; low dose, 0.069 mM. All values listed are significant at the P < .05 level,
To summarize, results of the PCNA immunohistochemistry assay in the current study indicated significant increases in proliferation that were associated with exposure intervals, treatment levels, and their interaction. Although significant contrasts were observed in the higher doses of BZ and 2AF/BZ, indicating increased proliferation when contrasted with the controls, the greatest contrasts compared with controls were for the low doses of BZ (16-fold increase at 4 weeks) and its combination 2AF/BZ (7-fold increase at 8 weeks). With 2AF at the high dose, the greatest contrast with controls was observed (7-fold increase at 12 weeks).
With regard to TUNEL detection for assaying cell death, treatments were statistically significant as well as their interaction with time when testing with Wilcoxon’s 2-way analysis. However, when we used Wilcoxon R contrasts to test pairwise differences between treated groups and control groups, only the low-dose BZ exposure had statistical significance. Although the low dose of BZ was the only treated group with statistical significance when contrasted with the control groups, it is worth noting that all treated groups at 4 weeks had 2.3- to 17.8-times increases in TUNEL-positive cells relative to the EtOH control. By 8 and 12 weeks, this initial increase declined to 1.2 to 2.9 times fewer and 0.81 to 1.55 times fewer TUNEL-positive cells relative to the EtOH control, respectively. This early transient increase in cell death has also been observed in rodent studies. 17,19
Net Cellular Growth
Because it is important to know the balance of viable functioning cells in the liver, the ratio of cellular proliferation and cell death was used as a qualitative indicator of net cellular growth. In this study, the difference between cellular proliferation index (PI) and cellular death index (TI) was calculated and reported (Table 2 and Figure 3 ). Results from the PI-TI index contained unexpected outliers and did not have a normal distribution; therefore, the nonparametric robust Wilcoxon 2-way analysis of time and treatment effects and interaction was used for statistical analysis. Results show that time intervals and treatments along with their interaction were highly statistically significant, with P values of 4.79e-5, 1.79e-6, and .0078 and F statistics of 10.7, 6.3, and 2.3, respectively. The observed statistically significant contrasts (>95% confidence level) are reported (Table 5 ). No significant contrasts were noted between the no-treatment control and the EtOH vehicle control.
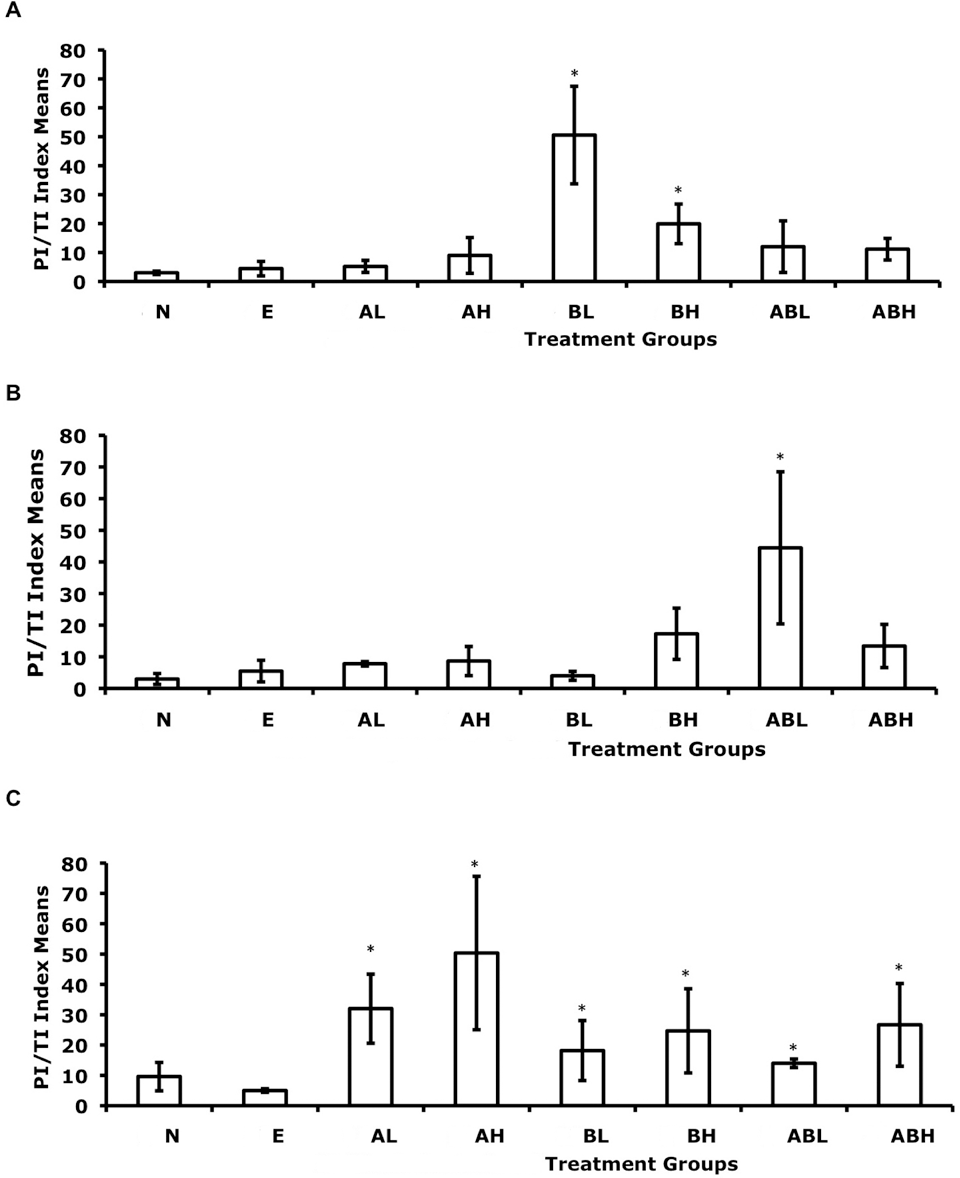
Effect of dietary exposure to 2-aminofluorene (AF) and/or benzidine (BZ) on the net cell growth (PI-TI index means) of G affinis liver cells. Fish were exposed to their diet for (A) 4 weeks, (B) 8 weeks, or (C) 12 weeks. The different dietary treatments consisted of N, no-treatment control; E, ethanol (vehicle) control; AL, 0.069 mM 2AF; AH, 6.9 mM AF; BL, 0.069 mM BZ; BH, 6.9 mM BZ; ABL, 0.069 mM AF plus 0.069 mM BZ; and ABH, 6.9 mM AF plus 6.9 mM BZ. Error bars indicate standard deviations. n = 7 for each treatment group. *P < .05. PI-TI
TI-PI Index: Fisher’s Paired Least Significant Differences
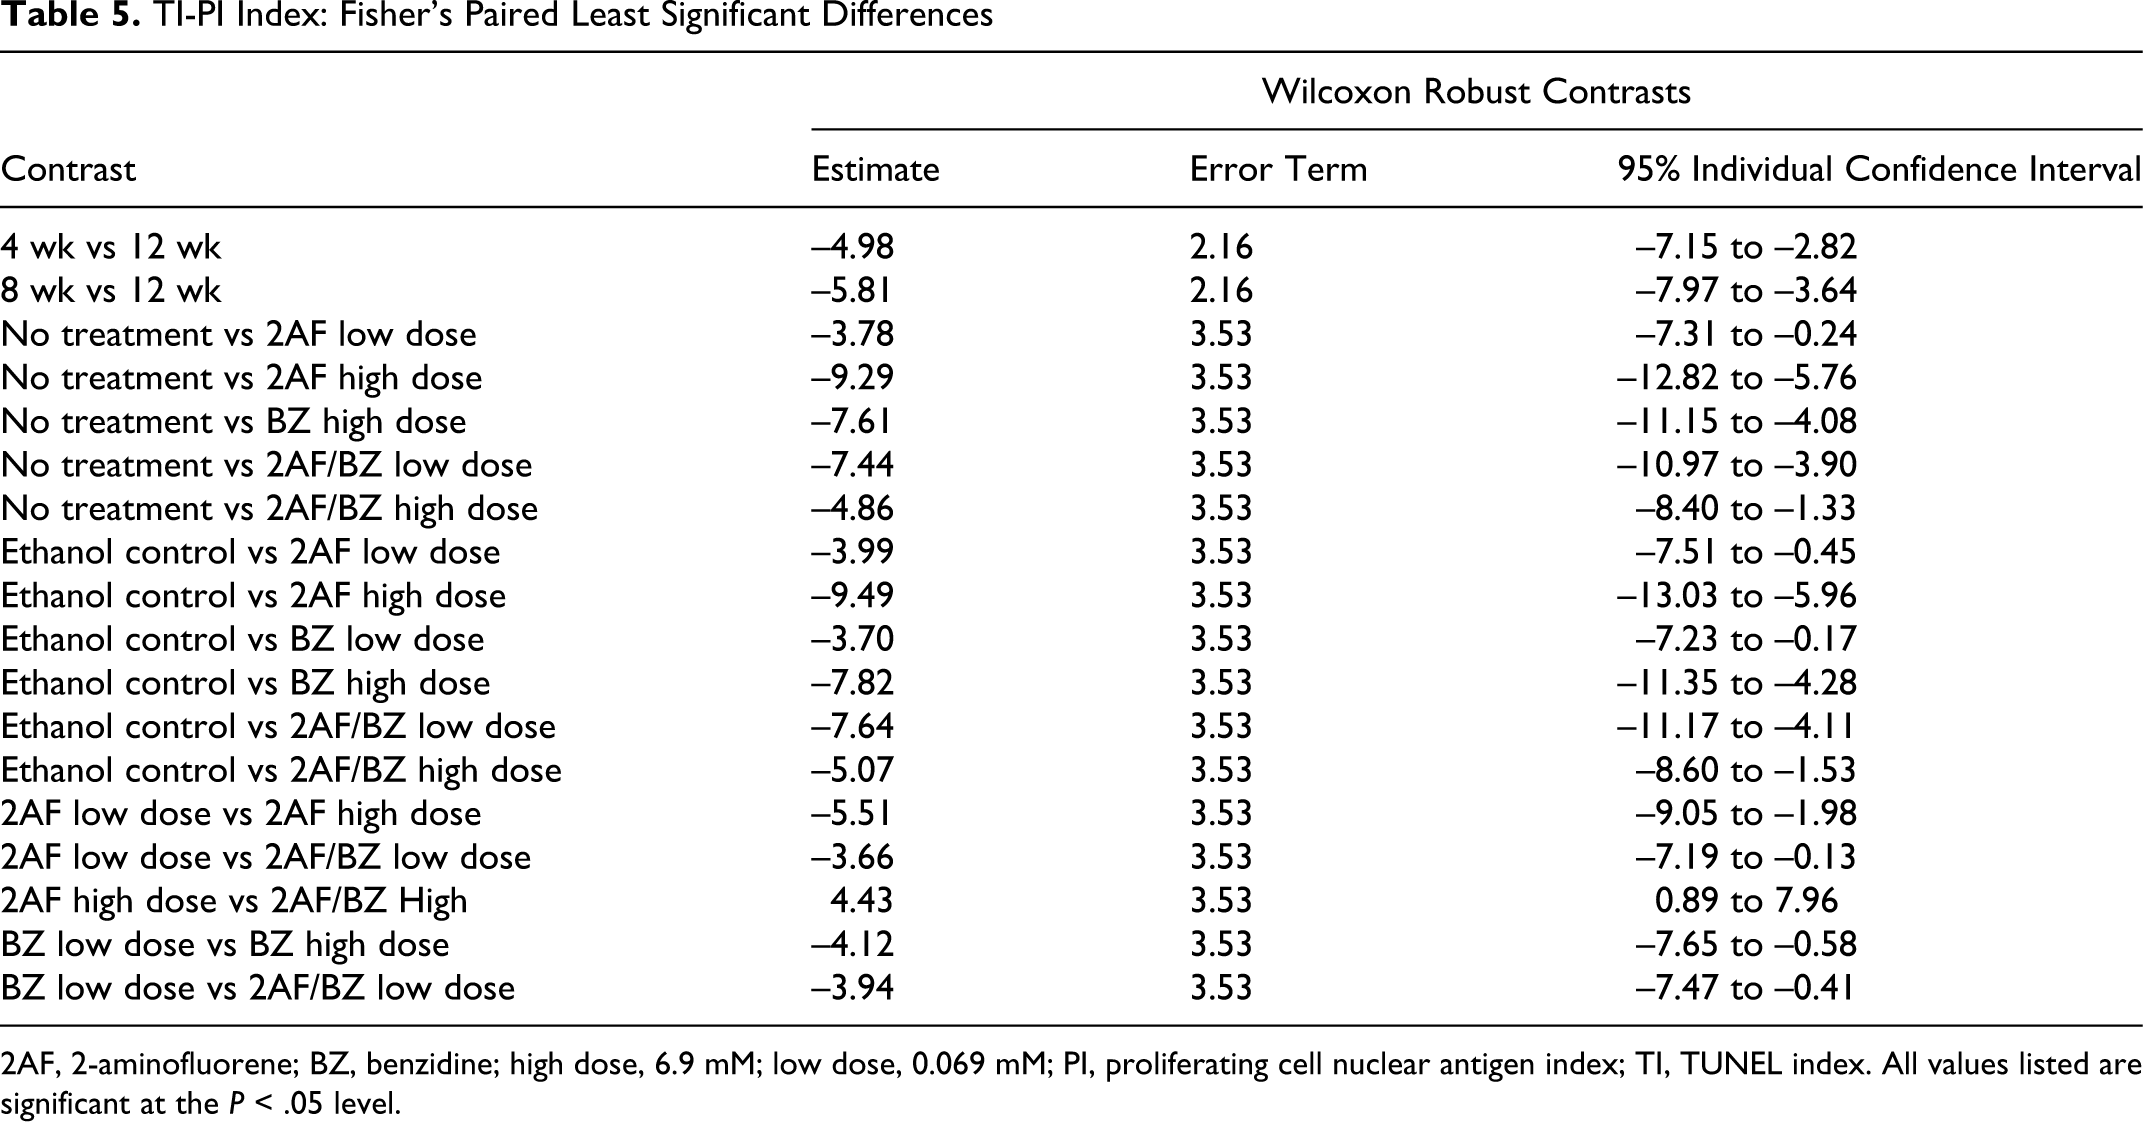
2AF, 2-aminofluorene; BZ, benzidine; high dose, 6.9 mM; low dose, 0.069 mM; PI, proliferating cell nuclear antigen index; TI, TUNEL index. All values listed are significant at the P < .05 level.
Liver Histopathology
Hepatocytes are typically arranged in tubules composed of 5 to 7 hepatocytes in a concentric arrangement. 34 Histopathological examination of H&E-stained G affinis liver sections in both the controls and treated groups revealed varying degrees of vacuolation, although vacuolation was much more prominent in the arylamine-exposed groups than in the controls. In some cases, hepatocytes were mildly to moderately expanded by clear intracytoplasmic vacuoles, often with the nucleus pushed to 1 side of the cell (consistent with macrovesicular steatosis). Pigmented macrophage aggregates (PMAs) were observed in both the controls and treated groups but were also more frequently observed in the treated groups (Figure 4 ). Scattered nonpigmented granulomas were identified in both controls and treated groups but were very rare in the control groups. Although difficult to differentiate from PMAs at times, granulomas contained densely packed, mostly nonpigmented epithelioid macrophages, sometimes accompanied by small numbers of lymphocytes and fibroblasts.
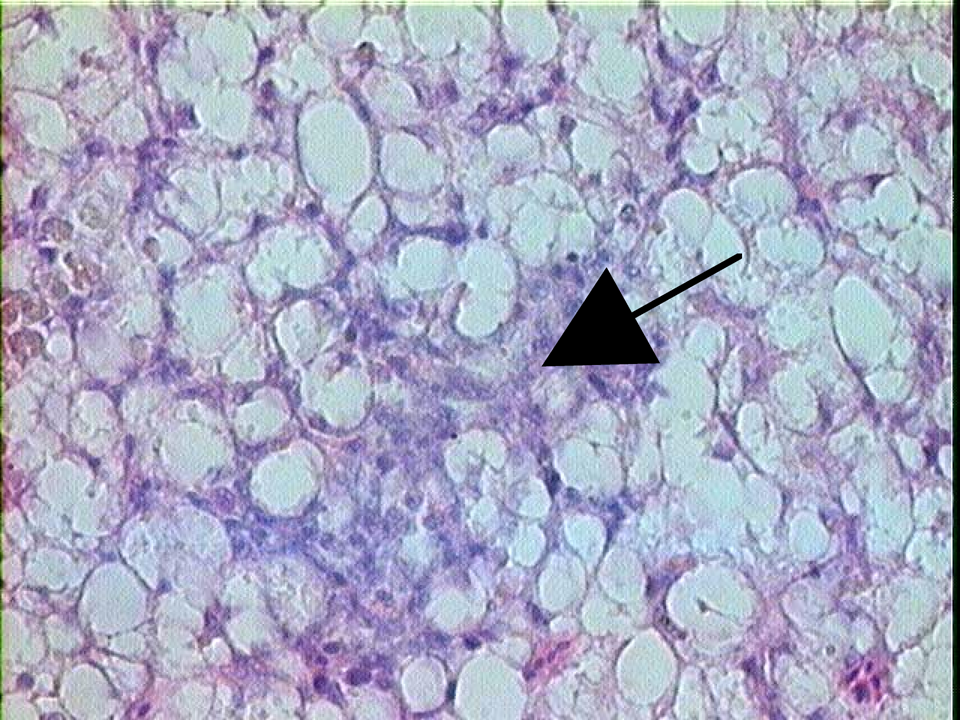
H&E-stained liver section of G affinis after 8 weeks of exposure to 6.9 mM 2-aminofluorene. Arrow indicates a pigmented macrophage aggregate (magnification ×100).
The occurrence or prevalence of oval- to spindle-shaped basophilic foci that were observed in the control and treated groups of G affinis was assessed (Table 6 ). An ANOVA of these data indicate that differences in time were not significant whereas differences between treatment groups were significant (F = 2.692, P = .0478). An example of an oval- to spindle-shaped basophilic focus can be seen in Figure 5 . These foci were comprised of basophilic aggregates of oval- to spindle-shaped cells typically located around small blood vessels and without compression or invasion of surrounding tissue. Individual cells displayed mild to moderate anisocytosis and ranged from approximately 7 to 12 μm in greatest diameter. These cells had scant cytoplasm and hyperchromatic nuclei with relatively dense, evenly dispersed chromatin (Figure 6 ). The spindle cell tumor identified at 8 weeks in the low-dose BZ-exposed fish consisted of a small unencapsulated mass of neoplastic spindle-shaped cells that formed a dense bundle or whirl around a small blood vessel. No mitotic figures were noted. The morphology of the PCNA-positive focal sites in the treated groups revealed a higher nuclear to cytoplasmic ratio. Oval- to spindle-shaped cells were smaller and more condensed than the surrounding parenchyma, demonstrating that these cells in the basophilic foci were proliferating cells in the foci examined.
Histopathological Examination of G affinis Livers After Exposure to 2AF and BZ
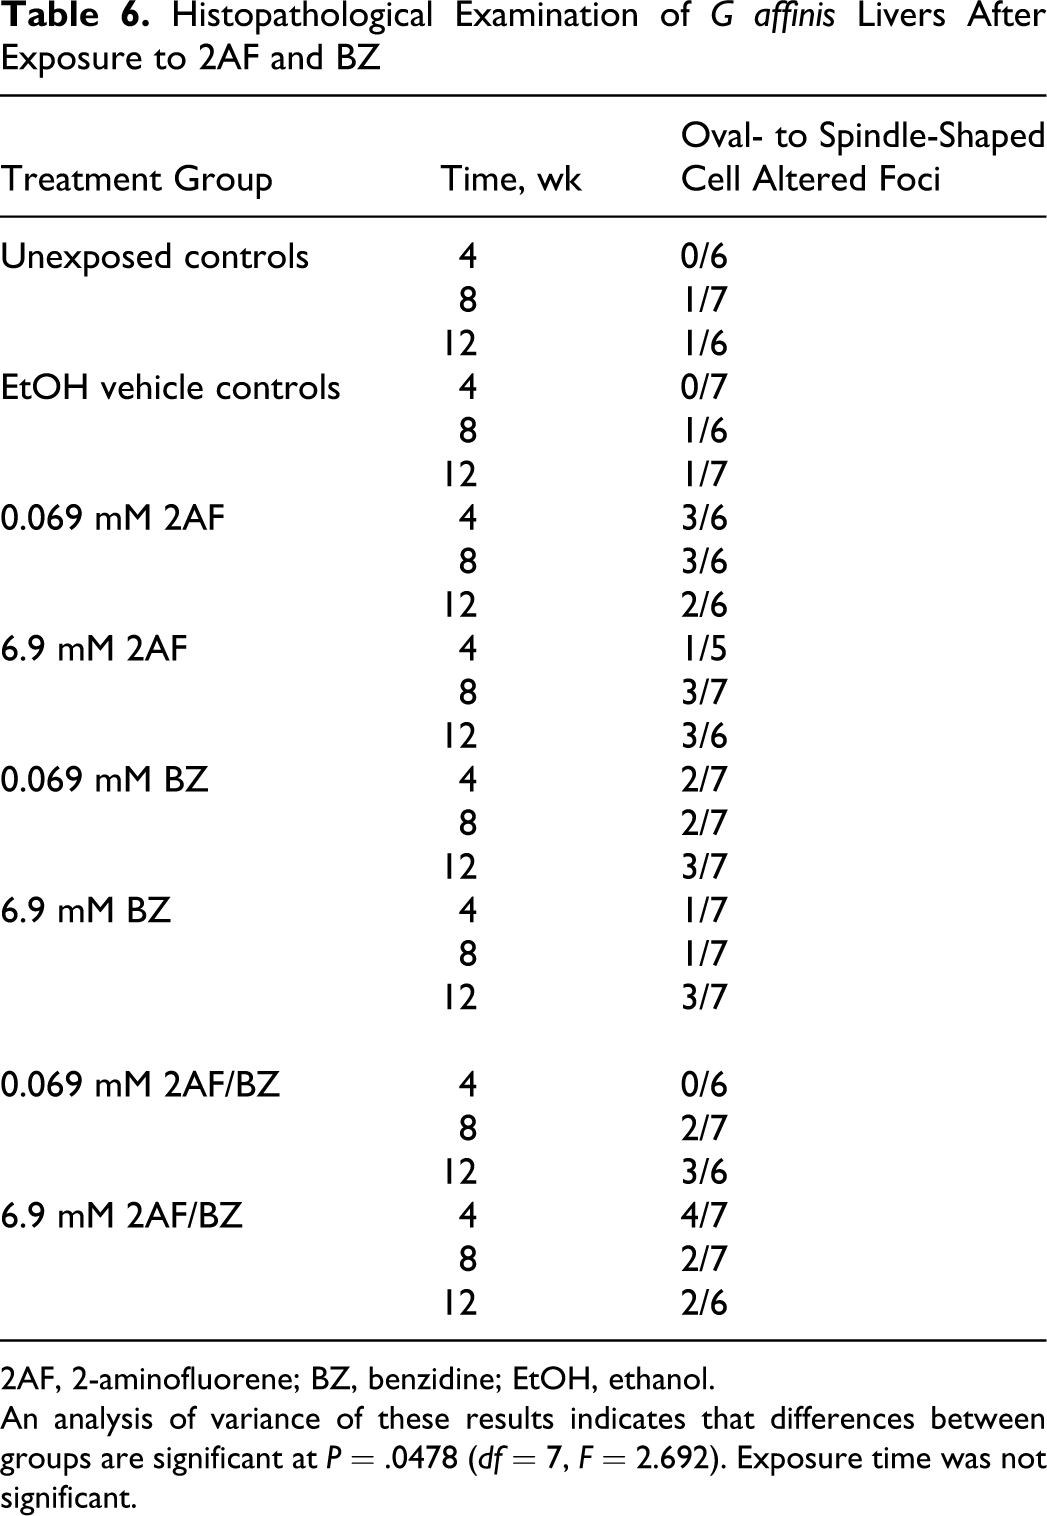
2AF, 2-aminofluorene; BZ, benzidine; EtOH, ethanol.
An analysis of variance of these results indicates that differences between groups are significant at P = .0478 (df = 7, F = 2.692). Exposure time was not significant.
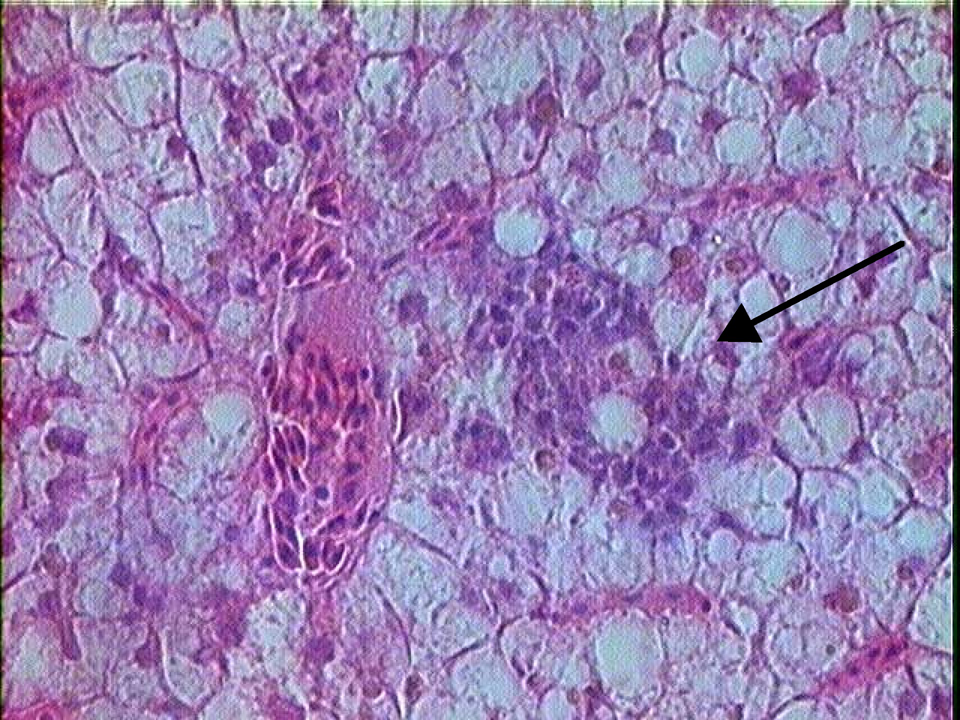
H&E stained liver section of G affinis after 12 weeks of exposure to 6.9 mM 2-aminofluorene. Arrow indicates basophilic foci of spindle/oval cell proliferation (magnification ×100).
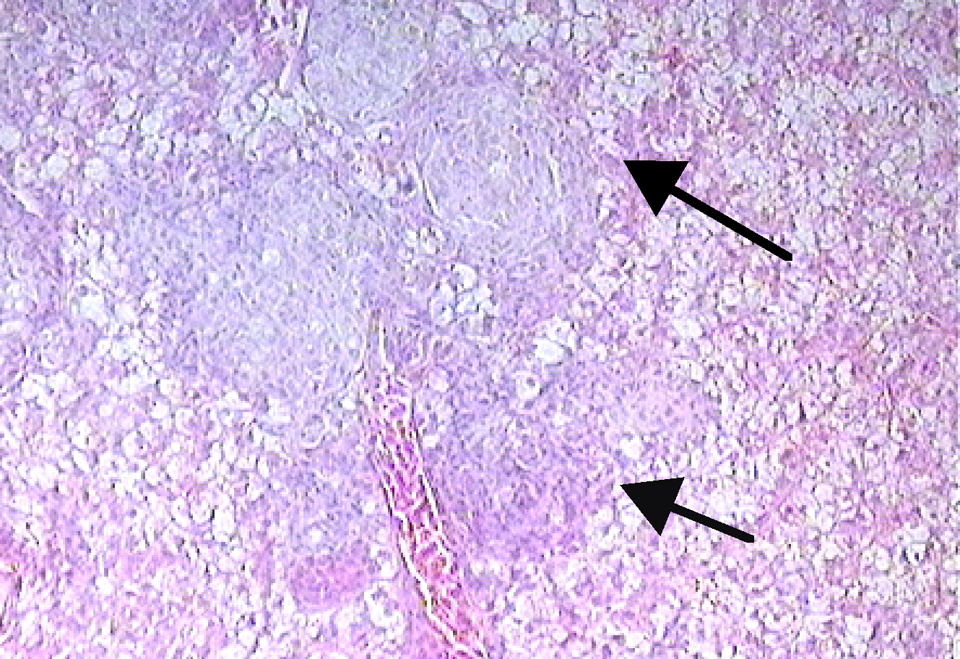
H&E stained liver section of G affinis after 8 weeks of exposure to 0.069 mM 2-aminofluorene. Arrows indicate a spindle cell tumor (magnification ×100).
Discussion
A hallmark of tumor formation in vertebrate systems is unregulated cell growth. 35 –37 This is evidenced in numerous studies examining the proliferative rates of neoplastic tissue. Several PCNA immunoreactivity studies have been conducted on human livers exhibiting chronic liver diseases and hepatocellular carcinomas. 16,35 –42 Normal liver tissue exhibited minimal PCNA levels, whereas hepatocellular carcinomas (HCCs) exhibited increasing PCNA levels that corresponded with tumor grade. For example, 1 study indicated that the PCNA levels in HCC grades 1, 2, 3, and 4 were 12.2%, 17.5%, 53.7%, and 83.9%, respectively. 35 In another study, normal liver tissue had PCNA levels of 0.78%, whereas the HCC of Edmondson’s type I, II, and III revealed PIs of 4.83%, 6.65%, and 30.6%, respectively. In a recent study using adult G affinis exposed to 10 mg/L methylazoxymethanol acetate (MAM) in ambient aquarium water for 2 hours, then allowed to grow in clean water for up to 24 weeks, the PI in the liver increased from a background of less than 4% to 18.7% by 2 weeks post exposure and 23.3% at 8 weeks post exposure. 43 The relatively high dose of MAM caused more severe hepatocellular necrosis and apoptosis than in the present study, leading to both regenerative hyperplasia and a multiplicity of neoplasms. In the fish Fundulus grandis, the potent carcinogens 2AF and N-methyl-N′-nitro-N-nitrosoguanidine were administered and the PCNA levels were assayed. 36 Exposed fish had significantly elevated liver PCNA levels in both exposure groups (P = .003 for both compounds). Studies with rats exposed to 2-acetyl-aminofluorene (2AAF) as an initiator, promoter, or both demonstrate apoptotic cell death, regenerative proliferation, morphological alterations, and tumor formation. 38,44 –49 This progression from apoptosis to tumor formation has also been observed in azo-based dye exposures. 46 –48 Although cell proliferation is a major facet in tumor development, it is also important to consider the regulation of cell growth and cell death. Reductions in the rate of cell death can result in increased cell numbers even in the absence of proliferative changes by suppression of normal cell turnover. 19
The lack of statistically significant contrasts for 2AF at the low dose compared with controls may be due to a lag in response or a gradual increase in PCNA expression. A similar pattern of change in cell proliferation at low doses of 2AAF was reported in rats treated with 50 ppm 2AAF in which proliferation increased at a slower, more gradual rate at the low dose than at the higher doses of 100 ppm to 800 ppm. 44 The proliferative effects of 2AF at 0.069mM (~1 ppm) therefore may be too gradual for statistical significance, the means increased substantially from the 4 and 8 weeks points to 12 weeks.
Early cell death and subsequent increases in proliferation are the subject of several studies of the early proliferative effects of 2AAF in rats. 21,23,38,44,50,51 Evidence shows that 2AAF induces a stress response in which apoptosis is triggered and followed by an adaptive response. 44 The adaptive responses reported consist of altered mitochondrial permeability that transitions into a compensatory regenerative proliferation. 44 One of the most sensitive parameters for this adaptive response in rats was the inhibition of mitochondrial permeability transition pores that are involved in inducing apoptosis. These pores exhibited 40% to 100% inhibition by 8 weeks in a dose-dependent manner. 44,52
The indexes of PI and TI were examined to determine whether the cellular proliferation rates exceeded cell death rates. PI-TI indexes revealed increased cell growth in all treated groups. This finding is consistent with the increased proliferative state and decreased apoptosis in livers of rodents when exposed to 2AAF. 21,38,44,50 Although the PI-TI indexes were closely aligned with the trends observed in the PCNA proliferation assay, the magnitude of statistical significance for individual treatments changed (Tables 3 and 5). This result indicates that when examining cellular proliferation alone or cell death alone, the responses can be somewhat misleading with regard to cellular growth. Studies examining tumor growth and apoptosis suggest that failure to consider apoptosis in cell growth may account for the discrepancies between the actual and expected growth of tumors calculated from cell proliferation rates. 19,53 Thus, when taking into account the balance of proliferating cells and dying cells, whether apoptotic or necrotic, a more precise measurement of cellular growth is achieved when PI-TI indexes are considered.
Histological examination of G affinis livers after exposure to 2AF, BZ, and their combination at low and high doses show similarities to the results of studies of azo-based dyes and 2AAF exposure in rats, mice, and fish. 14,21,46,54 –56 Those studies all indicated an increase in oval cell proliferation after exposure to a specific chemical treatment and subsequent formation of tumors. In the present study, 10% of the control fish overall exhibited basophilic oval/spindle cell proliferation that was substantially increased in the treated groups by between 2.9- to 4.2-fold over the controls. These foci of proliferative basophilic cells occurred in 0%, 15%, and 15% of controls and 29%, 32%, and 42% of treated fish at 4, 8, and 12 weeks, respectively. By treatment group, these foci appeared in 42% of 2AF groups, 29% of BZ groups, and 33% of 2AF/BZ groups. Only 1 tumor was observed, and this was a spindle cell tumor in the 0.069 mM BZ group at 8 weeks. This lesion is comparable to the hemangiopericytomas described in other small fish species. 57 However, at 8 weeks, the full whirling pattern is probably not as developed as in longer term studies and, thus, not as easily discerned.
Previous exposure studies have indicated the occurrence of small basophilic foci in fish after exposure to MAM-Ac, diethylnitrosamine, or creosote. 14,57,58 A few PMA and granulomas were observed in the treated and control groups, although they were more prominent in the arylamine-treated groups. Both PMA and granulomas are inflammatory lesions and may be due to an undiagnosed infection or to phagocytosis of cellular debris resulting from necrosis or apoptosis. No evidence of infectious agents was observed. However, increased numbers of PMA have been correlated with exposure to various toxicants in previous reports. 59
Several investigations with liver have taken place to determine whether focal proliferation of oval cells are the preneoplastic origin of subsequent neoplasms that are consistently observed during exposures to azo-based dyes and 2AAF. 14,21,46,51,54 –56,60,61 A large array of antibodies to hepatocytes, oval cells/bile duct, shared-hepatocytes, and neoplastic antigens in F-344 rats were assayed in primary hepatocellular carcinomas induced by exposure to a single dose of N-nitrosodiethylamine followed by 14 days of 2.5-mg 2AAF exposure. 45,46,51,54 These results indicate that the antigenic phenotype expressed in 20% of the primary hepatocellular carcinomas (PHCs) contained both oval cell- and hepatocyte-associated antigens. 45 This was not observed in normal livers where hepatocytes expressed hepatocyte-associated antigens and bile duct cells expressed oval cell-associated antigens only. These same antigens were also detected in foci and nodules, but in lower amounts. 45 Several other studies have also shown the antigenic properties of both oval cells and hepatocytes in hepatocellular carcinomas and tumors. 54,62,63 In our G affinis study, these basophilic oval-like cells, presumed to be preductular cells, were the only type of preneoplastic lesions observed. Although only 1 tumor was observed in the present study, it was a basophilic spindle cell tumor. Investigations into the early proliferative state of these oval cells upon exposure to 2AAF have revealed that although it is a regenerative process resulting from an adaptive response to earlier cell death, this compensatory regeneration is different from those induced by partial hepatectomy. 64 Hepatocytes proliferating from a partial hepatectomy do not involve intra- or extrahepatic stem cells, only hepatocytes, whereas intrahepatic precursor cells (oval cells) proliferate and generate lineage only when hepatocyte proliferation is blocked or delayed as seen with 2AAF. 64 2AAF was shown to inhibit proliferation of noninitiated hepatocytes by blocking cells in the G1 phase, suggesting a direct toxic effect. 56 In our experiments, significant increases in oval cell proliferation were observed in both the 2AF- and BZ-exposed groups. This increase is reflective of compensatory proliferation of oval cells rather than normal regeneration of hepatocytes. Furthermore, evidence of differential proliferation of cells during chemical exposure was demonstrated in a study with 2AAF that induced a mitogenic response in ductal and nondescript periductular cells within 24 hours after administration. 65 Levels of 3 transcription factors and 2 genes regulated by these factors were assayed, and 2AAF-exposed livers had increased expression of 2 of the transcription factors and both of the genes they regulate. In contrast, the bile duct proliferation induced by bile duct ligation did not affect the levels of any of these factors assayed. 65 Therefore, based on these previous studies, the results from arylamine exposure in G affinis livers are closely aligned with those in mammals where early, reversible cell death is followed by proliferation of oval cells resulting in altered cellular foci of basophilic spindle/oval cell composition and ultimately tumor formation.
The correspondence of our results with those in mammalian studies of arylamines suggests that they may have common mechanisms. Investigations into arylamine carcinogenicity have established an early increase in apoptotic and/or necrotic cell death that decreases shortly thereafter to normal levels as was observed in G affinis. In rodents, this is in response to a disruption of the biochemical homeostasis in the liver by 2AAF metabolites as evidenced by the number of changes in carbohydrate metabolism and oxidative phosphorylation enzyme activity levels. 38,44,52 In an adaptive response to the loss of cells during this early stage, regenerative proliferation takes place. This compensatory regeneration alters the normal architecture of the liver. It has been hypothesized that the altered architecture of the liver is a prerequisite for the expansion of initiated foci. 66 This is based on the proliferation of bile duct–like cells that produce reticulin fibers and disrupt microcirculation, along with resistance of mitochondrial permeability transition pore activation.
In summary, 2AF- and BZ-exposed G affinis produce mammalian-like responses with dose and time with varying degrees of an analogous response. All treatment groups exhibited a greater proliferative response; however, the responses were not dose dependent. Only a transient apoptosis or cell death response that resulted in positive net cellular number was observed in the PI-TI ratio data. More oval cell-like proliferation and tumor formation occurred in the treated groups compared with the controls. These results are similar to the results of numerous studies of 2AAF and azo-based dye exposure in rodents and humans. This study further advances the utility of G affinis as an excellent sentinel species candidate for biomonitoring of environmental carcinogens in aquatic ecosystems and for studies investigating common mechanisms involved in hepatocarcinogenesis. The utility of this species would be greatly enhanced by the development of a genome database for use in mechanistic gene expression studies.
Footnotes
The author(s) declared no conflicts of interest with respect to the authorship and/or publication of this article.
This research was conducted in part with funding from the US Environmental Protection Agency. References herein to any specific commercial product, process, or service by trademark, manufacturer, or otherwise, does not necessarily constitute its endorsement, recommendation or favoring by the US Environmental Protection Agency. Views expressed in this paper do not necessarily reflect agency policies.