
Abstract
This study investigates the toxic effects of sarin on respiratory dynamics following microinstillation inhalation exposure in guinea pigs. Animals are exposed to sarin for 4 minutes, and respiratory functions are monitored at 4 hours and 24 hours by whole-body barometric plethysmography. Data show significant changes in respiratory dynamics and function following sarin exposure. An increase in respiratory frequency is observed at 4 hours post exposure compared with saline controls. Tidal volume and minute volume are also increased in sarin-exposed animals 4 hours after exposure. Peak inspiratory flow increases, whereas peak expiratory flow increases at 4 hours and is erratic following sarin exposure. Animals exposed to sarin show a significant decrease in expiratory time and inspiratory time. End-inspiratory pause is unchanged whereas end-expiratory pause is slightly decreased 24 hours after sarin exposure. These results indicate that inhalation exposure to sarin alters respiratory dynamics and function at 4 hours, with return to normal levels at 24 hours post exposure.
Keywords
Sarin (O-pinacolyl methylphosphonofluoridate) is a chemical warfare nerve agent (CWNA) that was used in the Tokyo subway attack in 1995. 1,2 CWNAs are potent and specific irreversible inhibitors of cholinesterases, especially acetylcholinesterase (AChE), which hydrolyzes the neurotransmitter acetylcholine (ACh) at cholinergic synapses. Inhibition of AChE leads to ACh accumulation at synapses and hyperstimulation of postsynaptic cholinergic receptors, which leads to salivation, lacrimation, defecation, muscular twitching, and central nervous system seizures that progress to status epilepticus. The resulting brain damage contributes to respiratory failure and is the root cause of mass causality following exposure to CWNAs. 3-7
Inhalation is predicted to be the major route of CWNA intoxication during terrorist attacks or war. Sarin is a potent central respiratory depressant, and it has been proposed that the death of sarin-poisoned animals is caused by respiratory and circulatory paralysis, which may be due to central nervous system effects. 8,9 Respiratory depression immediately after subcutaneous sarin exposure is mediated by hindbrain cholinergic pathways that are perturbed by high inhibition of brain AChE activity. 10-13 In most of these studies, sarin was administered subcutaneously. The direct effect of sarin on the respiratory system following inhalation exposure has not been studied well. Nonneuronal cholinergic systems exist in the respiratory system, and it is possible that sarin could inhibit the system and modulate pulmonary functions following inhalation exposure.
It is known that organophosphates, including the nerve agent sarin, induce extremely severe spasms of the bronchial smooth muscle. 14,15 Increased lung resistance, decreased dynamic compliance, and slow expirations following exposure to soman have been reported in baboons. 16 Apnea, hypoxia, and respiratory disturbances following inhalation exposure to sarin in addition to soman have been reported in baboons. 17 Both sarin and soman are G-type chemical warfare nerve agents that inhibit AChE. Soman inhibits AChE ages more rapidly than sarin inhibits AChE. Systematic studies on the effects of inhalation exposure to sarin on respiratory dynamics and function are yet to be done.
A major limitation for respiratory toxicity studies following sarin inhalation exposure is the complexity of inhalation exposure. We recently developed a microinstillation methodology to assess lung injury following inhalation exposure to toxic chemicals in guinea pigs. 18,19 The technology involves a microcatheter, the cross section of which shows several holes. The center hole delivers the nerve agent, and the peripheral holes pump air to aerosolize the agent at the tip. The microcatheter is passed through an intubation tube and placed 2 cm above the bifurcation of the trachea. The microinstillation technique has advantages over whole-body/nose-only inhalation exposure. 20 It bypasses the detoxification of the nerve agents by high levels of carboxylesterase and mucous present in rodent nasal airways. The amount of nerve agent required is less for dosing of animals because the microcatheter dead volume is less than 100 μL. In addition, guinea pigs, like humans, have less carboxylesterase than rats and mice. 21-25 Guinea pigs also have exquisitely sensitive airways and undergo bronchoconstriction, unlike mice and rats. 26
We investigated the effect of sarin on the respiratory physiology and dynamics in guinea pigs following microinstillation inhalation exposure. Using a barometric whole-body plethysmography, we demonstrate that inhalation exposure to sarin affects several parameters of respiratory dynamics and function.
Materials and Methods
Animals
This research was conducted in compliance with the Animal Welfare Act and other federal statutes and regulations relating to animals and experiments involving animals and adheres to principles stated in the Guide for the Care and Use of Laboratory Animals (NRC publication, 1996 edition). Adult male Hartley guinea pigs (250-300 g, Charles River Laboratories, Mass) were housed under standard conditions with 12-hour light/dark cycle and with food and water available ad libitum. The study protocol was approved by the Institution Animal Care and Use Committee, USAMRICD (Edgewood, Md).
Chemicals
The nerve agent sarin was obtained from Edgewood Chemical and Biological Center (Edgewood, Md). Sarin was diluted in saline and frozen until use. Telazol was purchased from Fort Dodge Pharmaceuticals (Fort Dodge, Iowa). Medetomidine was purchased from Pfizer Pharmaceuticals (New York, NY). The microinstillation equipment was obtained from Trudell Medical International (Ontario, Canada). All the biochemicals used for assay reagents were obtained from Sigma Chemical (St Louis, Mo). Saline, acetylthiocholine iodide (ATCh), tetraisopropylamidopyrophosphate (Iso-OMPA), butyrylthiocholine iodide (BTCh), and Huperzine A were obtained from Sigma-Aldrich (St. Louis, Mo). Bicinchoninic acid (BCA) protein assay kit was purchased from Pierce Chemical (Rockford, Ill).
General Experimental Design
The objective of the present study was to determine the effects of sarin microinstillation inhalation exposure on respiratory dynamics at different time periods in guinea pigs. Age-matched male Hartley guinea pigs were anesthetized, intubated, and exposed to sarin or saline by microinstillation inhalation exposure. The LCt50 of sarin by nose-only exposure in atropinized guinea pigs is 480 mg-min/m3. 27 A 4-minute exposure of 169.7 (0.23 LCt50), 338.6 (0.46 LCt50), and 508 mg/m3 (0.7 LCt50) doses of sarin was used. The respiratory dynamics were measured at 4 hours and 24 hours after sarin exposure and compared with saline or baseline values before exposure. At the 4-hour time point, the animal wakes up from anesthesia and may produce changes in respiratory toxicity. Most of the biochemical parameters of respiratory toxicity at 24 hours after sarin exposure showed significant toxicity, and respiratory dynamics were measured at 24-hour time point to compare the data. At the end of the experiment, animals were euthanized and lung edema was measured by accessory lobe wet/dry weight ratio. Bronchoalveolar lavage fluid was collected and centrifuged, and the cells and fluid were separately analyzed to determine the respiratory toxicity. A total of 8 saline controls and 20 sarin-exposed animals (6 animals, 169.7 mg/m3 [0.23 LCt50], 6 animals, 338.6 mg/m3 [0.46 LCt50], and 8 animals, 508 mg/m3 [0.7 LCt50]) were used in this study.
Endotracheal Intubation of Guinea Pigs
Guinea pigs were anesthetized intramuscularly using a combination of Telazol (40 mg/kg) and medetomidine (0.125 mg/kg). 28 The animals were gently intubated as described previously. 20,19 Briefly, a 10-cm translucent polyethylene tubing cut at a 45° angle on one end was inserted into the trachea. A 6-cm mark on the intubation tube coincided with the front upper teeth to accurately place the tube 2.5 cm above the bifurcation of the trachea. Intubation was verified by vapor condensation from the end of the intubation tube.
Microinstillation Inhalation Exposure to Sarin
Microinstillation uses a microcatheter with 6 cross-sectional holes. The central hole delivers sarin, whereas the peripheral holes pump air to aerosolize the nerve agent at the tip. The average particle size produced by microinstillation is less than 2 μm so that the aerosolized agent can reach deep into lung areas and alveoli. 20 Sarin was diluted in saline solution to obtain concentrations of 169.7 (0.23 LCt50), 338.6 (0.46 LCt50), and 508 mg/m3 (0.7 LCt50) and then loaded into a 3-mL syringe, which was connected to the microinstillation catheter; the base was connected to the catheter processing unit. 19 The microcatheter of the microinstillation equipment was inserted through the intubation tube and placed 2 cm above the bifurcation of the trachea. The acute exposure period was 4 minutes at 40 pulses/min, 1.4 μL for each pulse, and in 1.1 mL of air. The animals were then provided with normal air and evaluated for toxicity at 24 hours post sarin exposure. The formula mg/m3 = parts per million × molecular weight of sarin/24.5 (a constant used for conversion to aerosol) was used to calculate the sarin dose. Forty pulses for 4 minutes = 160 pulses × 1.4 μL (volume of fluid per pulse) = 224 μL (concentration 89 mg/1000 mL) was aerosolized in 176 mL air (160 pulses × 1.1 [volume of air/pulse]) = 89 × 140/24.5 = 508 mg/m3 sarin.
Barometric Plethysmography
Guinea pigs were placed in a whole-body barometric plethysmograph following 4-hour and 24-hour recovery periods (Buxco Electronics, Sharon, Conn) to determine the respiratory dynamic parameters.
29,30
The whole-body barometric plethysmography was calibrated according to a previously described method.
31,32
A very small rejection index was used to exclude the external noise generated by air circulation in the room. For measurement of respiratory parameters (Bio System XE software), baselines for each guinea pig were recorded for 75 minutes following a stabilization period of 30 minutes in the Buxco chamber, which was in a closed room to prevent air disturbances. The animals were monitored again in the barometric plethysmography after sarin exposure at 4 hours and 24 hours. The interval between data point measurements was 10 seconds. The respiratory parameters that were measured by barometric plethysmograph and their definitions are as follows: Respiratory frequency (RF): instantaneous breath-by-breath rate of breathing Tidal volume (TV): amount of air in a single breath Minute volume (MV): product of tidal volume and respiratory rate calculated on a breath-by-breath basis Inspiratory (Ti) and expiratory (Te) time: time spent inhaling and exhaling during each breath, respectively Peak inspiratory flow (PIF) and peak expiratory flow (PEF): maximum inspiratory and maximum expiratory flow that occurs in one breath End-inspiratory pause (EIP): the time of pause after the end of inspiration before the start of next expiration End-expiratory pause (EEP): the time of pause after the end of expiration before the start of next inspiration Penh (enhanced pause): an estimate measure of lung resistance, calculated from pause (P) using the ratio of Te and RT: P = (Te/RT) – 1, so that Penh = P × PEF/PIF
Analysis of Pulmonary Edema
At the indicated time period after exposure, the animals were euthanized. The lung accessory lobe was collected and used to determine the wet/dry weight ratio after drying at 100°C dry heat for 7 days.
Blood Oxygen Saturation
Blood oxygen saturation was recorded every 30 seconds for animals exposed to saline or to 169.7, 338.6, or 508 mg/m3 sarin using a pulse oximeter (Nonin Medical, Minneapolis, Minn). Values were recorded before and after intubation and at 30-second intervals during exposure, ending 15 minutes after exposure.
Cardiac Blood AChE and BChE Assays
Cardiac blood collected during exsanguination was diluted 50-fold using deionized water. AChE and BChE activity in blood were determined using Ellman’s assay with ATCh and BTCh as substrates, respectively. 33 Samples were incubated for 30 minutes at room temperature with 400 nM final concentration of freshly prepared [–]-Huperzine A, an AChE inhibitor, and BChE activity was determined using BTCh substrate. AChE activity was determined after incubating the samples for 30 minutes at room temperature with 4 µM final concentration of iso-OMPA, a specific BChE inhibitor, and using ATCh as the substrate. All spectrophotometric readings were determined on a Spectra Max Plus 384 microtiter plate reader (Molecular Devices, Sunnyvale, Calif).
Statistical Analysis
The experimental data were analyzed using Graph Pad Prism 4.0. The Mann-Whitney test was used to calculate the P value. A P value less than .05 was considered significant.
Results
General Effects of Sarin Microinstillation Inhalation Exposure in Guinea Pigs
Guinea pigs exposed to 169.7 and 338.6 mg/m3 sarin for 4 minutes did not exhibit seizure activity. However, animals exposed to 508 mg/m3 showed some upper limb seizures and occasionally lower limb seizure during 2 to 4 minutes of exposure. The survival rate at 508 mg/m3 sarin exposure was 74%. 34 Guinea pigs breathed normally during the first 2 minutes of 169.7, 338.6, and 508 mg/m3 sarin exposure. At the end of the full 4-minute sarin exposure, the animals' breathing rate started to decrease. Measurement of blood oxygen saturation using a pulse oximeter showed decreased oxygenation (Figure 1A ).
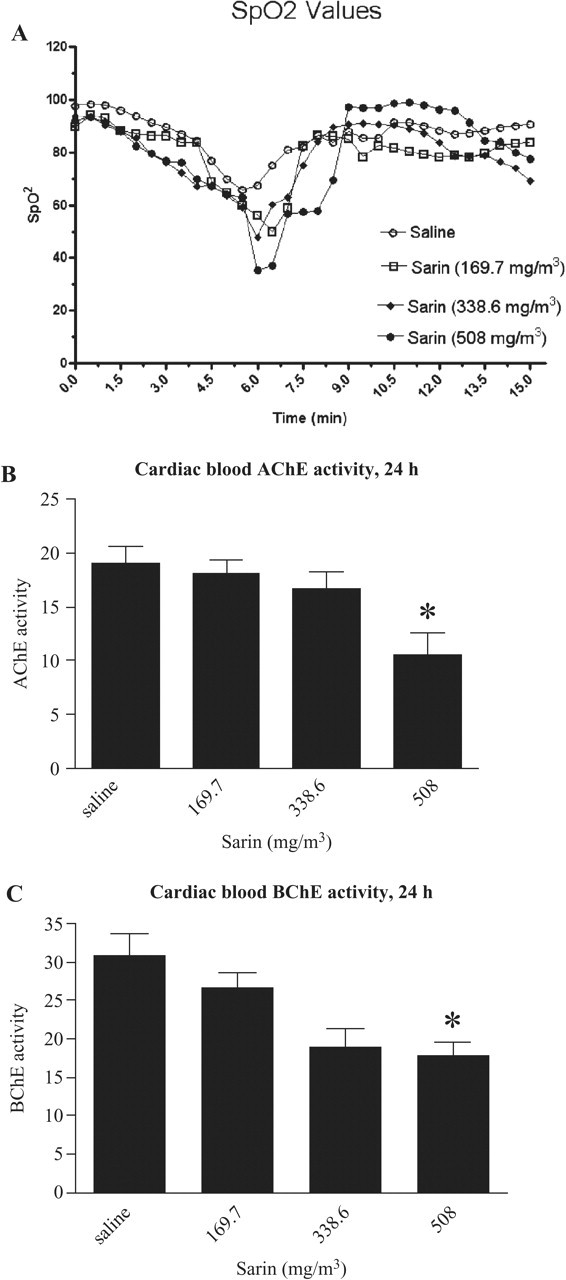
Blood oxygen saturation, cardiac blood acetylcholinesterase (AChE), and butyrylcholinesterase (BChE) inhibition. (A) The blood oxygen saturation was recorded using a pulse oximeter every 30 seconds for a total of 15 minutes for saline controls and animals that were exposed to 169.7, 338.6, and 508 mg/m3 sarin. (B) Blood AChE activity after 24 hours of recovery: Cardiac blood of saline and sarin-exposed animals was assayed for AChE and BChE activities as described in the methods. The data show a significant decrease in AChE inhibition between saline-exposed groups and 508 mg/m3 sarin (P = .0408). (C) Blood BChE activity after 24 hours of recovery. The data show a significant decrease in BChE inhibition for animals exposed to 508 mg/m3 sarin (P = .0025) compared with saline controls. AChE and BChE activities are normalized as Vmax/OD hemoglobin at 415 nm (n = 6-9).
Blood AChE Inhibition Following Sarin Exposure
The whole-blood AChE assay was performed using with ATCh as substrate in the presence of [–]-Huperzine A, an AChE inhibitor. BChE activity was determined using BTCh as substrate with iso-OMPA, a specific BChE inhibitor. There was approximately 50% inhibition of blood AChE and BChE in animals exposed to 508 mg/m3 sarin compared with saline-exposed controls at 24 hours (Figure 1B and 1C).
Body Weight Loss and Edema in Sarin-exposed animals
Average body weight at 24 hours was decreased 6% in animals exposed to sarin (508 mg/m3) compared with 2% in saline controls. The body weight loss was significant (P = .0172) (Figure 2A ). The mean accessory lobe lung wet/dry weight ratio showed a significant difference (P = .0357) at 24 hours after 508 mg/m3 sarin exposure that was similar to lower dose groups (Figure 2B).
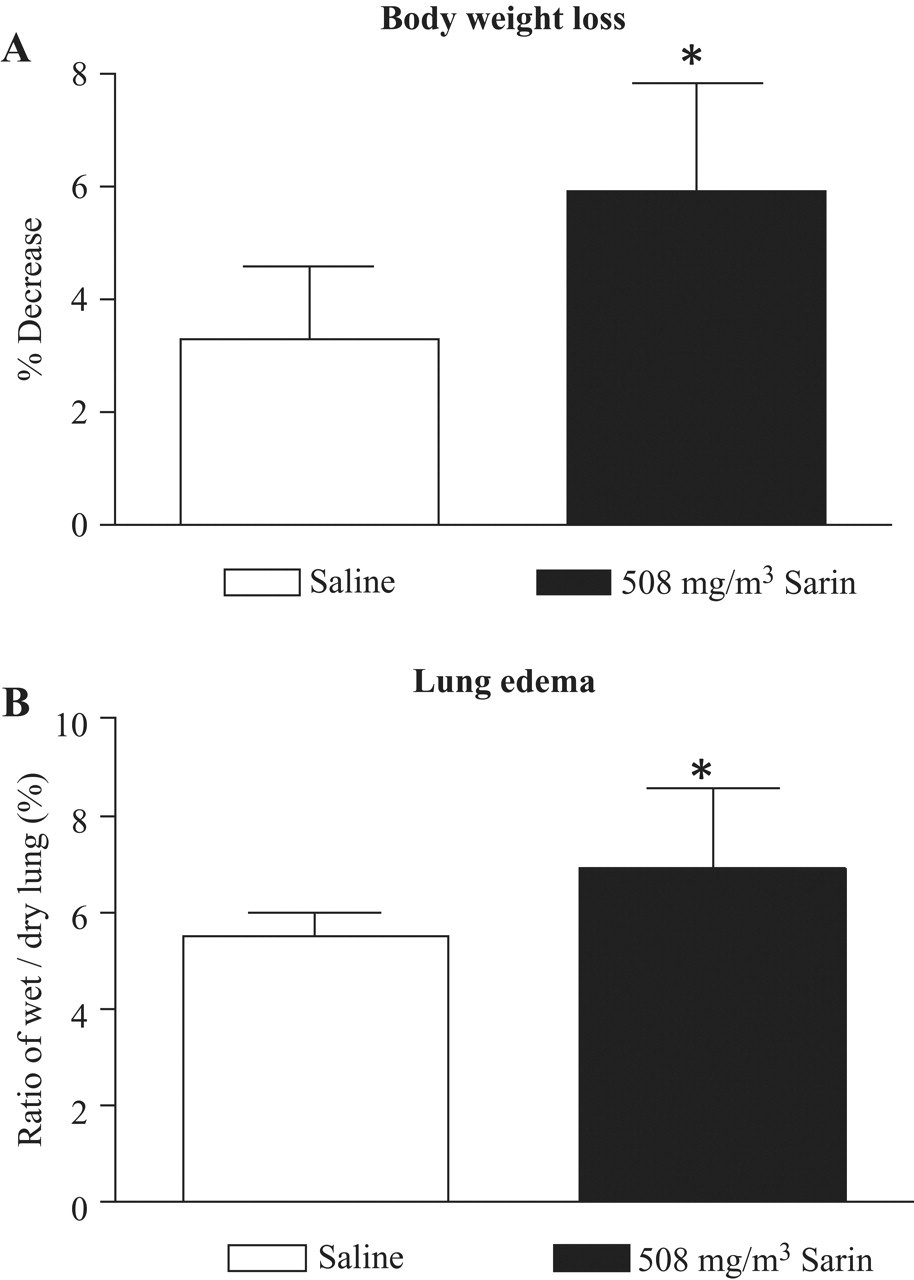
The effect of sarin exposure on body weight loss and lung wet/dry weight ratio. (A) Age- and weight-matched male guinea pigs were exposed to 508 mg/m3 sarin by microinstillation inhalation exposure for 4 minutes and then allowed to recover for 24 hours in room air. The body weight of the animals was recorded before exposure and prior to necropsy. The weight loss was expressed as a percentage (mean ± SEM). After necropsy, the accessory lung lobe was collected and weighed immediately. Note the significance in body weight loss between saline controls and animals exposed to 508 mg/m3 sarin (P = .0172). (B) The lobe was dried at 100°C dry heat for 7 days in an oven and weighed again. The wet/dry weight ratio was calculated and plotted. Mean ± SEM (n = 6-9). Note the significance in lung edema between saline controls and animals exposed to 508 mg/m3 sarin (P = .0357).
Barometric Plethysmography Signal Following Sarin Exposure
Whole-body barometric plethysmography measured in animals at 24 hours after sarin exposure is shown in Figure 3 . The breathing patterns of the saline-exposed control animals at 4 hours were similar to baseline breathing of unexposed animals (Figure 3A and 3B). The plethysmography of the sarin-exposed animals showed an irregular pattern and increased respiratory difficulty at 4 hours (Figure 3C). At 24 hours after exposure to 508 mg/m3 sarin, the breathing pattern tended to normal and was similar to saline controls. The occasional closer peaks of breathing following sarin exposure were the result of toxicity and rapid breathing of sarin-exposed animals.
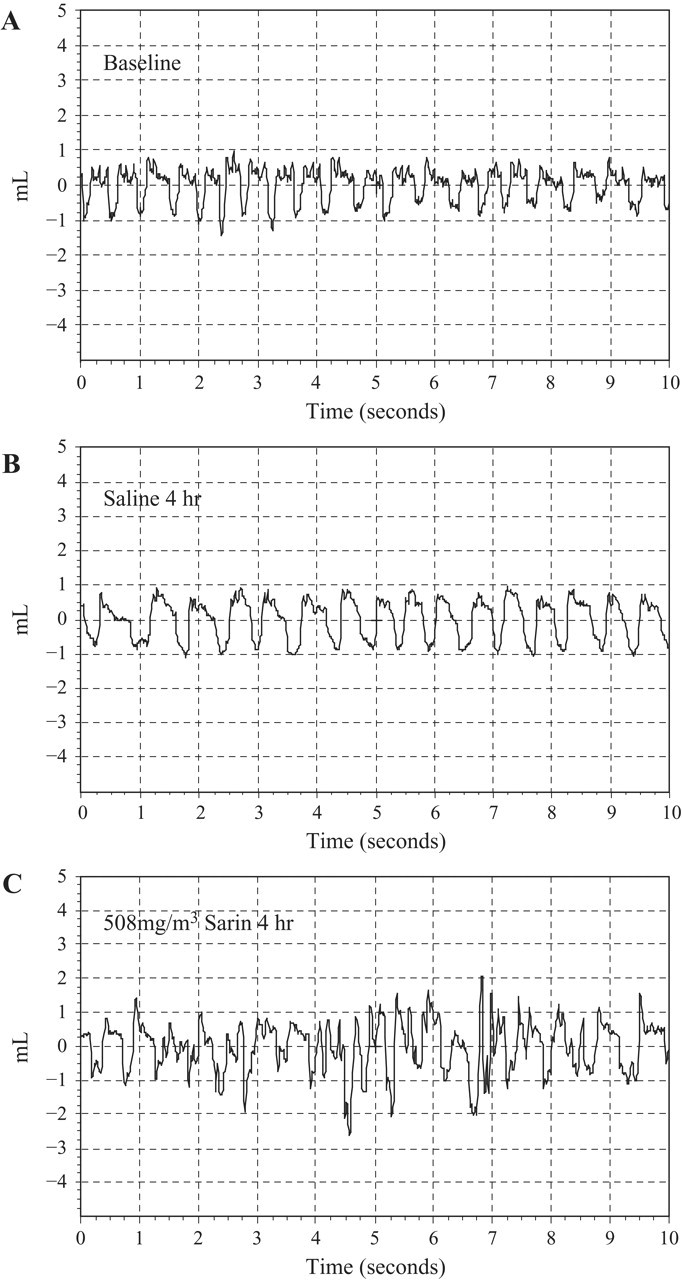
Barometric plethysmography recordings of sarin-exposed animals. Animals were exposed to sarin or saline and allowed to recover in room air for 4 and 24 hours. The animals were placed in a BUXCO whole-body barometric plethysmography chamber and respiratory dynamics were monitored. (A) Representative segment of baseline recording. (B) Recording of the saline-exposed animals at 4 hours post exposure. (C) Representative recording of the sarin-exposed guinea pigs 4 hours post exposure (n = 6-9).
Respiratory Rate (RF), Tidal Volume (TV), and Respiratory Minute Ventilation (MV)
The respiratory parameters derived from the Biosystem XE software are depicted in Figure 4 . A significant increase in the respiratory rate at 4 hours was observed in animals exposed to 338.6 and 508 mg/m3 sarin (P < .05). In contrast, animals exposed to 169.7 mg/m3 sarin did not show a significant change in respiratory rate. Animals allowed to recover for 24 hours after sarin exposure showed minor variations in respiratory rate (Figure 4A). The tidal volume of the sarin-exposed animals increased after 4 hours following 508 mg/m3 sarin exposure (Figure 4B) compared with saline controls. Lower doses of sarin did not change the tidal volume. Similarly, at 24 hours after sarin exposure, the tidal volume returned to near baseline values. The respiratory minute ventilation, which is the product of RF and TV, increased at 4 hours in a dose-dependent manner compared with saline controls (P < .05; Figure 4C). The increase in the minute ventilation was also observed at 24 hours but was lesser in magnitude compared with animals allowed to recover 4 hours.
Respiratory rate (RF), tidal volume (TV), and respiratory minute ventilation (MV) following sarin exposure. Animals were exposed to 169.7 mg/m3 sarin or saline for 4 minutes, and RF, TV, and MV were measured at 4 and 24 hours post exposure in a BUXCO whole-body barometric plethysmography chamber for 75 minutes as described in the methods (n = 6-9). Note statistical significance between saline controls and animals exposed to 338.6 mg/m3 and 508 mg/m3 sarin (P < .05) for RF, TV, and MV.
Effect of Sarin Exposure on Peak Inspiratory Flow Volume (PIF) and Peak Expiratory Flow Volume (PEF) in Guinea Pigs
An increase in PIF was observed after 4 hours following sarin exposure in a dose-dependent way (Figure 5A ). No significant changes in PIF were observed at 24 hours following the sarin exposure (Figure 5A). Similar to the PIF, PEF also increased in a dose-dependent fashion at 4 hours following sarin exposure (P < .05; Figure 5B). At 24 hours after sarin exposure, the data were similar to saline controls and returned to baseline values.
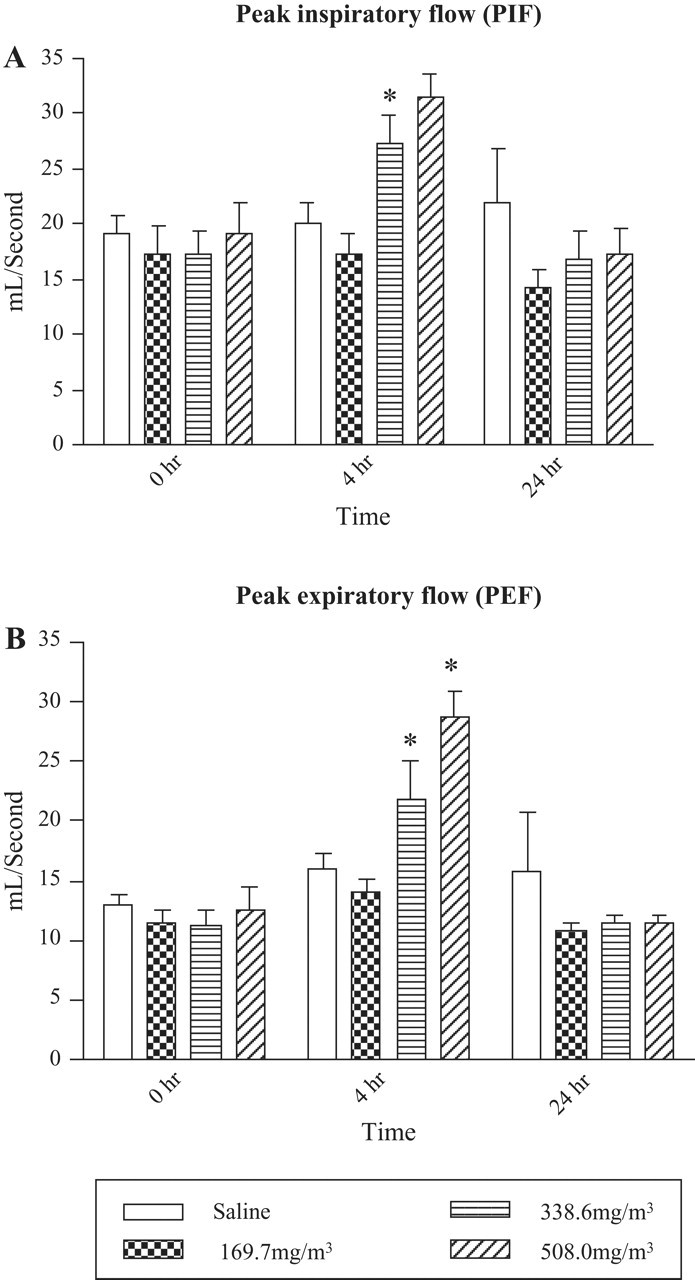
Effect of sarin inhalation exposure on peak inspiratory flow (PIF) and peak expiratory flow (PEF). Peak inspiratory flow and peak expiratory flow, the maximum inspiratory or expiratory flow that occurs in each breath, respectively, were determined in guinea pigs. Animals exposed to 169.7 mg/m3 sarin for 4 minutes measured at 4 and 24 hours post exposure (n = 6-9). Note statistical significance between saline controls and animals exposed to 338.6 mg/m3 and 508 mg/m3 sarin (P < .05) for PIF and PEF at 4 hours.
Sarin Inhalation Exposure Reduces Inspiration Time (Ti) and Expiration Time (Te)
A small, nonstatistically significant decrease in Ti was observed following sarin exposure at 4 hours (Figure 6A ). In contrast, at 24 hours after exposure, there was a marginal increase in the Ti (Figure 6B). Animals exposed to 508 mg/m3 sarin did not show a significant change in Te compared with control animals at 4 hours or 24 hours.
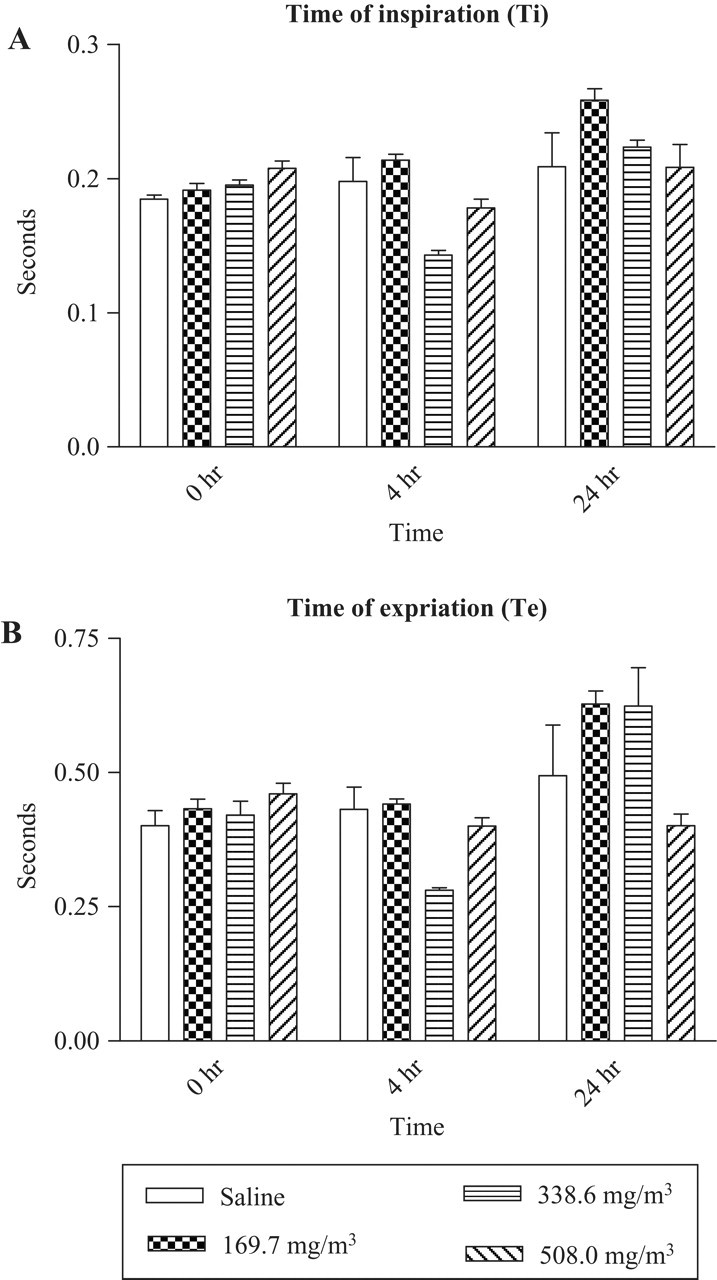
Inhalation exposure to sarin reduces inspiration time (Ti) and expiration time (Te). Guinea pigs were exposed to 169.7 mg/m3 sarin for 4 minutes, and whole-body barometric plethysmography was carried out at 4 and 24 hours post exposure (n = 6-9).
Effect of Sarin Inhalation Exposure on End-Inspiratory Pause (EIP) and End-Expiratory Pause (EEP) in Guinea Pigs
EIP increased in animals exposed to 508 mg/m3 sarin at the beginning of the recording at 4 hours but returned to normal levels at the end of 75 minutes of recording (Figure 7A) and remained similar to controls at 24 hours. Although there was not a notable change in EEP following 508 mg/m3 sarin exposure at 4 hours, there was a decrease at 24 hours. In contrast, doses of 169.7 and 508 mg/m3 sarin showed a marginal increase in the average values with larger variations.
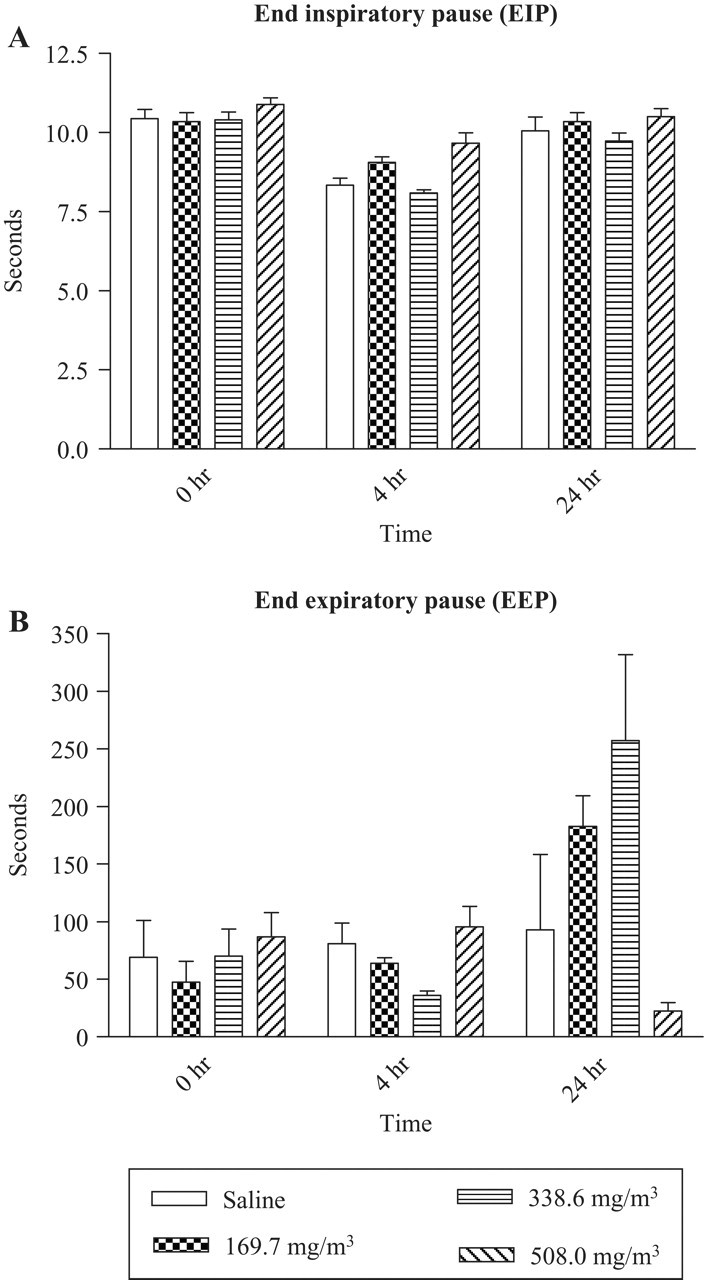
Inhalation exposure to sarin increases end-inspiratory pause (EIP) and end-expiratory pause (EEP). End-inspiratory pause and end-expiratory pause evaluation at 4 and 24 hours post sarin exposure (n = 6-9). End-expiratory pause was significantly increased in sarin-exposed animals compared with saline controls.
Lung Resistance (Penh) and Pause
Pause is an indicator of assumed bronchoconstriction, which was not significantly altered in animals exposed to 508 mg/m3 sarin at 4 hours but was slightly decreased at 24 hours compared with the control animals (P = .019, Figure 8A). Average pause values were increased at 24 hours in animals treated with 508 mg/m3 sarin. Penh, which is an estimate of lung resistance, was increased at 24 hours post-sarin exposure with a dose of 338.6 mg/m3 sarin (P = .003; Figure 8B). Thus, a nonlethal dose of sarin seems to increase pause and lung resistance at 24 hours, whereas the dose, which caused some lethality, did not.
Pause and pseudo lung resistance (Penh) following sarin exposure: Animals were exposed to 169.7 mg/m3 sarin for 4 minutes. Whole-body barometric plethysmography was measured at 4 and 24 hours post exposure. Pause was significantly decreased in sarin-exposed animals compared with saline controls (P = .019). Penh, which is an estimate of lung resistance, decreased during the first 30 minutes of the 75-minute recording but returned to normal levels at 30 to 75 minutes of the recording (P = .003; n = 6-9). Note statistical significance between saline controls and animals exposed to 508 mg/m3 sarin (P < .05) for pause and Penh at 24 hours. *Statistically significant.
Discussion
The major finding in this study is that acute microinstillation inhalation exposure to sarin caused significant changes in respiratory dynamics of guinea pigs. The respiratory changes are characterized by an increase in respiratory frequency, increase in tidal volume and minute ventilation at 4 hours, and development of respiratory toxicity. At 24 hours after sarin exposure, respiratory dynamics were more similar to saline controls, indicating recovery. The whole-body plethysmography recordings were also more variable at 24 hours after sarin exposure, indicating a compensatory effect in sarin-exposed animals. This observation indicates that the animals retain the capacity to slowly recover from sarin-induced respiratory toxicity at later time points. An increase in respiratory rate and minute ventilation is a sign of lung injury, presumably a result of compensation for decreased oxygenation and to meet the metabolic demand. Tachypnea, illustrated by increased minute ventilation, tidal volume, and respiratory frequency after subcutaneous challenge of 2 × LD50 of sarin at early time points, has been reported. 35 Also, subcutaneous delivery of 1.5 × LD50 sarin to rats induced respiratory depression at early time points. 36
An increase in respiratory frequency with an increase in tidal volume could lead to hyperinflation of the lung during the initial period of sarin exposure. 37-39 Hyperinflation is a key feature in chronic obstructive pulmonary disease pathophysiology and is generated by reduction of elastic recoil of the lung or interruption of expiration at lung volumes still higher than functional residual capacity, due to reduction of expiratory flow. 37 At 4 hours after exposure, the expiratory flow is increased in sarin-exposed animals, which may indicate a possible reduction of air trapping and lung inflation. Dynamic lung hyperinflation is also observed in patients with acute respiratory distress syndrome. 38
There was a significant body weight loss at 24 hours in sarin-exposed animals. Similarly, the accessory lobe wet/dry weight ratio show that sarin exposure caused significant edema. The blood oxygen saturation was also reduced significantly in animals exposed to 508 mg/m3 sarin at 6 to 7 minutes after the onset of exposure. The initial respiratory toxicity is likely due to the cholinergic effect of sarin on the respiratory system involving bronchial smooth muscles in addition to the central control of respiration. Because the respiratory effects are prominent at 4 hours after sarin exposure, it seems that sarin exerts more toxic effects at early time points after exposure compared with soman and persists for a while after exposure. 40 Higher volatility of sarin compared with soman is a factor probably responsible for the early toxic effects.
Among all the respiratory parameters that were altered, TV, MV, PIF, and PEF alteration was most prominent at 4 hours post sarin exposure. This alteration may reflect disturbances in the central nervous system (CNS) respiratory center, 41-43 which results in rapid breathing to compensate for the ongoing toxicity and metabolic demand. Therefore, respiratory complications following sarin exposure seem to be a combination of ongoing local effect plus central nervous system toxicity. There was a significant inhibition of AChE levels in the midbrain at 24 hours post sarin exposure (Nambiar et al, unpublished data). Cardiac blood AChE and BChE are also reduced in animals exposed to 508 mg/m3 sarin.
Compared with sarin, exposure to phosgene, a pulmonary irritant that does not affect the cholinergic system, yielded very different respiratory toxicity. 44 Unlike sarin, phosgene-treated mice experienced a decreased PEF. The decreased PEF in phosgene mice happened in coincidence with increased edema in the lungs. Because alveolar fluid collection is detrimental to air flow, the lack of edema may explain the increase in PEF following sarin exposure. In contrast to the elevated levels of RF, TV, and MV following sarin exposure, phosgene-exposed mice experienced a decrease in these parameters. The fact that sarin-exposed animals experience opposite effects than phosgene-exposed animals also indirectly supports significant contribution of CNS toxicity in addition to local effects.
Increased PIF and decreased PEF at 24 hours after sarin exposure could also be due to dyspnea. An increased PIF due to dyspnea has been reported in guinea pigs challenged with ovalbumin. 45 Interestingly, PIF showed lower levels of changes in sarin-exposed animals during the beginning of the 75-minute recording. On the other hand, PEF showed more variation during the second half of the 75-minute recording in sarin-exposed animals, where the mean value returned to normal levels. Such variation was not observed in unexposed control animals. Pseudo tidal volume and EIP were also variable during the 75-minute recording compared with saline controls. These variations may be attributed to the toxic effects of sarin exposure and poor recuperating capacity of these animals. In addition to respiratory toxicity, abdominal/cecum bloating was found in sarin-exposed animals but not saline controls; such bloating could disturb respiration by restricting the movements of diaphragm (Nambiar et al, unpublished data).
A review by Munro et al 46 indicated that there is a 2.6-fold increase in the LCt50 (mgċmin/m3) of sarin in guinea pigs compared with humans. Based on our studies, a concentration of 195.4 mg/m3 sarin exposure for 4 minutes should cause significant changes in respiratory parameters in humans. 46 There are significant differences in the respiratory toxicity following 508 mg/m3 sarin exposure compared with 90.4 μg/m3 VX. 47 There was bronchoconstriction following VX exposure unlike the bronchodilation in sarin. End-expiratory pause was decreased in sarin-exposed animals, whereas it was increased in VX-exposed animals. It is possible that some of the effects of VX are partly due to viscous mucus secretion, which might be less in sarin-treated animals. Also, the effects of VX on respiratory function are initially local effects, because it takes longer to inhibit brain AChE following VX exposure. Conversely, brain AChE inhibition following sarin exposure is rapid, and a local and central effect could simultaneously contribute to the observed respiratory toxicity.