
Abstract
Thyroid hormone (TH) disrupting compounds interfere with both thyroidal and extrathyroidal mechanisms to decrease circulating thyroxine (T4). This research tested the hypothesis that serum T4 concentrations of rodents exposed to a mixture of both TH synthesis inhibitors (pesticides) and stimulators of T4 clearance in the liver (polyhalogenated aromatic hydrocarbons, PHAHs) could be best predicted by an integrated addition model. Female Long-Evans rats, 23 days of age, were dosed with dilutions of a mixture of 18 PHAHs (2 dioxins, 4 dibenzofurans, and 12 PCBs, including dioxin-like and non-dioxin like PCBs) and a mixture of 3 pesticides (thiram, pronamide, and mancozeb) for four consecutive days. Serum was collected 24 hours after the last exposure and T4 concentrations were measured by radioimmunoassay. Animals exposed to the highest dose of the mixture experienced a 45% decrease in serum T4. Three additivity model predictions (dose addition, effect addition, and integrated addition) were generated based on single chemical data, and the results were compared. Effect addition overestimated the effect produced by the combination of all 21 chemicals. The results of the dose- and integrated-addition models were similar, and both provided better predictions than the effect-addition model. These results support the use of dose- and integrated additivity models in predicting the effects of complex mixtures.
Keywords
Thyroid hormones (THs) are important from early development through adulthood because they are vital in developmental processes and serve as regulators of metabolism in adults. 1 In humans, large decreases in maternal, fetal, or neonatal circulating thyroid hormones lead to pronounced neurological deficits. 2,3 Small decreases in circulating maternal thyroxine during the first trimester are associated with IQ decreases in children. 4 In other species, thyroid hormones initiate developmental processes, such as metamorphosis in frogs 5 and smolting in salmon. 6 Xenobiotic-induced alterations in thyroid hormones disrupt these processes. 7,8
The thyroid gland primarily produces thyroxine (T4), a prohormone, which converts to biologically active triiodothyronine (T3) in tissues as necessary to maintain homeostasis. 9 Alteration of circulating THs can occur through xenobiotic interaction directly with the thyroid gland to alter iodine uptake, thyroid peroxidase (TPO) activity, or TH secretion. 10-13 A number of extrathyroidal mechanisms may also affect TH levels by altering hormone transport, 14 hepatic clearance, 15 inhibition of deiodination to T3, 16 and receptor agonism/antagonism. 17 Increased clearance of THs can result from exposure to chemicals that upregulate TH metabolizing microsomal enzymes in the liver. 18
A large and structurally diverse set of chemicals can decrease circulating THs in experimental animals. 19,20 Some thyroid-disrupting environmental contaminants, such as polychlorinated dioxins and dibenzofurans, are unwanted byproducts of incineration and industrial processes. Others such as polychlorinated biphenyls (PCBs) or polybrominated biphenyls (PBBs), and polybrominated diphenyl ethers were used commercially in electronic capacitors or as flame-retardants. In addition, a number of pesticides also decrease THs in experimental animals. 19,21 Humans are exposed to a variety of the previously mentioned chemicals via food sources and occupational exposure. For example, PCBs are commonly found in fish 22 and breast milk 23 ; produce and grains may contain low levels of pesticide residue. 24 The broad range of environmental contaminants that alter circulating TH concentrations has raised concern for additive effects of simultaneous exposure to multiple TH disruptors. 20,25,26
Although many studies provide useful information regarding the effects and mechanisms of single chemicals on THs, it remains unclear how simultaneous exposure to mixtures affects a common end point such as circulating concentrations of T4. Initial studies examining mixtures of TH disruptors focused on polychlorinated dibenzo-p-dioxins (PCDDs), dibenzofurans (PCDFs), and PCBs. 27 These studies demonstrate low dose additivity, with greater than additive effects only occurring at higher exposures in a short-term assay in prepubertal female rats. 27,28 PCDDs, PCDFs, and some PCBs activate the Ah receptor (AhR). 29 Other PCBs are described as “phenobarbital-like” because they induce CYP2B and CYP3A 30 and are thought to activate either pregnane X-receptor (PXR) or constitutive androstane receptor (CAR). Activation of PXR, CAR, and AhR induce uridine diphosphate-glucuronosyltransferases (UGTs) and sulfotransferases (SULTs), phase II enzymes that catabolize THs 31-33 and subsequently increase hepatic clearance of THs.
Dithiocarbamate fungicides such as mancozeb and thiram and the herbicide pronamide reduce serum concentrations of T4 and increase thyroid mass in rodents. 34-39 Mancozeb decreases TPO activity in vitro, 37 suggesting a mode of action via TH synthesis inhibition. Thyroid hormone synthesis inhibitors also decrease circulating T3; however, these effects occur at higher exposures than those that begin to decrease T4. 16 In humans, increased circulating concentrations of thyroid stimulating hormone (TSH) are observed in those who use fungicides in an occupational setting. 40,41
Estimating the potential hazards associated with exposures to mixtures is facilitated by empirical data derived from single chemicals and mathematical models. Models for assessing the risk of mixtures often use the concepts of dose and effect additivity to describe the effects of a complex mixture of chemicals affecting the same end point but acting through similar and/or dissimilar modes of action. 42,43 Dose addition typically describes the behavior of chemicals with the same mechanism of action and assumes that the sum effect of the mixture is based on the potency of each compound. 43 Effect addition typically is applied to estimate the effects of a mixture of chemicals with different modes of action. 43 Some models integrate both the concepts of dose addition and effect addition to address complex mixtures of chemicals with both similar and dissimilar modes of action. An integrated addition model 44-46 sums dose addition among chemicals suspected to have the same mechanisms of action and effect addition between groups of chemicals with different mechanisms of action.
The present study examined the hypothesis that an integrated addition model, compared with either a dose addition or an effect addition model, best predicts decreased serum T4 concentration in rats exposed to a mixture of TH synthesis inhibitors and hepatic enzyme inducers. T4 was used as indicator of thyroid hormone disruption because similar short-term studies have shown little effect on other components of the hypothalamic–pituitary–thyroid axis, including T3 and TSH. 27,47-52 This work extends the initial findings of Crofton et al 27 that TH disruptors act additively to a broader range of TH disruptors that act through different modes of action.
Materials and Methods
Chemicals
Three pesticides were purchased from ChemService (West Chester, Pa): thiram (CAS 137-26-8, catalog PS-24, purity 98%), pronamide (CAS 23950-58-5, catalog PS-349, purity 98.3%), and mancozeb (CAS 8018-01-7, catalog PS-2095, purity technical grade). Dilutions for each individual pesticide were made in corn oil (Sigma Aldrich, St.Louis, MO) at the following concentrations: thiram (6.25, 12.5, 25.0, 50.0, 100, 200, 400, and 800 mg/mL); mancozeb (3.90, 7.80, 15.6, 31.3, 62.5, 125, 250, 500, and 1000 mg/mL); pronamide (3.90, 7.80, 15.6, 31.3, 62.5, 125, 250, 500, and 1000 mg/mL).
A custom mixture of 18 polyhalogenated aromatic hydrocarbons (PHAHs) (as previously described by Crofton et al 27 ), consisted of 2,3,7,8-tetrachlorodibenzo-p-dioxin (TCDD); 1,2,3,7,8-pentachlorodibenzo-p-dioxin (PCDD); 2,3,7,8 tetrachlorodibenzofuran (TCDF); 1,2,3,7,8-pentachlorodibenzofuran (1-PCDF); 2,3,4,7,8-pentachlorodibenzofuran (4-PCDF); 1,2,3,4,6,7,8,9-octachlorodibenzofuran (OCDF); 2,4,4′-trichlorobiphenyl (PCB-28); 2,2′,5,5′-tetrachlorobiphenyl (PCB-52); 3,3′,4,4′-tetrachlorobiphenyl (PCB-77); 2,2′,4,5,5′-pentachlorobiphenyl (PCB-101); 2,3,3′,4,4′-pentachlorobiphenyl (PCB-105); 2,3′,4,4′,5-pentachlorobiphenyl (PCB-118); 3,3′,4,4′,5-pentachlorobiphenyl (PCB-126); 2,2′,3,4,4′,5′-hexachlorobiphenyl (PCB 138); 2,2′,4,4′,5,5′-hexachlorobiphenyl (PCB-153); 2,3,3′,4,4′,5-hexachlorobiphenyl (PCB-156); 3,3′,4,4′,5,5′-hexachlorobiphenyl (PCB-169); and 2,2′,3,4,4′,5,5′ heptachlorobiphenyl (PCB-180). The mass ratio of its components was designed to mimic those found in biologically and environmentally relevant sources such as fish and human breast milk. The PHAH mixture contained 6001 μg total PHAH/mL (see Table 1 for doses of individual components). This mixture was diluted with corn oil (Sigma Aldrich) to attain a dose of 601 μg/mL (stock solution A). Stock solution A (PHAHs) was used to make 8 serial dilutions (actual dose of total PHAHs for each dilution shown in parenthesis): 66% (397 μg/kg), 50% (300 μg/kg), 33% (198 μg/kg), 10% (60.1 μg/kg), 6.6% (39.7 μg/kg), 5.0% (30.0 μg/kg), 3.3% (19.8 μg/kg), and 1.0% (6.01 μg/kg).
Doses and Components of the PHAH Mixture
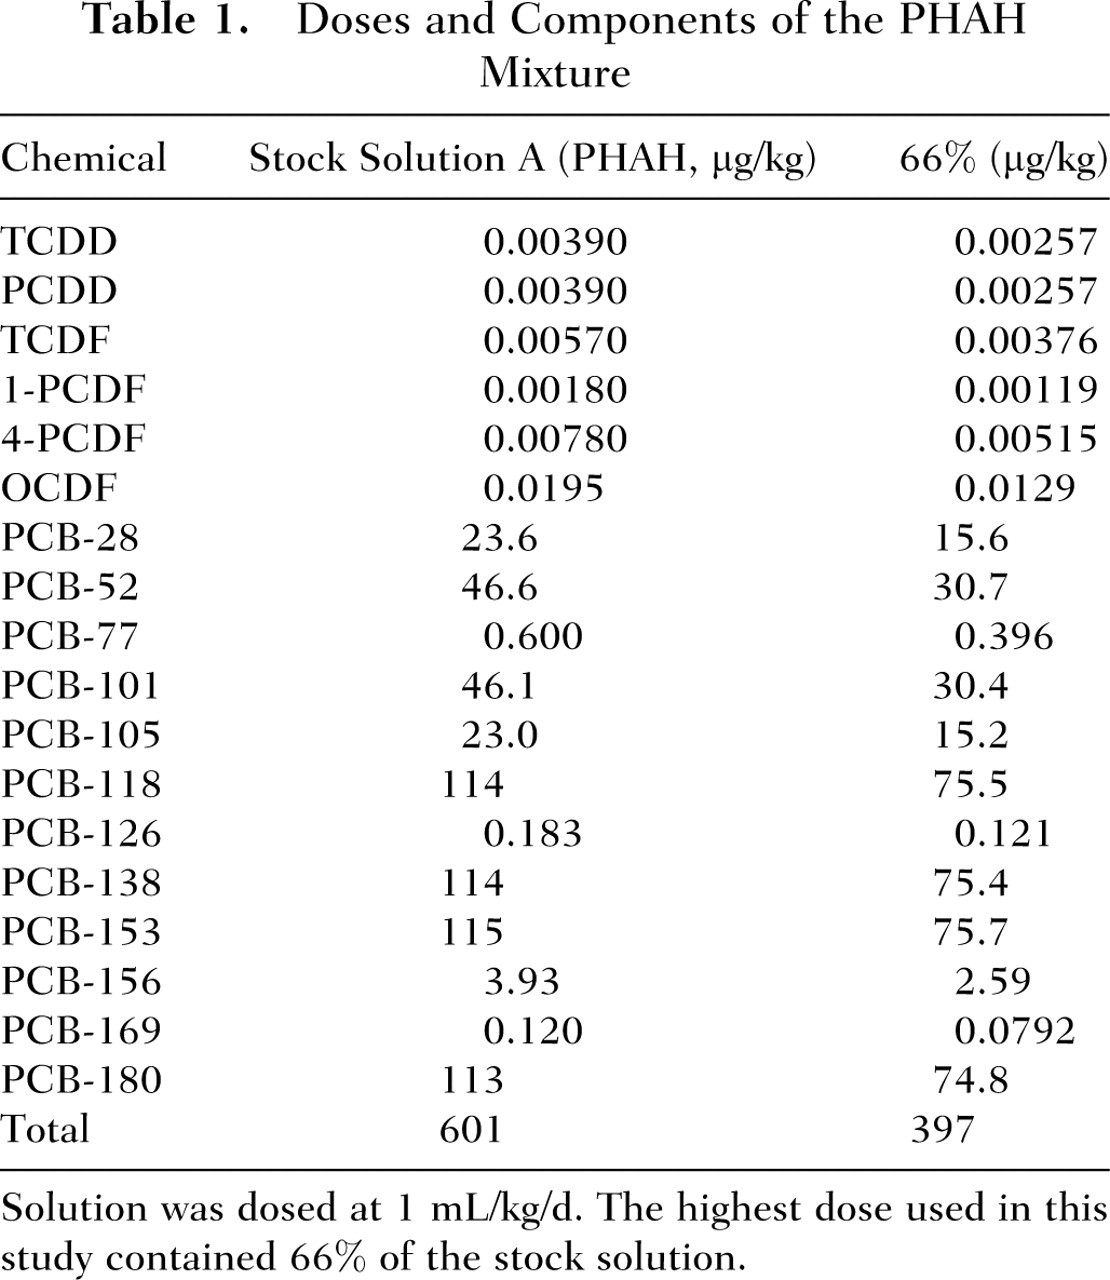
Solution was dosed at 1 mL/kg/d. The highest dose used in this study contained 66% of the stock solution.
Stock suspension B (pesticides) was prepared by combining 15.0 mg/mL thiram, 10.0 mg/mL pronamide, and 10.0 mg/mL mancozeb in corn oil (Table 2). Stock B (pesticides) was diluted to make 8 serial dilutions to be dosed at 5 mL/kg. This resulted in dilutions (percentage of stock) and doses (total mg pesticide/kg) of 66% (115 mg/kg), 50% (87.5 mg/kg), 33% (57.7 mg/kg), 10% (17.5 mg/kg), 6.6% (11.5 mg/kg), 5.0% (8.75 mg/kg), 3.3% (5.78 mg/kg), and 1.0% (1.75 mg/kg). The doses for the PHAH and pesticide mixtures were chosen such that at stock concentrations, each was expected to be equally potent and result in an approximate 25% decrease in T4.
Doses and Components of the Pesticide Mixture
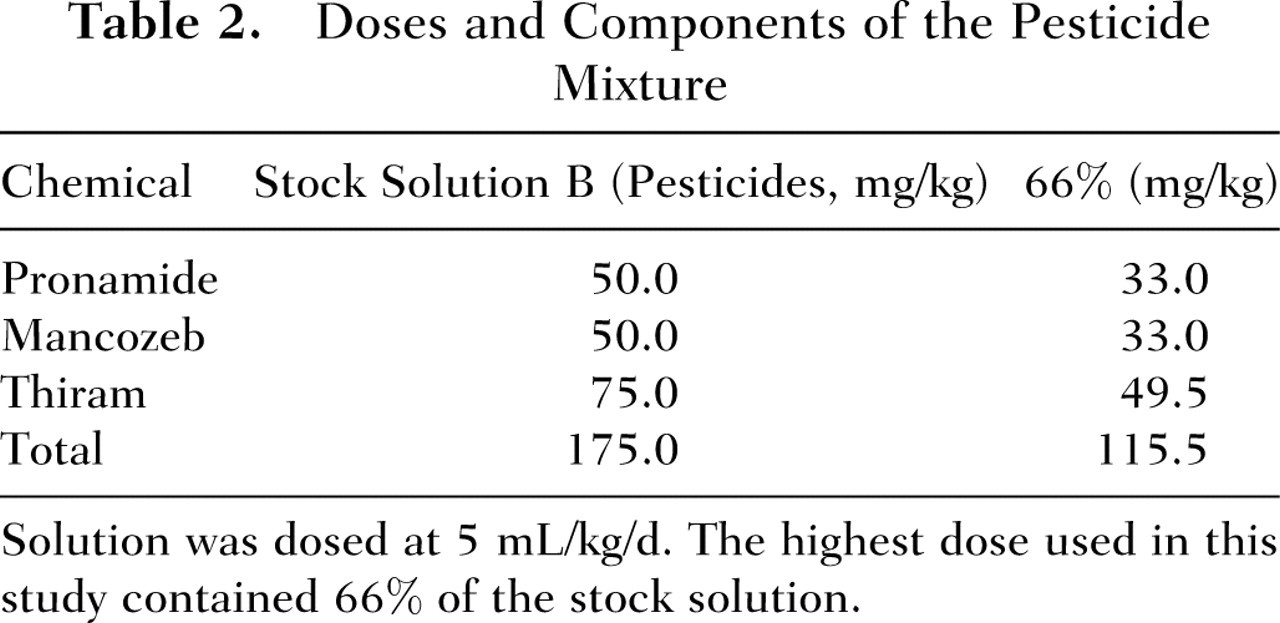
Solution was dosed at 5 mL/kg/d. The highest dose used in this study contained 66% of the stock solution.
Animals
Female Long-Evans rats, 23 days old, were purchased from Charles River Laboratories (Raleigh, NC). Animals were housed in an Association for Assessment and Accreditation of Laboratory Animal Care (AAALAC)–approved facility, and the U.S. EPA Institutional Animal Care and Use Committee approved all procedures in advance. Animals were acclimated for 4 days prior to dosing. Two days prior to dosing, animals were weighed and assigned to treatment groups such that animals in each dosing group had a similar mean weight. Two animals were housed per cage (45 cm × 24 cm × 20 cm) with sterilized pine shaving bedding (Beta Chips, Northeastern Products, Warrensburg, NY). Feed (Purina Rodent Chow 5001, Barnes Supply, Durham, NC) and tap water (Durham, NC) were provided ad libitum. Tap water was filtered through sand and activated charcoal and subsequently was rechlorinated to 4 to 5 ppm Cl– before use in the animal facility. A 12:12 light/dark photoperiod (light 6
Individual Chemical Dosing
Data from the individual PHAHs were obtained from Crofton et al.
27
For the pesticides, separate groups of animals (n = 8-16/group) were used to generate dose-response curves for thiram, mancozeb, and pronamide. Dilutions of individual pesticides were administered to animals via oral gavage (5 mL/kg) for 4 days: thiram (6.25, 12.5, 25.0, 50.0, 100, 200, 400, and 800 mg/kg); mancozeb (3.90, 7.80, 15.6, 31.3, 62.5, 125, 250, 500, and 1000 mg/kg); pronamide (3.90, 7.80, 15.6, 31.3, 62.5, 125, 250, 500, and 1000 mg/kg). Animals in the control groups were administered corn oil. Body weights were recorded daily and dosing volumes adjusted daily. On the day following the last dose, animals were randomly sacrificed by decapitation (no anesthesia) between 8 and 10
Mixture Dosing
Three groups of animals (n = 8 per treatment) were exposed to a mixture of the 3 pesticides at dilutions of 50% or 5% of stock B (pesticides) (87.5 and 8.75 mg/kg/d, respectively) or a corn oil control so dose additivity among the 3 pesticides could be evaluated. Animals were exposed via oral gavage for 4 days and serum was collected 24 hours after the last treatment. Data for the PHAH mixture was obtained from Crofton et al. 27
The combined exposure to the PHAH and pesticide mixtures used animals (n = 8-16/group) dosed with 66%, 50%, 33%, 10%, 6.6%, 5.0%, 3.3%, and 1.0% dilutions of the PHAH and pesticide mixture or corn oil (control). Rats were exposed daily for 4 consecutive days via oral gavage. The PHAH mixture was administered at 9
Hormone Analysis
Trunk blood was collected from each animal following decapitation beginning 24 hours after the last day of dosing, and all samples were gathered between 9 and 11:30 a.m. Blood was collected in serum separator tubes (Becton Dickinson Vacutainer Systems, Franklin Lakes, NJ) and allowed to clot on ice for a minimum of 30 minutes. Serum was separated by centrifugation at 4°C, 3000 rpm for 25 minutes, and stored at –80°C until analysis.
Serum T4 levels were measured by radioimmunoassay (Coat-A-Count Total T4, Diagnostic Products Corporation, Los Angeles, Calif). Known calibration standards (0, 10, 40, 100, 160, and 240 ng/L of T4), plasma samples, and quality controls (low, medium, and high) were processed in provided antibody-coated tubes. One additional standard of 5 ng/mL was included by making a 50:50 (by volume) mixture of 0 and 10 ng/L standards. Calibration standards were run in triplicate; serum samples and quality control were run in duplicate according to kit instructions. Variability between replicates was 5% or less. Control group means ranged from 41.7 to 55.6 μg/dL, with an average coefficient of variation of 15.3. All data values were standardized to percentage of control for each experiment ([experimental value/control mean] × 100).
Hepatic Enzyme Assays
Microsomal liver fractions from rats individually treated with pesticides were prepared as previously described. 54 Hepatic EROD (a marker for CYP1A1 activity), PROD (a marker for CYP2B), and microsomal T4-UDPGT activities were assayed as described by Craft et al. (2002).
Dose-Response Evaluation of Individual Chemicals
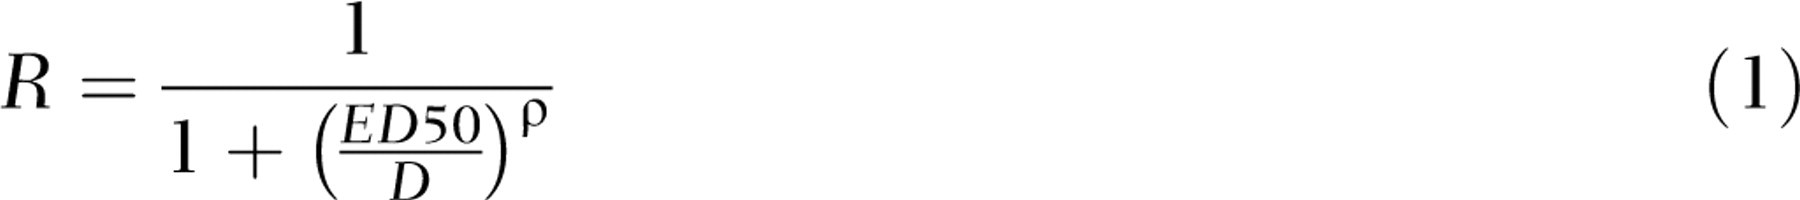
Individual dose-response curves for each chemical (18 PHAHs and 3 pesticides) were fit with a sigmoidal function using Equation 1 and carried out by Origin software (OriginPro 7.5, Microcal Software, Northampton, Mass).
Analysis of the Effects of Mixtures on Serum Thyroxine
The effects of the mixtures of the PHAHs, pesticides, and the PHAH and pesticides mixture were evaluated using the Computational Approach to Toxicity Assessment of Mixtures (CATAM) model (http://www.ncsu.edu/project/toxresearch/model5/). This model allows for quantitatively evaluating dose, effect, and integrated addition of mixtures, provided the individual chemical data is available.
Dose Addition
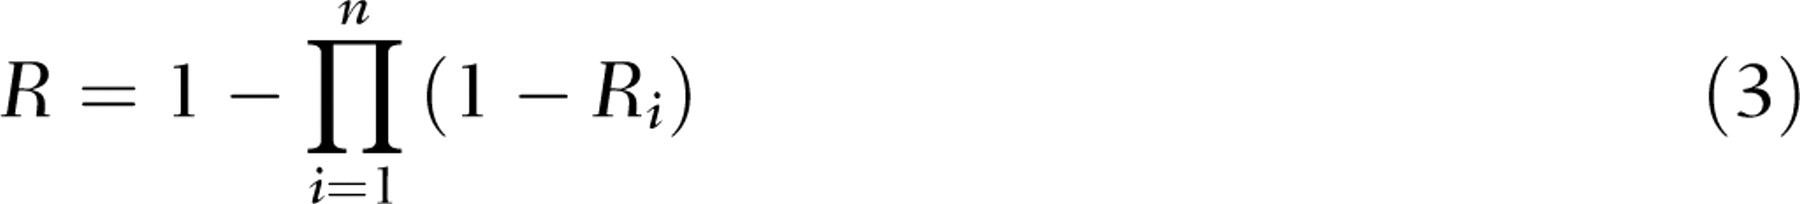
Dose addition is often used to predict the response to mixtures of chemicals that act through the same mechanism of action. All chemicals predicted to be acting by dose addition are placed in one group, or “cassette.” Predictions of dose addition are based on the ED50 and dose for each chemical and the average ρ value for all chemicals in the same cassette. The dose addition equation used was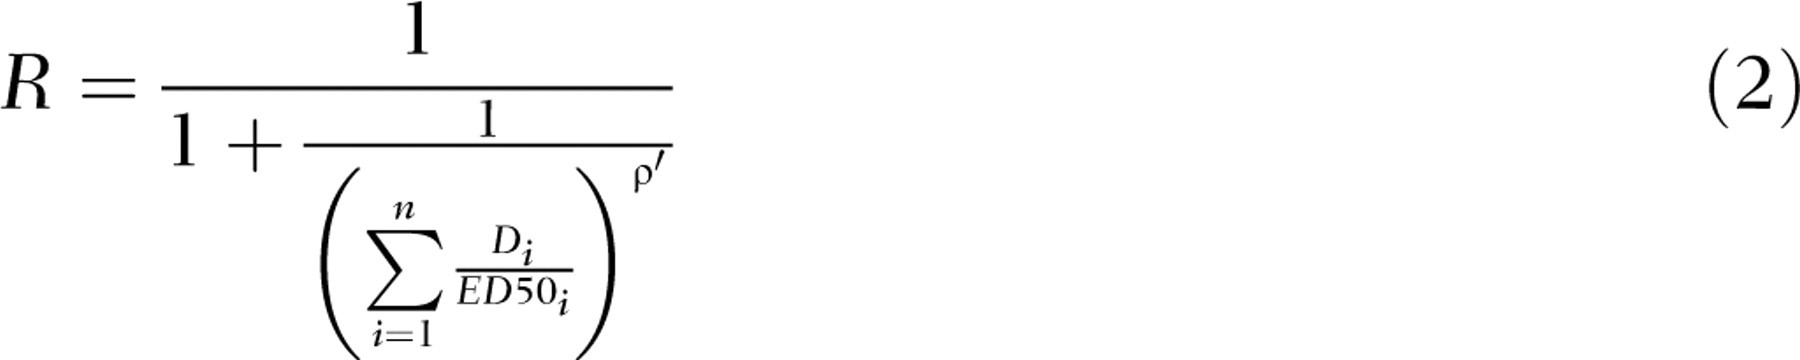
Effect Addition
Effect addition was used to calculate the response to mixtures containing chemicals acting through different mechanisms of action but with a common response—decreased circulating T4 concentrations. Effect addition places each component of the mixture in a separate cassette, and prediction of effect for individual chemicals is based on the ED50, dose, and ρ for the individual chemical. The equation used to calculate effect addition was
Integrated Addition
The integrated addition model was used to predict the response to a mixture containing chemicals with similar and dissimilar modes that affect a common downstream end point such as serum T4. To calculate integrated addition, chemicals were grouped into cassettes based on their primary or hypothesized mode of action. The response to the PHAHs was calculated in 1 cassette, based on a similar mode of action: upregulation of hepatic clearance of T4.
32
The response to the pesticides was calculated as a second cassette based on a hypothesized mode of action: decreased hormone synthesis.
55
Conceptually, dose addition is calculated within cassettes and effect addition is calculated between cassettes (Figure 1). The integrated addition equation described by Rider and LeBlanc (2005) that combines the concepts of dose and effect addition and was used for this prediction is
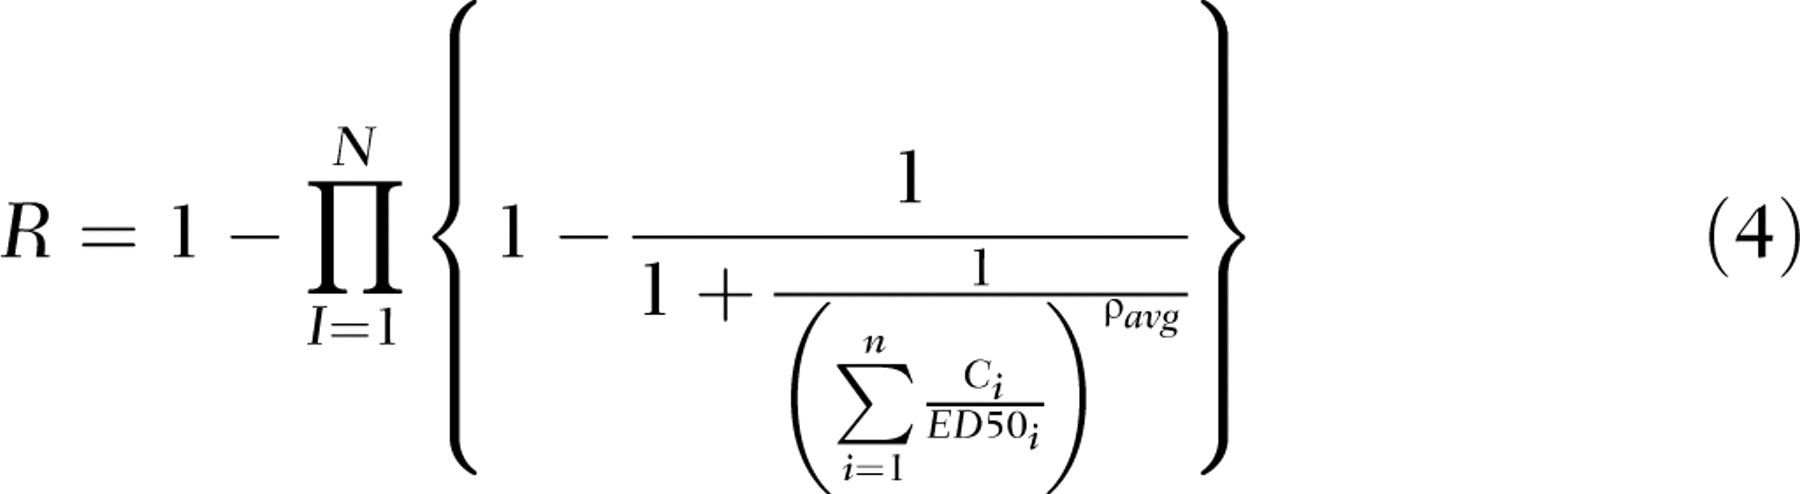
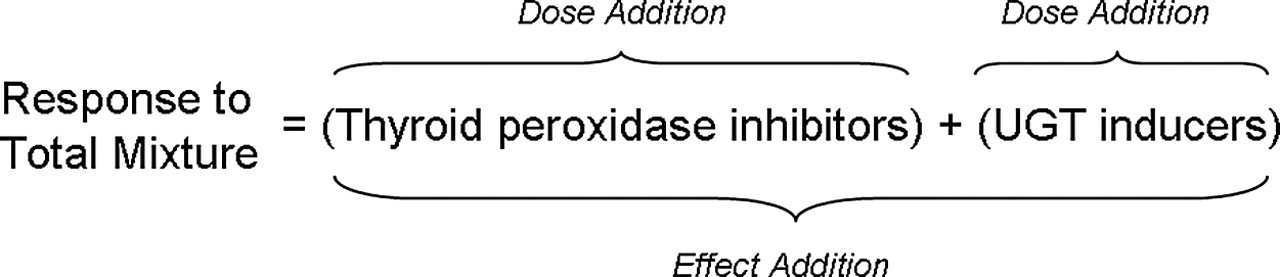
Schematic depiction of integrated addition model. The contributions of UGT-inducing chemicals (PHAHs) and thyroid synthesis inhibitors (pesticides) were calculated by dose addition. The total response to the mixture with PHAHs and pesticides was calculated using the effect addition model.
Model Analysis
The CATAM model used in this study was not designed to provide terms to determine statistical error of the predicted responses. Therefore, deviations between predictions and empirical data were determined by plotting model predictions against empirical data and comparing predictions to a line depicting a 1:1 correlation between the data and model predictions. Data points falling to the right of the 1:1 correlated line signify an overestimation of the effects of exposure (ie, empirical data greater than model predictions). Those points falling to the left of the 1:1 correlation show predictions that underestimate the effects of exposure (ie, empirical data less than model predictions). Empirical data were judged to significantly deviate from model predictions when the standard deviation associated with the data did not overlap with the line depicting a 1:1 correlation between the empirical data and modeled response. The results of all 3 models predicting the response to the PHAH and pesticide mixture were compared to determine which most closely predicted the mean values of the empirical data. The magnitude and direction of deviation (difference score) were calculated for each mixture dose group and prediction model (prediction mean minus empirical mean). In addition, the average difference score was calculated for each model (average of all difference scores for each model). Significant differences between the average difference scores were determined using a 1-way analysis of variance, followed by Duncan’s new multiple range test (PC SAS 9.1, SAS Institute, Cary, NC).
Results
Evaluation of Individual Chemical Components and PHAH or Pesticide Mixture
Exposure to the individual pesticides produced a dose-dependent decrease in the circulating levels of T4 (Figure 2). Pronamide was the most potent of the pesticides, with an ED50 of 116 mg/kg. Thiram and mancozeb each had an ED50 of approximately 250 mg/kg (Table 3). No induction of EROD, PROD, or T4-UGT was observed for thiram and mancozeb (data not shown). Small increases (2-fold) in T4-UGT were observed for pronamide at dose levels 2 to 4 times higher than those resulting in decreases in T3 and T4 (data not shown). Rats exposed to doses of 50 mg/kg or higher of thiram had less weight gain than did the control rats. Single chemical data describing T4 response for each component of the PHAH mixture 27 were reanalyzed with the same model used for the pesticides. The ED50 and slope parameters for each chemical are shown in Table 3. The PHAHs were more potent than the pesticides, with ED50 values ranging from 0.001 to 90 mg/kg (Table 3).
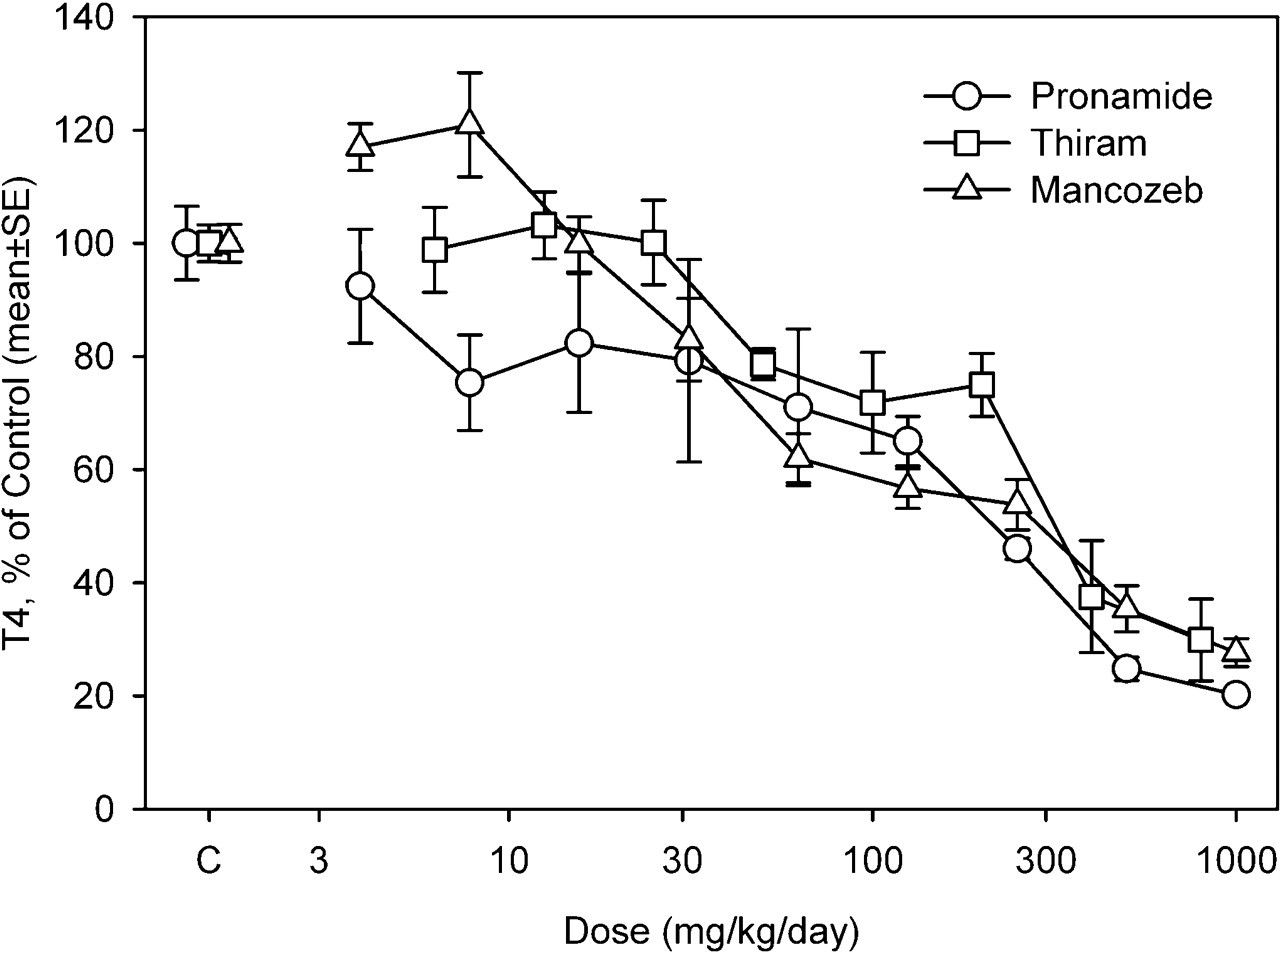
Effect of individual pesticides on serum T4 following a 4-day exposure. Data are presented as percentage of controls (±SE).
ED50 and ρ Values for Individual Components of the Mixture
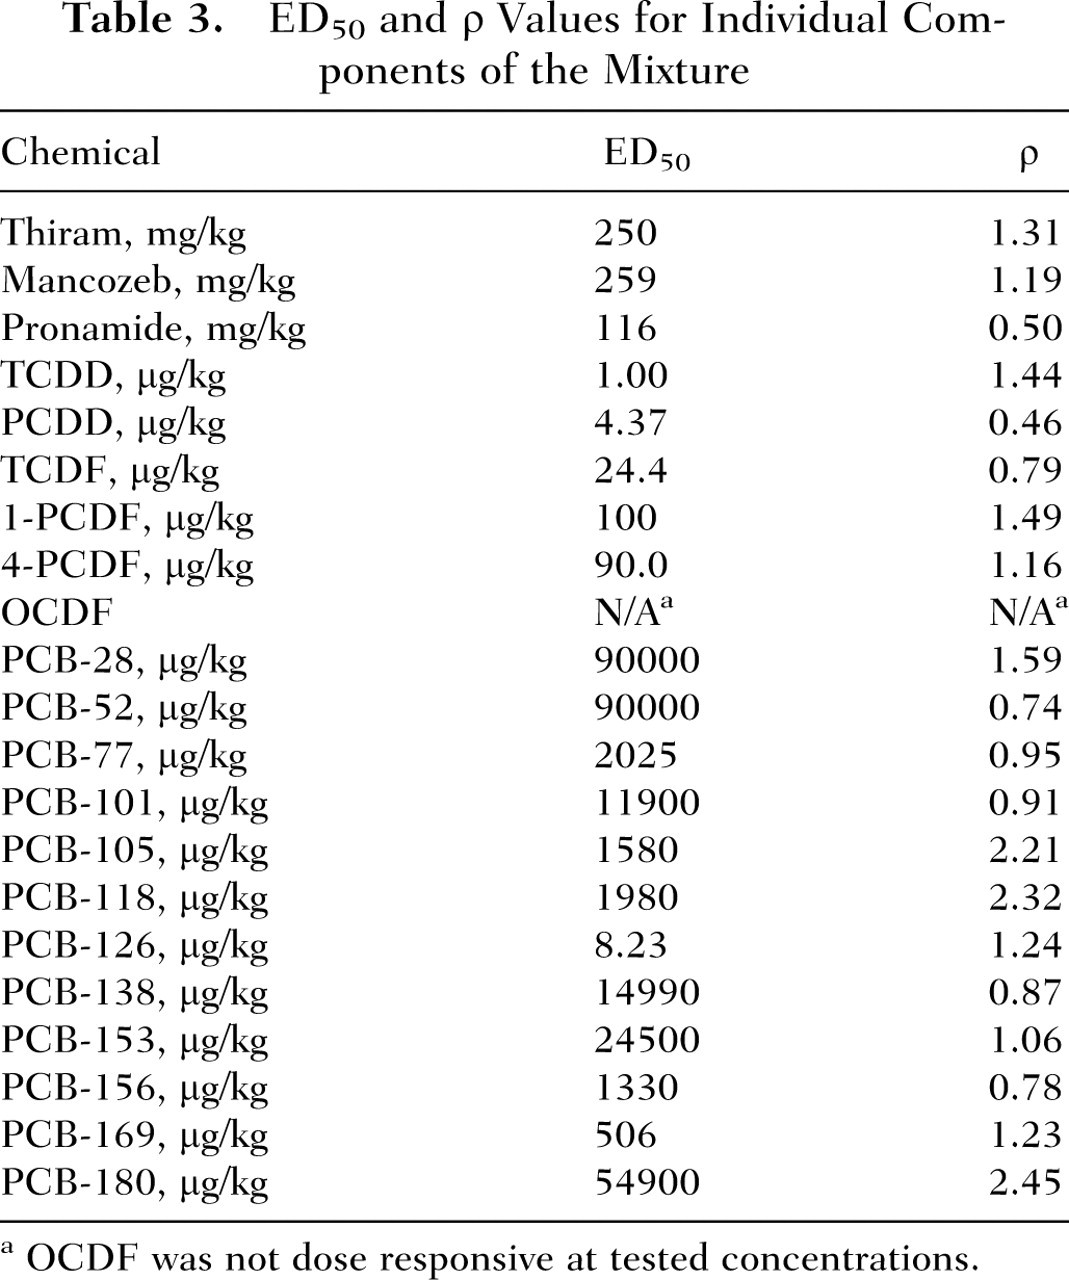
OCDF was not dose responsive at tested concentrations.
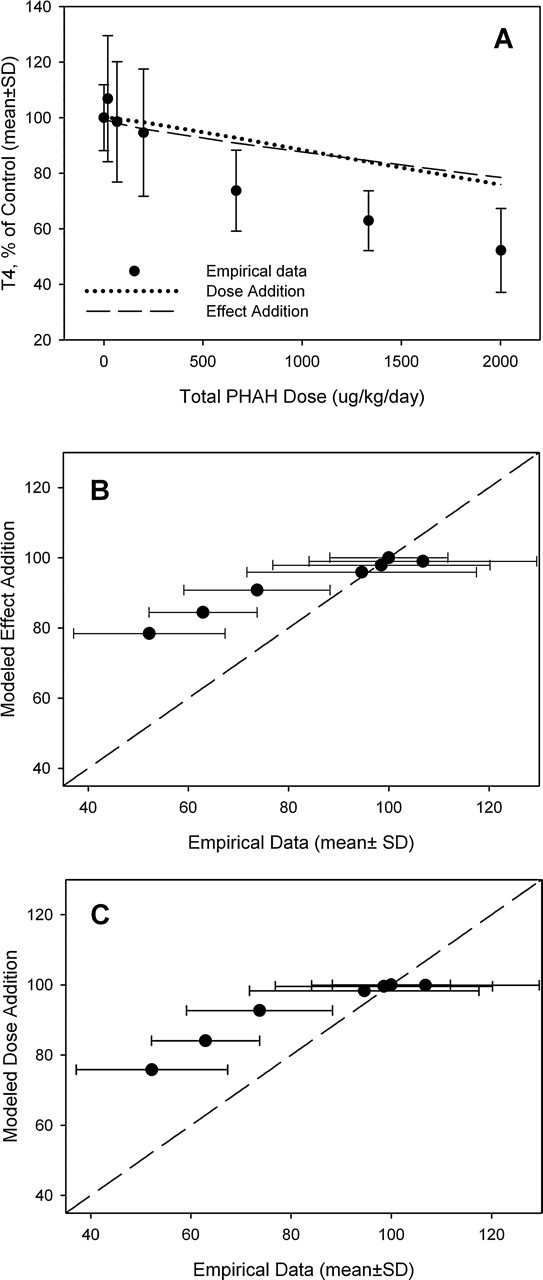
The pesticide mixture decreased serum T4 by up to 35% at the highest mixture dose (Figure 3a). The predictions of the dose addition and effect addition models were similar and did not deviate significantly from the experimental data (Figure 3, b and c). For the PHAH mixture, both the dose addition model and effect addition model resulted in similar predictions (Figure 4a). Both models predicted the response to the PHAH mixture up to 200 μg/kg (Figure 4a). The dose addition and effect addition models underestimated the changes in serum T4 concentrations at the 3 highest doses (667, 1335, and 2003 μg/kg) (Figure 4, b and c). This agrees with the predictions of a flexible single-chemical-required method used in the original analysis of these data. 27 The total doses of PHAHs used in the present study were 397 μg/kg or less, and these doses are not likely to deviate from dose additivity. Dose additivity between chemicals is assumed when grouping similar chemicals for the purpose of generating an integrated addition prediction, as was performed for the total mixture of PHAHs and pesticides.
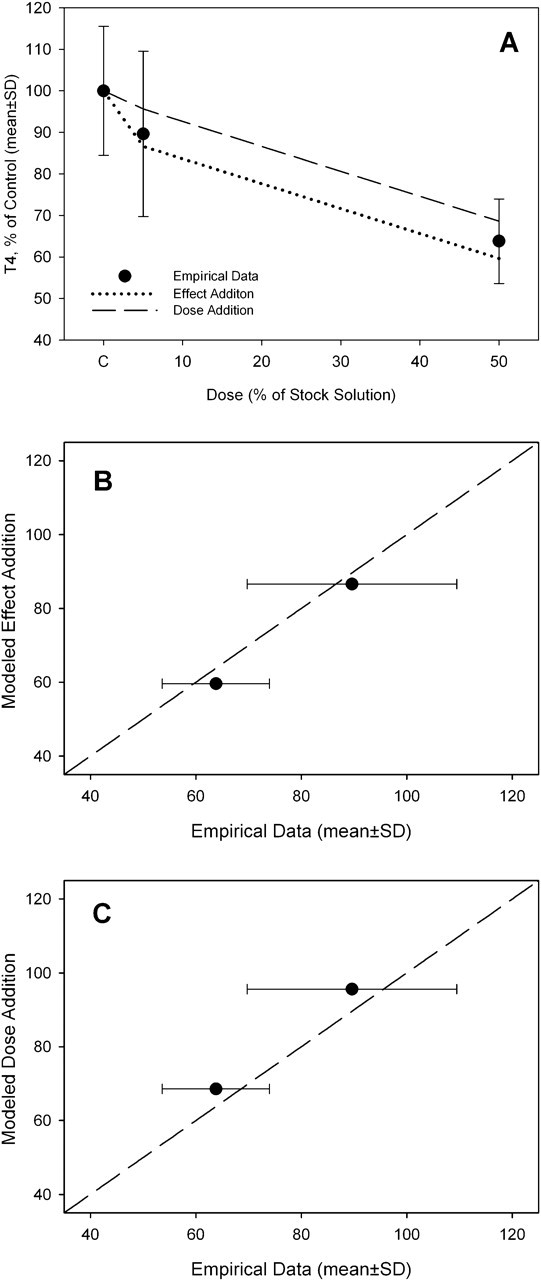
Predictive modeling of pesticide mixture. (a) Comparison of dose addition and effect addition models to empirical data of pesticide mixture. (b) Deviation between empirical data and effect addition model. (c) Deviation between empirical data and dose addition model. The dashed line represents 1:1 congruence between model predictions and empirical data.

Predictive modeling of PHAH mixture. (a) Comparison of dose addition and effect addition models to empirical data of PHAH mixture from Crofton et al. 27 (b) Deviation between empirical data and effect addition model. (c) Deviation between empirical data and dose addition model. The dashed line represents 1:1 congruence between model predictions and empirical data.
No mortality was observed during exposure to the mixture of PHAHs and pesticides, and the only visible sign of toxicity occurred in the highest dose group, where animals gained an average of 35% (approximately 10 g) less weight than controls (data not shown). The mixture produced a dose-dependent decrease in serum thyroxine (Figure 5a). Model predictions based on dose addition, effect addition, and integrated addition were compared with the empirical data (Figure 5, b-d). The dose and integrated addition models resulted in similar predictions. The effect addition model predicted greater effect of the mixture compared with the dose and effect addition models (Figure 5a). Significant deviations from predictions (standard deviations of empirical data that did not overlap the line depicting a 1:1 correlation) were observed in the following models and doses: effect addition, 3.3% and 50%; dose addition, 66%; integrated addition, 3.3% (Figure 5, b-d). The results of all 3 models were compared to determine which model most closely predicted the mean value of the empirical data for each dose group (Figure 6, a and b). In general, the dose and integrated addition models deviated less from the empirical data than the effect addition model in all but the 66% dose group. The effect addition model overestimated the effects of exposure (empirical data greater than model prediction) to the mixture by 6 to 21 difference units. The average difference scores for the 3 models were –10.8 for effect addition, –0.3 for dose addition, and –2.1 for the integrated addition models (Figure 6b). There was a significant main effect of model (F 2,21 = 3.84, P < .0378). The difference score for the effect addition model was significantly larger compared with both other models, and there was no significant difference between the dose and integrated addition models.
Predictive modeling of PHAH and pesticide mixture. (a) Comparison of dose addition, effect addition, and integrated addition models to empirical data of PHAH and pesticide mixture. Empirical data are plotted as a function of predicted effect for the (b) effect addition model, (c) dose addition model, and (d) integrated addition model. The dashed line represents 1:1 congruence between model predictions and empirical data.
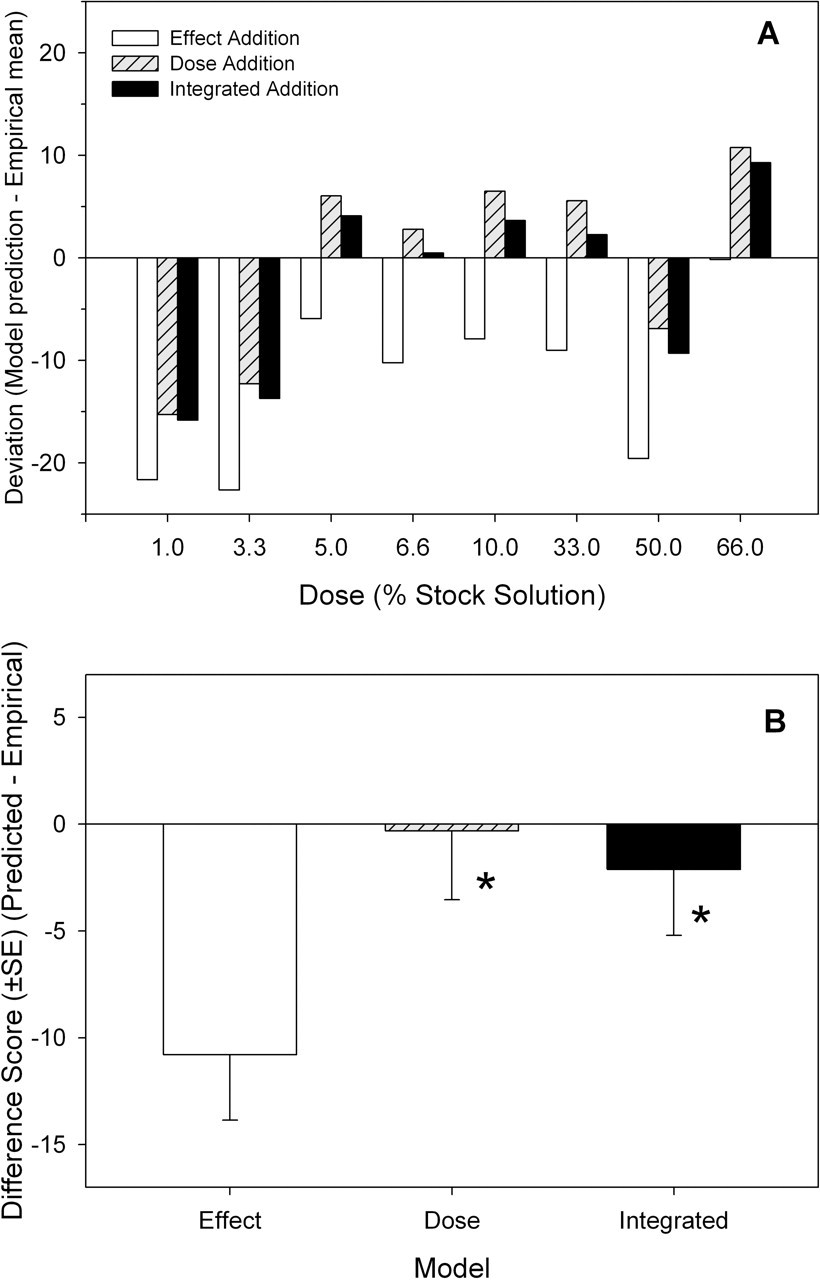
Deviation between model predictions and empirical data. (a) Magnitude and direction of deviation between model predictions and empirical data. (b) Average deviation from model predictions.
Discussion
The present study evaluated the hypothesis that an integrated addition model, compared with either a dose addition or an effect addition model, best predicts decreased serum T4 concentration in rats exposed to a mixture of chemicals that act via more than one mode of action. Single chemical data were used to predict the effects of a PHAH mixture, a pesticide mixture, and a combination of both mixtures using dose, effect, and integrated addition models. The dose addition and effect addition models provided good predictions of the pesticide mixture and PHAH mixture data. For the combined mixture of pesticides and PHAHs, both the dose and integrated addition models yielded better predictions compared with the effect addition model, which overestimated the empirical data. For the combined mixture, the predictions of the integrated model were not significantly better than the dose addition model. These results do not suggest that the integrated addition model is more useful than the dose addition model in predicting the effects of this complex mixture on common effects downstream from multiple target sites.
The effect addition model overestimated the decrease in serum T4 for the combined PHAH and pesticides mixture. This overestimation may be due to poor sigmoidal fits of several individual chemicals. A few chemicals (most notably pronamide and PCDD) resulted in low ρ values and did not fit well to all points in the dose-response curve. This could cause an overestimation of effects when calculating the response to individual chemicals to be used in effect addition. Chemicals with the same mechanism of action are assumed to have similar slopes (ρ values). 56 Averaging slope values, as is done for dose addition and within cassettes of integrated addition models in CATAM, lessens the potential for overestimating the predicted mixture response from chemicals with low ρ values. The effect addition model bases the predicted responses of individual chemicals on their actual ρ values (rather than an average), thus leading to response overestimations of some compounds. For the combined mixture of pesticides and PHAHs, the integrated addition model and dose addition model both closely predicted the same trends. This is likely due to similar average ρ values for the pesticides and PHAH groups. For the PHAH-only mixture, both the effect and dose addition models underpredicted the empirical finding at the 3 highest mixture doses. This is consistent with previous modeling of this data by Crofton et al 27 using a single-chemical required model that relies on dose addition theory.
The comparison of the 3 models for the combined mixture should be viewed with some caution because of the doses used for the PHAHs and the pesticides in the combined mixtures. The highest PHAH mixture dose (397 μg/kg) would be expected to produce about a 5% to 10% decrease in T4 (see Crofton et al 27 ). The highest dose of the pesticide mixture dose (115 mg/kg) would be expected to produce about a 40% to 45% decrease in T4. Thus, the contribution of the pesticides to the effect of the combined mixture was likely much greater than the PHAHs. Because the combined action of the pesticides was well described by dose addition, it is not surprising that dose addition predicted the effects of the combined PHAH-pesticide mixture. A drawback to the statistical models used herein is that they may not be sensitive enough, nor were they designed, to discriminate the components responsible for the outcome. In addition, the current model did not assess possible toxicokinetic interactions, where one chemical alters the metabolism and/or target tissue concentration of another chemical in the mixture, that can affect the outcome. 57,58 Regardless of these issues, the dose addition and integrated addition models were better than effect addition in predicting the outcome of the combined mixture.
Animals exposed to the highest dose of the PHAH and pesticide mixture (66%) gained significantly less weight than control animals. This may be due to one chemical, thiram. In the single chemical studies, thiram dosed at 50 mg/kg/d showed a similar decrease in weight gain, which is approximately the highest dose used in the mixture studies. In addition, thiram has been reported to decrease weight gain in chronically exposed animals. 59 The concentrations of T4 at this dose were still consistent with predictions of integrated addition, so it is not likely that reduced weight gain caused a significant effect on T4. However, dose addition significantly overestimated the response to the mixture at exposure to 66% of the stock solution. These changes in body weight gain are early indicators of systemic toxicity, which may confound the predictivity of the addition models at high doses.
The mechanisms of action of thiram and pronamide are not completely understood but are likely similar to other TPO inhibitors. Chinese hamster ovary cells transfected with the human TPO gene show no effect of thiram on TPO inhibition when using iodination of a Glu-Tyr-Glu peptide and oxidation of guaiacol as end points. 60 However, TPO is complex enzyme that functions beyond iodination, such as the coupling of monoiodinated tyrosine/diiodinated tyrosine to make T3 and T4. 61 Thus, although thiram may not inhibit iodination or oxidation of guiacol in vitro, it may inhibit those processes in vivo or inhibit other functions of this enzyme that are involved in TH synthesis. Other data indicate more similarities between thiram and pronamide and other TPO inhibitors than thyroid hormone disruptors that induce UGTs or inhibit deiodination. Exposure to thiram and pronamide results in significant decreases in T4 in rats with characteristics similar to other TPO inhibitors such as mancozeb. 21,39 There was no induction of T4-glucuronidation or enzymatic markers of CYP induction (EROD and PROD). Only small increases (2-fold) in UGTs were observed for pronamide at doses 2 to 4 times higher than those that resulted in hormone decreases. Thus thiram and pronamide are not likely to decrease THs through hepatic effects at the current tested doses. Additionally, they are not likely to be specific inhibitors of deiodinases because exposure does not cause a significant increase in circulating T4, a hallmark of deiodinase inhibitors. 16 Therefore, for the purpose of this study, thiram and pronamide were placed into the TH synthesis inhibitor group.
A number of uncertainties, common to animal mixture studies, constrain the human significance of the current findings. 20,27 The current work used a weanling animal model with a short exposure duration (ie, 4 days) that may confound extrapolation of long half-life chemicals like PHAHs. Results from these short-term exposures may not accurately predict the effects of real-life chronic low-level exposures. The pesticide doses used were much higher than the reference dose used for regulatory purposes. For example, the acute reference dose for thiram is 16 μg/kg/d. 62 Additionally, species extrapolation of the current work is hampered by uncertainty in how the mode of action of the TDCs may differ between rats and humans. 63-65 For example, differences in serum-binding proteins between humans and rats have led to the conclusion that rodent thyroid follicular tumors caused by prolonged upregulation of TSH are not relevant to human health. 16,66,67 Additionally, in vitro data suggest that binding of environmental contaminants to the pregnane X receptor may active hepatic metabolism of thyroid hormones in rats, whereas in humans these same chemicals may act as antagonists at this receptor. 68
Research is beginning to focus on the effect of complex mixtures of chemicals that target the same physiological end point but do so through various mechanisms of action. Altenburger et al 69 calculated the combined effect of concentration and effect addition to better predict the response of unicellular algae to a 10-compound mixture of toxicants found in sediment. An integrated model more accurately predicted the toxic effects of 14 nitrobenzenes on a green algae compared with response or concentration addition. 44 An integrated addition and interaction model has been developed that incorporates terms for toxicokinetic interactions. 46 This approach adds coefficient of interaction terms to describe certain components of the mixture that affect the potency of others. Predictions produced by this method were far superior for their mixture of organophosphates and a P450 inhibitor to those that only used dose addition, effect addition, or an integrated addition. 46 These models show promise for accurately predicting response to chemical mixtures especially when modes of action for individual chemicals are understood. In the current study, calculating the contribution of TH synthesis inhibitors and TH clearance enhancers by integrated addition resulted in predictions that were closer to the empirical data than effect addition alone but were not better then dose addition. Dose addition has been reported to provide a better prediction of the empirical effects of a 7-androgen disruptor mixture compared with integrated addition. 70 Clearly, more research is needed to characterize and compare different additivity models.
A variety of environmental xenobiotics decrease circulating thyroid hormone concentrations in animal models. Present estimates of hazard associated with exposures to chemicals that decrease circulating thyroid hormones focus on a chemical specific basis. The present study demonstrates that these chemicals have the potential to interact in an additive manner. Although these data suggest that a cumulative risk assessment approach to thyroid hormone disruptors may be useful, it presents several challenges. Dose-response information on thyroid hormone concentrations in developmental studies is rarely available but is a critical component for predictive mixture models. Developing such data sets would provide a better scientific basis for future cumulative assessments for thyroid hormone disruptors.
Footnotes
Acknowledgments
The information in this document has been funded wholly (or in part) by the United States Environmental Protection Agency/North Carolina State University Cooperative Training Program in Environmental Sciences Research (CT826512010 to JLF). The manuscript was reviewed following the policy of the National Health and Environmental Effects Research Laboratory, US Environmental Protection Agency and was approved for publication. Approval does not signify that the contents necessarily reflect the views and policies of the agency, nor does mention of trade names or commercial products constitute endorsement or recommendation for use.
We thank Drs Josh Harrill and Marcello Wolansky for technical assistance and Dr Cynthia Rider for expertise with the mixture model. We gratefully acknowledge Drs David Buchwalter, Andrew Wallace, Linda Birnbaum, and Stephanie Padilla for invaluable comments provided during the preparation of this document.
Note: All raw data used in this manuscript are freely available for alternative analyses. Please direct requests to the corresponding author.