
Abstract
This paper provides some of the first evidence on the relationship between Head Start funding expansions and program inputs. We take advantage of the county–year variation in funding increases that were implemented due to a number of legislated policy changes in the late 1980s and throughout the 1990s. By focusing on the period between 1988 and 2007, we show that the funding increases were directed at increasing total and full-time enrollment. We also show that the funding expansions were used to make several quality-related investments, including increasing the number of teachers and staff and upgrading the skill level of teachers.
Introduction
Since its inception in 1965, Head Start has become one of the most important early childhood education (ECE) programs in the U.S. Designed as a two-generation program; Head Start provides education and health services to economically disadvantaged children as well as a variety of social services to parents. Today, Head Start receives approximately $10 billion in federal funding to serve nearly nine hundred thousand children (Office of Head Start 2019). Given its size and importance, the program has been studied extensively using several data sources and methodologies, with the results showing positive effects on child development in the short run and schooling and labor market outcomes in the long run. 1
Although the evidence on program impacts is well established, relatively little is known about the program-level (supply side) changes in response to funding increases. In this paper, we provide some of the first evidence on how federal funding increases are allocated to two key program characteristics: enrollments and quality inputs (e.g., teacher training and education, staff compensation, classroom group sizes, and child-to-teacher ratios). Specifically, our empirical analysis studies the impact of a series of legislated funding increases throughout the 1980s and 1990s, during which federal funding grew from $2 billion to $7 billion. 2 This federal funding increase occurred at different times and in different locations, and our analysis exploits this variation to analyze the relationship between funding expansions and program inputs.
Our analysis dataset merges information on Head Start funding records from the Consolidated Federal Funds Reports (CFFR) with grantee-level characteristics from the Office of Head Start's Program Information Reports (PIR) from 1988 to 2007. Our outcome variables relate to Head Start enrollments (e.g., total and full-time) and quality-related inputs (e.g., number of staff, staff education levels, compensation, and child-to-teacher ratios). Given that all variables are measured in county–year cells, our dataset consists of a panel of counties over a twenty-year period, thereby allowing us to take advantage of within-county over-time variation in Head Start funding per child, controlling for unobserved permanent differences across counties as well as time-varying national shocks that may be correlated with program funding.
Our key findings can be summarized as follows. First, we confirm that Head Start funding increased substantially during the study period. In particular, our descriptive analysis shows that per child Head Start spending tripled between 1988 and 2007, with most of the growth occurring during the 1990s. Second, we show that counties experiencing economic hardship, those with a larger share of the Black population, and those with higher government assistance per capita receive more Head Start funding. Third, results from our regression models suggest that the funding expansions were moderately successful in achieving their intended goals. On the one hand, the additional funding substantially increased overall program enrollment and full-time enrollment. Our preferred estimate implies that a $1,000 increase in Head Start funding per child increased enrollment by 25 percent and full-time enrollment by 14 percent. These overall enrollment effects were driven by the substantial response by Hispanic children, whose enrollment rate increased by 66 percent. In addition, the funding was used to make a variety of quality investments, such as increasing the number of teachers and staff and upgrading the skill level of teachers. However, our results also point to the potential limits of such funding increases, given that critical inputs like student–teacher ratios and teacher compensation were not affected.
This paper contributes to the literature on Head Start in multiple ways. First, many studies within the literature exploit variation in program funding to identify the impact of Head Start on children's outcomes (Bailey et al. 2021; Barr and Gibbs 2022; Currie and Neidell 2007; Kose 2023; Ludwig and Miller 2007; Thompson 2017). Although these studies suggest a strong link between program funding and child development, little attention has focused on the mechanisms through which this funding improves child well-being. This paper attempts to fill this gap by focusing explicitly on how funding increases are used to alter the supply and characteristics of Head Start programs. We do so by analyzing the input decisions during a period of unprecedented funding growth. Thus, our results may shed light on how these funding-induced program changes ultimately influence children's outcomes.
Second, our results offer clues about whether the funding is allocated to the most developmentally productive program inputs. The funding-induced increase in Hispanic enrollment is a positive development, in light of the evidence that Head Start has larger positive effects on Hispanic children (e.g., Currie and Thomas 1999; Kose 2023). In addition, the funding used to increase full-time enrollment seems important, given the results in Walters (2015) that the positive impact of Head Start participation largely operates through the full-time enrollment channel. Third, our finding that the 1990s funding expansion increased the number of Head Start teachers with higher levels of field-specific education is inconclusive from a developmental perspective. The evidence suggests that teacher credentials have mixed effects on classroom quality (Early et al. 2006, 2007) and null effects on child development (Early et al. 2006, 2007; Mashburn et al. 2008). Finally, although statistically imprecise, it is encouraging that teacher–pupil ratios increased somewhat and that staff turnover rates did not change in light of the increase in teacher education levels. The fact that the ratios did not decline and the turnover rates did not increase is encouraging from a developmental perspective (e.g., Chetty et al. 2011; Ronfeldt et al. 2013).
Background and Related Literature
History and Description
The Head Start program began in 1965 as part of President Johnson's War on Poverty initiative to provide education, health, and other social services to low-income children and their families. Since its inception, the program experienced a series of policy changes to expand its reach, services, and quality. We summarize these policy changes in Figure 1 while focusing on the period 1988–2007, which coincides with the timing of our data availability.
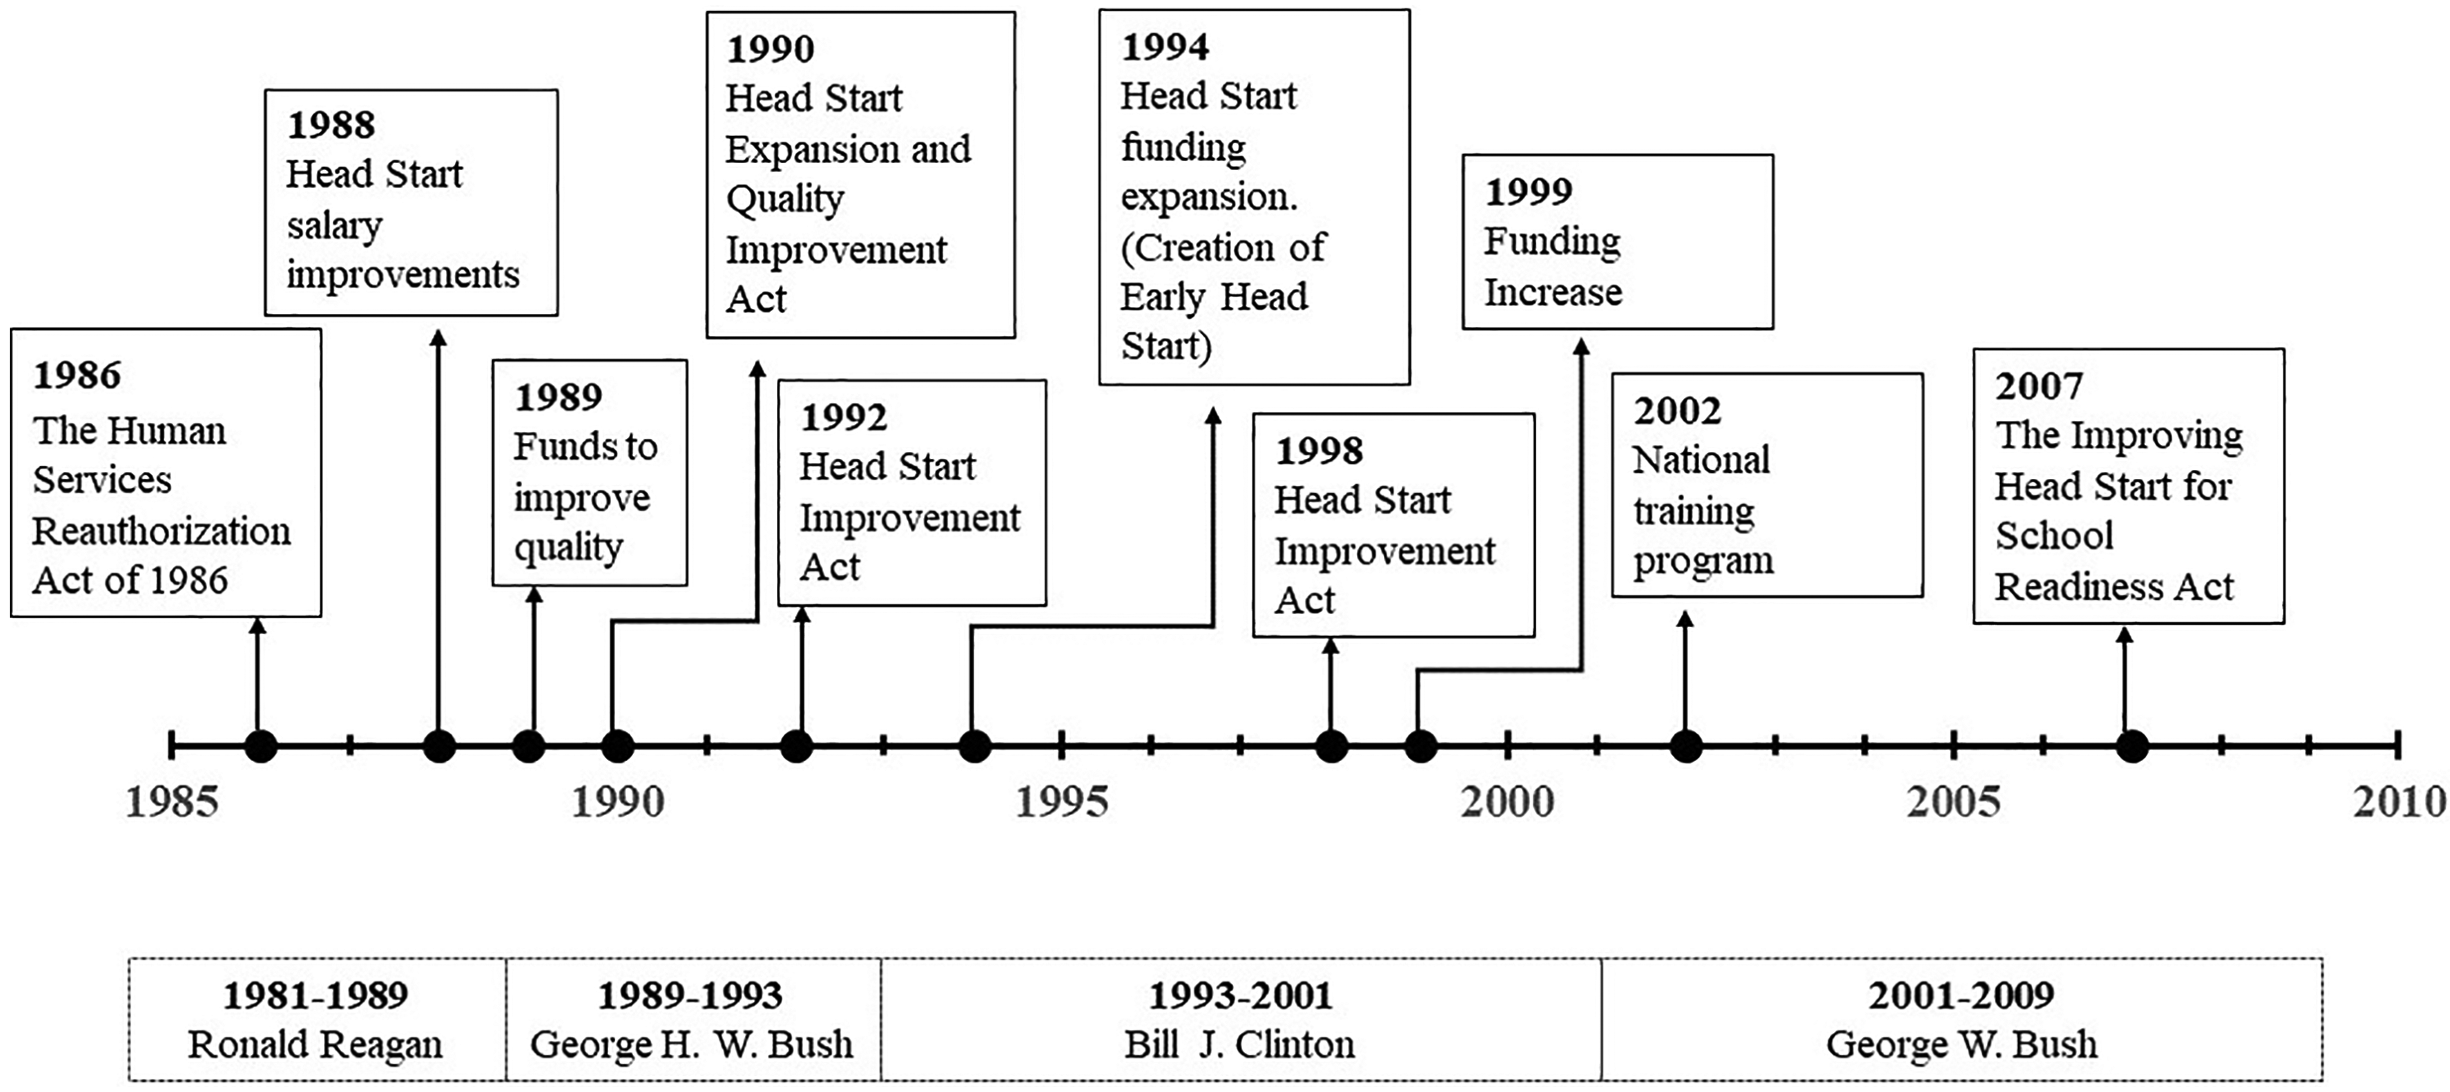
Timeline of Head Start policy changes.
Funding for the program is provided by the Federal Government annually to states using a formula based on the number of families receiving welfare benefits, the number of unemployed, and the number of children living below the poverty line (Community Services Act of 1974). However, the money does not get distributed to the states directly. To acquire funding, local agencies directly apply to the Head Start Bureau, which is administered under the U.S. Department of Health and Human Services to provide services. In the process, local agencies must provide at least 20 percent of the financing, which may include in-kind contributions from community partners (Currie and Neidell 2007). In addition to federal funding, a local agency could attract funds from other grants or local community partners (Currie and Neidell 2007; Kose 2023). While this is the case, in our paper, we focus on increases in funding from the Federal Government due to legislative changes. Historically, Head Start grantees have had different sizes, sponsoring organizations, and costs which may be driven by their geographic location, access to resources, and other dimensions. These differences lead to substantial variations in the funding per child across geographic locations.
Throughout the 1980s and 1990s, a number of legislative revisions were made to Head Start, which both increased funding for the program while raising the quality requirements for individual grantees. Beginning in 1986, when Head Start was reauthorized, discussions led Congress to set aside funds for salary improvements for teachers starting in 1988. In addition, during the George H.W. Bush administration, between 1989 and 1993, the Head Start program received significant attention, culminating in a series of funding expansions to increase enrollment and quality. These initial program changes culminated in the passage of the Head Start Expansion and Quality Improvement Act of 1990, which increased funding for quality improvement and teacher training. More specifically, this act set minimum requirements for teachers for the first time by mandating that every classroom have at least one teacher with a Child Development Associate (CDA) credential or an ECE degree.
In 1992, Head Start funding increased once again to extend services to an additional 180,000 children and families. In addition, Congress passed the Head Start Improvement Act of 1992 to provide health services for younger siblings and child development and literacy training for parents. The Head Start program continued to grow and transform throughout the Clinton era. The Head Start Amendments Act of 1994 emphasized the importance of staff qualifications and professional development and increased salary compensation for Head Start staff. 3 Furthermore, performance standards were revised, and monitoring was improved. In 1998, Congress reauthorized Head Start through the Community Opportunities, Accountability, and Training and Educational Services (COATES) Act, which once again increased the minimum standard for teachers’ education levels by requiring at least one teacher in each classroom and 50 percent of teachers nationwide to have an associate's degree in ECE or a related field by 2003. This legislation also mandated increases in annual funding, some of which were directed toward improving staff salaries and benefits.
During the George W. Bush administration, Head Start funding growth stalled, with a shift in emphasis on children's school readiness. In 2002, a national training program for teachers was implemented to learn early literature teaching techniques. In the following year, the Head Start National Reporting System (NRS) was introduced to assess children's academic progress and skill attainment in language, literacy, and mathematics. The NRS was replaced in 2007 through the Improving Head Start for School Readiness Act, which created five-year term limits for grantees and introduced additional domain indicators for children's early learning goals. Notably, the 2007 legislation again increased Head Start teachers’ education requirements, mandating that 50 percent of teachers nationwide have a bachelor's degree in ECE or a related field by 2013.
As a result of these policy reforms, Head Start funding grew from $2 billion in 1988 to nearly $7 billion in 2007 (in constant 2008 dollars), and program enrollments increased from four hundred thousand children to nine hundred thousand children.
Relevant Head Start Literature
Head Start has served low-income children and families for more than fifty years and has been evaluated extensively. The extant literature focuses on the effect of Head Start on children's human capital and health outcomes and is shown that Head Start improves children's long-term outcomes. 4 Relevant to our work, a few papers have examined Head Start's funding availability and program extensions on children's outcomes in the first fifteen years after the program's introduction (Bailey et al. 2021; Barr and Gibbs 2022; Johnson and Jackson 2019; Ludwig and Miller 2007; Thompson 2017). Recent papers by Kose (2023) and Wikle and Wilson (2022) analyze the effect of Head Start funding expansions in the 1990s on children's outcomes and maternal labor supply decisions, respectively. We contribute to this literature by examining the effect of Head Start program funding expansions in the 1990s on program characteristics. Our paper provides additional insights by showing funding expansions led to an increase in program enrollment, full-time enrollment, and the number of teachers and staff. To our knowledge, our paper is the first to link the funding changes on the supply side.
In addition, Currie and Neidell (2007) investigate whether higher Head Start funding is associated with better cognitive and behavioral outcomes for children. They find that indeed children who were exposed to higher Head Start funding levels had better test scores. Taking advantage of detailed administrative budget data, the authors also show that higher education and health expenditures in Head Start programs were associated with better behavioral outcomes for children. In a recent paper, Kose (2023) finds that increases in Head Start funding lead to improved test score outcomes for children in Texas, particularly among Hispanic children. These findings suggest that there is a strong link between program funding and children's outcomes. Overall, these findings are consistent with those in Jackson (2020) and Jackson et al. (2016), which show that K-12 public school spending has sizable short- and long-run effects on student outcomes.
The effect of full-day versus part-day Head Start program participation is less studied in the literature due to data limitations. A unique paper by Frisvold and Lumeng (2011) examines the effect of full-time Head Start enrollment compared to part-time on childhood obesity in the 1990s in Michigan and reports that full-day enrollment lowered the proportion of obese children in the programs.
Particularly relevant to our study are papers by Bassok (2013) and Wikle and Wilson (2022). The former paper focuses on the relationship between Head Start teachers’ educational attainment and other programmatic changes (i.e., service offerings, staff structure, and staff composition), exploiting the 1998 Head Start Reauthorization Act, which mandated that 50 percent of all teachers have an associate's degree in ECE or a related field. Using Head Start administrative data, the paper shows that the share of teachers with such a degree increased from 38 percent in 1999 to 85 percent in 2011. The paper also finds that raising teacher education levels was not associated with reductions in health or social service offerings but led to changes in staff composition. While complementary to this work, our paper is distinct in several ways. First, our paper spans a longer time period, which allows us to leverage multiple legislated funding increases, and therefore provides significantly more policy variation than is available in Bassok (2013). Second, we directly estimate the impact of funding increases not only on teachers’ education levels but also on many of the program inputs evaluated by Bassok (2013). We argue that studying changes in funding is important because it is the most salient policy lever available to catalyze other desired programmatic changes, including those to teachers’ education levels.
The paper by Wikle and Wilson (2022) is primarily concerned with estimating the impact of Head Start funding increases throughout the 1990s and the labor market outcomes of single mothers. To set up the main analysis, the paper first examines the relationship between funding increases and children's enrollment in preschool using survey data from the (October) Education Supplement to the Current Population Survey (CPS). The paper finds that Head Start funding increases led to higher preschool enrollments among disadvantaged children. In contrast, Wikle and Wilson (2022) are only able to test a generic variable measuring preschool enrollment (based on a survey item measuring “school” enrollment); our paper, which relies on Head Start administrative data, directly tests changes in Head Start enrollment. Furthermore, our paper explores changes in a variety of program inputs (e.g., teacher education, number of staff, and teacher–pupil ratios), while the paper by Wikle and Wilson (2022) does not study these outcomes.
Taken together, there is a large literature analyzing the effect of Head Start on children's outcomes. Our paper complements this literature by providing evidence on how program-level inputs change in response to funding increases. As a result, our paper may shed light on not only how local Head Start administrators allocate funding toward key inputs but also the potential mechanisms through which Head Start influences child well-being.
Data
Data Construction
We use several data sources on Head Start funding, program characteristics, and county-level socioeconomic characteristics to analyze the impact of Head Start funding expansions on program inputs at the county–year level between 1988 and 2007. We exclude Alaska, Hawaii, and other U.S. territories from our analysis. All the monetary values are expressed in constant 2008 dollars. Our analysis ends in 2007 mainly because 2008 marks the first year of the Great Recession, one of the worst economic downturns in U.S. history. As Brown and Herbst (2022) show, the early education sector is heavily influenced by macroeconomic conditions. One advantage of the provision of Head Start at the federal level is that the federal government can intervene to lessen the burden of recessions on the program. Indeed, as part of the American Recovery and Reinvestment Act (ARRA), an additional $2.1 billion in funding was allocated to the Head Start program to stabilize operations and expand enrollment. As a result, we believe that this unprecedented increase in funding would affect the interpretation of our results if the analysis period extended beyond 2007.
We compile Head Start funding data from the CFFR, which contains information on federal program appropriations annually with a grant identification code and the location for each grant (state and county). 5 , 6 We collapse the CFFR data at the county and year level to determine the funding allocation to each county. We then validate the CFFR data with published annual Head Start funding records that are reported by the Office of Head Start. 7 Figure A.1 compares Head Start funding levels between 1983 and 2007 using published federal appropriations and aggregated annual funding using CFFR. This figure shows that patterns of funding levels and changes over the years align well across the two data sources, except for 2000 and 2006. For those years, CFFR shows funding levels dropping significantly. To account for this, we assign the average value of funding between the two data points for each county in those years. 8
For Head Start program characteristics, we use detailed annual grantee-level data from the Office of Head Start's PIR. 9 The PIR data have been collected since 1988 from Head Start grantees and delegate agencies, providing comprehensive information on program and staff characteristics as well as the services received by children and families. Important for our purposes, these data include Head Start enrollment counts by race and ethnicity, full-time enrollment counts, the number and characteristics of teachers and staff, and staff compensation.
We construct county-level population counts for children aged three and four using data from the Surveillance, Epidemiology, and End Results (SEER) program. Using the population of age-eligible children, we create “per child” measures of the funding and program variables. 10 Importantly, SEER reports county–year-level population in total and by race, which we use as control variables, including the total population, percent Black, and percent White population.
As additional county-level control variables, we include the unemployment rate from the Bureau of Labor Statistics (BLS) and transfer payments per capita from the Bureau of Economic Analysis’ Regional Economic Accounts (REIS). The REIS data contain per capita income and per capita funding for Social Security, Supplemental Security Income, Supplemental Nutrition Assistance, and Unemployment Insurance programs. 11
Finally, we compile data from the Small Area Income and Poverty Estimates (SAIPE) that report counts of children ages 0–17 and 5–17 living in poverty for 1989, 1993, 1995, 1998, and 1999 and between 2000 and 2008. Interpolating data for the missing years, we generate a population count for children ages 0–4 living in poverty by subtracting children ages 5–17 from children 0–17 for each county and year. We then create the county–year-level poverty rate for children ages 0–4 and use it as a control for material well-being. 12
Summary Statistics
This analysis focuses on the period between 1988, when the PIR data first became available, and 2007, just before the Great Recession hit the U.S. economy. Figure 2 presents the time series in total and per-child Head Start funding during this period. While total funding increased from $2 billion to $7 billion, Head Start funding per child tripled from $1,000 to $3,000. To demonstrate the county-level variation in funding levels over time, we chose the following five states: Alabama, Minnesota, New York, Pennsylvania, and Washington. Figure 3 shows that there is substantial variation in funding levels across counties and within a county over time.
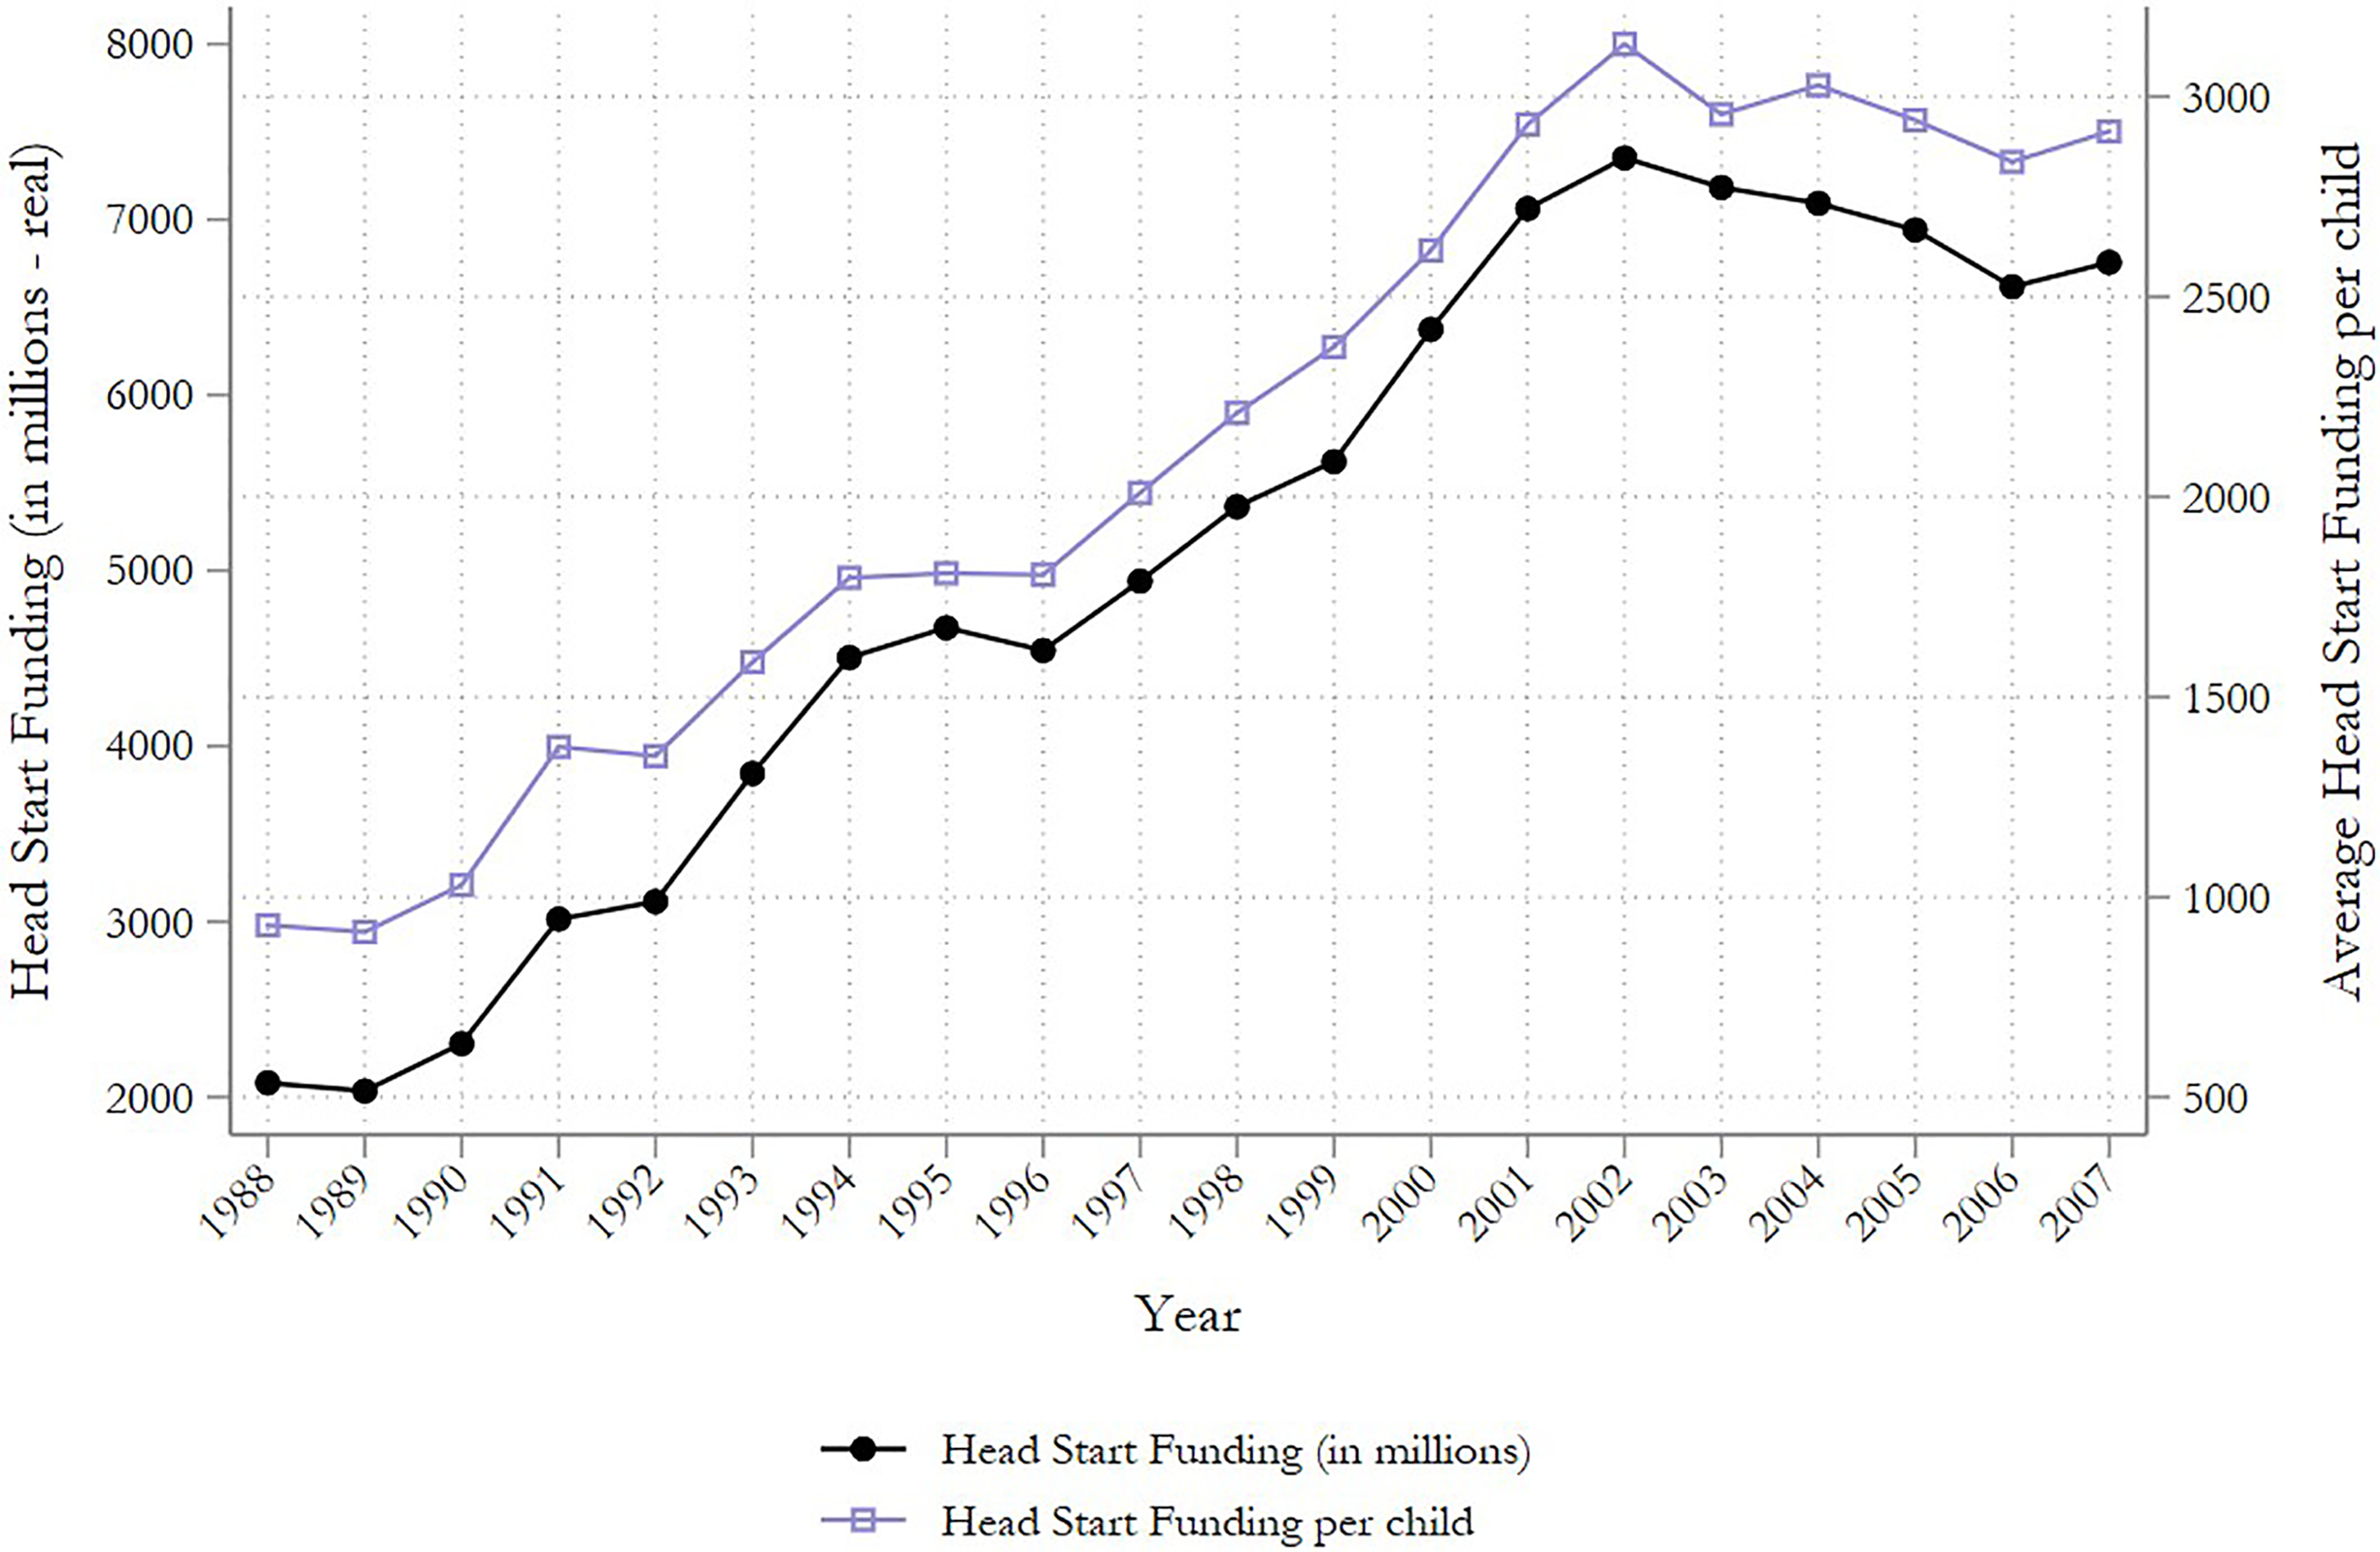
Head start funding in millions and Head Start per child in 2008 dollars, 1988–2007.
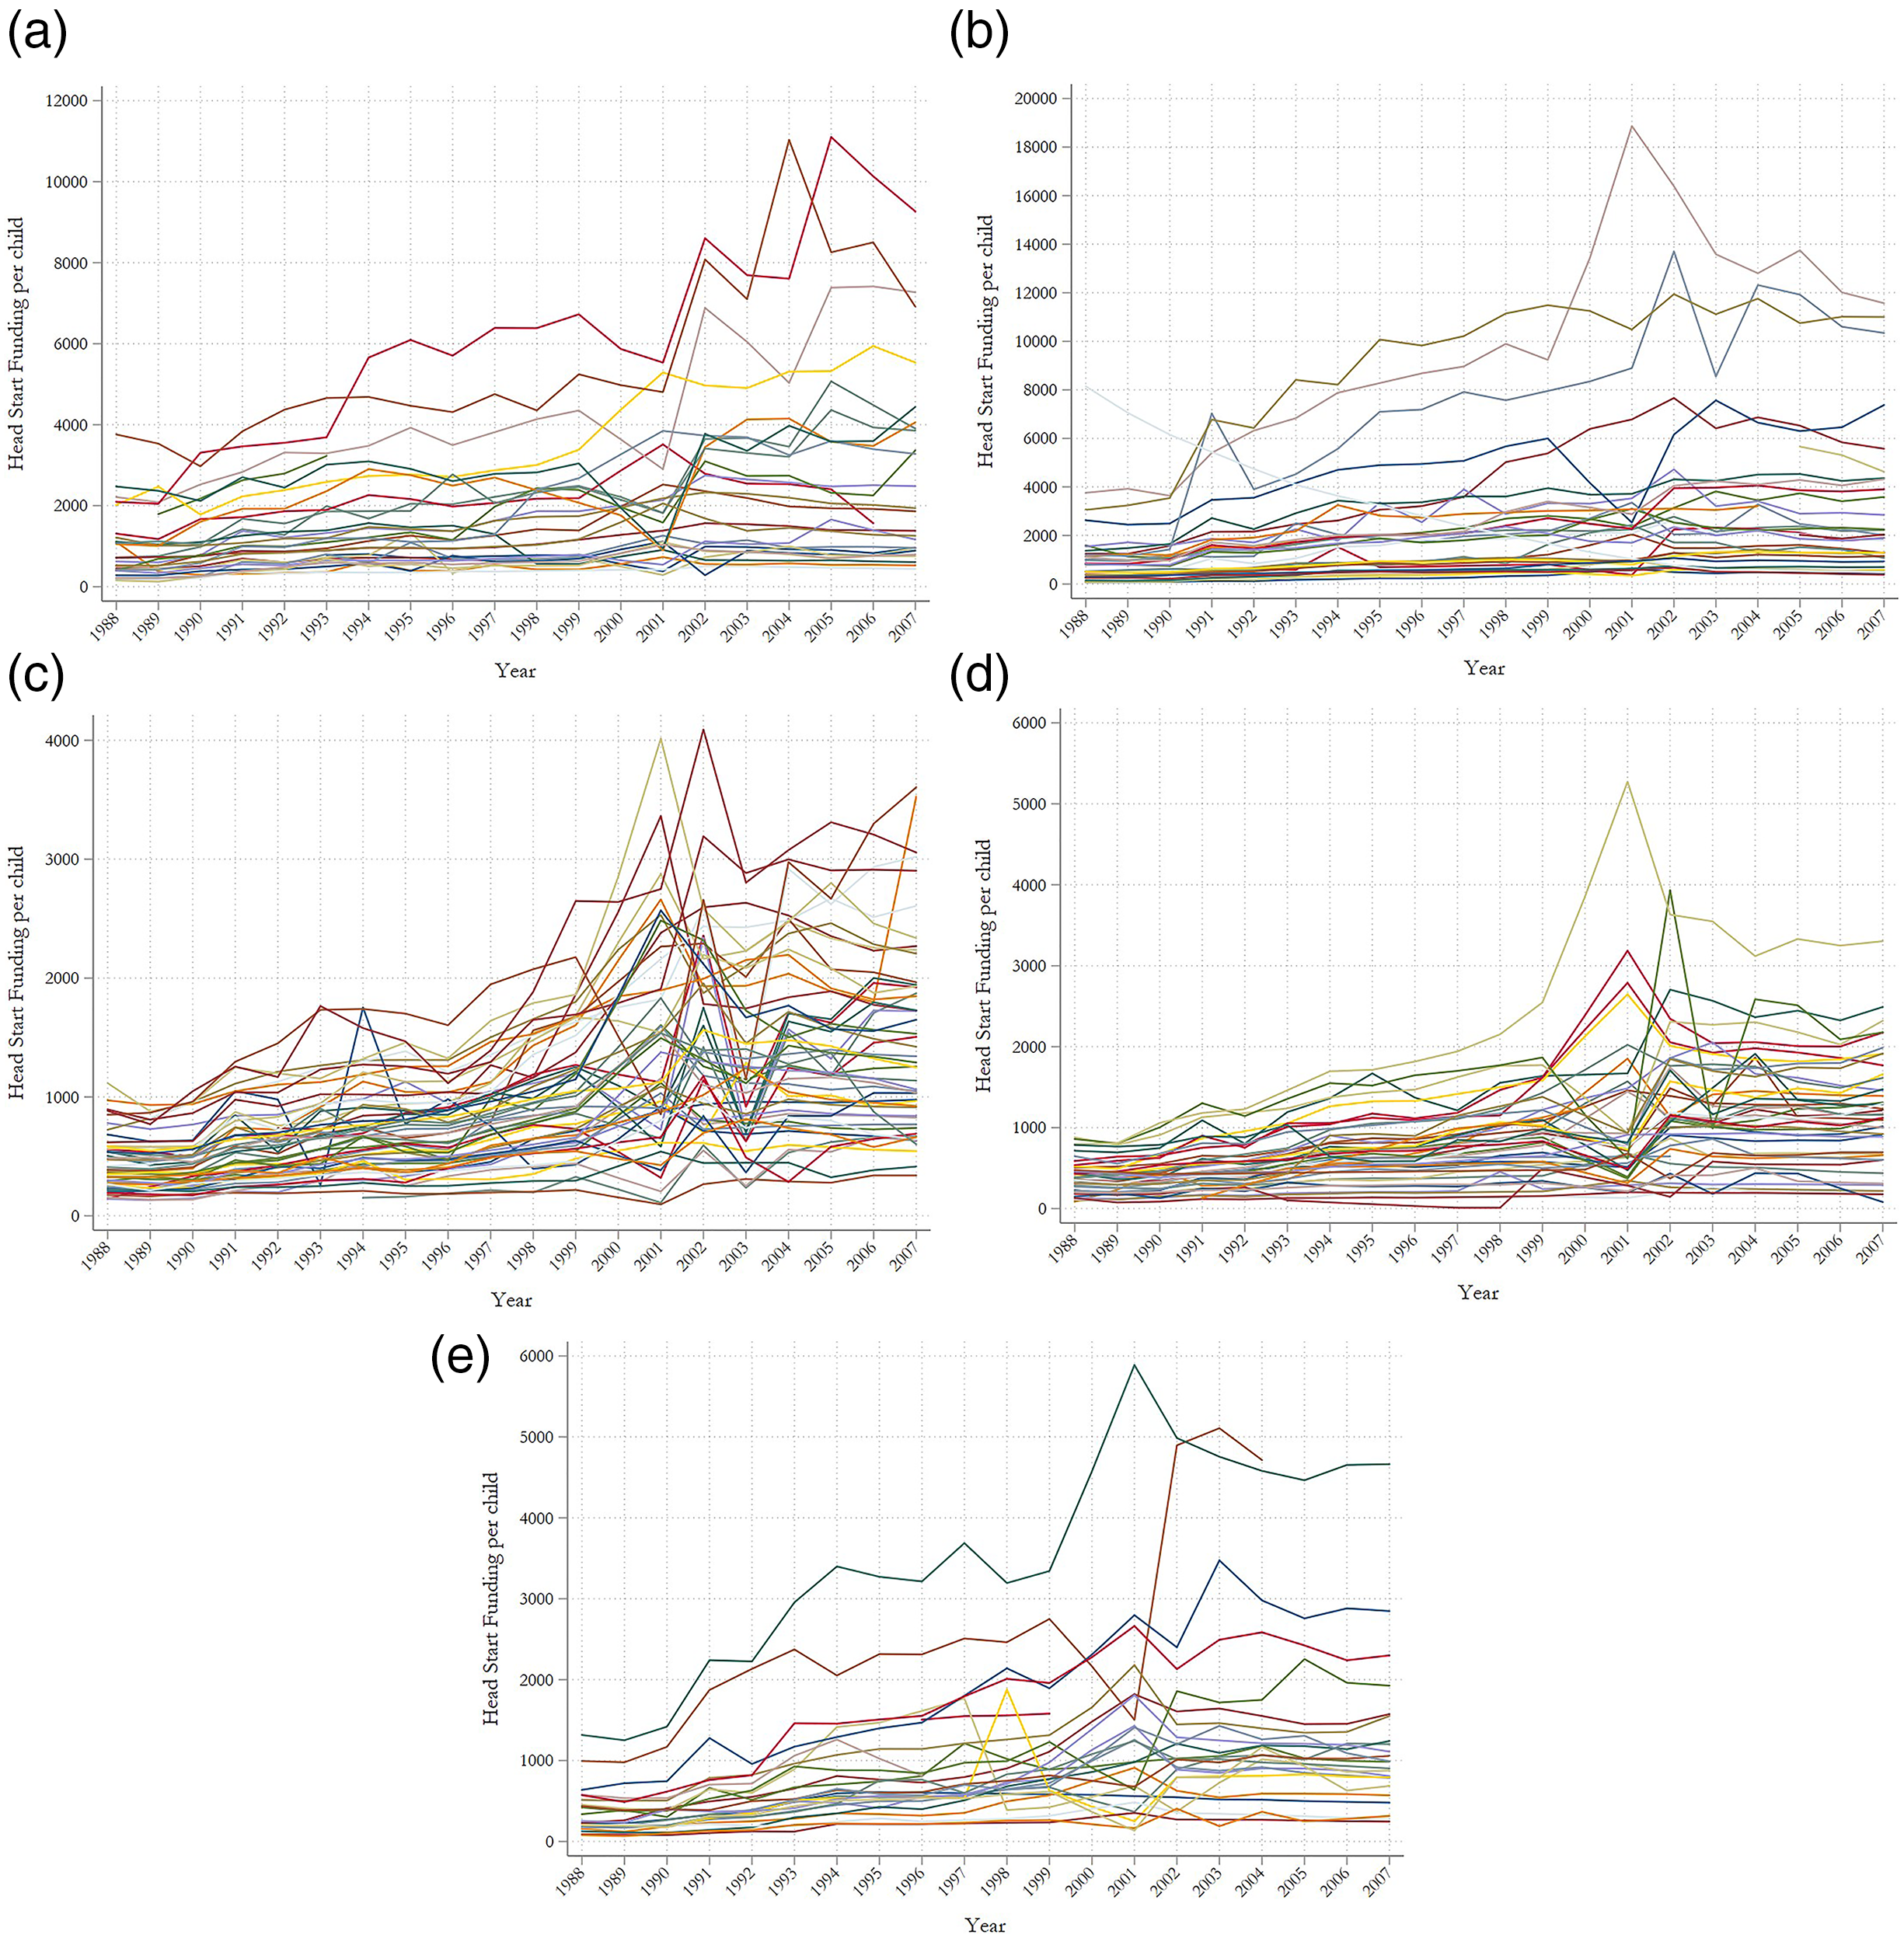
Head start funding per child variation within states across counties over time. (a) Alabama. (b) Minnesota. (c) New York. (d) Pennsylvania. (e) Washington.
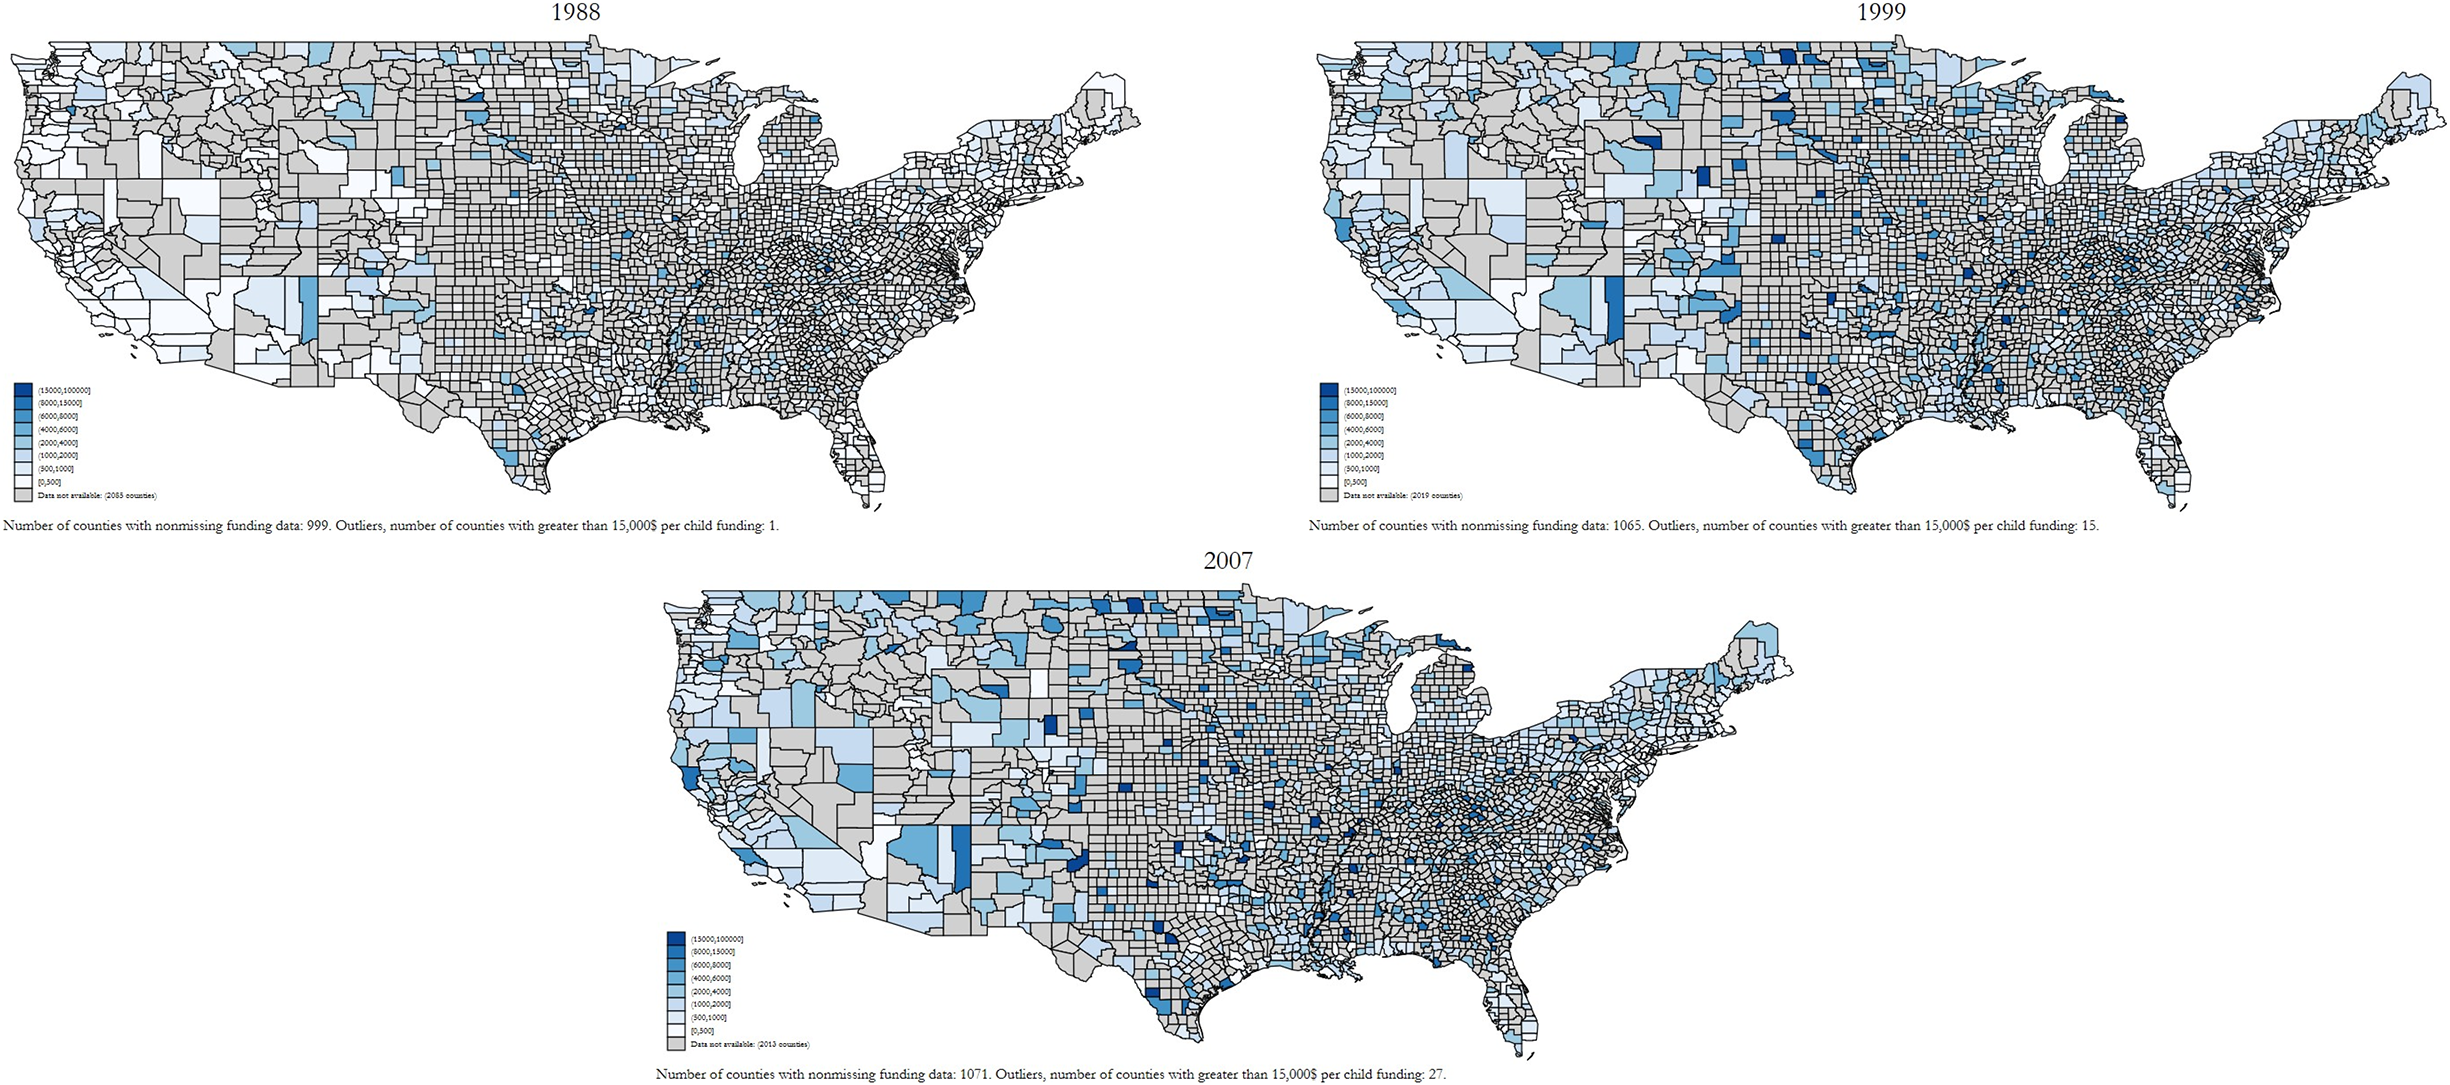
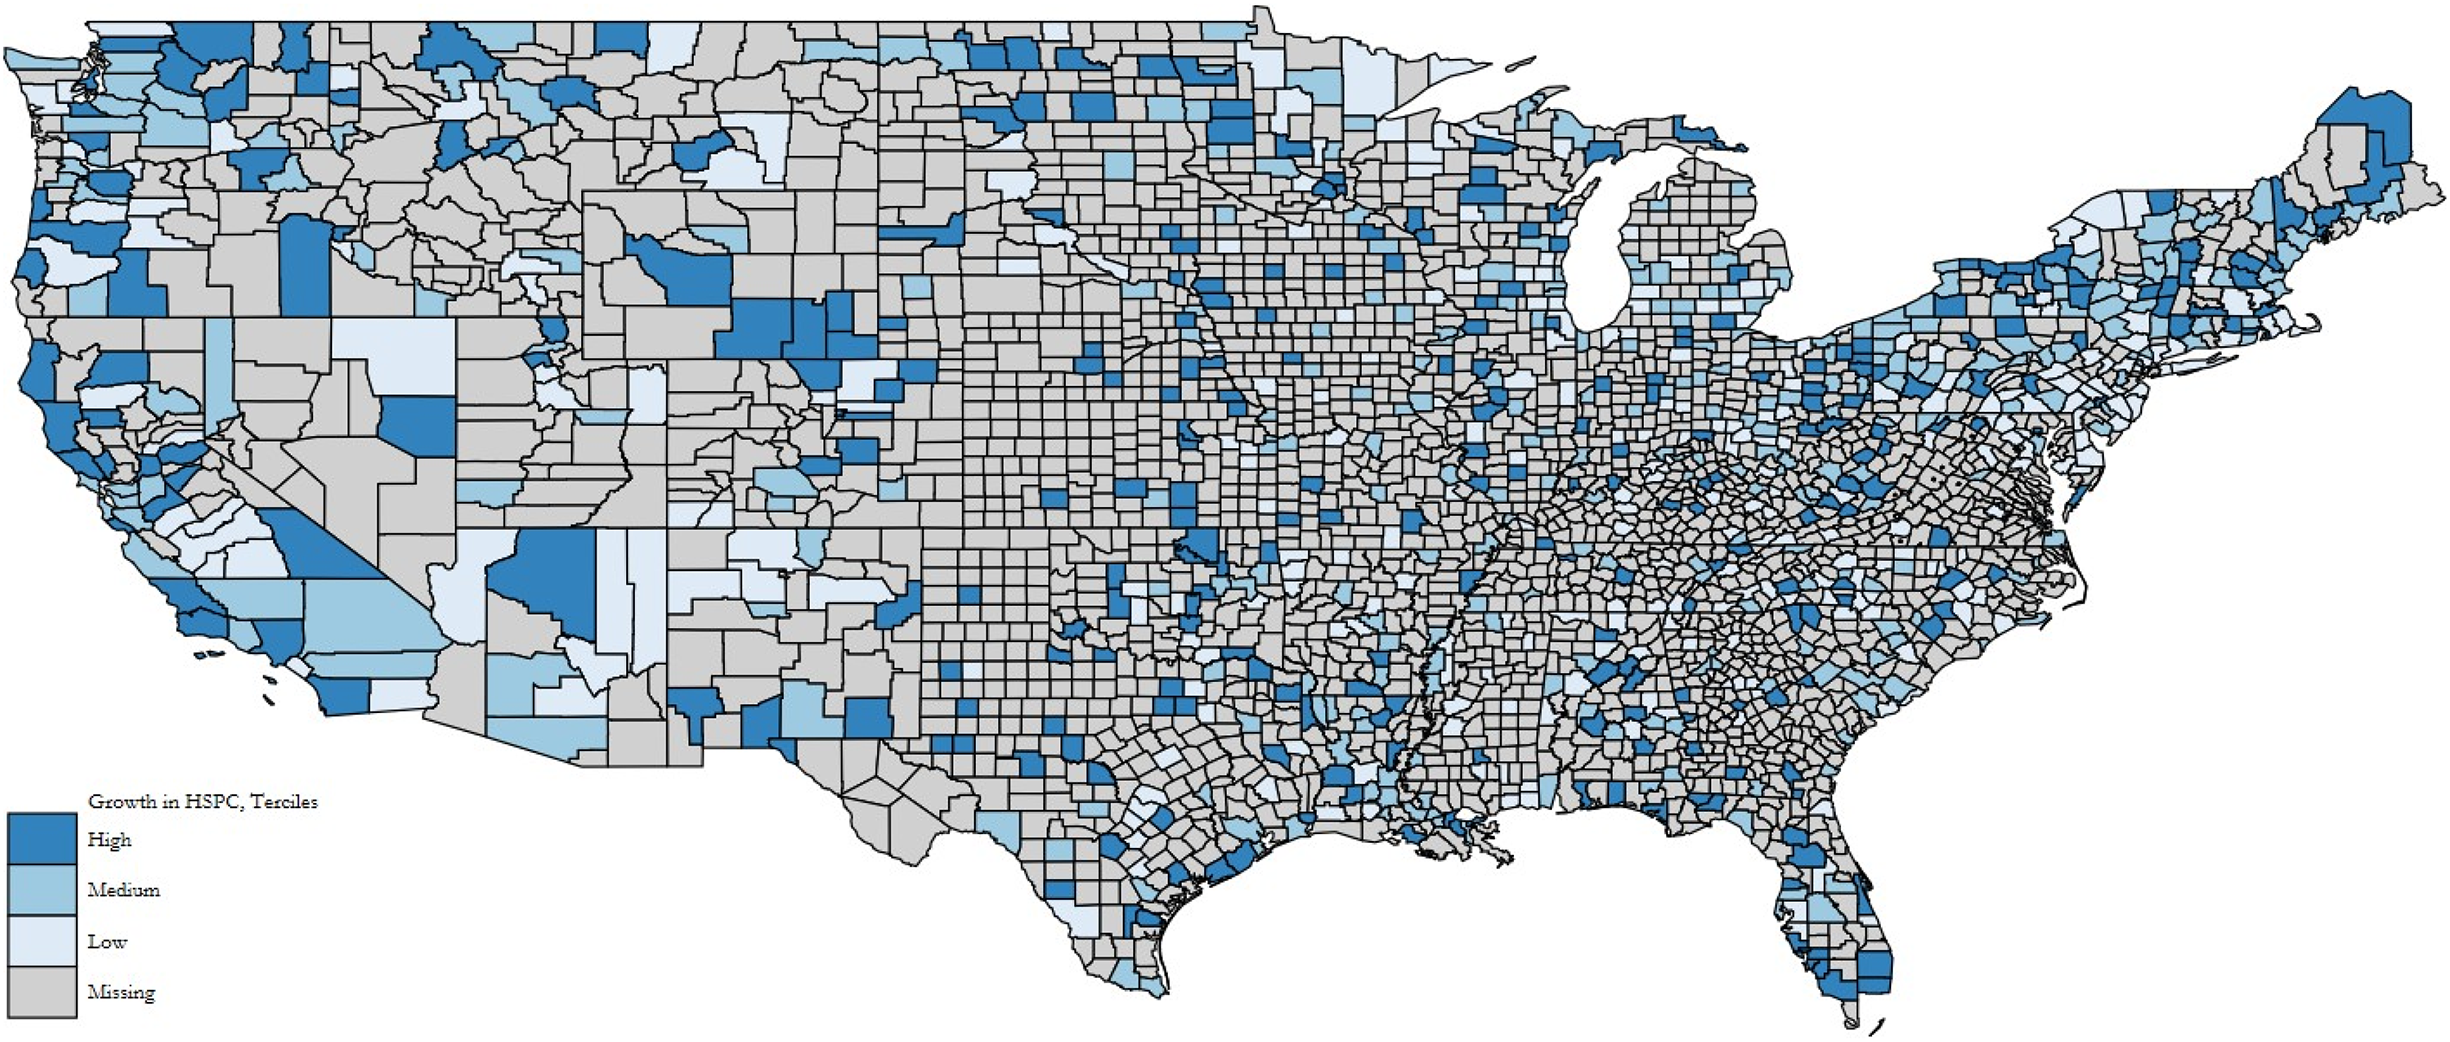
We further illustrate the geographic variation in the levels and growth of funding per child across years in Figures A.2 and A.3 for the U.S. at large. These maps reveal that the increase in funding levels occurred throughout the U.S., which implies that funding growth is not concentrated within certain regions or that funding was targeted to programs in specific states or counties. Our empirical strategy takes advantage of the variation in funding per child across counties and over time to examine its potential impact on program enrollment and inputs.
Table 1 reports the summary statistics for Head Start funding per child and the outcome variables and shows the years each variable is available in the data set. 13 The average funding per child is around $2,148 from 1988 to 2007. While about 27 percent of children ages three and four were enrolled in Head Start, on average, 6 percent were enrolled full-time. Looking at the racial and ethnic composition of the children, 15 percent were White, 7 percent were Black, and 3 percent were Hispanic. This implies that around 55 percent of Head Start participants were White, 26 percent were Black, and 10 percent were Hispanic. Figure 4 presents descriptive evidence on the relationship between Head Start funding per child and Head Start enrollment by plotting the average Head Start funding against the overall enrollment, enrollment by race and ethnicity, and full-time status over time. These figures show a strong positive correlation between enrollment and funding, suggesting that the program funding growth during this period was partially used to enroll more children in the Head Start program.
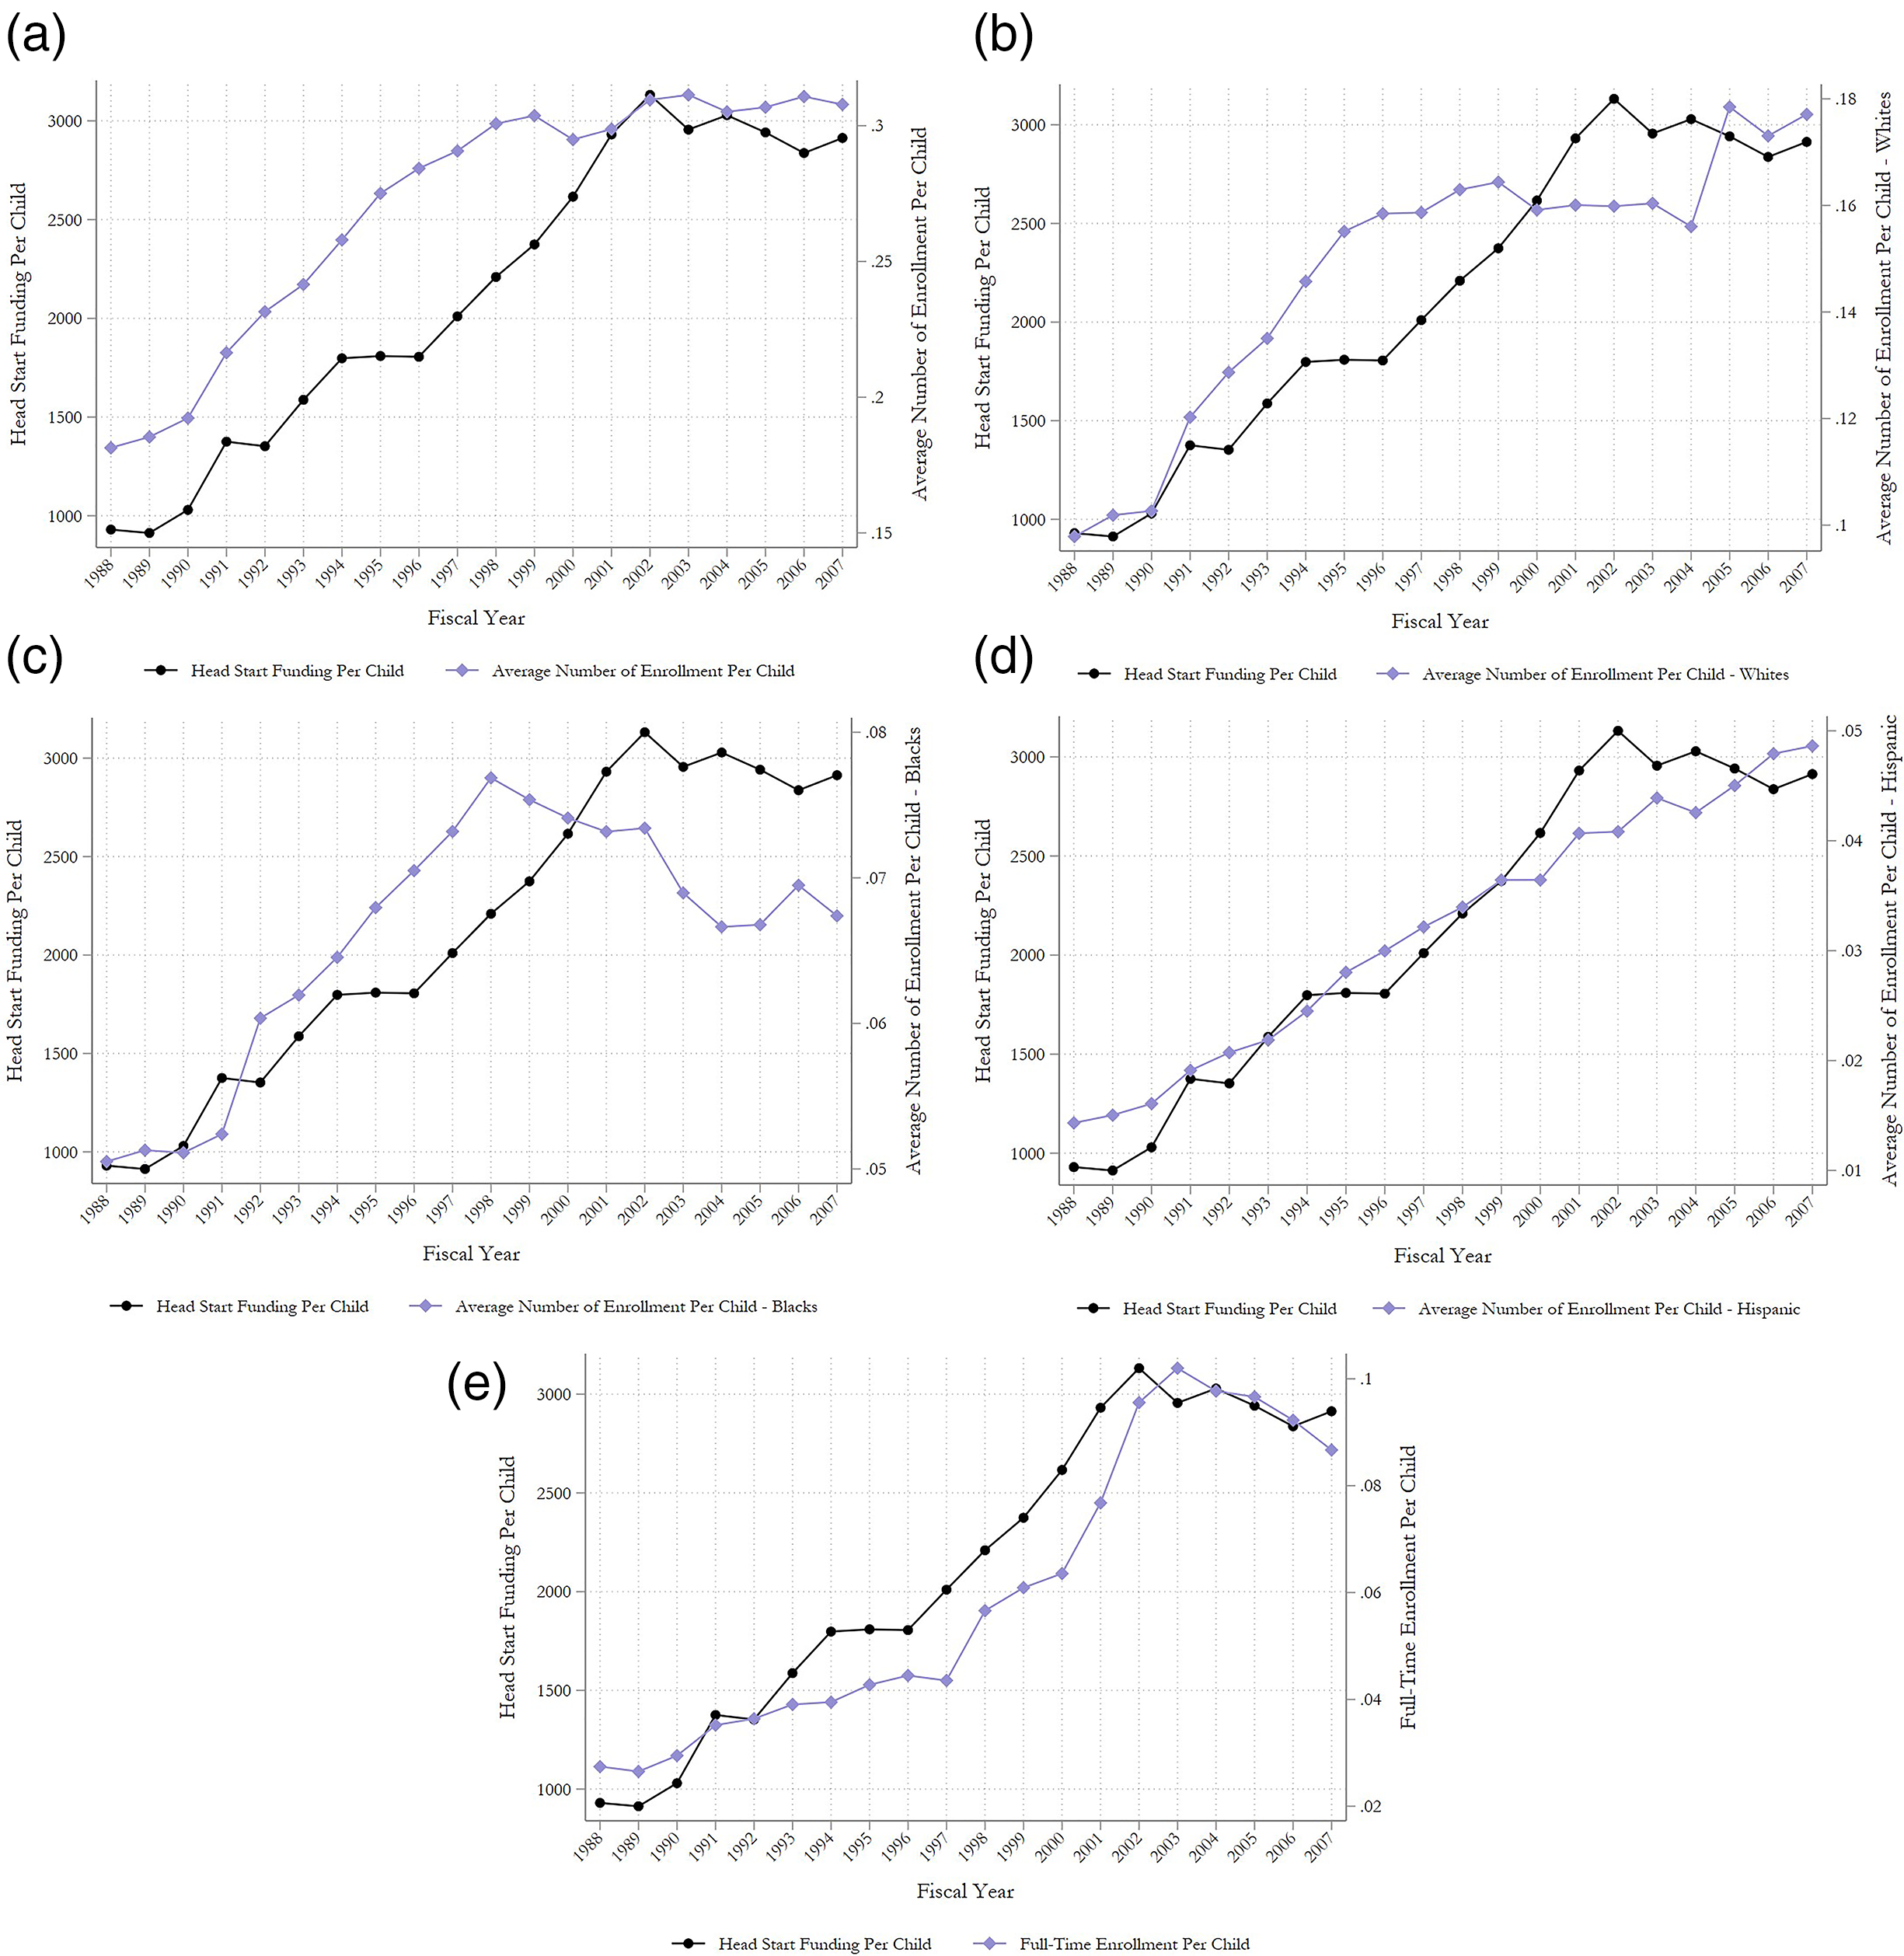
Head start funding per child and Head Start enrollment.
Summary Statistics.
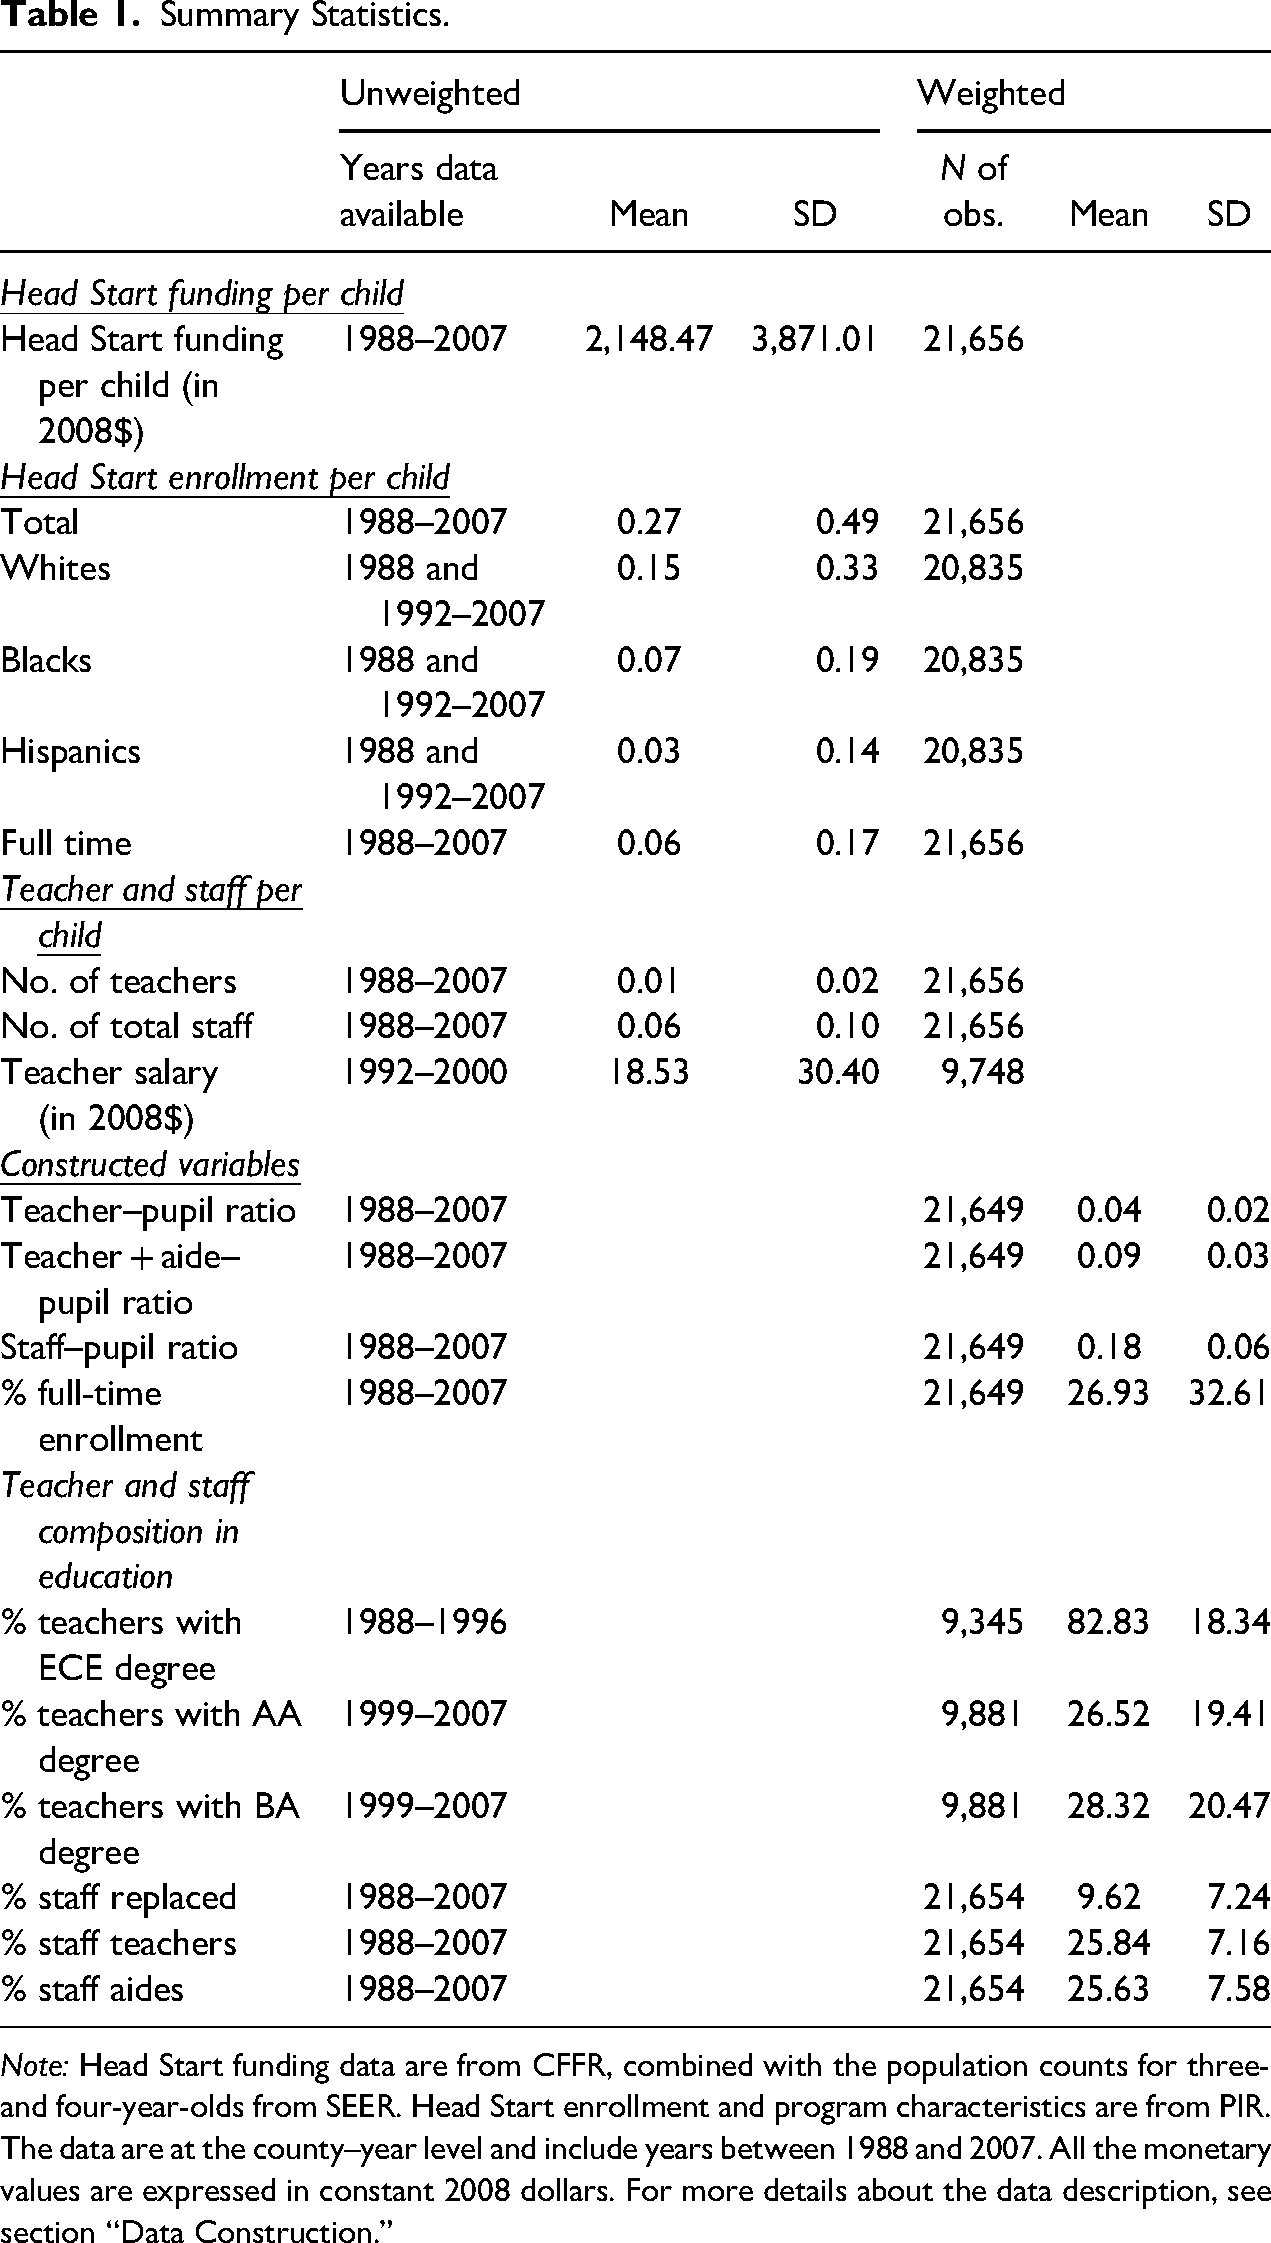
Note: Head Start funding data are from CFFR, combined with the population counts for three- and four-year-olds from SEER. Head Start enrollment and program characteristics are from PIR. The data are at the county–year level and include years between 1988 and 2007. All the monetary values are expressed in constant 2008 dollars. For more details about the data description, see section “Data Construction.”
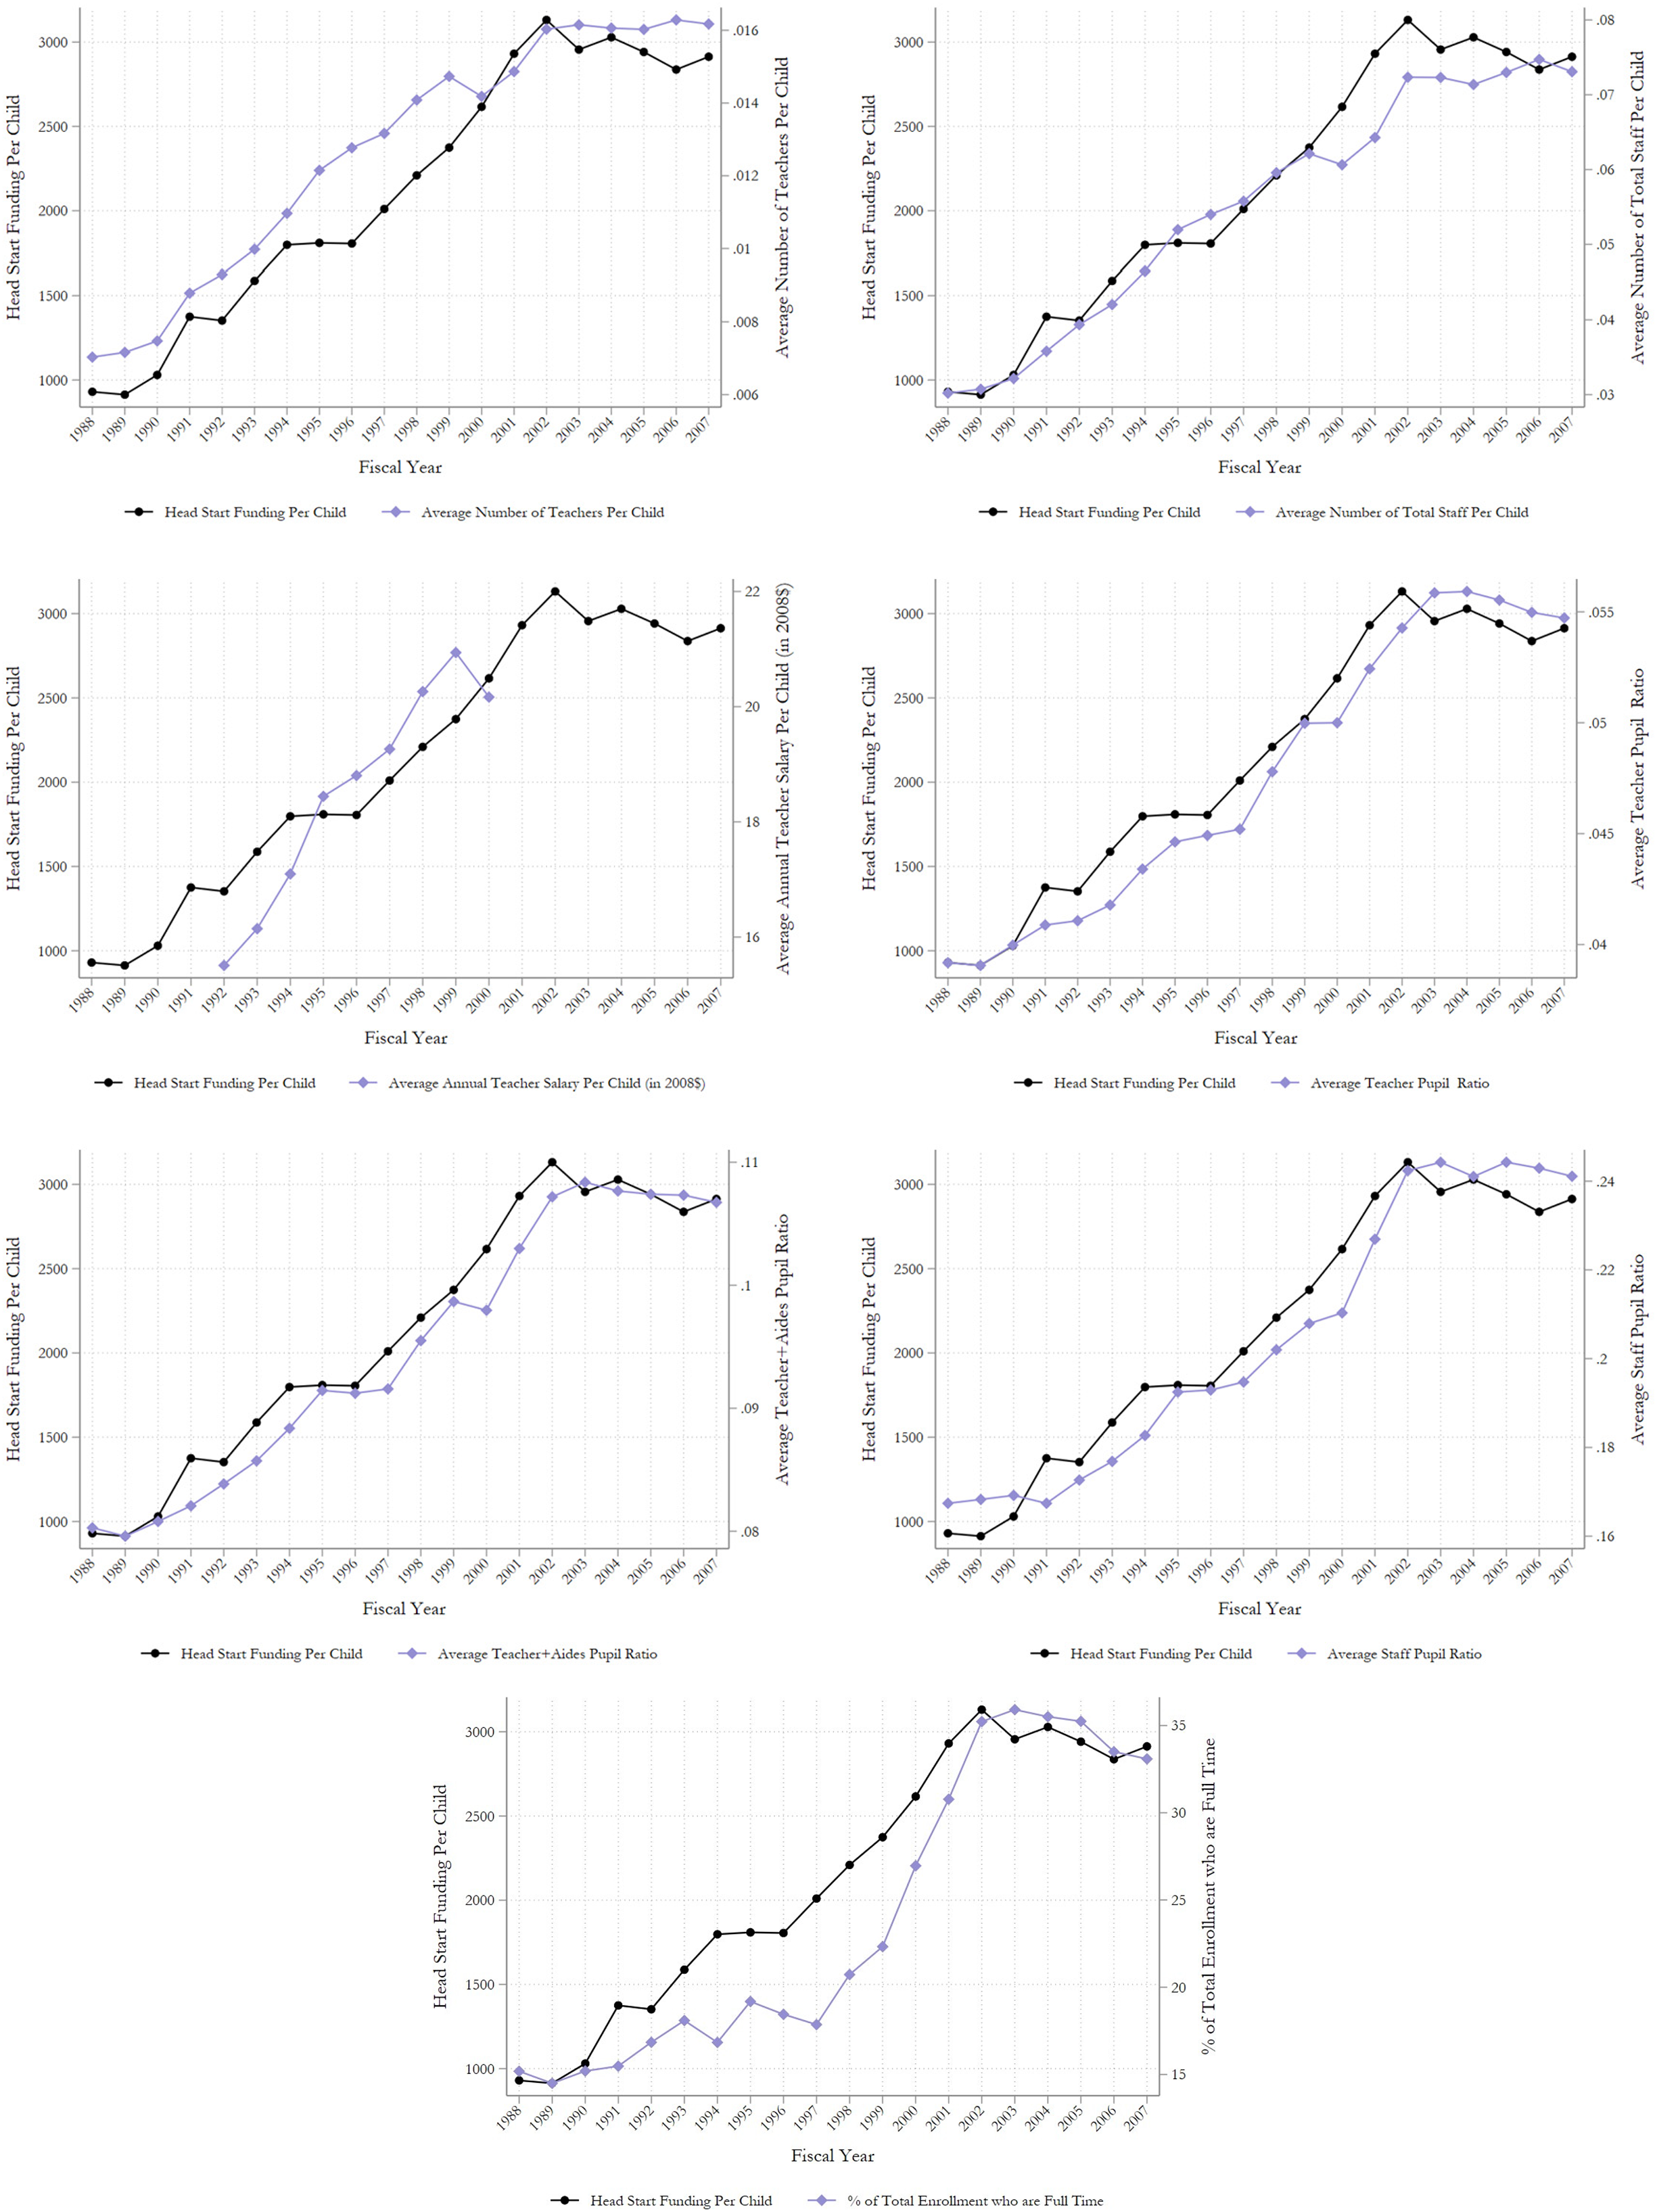
In the rest of Table 1, we report summary statistics for the average number of teachers, staff, and teacher salary in addition to the inputs that the education literature suggests may be important for children's academic achievement, such as teacher–pupil ratios, staff–pupil ratios, and the percentage of full-time participants. We also show the time series for some of these variables in Figure A.4. Overall, this descriptive analysis strongly suggests that increases in funding coincide with improvements in program characteristics, a relationship we test more rigorously in the regression analysis.
Funding Expansions and County Characteristics
Historically, Head Start funding increases have been driven by policy changes implemented by the federal government. The Community Services Act of 1974 suggested that additional funding at the state level should be distributed based on the number of unemployed, public assistance recipients, and children living below the poverty line. However, guidelines on how federal funding got distributed to local agencies are not clearly stated.
Table 2 presents correlations between average Head Start funding per child and county characteristics. 14 Columns 1–10 show that counties experiencing economic hardship, with a higher percentage of the Black population, and with higher transfers per capita were allocated more Head Start funding. Columns 11 and 12 suggest that more populated counties had less funding per child; this could just be a mechanical relationship. In the last two columns, we show results from models that include all of the variables in the estimation without (Column 13) and with state fixed effects (Column 14). While the socioeconomic characteristics of counties explain only a small part of the overall variation in funding expansions (R2 varies between 0.07 and 0.3), they are collectively important explanatory variables. Thus, we use them as controls in our main estimation.
Determinants of Head Start Funding per Child.
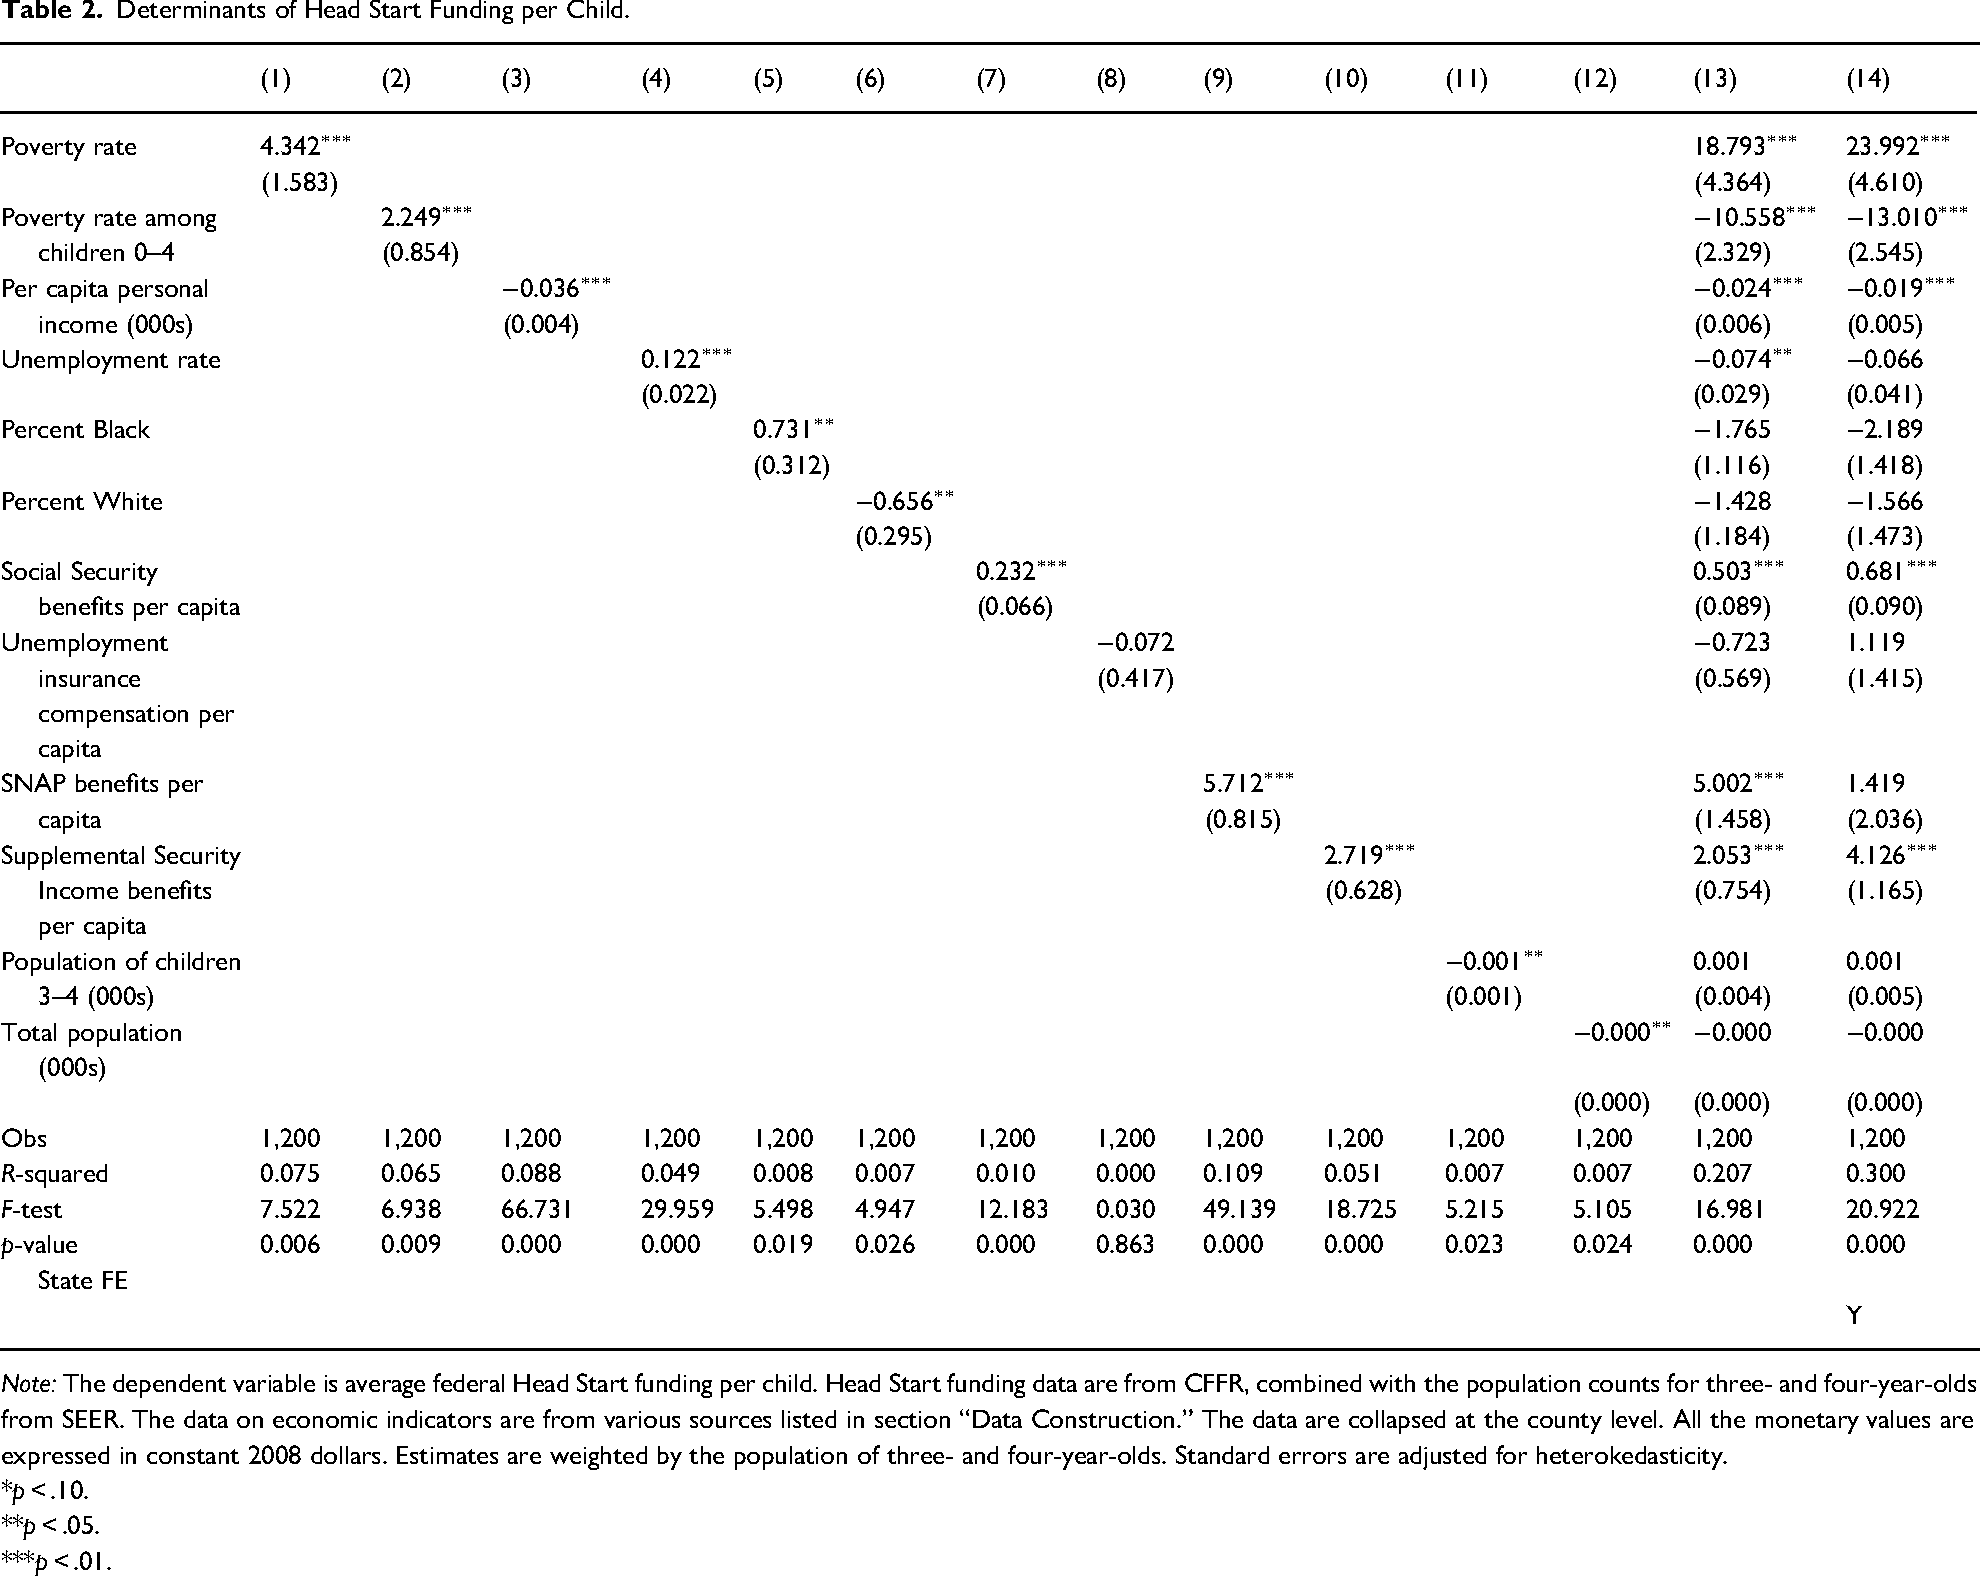
Note: The dependent variable is average federal Head Start funding per child. Head Start funding data are from CFFR, combined with the population counts for three- and four-year-olds from SEER. The data on economic indicators are from various sources listed in section “Data Construction.” The data are collapsed at the county level. All the monetary values are expressed in constant 2008 dollars. Estimates are weighted by the population of three- and four-year-olds. Standard errors are adjusted for heterokedasticity.
*p < .10.
**p < .05.
***p < .01.
In addition, Figure 5 shows a positive relationship between the funding levels in 1988 and 2007, which suggests that places with more funding in the past also experienced higher funding levels in the future. 15
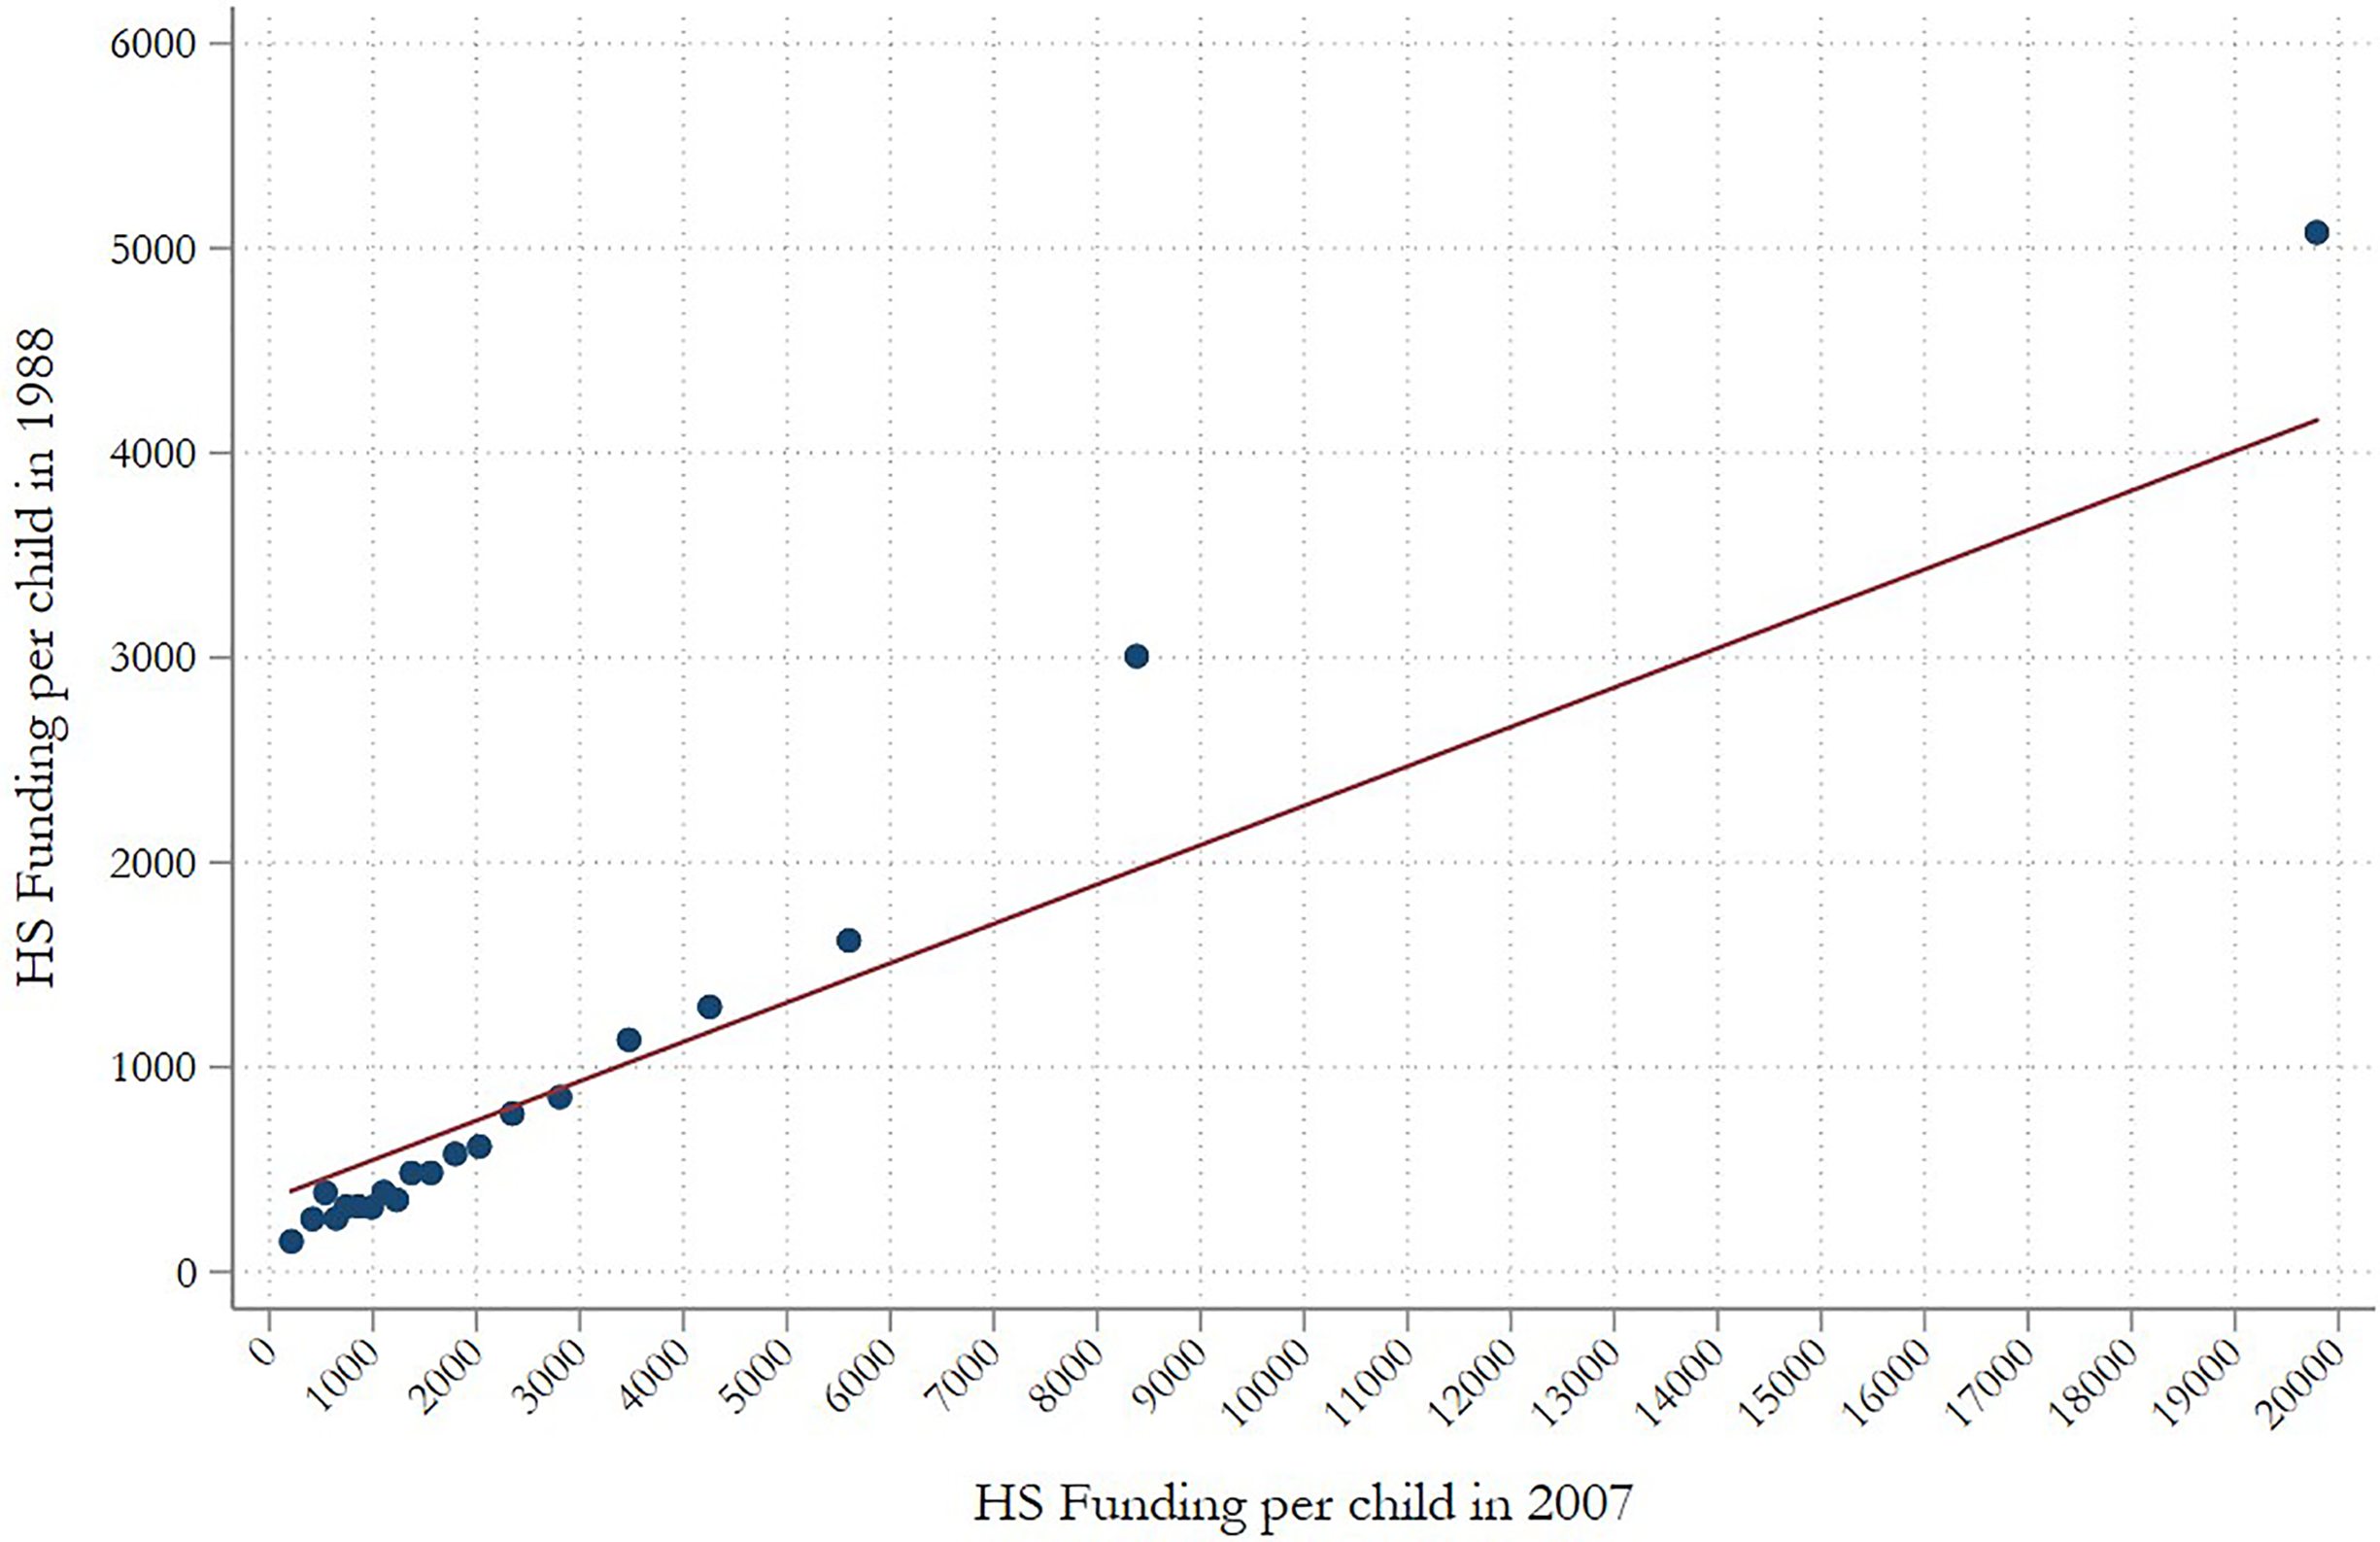
Binscatter Head Start per child in 1988 and 2007.
Empirical Strategy
To examine the relationship between Head Start funding expansions and program characteristics, we take advantage of the panel structure of the data and use fixed effects to minimize omitted variable bias while controlling for a rich set of observable time-varying county characteristics. The application of county fixed effects allows us to control for observed and unobserved time-invariant differences across counties that may be correlated with both Head Start program funding and changes in program characteristics, while time fixed effects allow us to control for unobserved national shocks, such as other federal child-related policy reforms, which may influence the Head Start program.
We use county–year panel-fixed effects estimation formulated using the following equation:
The key assumption for the unbiasedness of
Results
Enrollment Results
Tables 3 and 4 provide the paper's main results of the impact of Head Start funding on program enrollment. The models in Table 3 use the total Head Start enrollment (in county and year cells) per child ages three and four as the outcome variable, with each column varying the controls included in the model. Specifically, Column 1 includes county and year fixed effects, Column 2 adds the time-varying county-level controls, and Column 3 adds state-by-year fixed effects. We regard the estimates in Column 3 as the preferred results. We then subject this model to two robustness tests, first in Column 4 by interacting 1988 values of the county controls with a linear time trend and then in Column 5 by including county-specific linear trends. Using our preferred estimation, Table 4 examines race- and ethnicity-specific enrollment rates (Columns 2–4), as well as the full-time enrollment rate (Column 5).
Head Start Funding per Child and Enrollment per Child, Sensitivity.
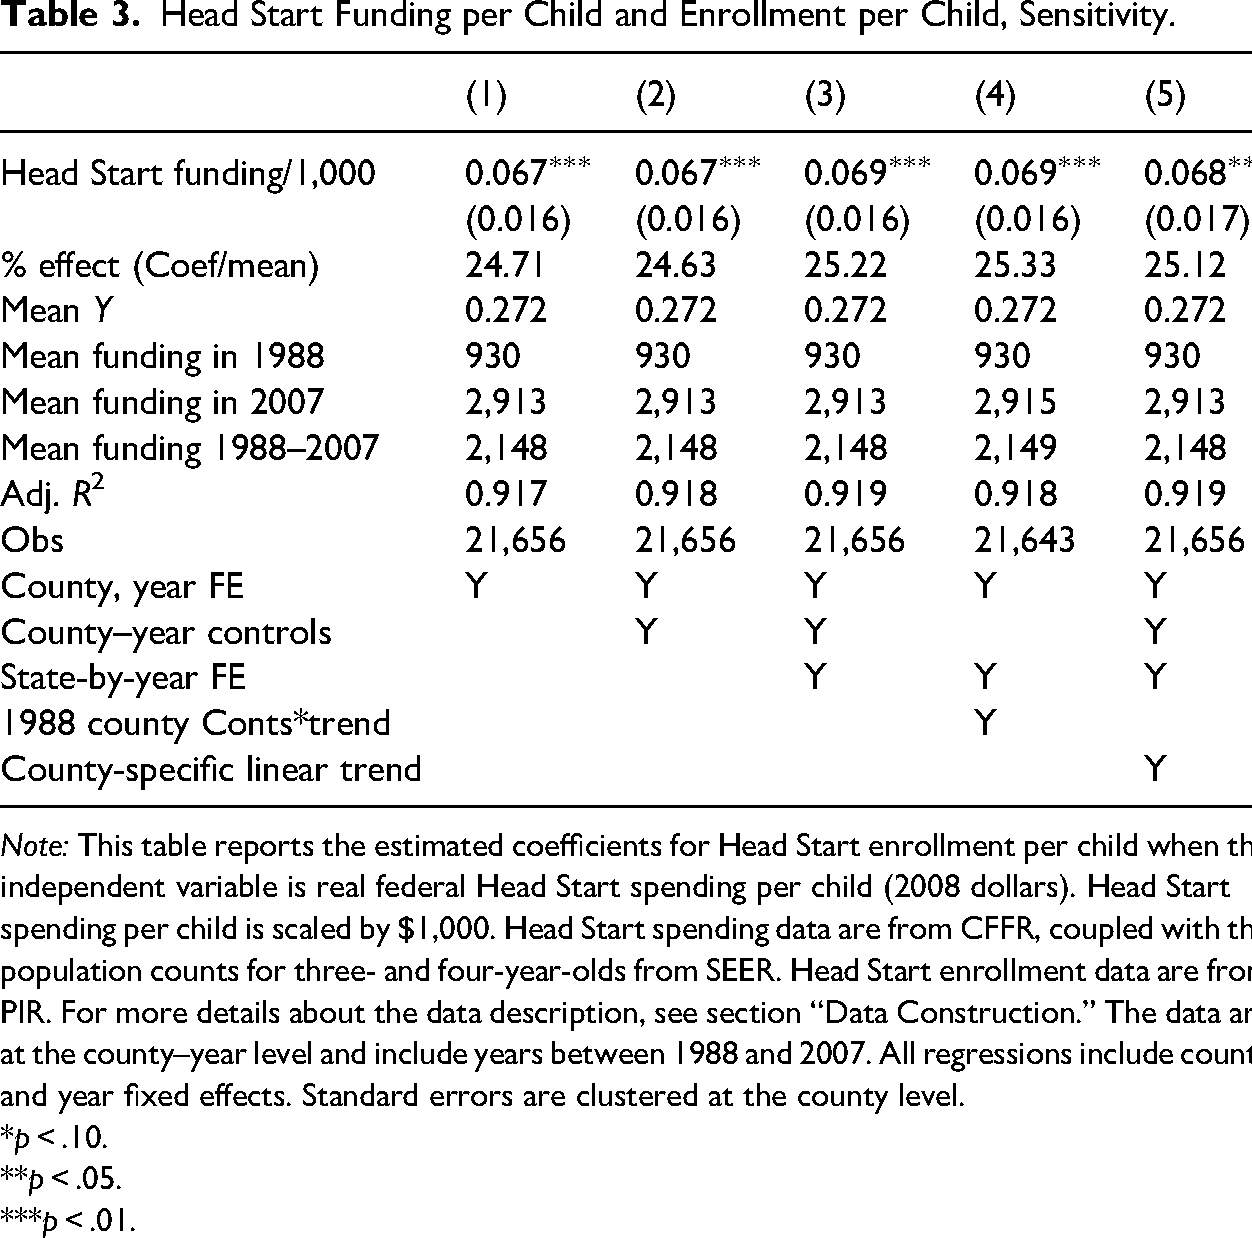
Note: This table reports the estimated coefficients for Head Start enrollment per child when the independent variable is real federal Head Start spending per child (2008 dollars). Head Start spending per child is scaled by $1,000. Head Start spending data are from CFFR, coupled with the population counts for three- and four-year-olds from SEER. Head Start enrollment data are from PIR. For more details about the data description, see section “Data Construction.” The data are at the county–year level and include years between 1988 and 2007. All regressions include county and year fixed effects. Standard errors are clustered at the county level.
*p < .10.
**p < .05.
***p < .01.
Head Start Funding per Child and Enrollment per Child, by Race/Ethnicity and Full Time.
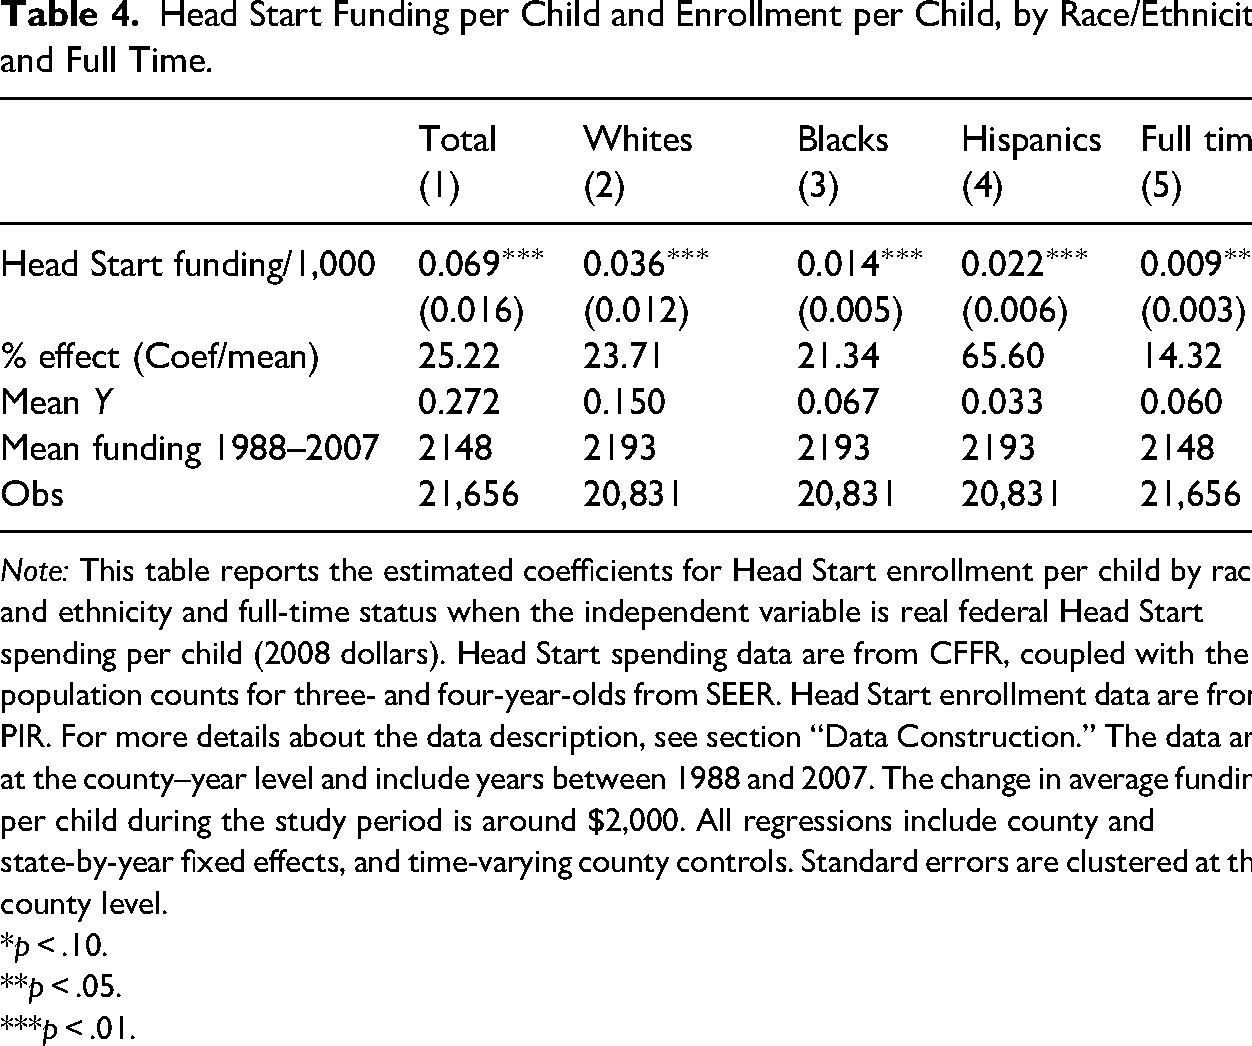
Note: This table reports the estimated coefficients for Head Start enrollment per child by race and ethnicity and full-time status when the independent variable is real federal Head Start spending per child (2008 dollars). Head Start spending data are from CFFR, coupled with the population counts for three- and four-year-olds from SEER. Head Start enrollment data are from PIR. For more details about the data description, see section “Data Construction.” The data are at the county–year level and include years between 1988 and 2007. The change in average funding per child during the study period is around $2,000. All regressions include county and state-by-year fixed effects, and time-varying county controls. Standard errors are clustered at the county level.
*p < .10.
**p < .05.
***p < .01.
The point estimates in Table 3, which are remarkably stable across the various specifications, reveal a strong positive relationship between Head Start funding and total program enrollment. 17 Specifically, the estimate in Column 3 implies that a $1,000 increase in Head Start funding per child increases enrollment in Head Start by nearly 7 percentage points. Given that the mean enrollment rate is about 27 percent, the coefficient implies an increase in program enrollment of 25 percent.
Table 4 examines heterogeneity in enrollment responses across White, Black, and Hispanic children. Although Head Start enrollments rise substantially across all three demographic groups, it appears that Hispanic children experience the most robust increases in enrollment. Indeed, the coefficient in Column 4 implies that a $1,000 increase in Head Start funding leads to a 66 percent increase in Hispanic enrollment (from the mean). In contrast, the estimates in Columns 2 and 3 indicate enrollment responses of 23 percent and 21 percent for White and Black children, respectively. Finally, Column 5 of Table 4 studies full-time enrollment. Interestingly, only 6 percent of Head Start enrollments are full-time, on average. Our results show that increased funding is a reasonably powerful tool for increasing full-time Head Start participation, with the coefficient implying a 15 percent increase in full-time enrollment (from the mean) for each $1,000 increase in funding. 18
Program Characteristics
Table 5 presents estimates of the impact of Head Start funding expansions on the number of total teachers and staff (Columns 1 and 2), teachers’ education qualifications (Columns 3–6), and salary (Column 7). 19 The results in Columns 1 and 2 show that a $1,000 increase in Head Start funding per child increases the number of total teachers per child by approximately 0.4 percentage points and the number of total staff per child by 2 percentage points. These estimates are statistically significant and correspond to a nearly 30 percent increase relative to the mean. In the rest of the table, the results show a positive but statistically imprecise association between funding expansions and teacher degree attainment and salary.
Head Start Funding per Child and Program Characteristics
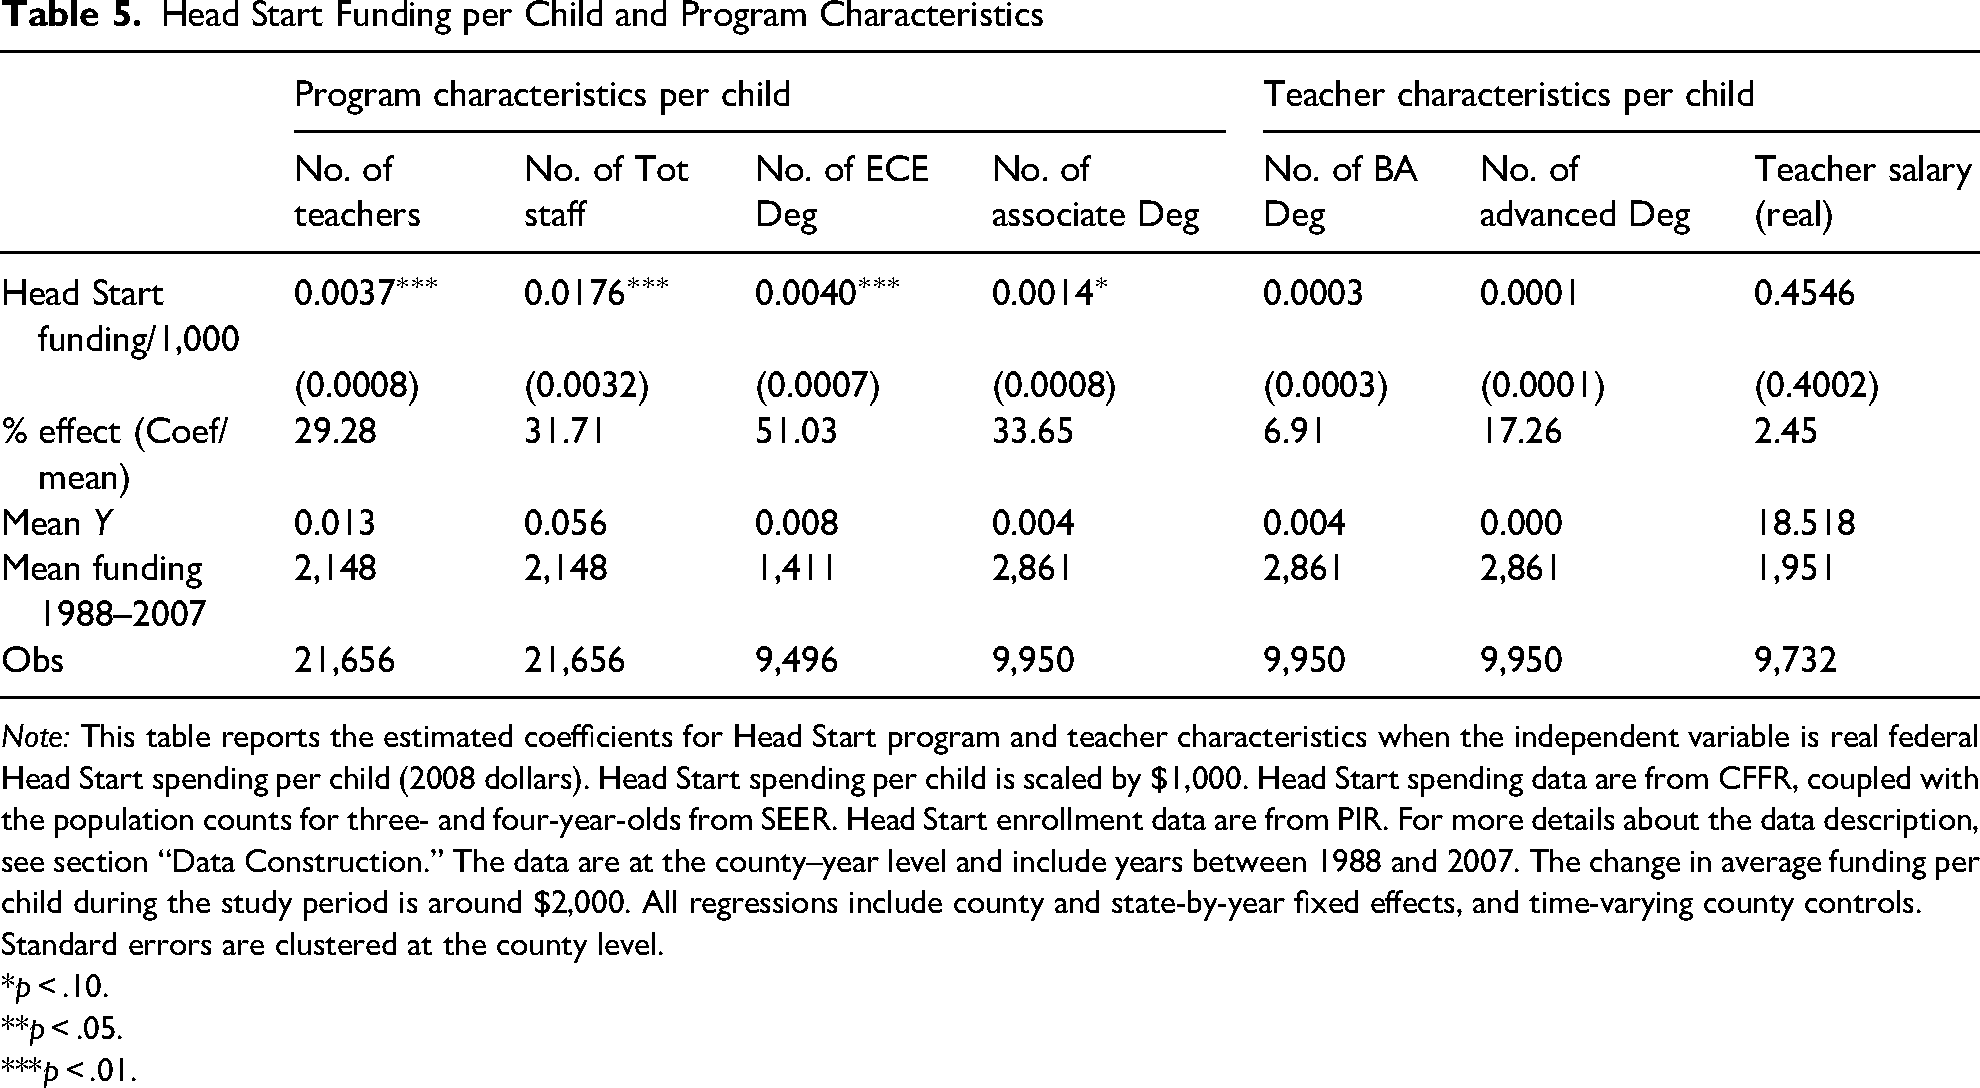
Note: This table reports the estimated coefficients for Head Start program and teacher characteristics when the independent variable is real federal Head Start spending per child (2008 dollars). Head Start spending per child is scaled by $1,000. Head Start spending data are from CFFR, coupled with the population counts for three- and four-year-olds from SEER. Head Start enrollment data are from PIR. For more details about the data description, see section “Data Construction.” The data are at the county–year level and include years between 1988 and 2007. The change in average funding per child during the study period is around $2,000. All regressions include county and state-by-year fixed effects, and time-varying county controls. Standard errors are clustered at the county level.
*p < .10.
**p < .05.
***p < .01.
Table 6 examines the relationship between funding expansions and some additional inputs that are considered part of the education production function. 20 In the first two columns, the results show statistically imprecise positive associations between Head Start funding and teacher–pupil ratios and teacher-plus-aide–pupil ratios. This is partly due to the fact that both enrollment and the number of teachers increased at a similar rate in response to Head Start expansions. In the next two columns, the results show that additional Head Start funding per child is associated with improvements in the staff–pupil ratios (p < .05) and the share of full-time enrollment (p < .05) in the Head Start programs.
Head Start Funding per Child and Constructed Program Characteristics
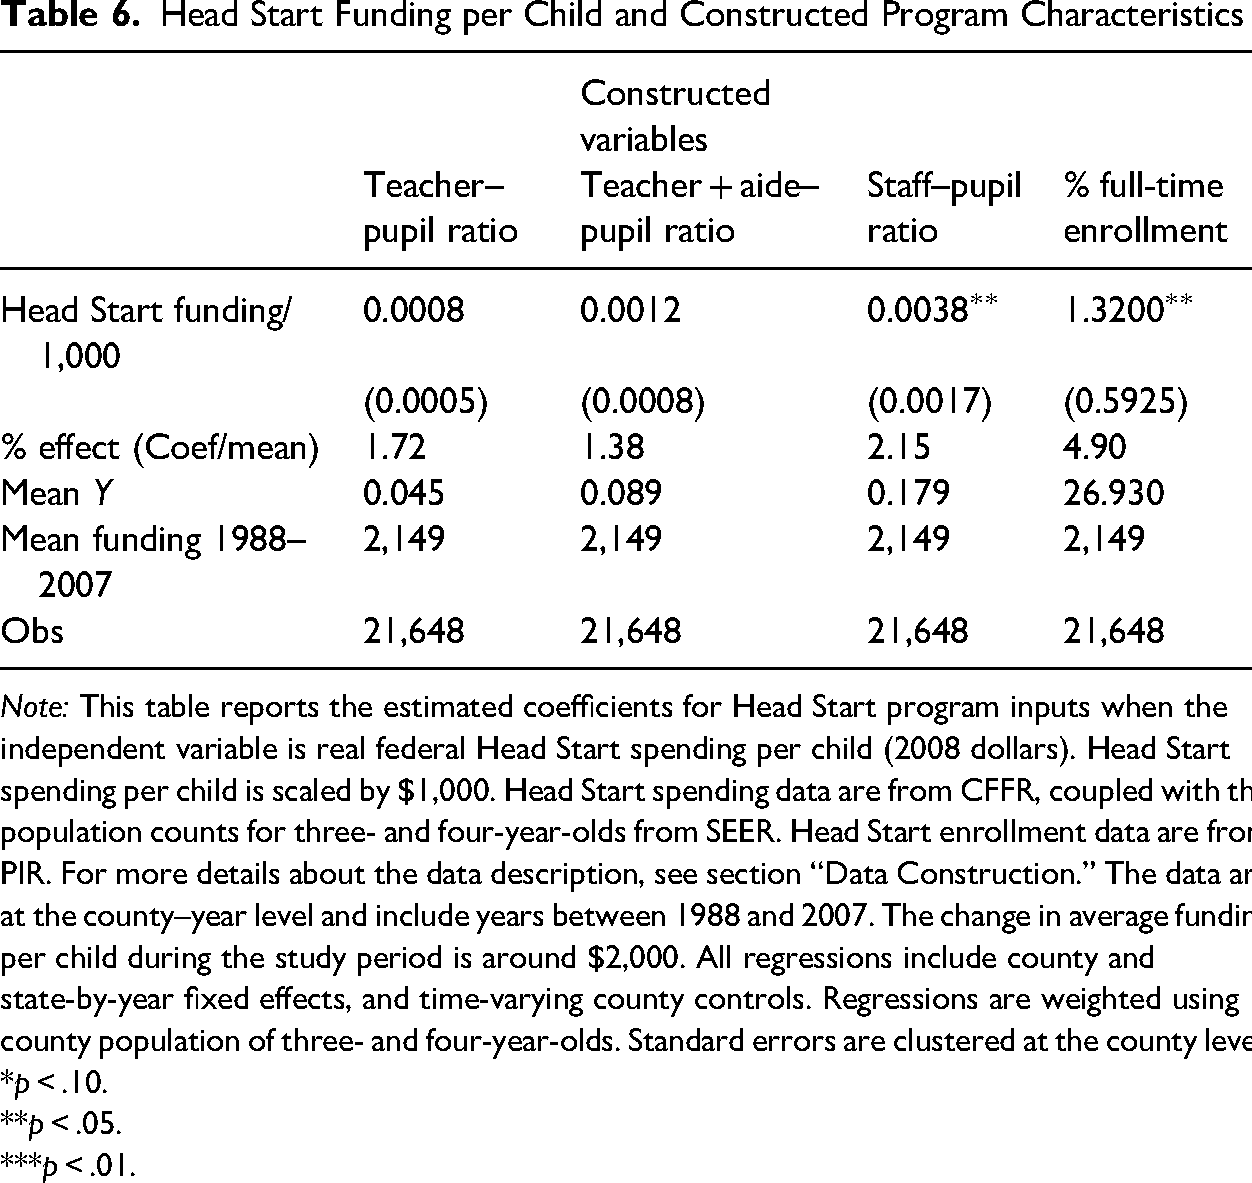
Note: This table reports the estimated coefficients for Head Start program inputs when the independent variable is real federal Head Start spending per child (2008 dollars). Head Start spending per child is scaled by $1,000. Head Start spending data are from CFFR, coupled with the population counts for three- and four-year-olds from SEER. Head Start enrollment data are from PIR. For more details about the data description, see section “Data Construction.” The data are at the county–year level and include years between 1988 and 2007. The change in average funding per child during the study period is around $2,000. All regressions include county and state-by-year fixed effects, and time-varying county controls. Regressions are weighted using county population of three- and four-year-olds. Standard errors are clustered at the county level.
*p < .10.
**p < .05.
***p < .01.
Panel A of Table 7 shows the effect of funding per child on teacher composition by degree attainment, that is, the share of teachers with a CDA credential, an ECE degree (at the bachelor's or associate's level), an associate's degree (in any field), and a bachelor's degree (in any field). Of these outcomes, the share of teachers with an AA degree is marginally improved in response to funding expansions (p < .10). In Panel B, we show no statistically significant relationship between funding expansions and staff composition using the share of staff members replaced during the school year and the share of staff who are teachers, aides, and home visitors as outcomes.
Head Start Funding per Child and Staff Composition.
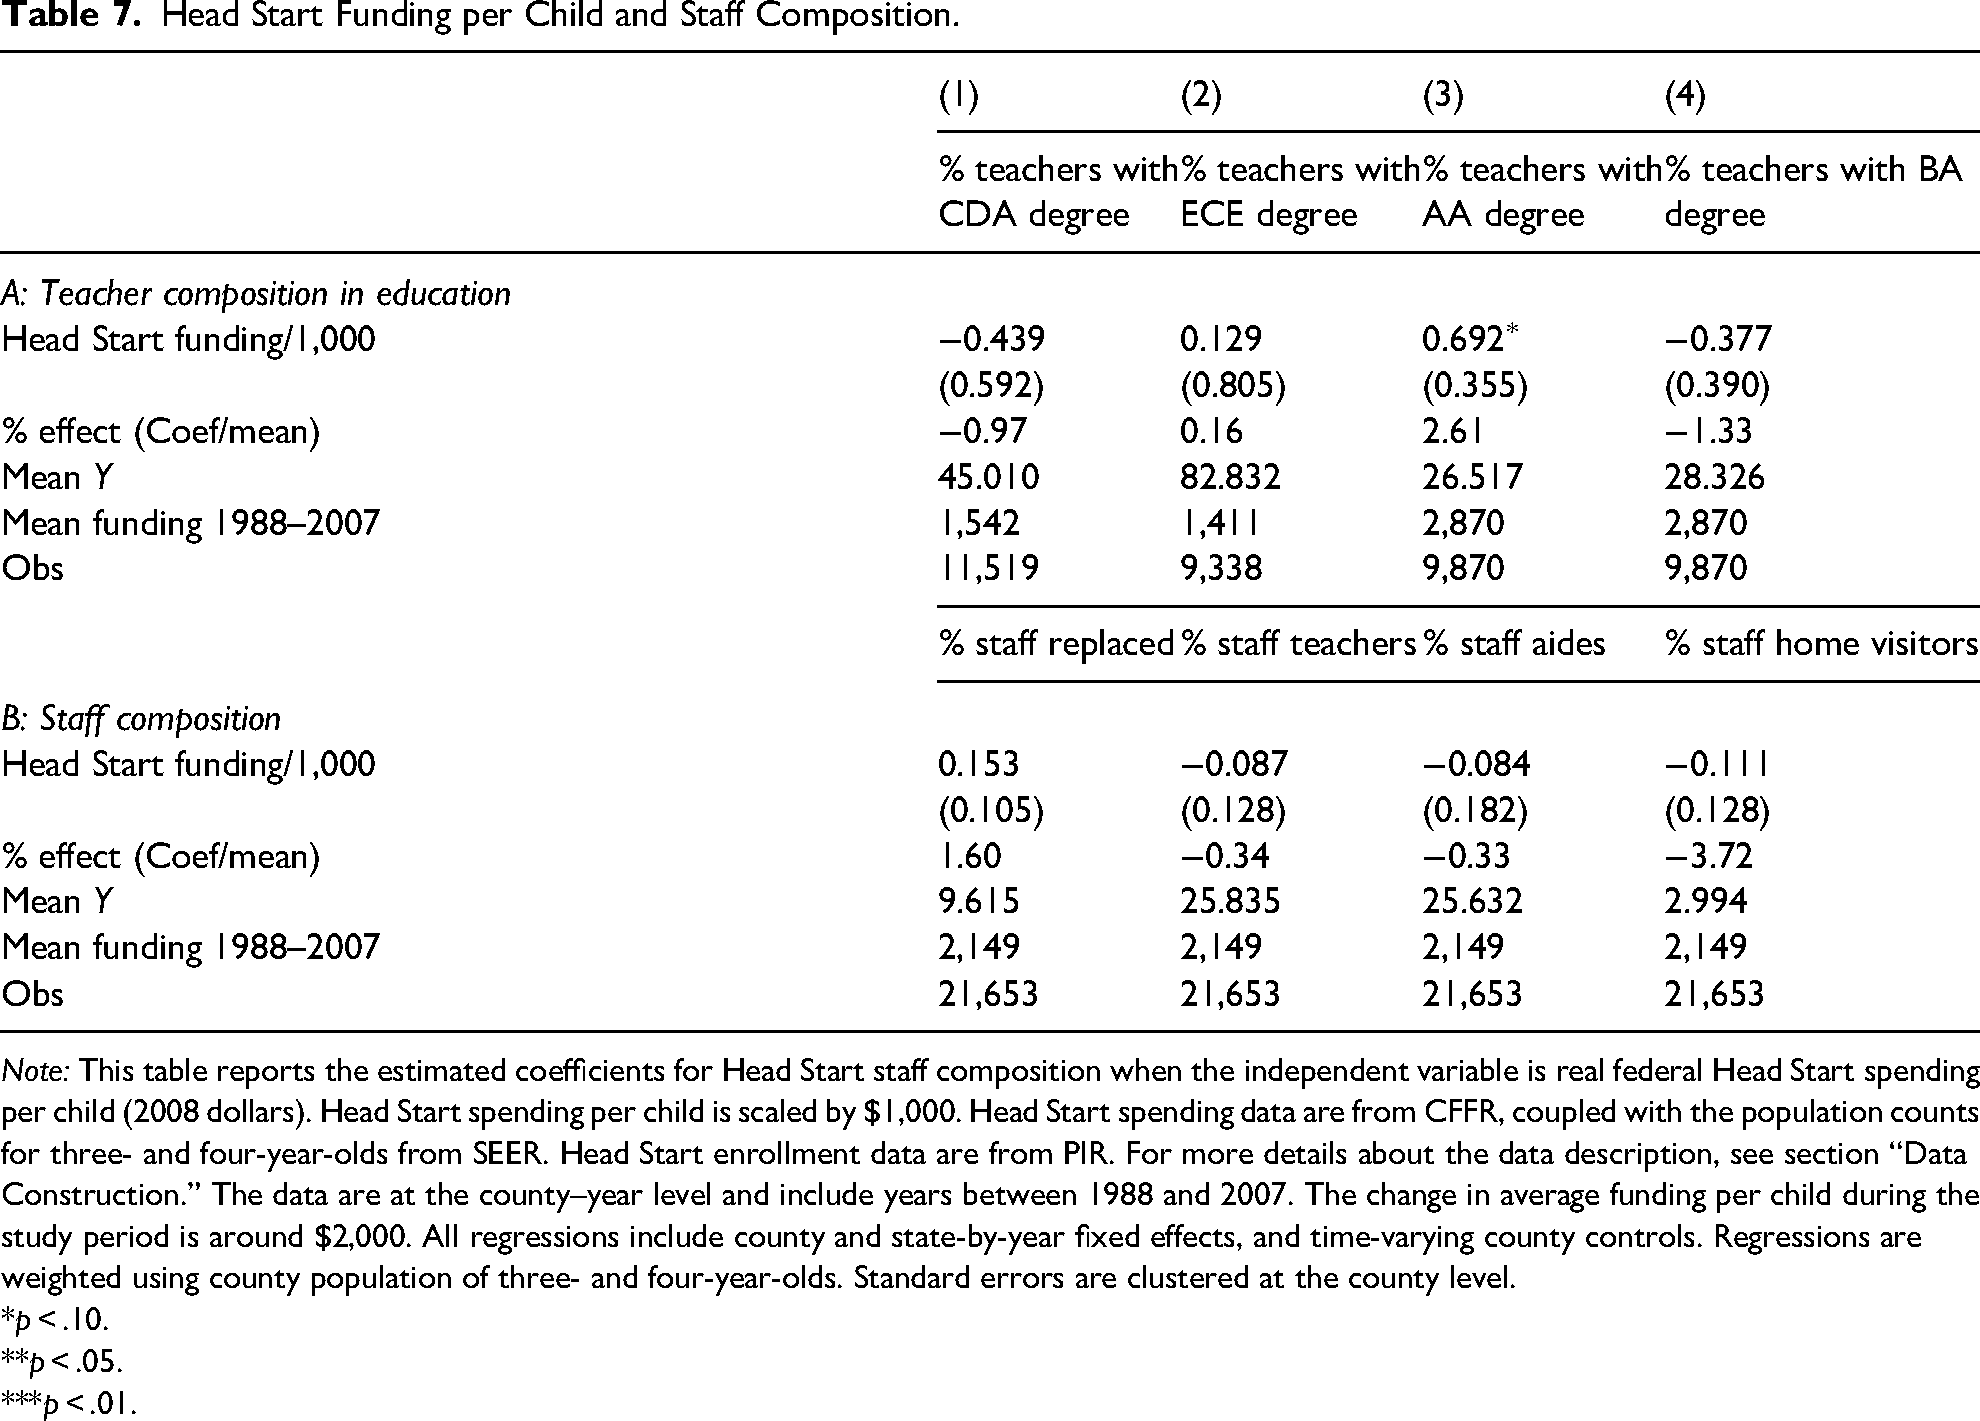
Note: This table reports the estimated coefficients for Head Start staff composition when the independent variable is real federal Head Start spending per child (2008 dollars). Head Start spending per child is scaled by $1,000. Head Start spending data are from CFFR, coupled with the population counts for three- and four-year-olds from SEER. Head Start enrollment data are from PIR. For more details about the data description, see section “Data Construction.” The data are at the county–year level and include years between 1988 and 2007. The change in average funding per child during the study period is around $2,000. All regressions include county and state-by-year fixed effects, and time-varying county controls. Regressions are weighted using county population of three- and four-year-olds. Standard errors are clustered at the county level.
p < .10.
p < .05.
p < .01.
Taken together, our results provide empirical evidence that Head Start funding expansions were spent toward increasing program enrollment and full-time enrollment as targeted. However, the results do not show strong evidence that the quality of the program is improved in all measured inputs, that is, teacher–pupil ratio. Although not conclusive due to data limitations, we do not find strong evidence that teachers’ education and teachers’ salaries (some of the outcomes that policy changes targeted) improved in response to funding increases. 21
Full-time enrollment is an important input that funding expansions increased. Using data from the HSIS, Walters (2015) shows that centers that offer full-time services and home visiting are more effective in improving children's cognitive and noncognitive skills. On the other hand, Walter's paper show that teacher education and class size are not associated with significant improvements for Head Start participants.
Conclusion and Policy Implications
There is a large body of evidence that compensatory education programs targeting preschool-age children can improve short-run academic performance as well as long-run labor market outcomes. For example, Head Start, a two-generation program in operation since the mid-1960s, has been studied extensively using a variety of methodological approaches, and results from these studies are fairly consistent: participation in Head Start increases the odds of long-term success in school and in the labor market among disadvantaged children.
In this paper, we provide some of the first evidence on how the funding increases were allocated across the various program inputs, a key intermediate question that may shed light on the mechanisms at work to improve child outcomes. Indeed, a recent paper from Kose (2023) informs the importance of this question, showing that increases in Head Start funding in and of itself lead to improved student performance, particularly among Hispanic students. This finding is consistent with those in Jackson (2020) and Jackson et al. (2016), which show that K-12 public school spending has sizable short- and long-run effects on student outcomes.
Our empirical analysis exploits a number of legislated funding increases during the 1980s and 1990s. In particular, the Bush and Clinton administrations increased program funding to serve more children and improve quality by raising teacher education requirements and compensation and expanding social services. Indeed, our descriptive analysis shows that Head Start spending per child tripled between 1988 and 2007, which coincided with increases in enrollments (including full-time enrollments) and improvements in teacher education level and salaries, and classroom ratios.
Nevertheless, our regression results suggest that these Head Start funding expansions were moderately successful in achieving their objectives. On the one hand, the additional funding was used to enroll more disadvantaged children, particularly Hispanic children, and to increase the number of children attending full-time. In addition, the funding was used to increase the number of teachers and staff and upskill the workforce, with more teachers estimated to have an associate's degree and/or a field-specific degree in ECE. However, our results also underscore the potential limits of these funding expansions. Although an explicit goal of such reforms was to improve teacher compensation, we find suggestive evidence that this may have occurred. Furthermore, we show that the funding did not appear to improve some potentially important quality inputs, such as teacher–pupil ratios. However, it should be noted that the concomitant increase in enrollments and teachers over this period likely explains why teacher–pupil ratios did not change.
It is important to speculate on the mechanisms through which Head Start funding increases led to higher child enrollments. Historically, local Head Start programs have underserved eligible children, which implies that there have been more eligible children than seats available for them. According to a report by Puma et al. (2010), 85 percent of children who participate in Head Start attend programs that are oversubscribed (as of 2002). Therefore, it is likely that additional funding was used to increase enrollments by reaching out to waitlisted families. In other areas, there might be an issue of incomplete take-up, which implies that not all eligible children enroll in Head Start. In these cases, additional funding may have been used to conduct information campaigns to increase awareness about the availability of such programs.
The analyses in this paper exploit several pieces of legislation that significantly increased Head Start funding. However, more recent legislation introduced strict standards and accountability measures into the program with comparatively little funding increases. For example, the 1998 COATES Act mandated that 50 percent of all Head Start teachers nationally must have an associate's degree in ECE (or related field) by 2003. In addition, the 2007 Improving Head Start for School Readiness Act required 50 percent of teachers to have a bachelor's degree by 2013 (U.S. Office of Head Start, 2020). As of the 2014–2015 school year, these education requirements were met, with 72 percent of Head Start teachers having at least a bachelor's degree (National Institute for Early Education Research 2016).
Our results suggest that Head Start administrators may make trade-offs between serving more children and engaging in some quality-related investments (e.g., increasing teacher salaries and auxiliary services), even during a period of rapid funding growth. Therefore, it is possible that Head Start administrators may have reduced the number of children served or engaged in input substitution (i.e., reducing or withholding other quality investments) to comply with the 1998 and 2007 teacher education mandates in the face of limited financial resources. Although additional research is needed to examine how Head Start programs adjusted to these recent reforms, this paper reveals that even a modest amount of quality improvement requires significant financial resources. Finally, more consistent and quality data collection would allow researchers to credibly analyze the costs and benefits of the reforms to inform policy discussions.
Footnotes
APPENDIX A. Empirical Appendix
Head Start Funding in Millions, 1983-2007: CFFR and National Reported Funding (in 2008$).
Notes: Each line represents the total real Head Start funding (in millions) (in 2008$). The dark black line plots the total Head Start funding (in millions) using county-year level data are from CFFR aggregated up to year level. The light purple connected line with diamonds plots the national Head Start funding reported in Head Start Fact Sheets. The dark purple line with hollow squares uses the CFFR data while assigning the average funding for years in 2000, 2006 and 2007. For more details about data construction, see section “Data Construction.” Head Start Funding Per Child.
Notes: Head Start spending (in 2008$) data are from CFFR, coupled with the population counts for three- and four-year-olds from SEER. For more details about data construction, see section “Data Construction.” Growth in Head Start Funding Per Child between 1988 and 2007.
Notes: Head Start spending (in 2008$) data are from CFFR, coupled with the population counts for three- and four-year-olds from SEER. Growth measure is calculated using 1988 as the base period, and the shades in the map on the right are determined based on the terciles of the growth distribution. For more details about data construction, see Section “Data Construction.” Head Start Funding Per Child and Program Characteristics.
Notes: Head Start spending (in 2008$) data are from CFFR, coupled with the population counts for three- and four-year-olds from SEER. Head Start program characteristics are from PIR. For more details about data construction, see section “Data Construction.”. All the measures are averages calculated using means. The data include years between 1988 and 2007.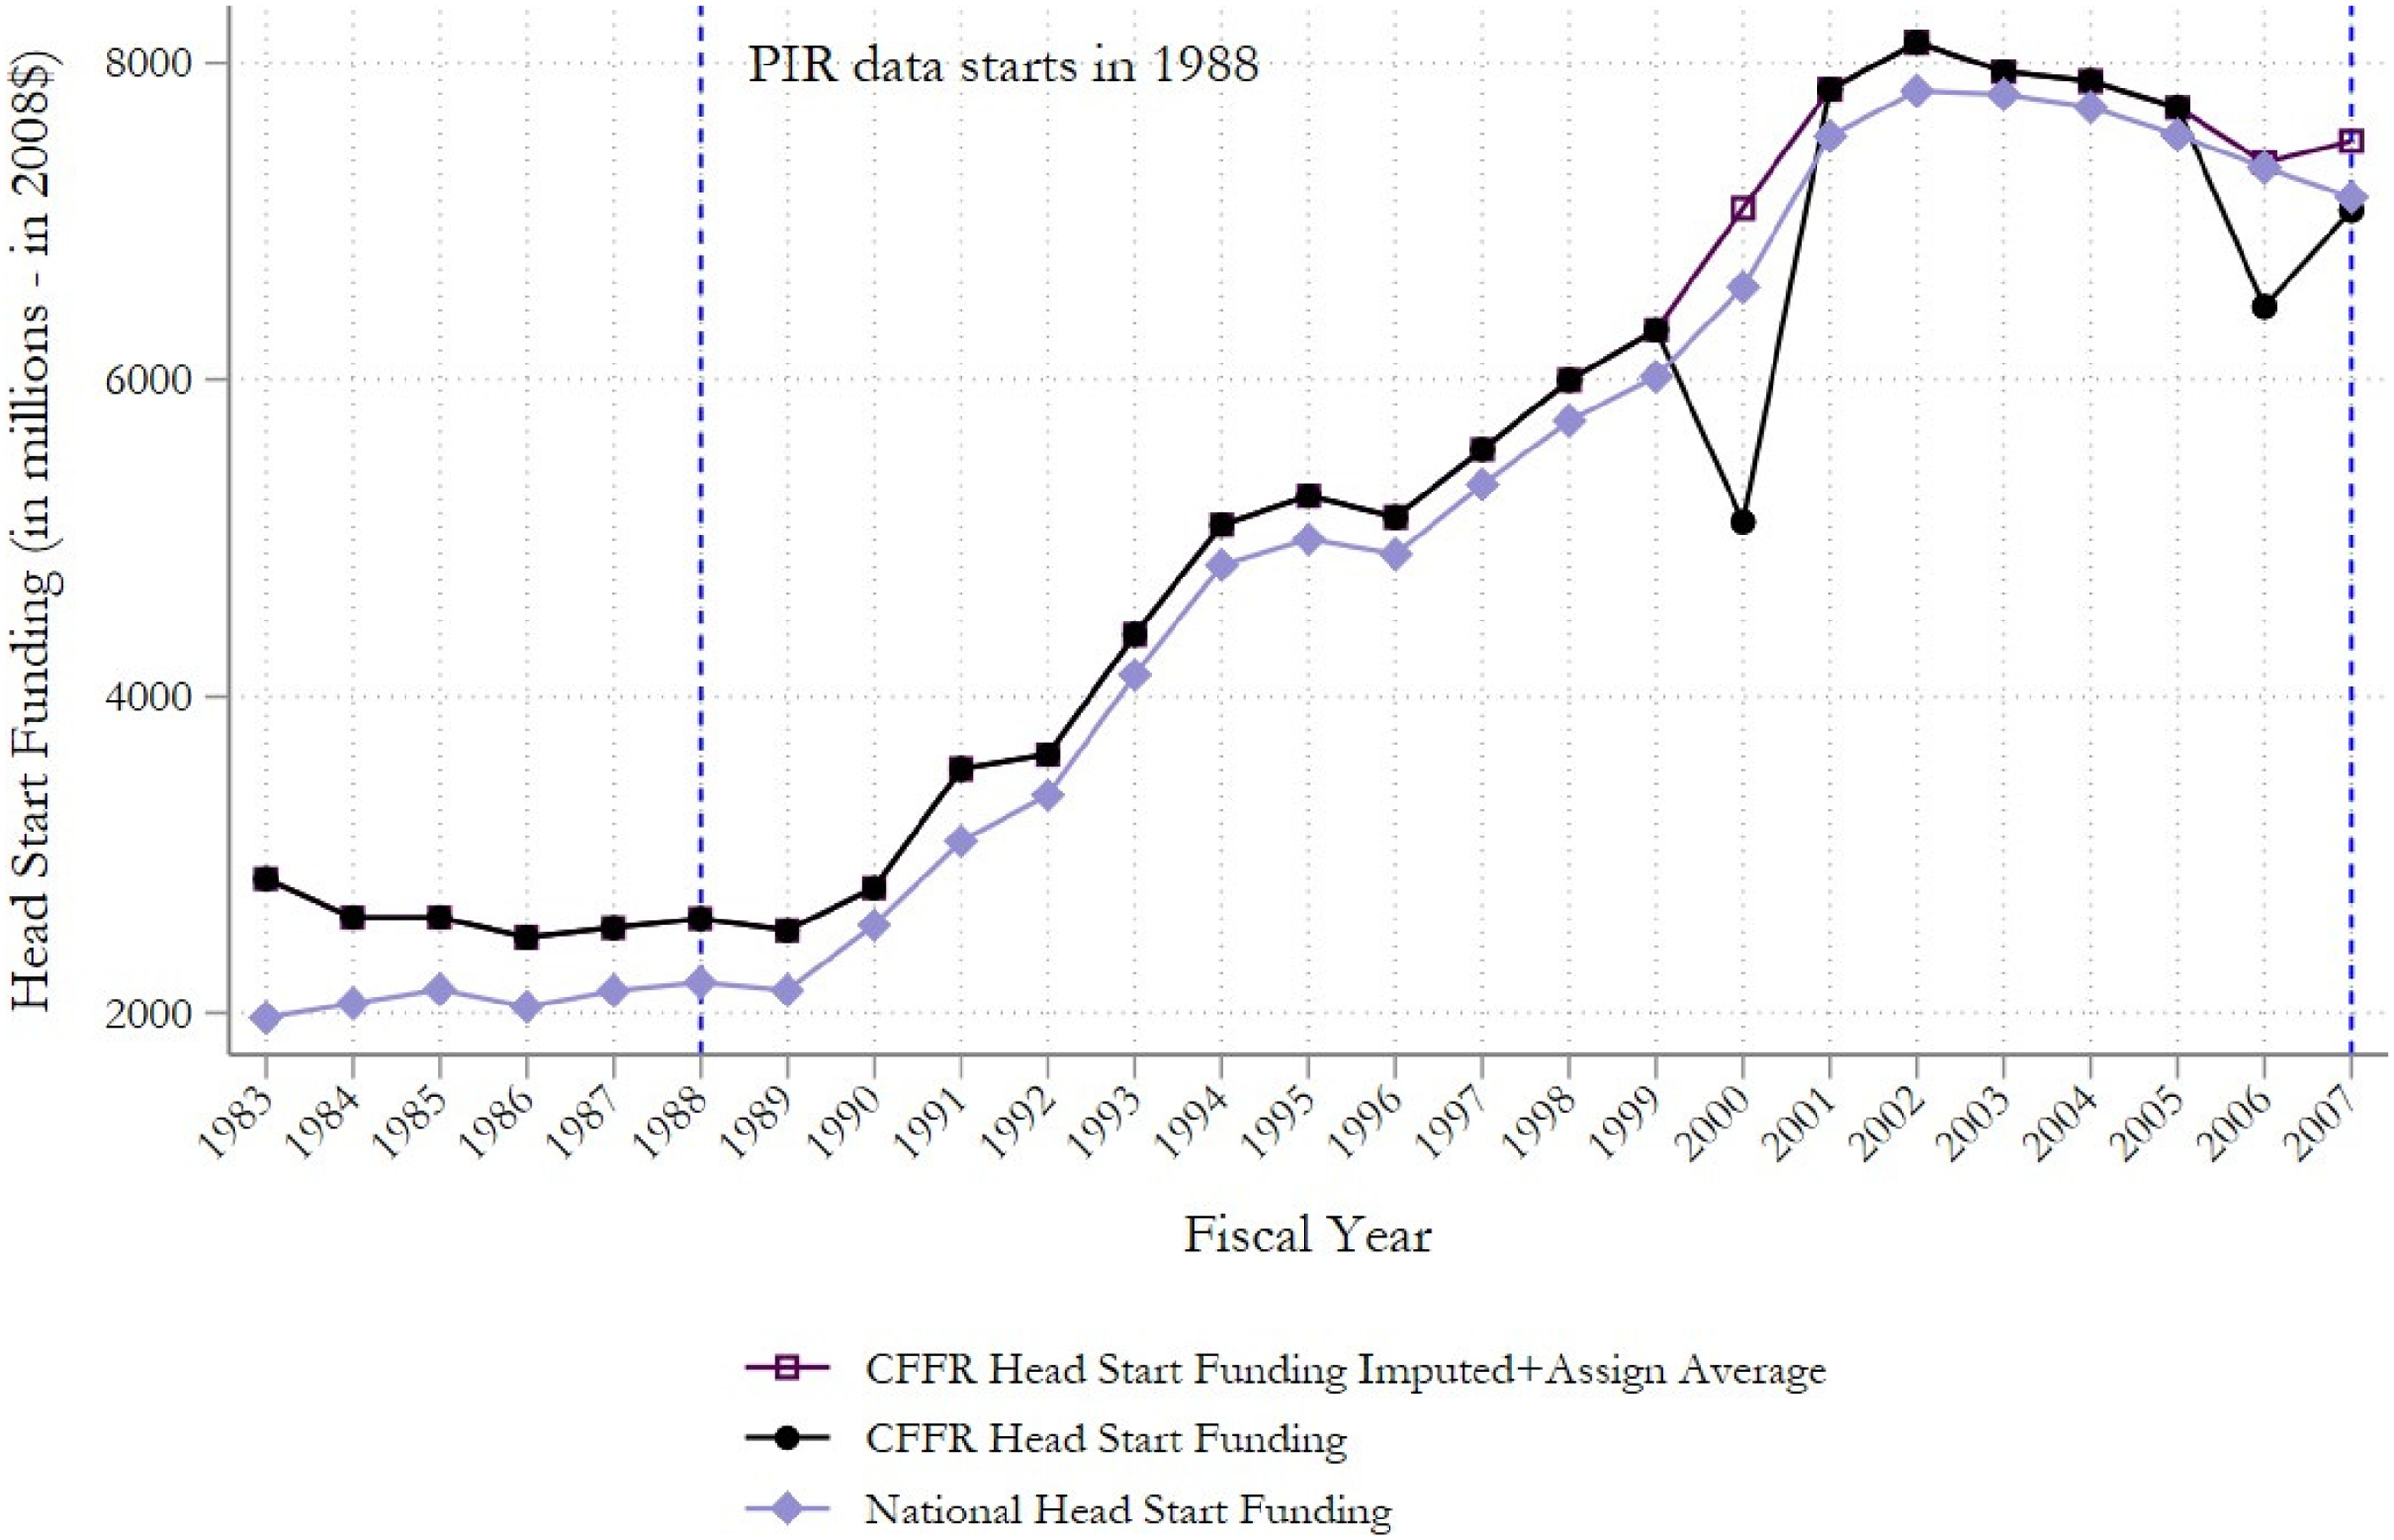
Declaration of Conflicting Interests
The authors declared no potential conflicts of interest with respect to the research, authorship, and/or publication of this article.
Funding
The authors received no financial support for the research, authorship, and/or publication of this article.