
Abstract
Does corruption ease the burden of regulation? We test this question using survey data on business managers’ experience in dealing with regulation and corruption. We find that there is substantial within-country variation in the burden of regulation and that corruption is associated with worse regulatory outcomes across a range of indicators at the country, national, and firm level. These findings suggest that corruption is associated with an increase in the burden of regulation, and imposes large costs on businesses. While corruption is associated with an increased burden of regulation, this does not seem to happen through an increase in how much time senior managers must devote to regulation, suggesting that the cost of corruption-induced regulation manifests in the form of additional staff costs or professional fees.
Introduction
Does corruption ease the burden of regulation by reducing the time and resources that businesses spend dealing with red tape? Alternatively, do corrupt officials use red tape to extract larger bribes, forcing businesses to waste time and resources? Many studies conclude that corruption is associated with misgovernance and low-quality regulation (Banerjee 1997; Breen and Gillanders 2012; Djankov et al. 2002; Guriev 2004). However, a recent study suggests that there is a weak association between managers’ experiences of dealing with regulations and the stringency of actual regulations (Hallward-Driemeier and Pritchett 2015: 123). Building on this finding, we extend the literature on corruption and regulation to account for how firms experience regulation on the ground. Previous studies find that corruption is associated with more red tape in terms of legal requirements but they do not consider whether this regulation is perceived to be more burdensome. To address this gap, we use data on de facto regulation from the World Bank’s Enterprise Surveys, a series of global surveys that contain data on managers’ experience of Doing Business. The surveys record the amount of time that firms spend dealing with overall regulation, as well as the extent to which they perceive that regulation is a major constraint on their operations.
We find that more corruption is associated with a greater regulatory burden on average, across a range of indicators at both the national, subnational, and firm level. The indicators include the time spent dealing with regulation, and the extent to which regulations related to (a) licenses and permits, (b) tax administration, and (c) customs and trade are major constraints to Doing Business. Furthermore, we find that the association between corruption and increased regulatory burden continues to hold in countries and subnational units characterized by low-quality regulations and institutions.
As well as contributing to the literature on the impact of corruption on regulation, our study also contributes to the literature on the growth effects of corruption. This literature argues that corruption may contribute to growth in environments where firms must contend with low-quality regulations and institutions. 1 Our results do not support this argument, in that they suggest that the average firm is impeded and constrained by corruption. While this does not preclude the possibility that corruption facilitates growth by enabling the most efficient firms to avoid regulation, it suggests that potential growth effects—if they exist—may operate through channels other than the impact of regulation on the average firm.
This article is organized as follows. First, we review the empirical literature on the determinants of regulation, and then we consider the role of corruption as an efficient “grease.” We then proceed to outline our data, method, and results. The results are presented in four parts: the first presents our findings regarding the overall association between corruption and regulation and the second, third, and fourth parts describe the findings from our subnational analysis, sub-samples, and firm-level tests. Finally, we conclude with a discussion of the implications of our findings for research and policy.
Corruption and Regulation
The quality of regulation is shaped by corruption, institutions, and a range of historical and geographic factors. However, previous empirical studies on the links between corruption and regulation have not differentiated between de facto and de jure regulation. The difference is important, as it may appear that stringent formal regulations are associated with more corruption when in practice firms may sidestep the costs of de jure regulation entirely. Furthermore, there is growing evidence that the burden of corruption and regulation differs considerably within countries. Some regions in a country may experience dramatically different levels of both, suggesting that we should look within, as well as across countries to understand the impact of corruption on regulation. We now describe the literature and present arguments on how to advance it to address these issues.
The Determinants of Regulation
Regulation has the potential to help societies by reducing or eliminating market failures. However, some parts of society benefit more from shaping regulation than others. Special interest groups, in particular, may use their resources to capture the government agencies that design and monitor compliance with regulations. Indeed, the public choice approach contends that regulation is often acquired by industries and designed for their benefit (Stigler 1971). This outcome is known as regulatory capture, and it can happen through legal practices like lobbying and political donations or illegal practices like corruption (Laffont and Tirole 1991).
In line with the public choice approach, many studies find that corruption affects the quality of regulation. Guriev (2004), for example, presents a theoretical model in which he finds that some kinds of corruption can reduce red tape, but the equilibrium level of red tape is always above the social optimum. Breen and Gillanders (2012) find that corruption is associated with worse business regulation in a sample of 100 countries from 2000 to 2009. However, that study and the majority of empirical studies on the determinants of regulation consider only de jure or formal regulation. 2 Even if corruption is responsible for a more complex and seemingly burdensome legal and regulatory environment, as Breen and Gillanders (2012) argue, does it necessarily follow that corruption imposes real burdens on firms? According to Hallward-Driemeier and Pritchett (2015: 123), there is little correlation between de jure and de facto measures of regulation: the stringency of formal regulation on the books is not correlated with managers’ actual experience of dealing with regulation. There are two ways, in particular, that corruption may help firms to sidestep regulation. First, it may increase the legal requirements on firms, as corrupt officials use these requirements to extract bribes. Second, corrupt officials may be willing and able, for a fee or other benefit, to waive large swathes of legal requirements (Djankov et al. 2002). The empirical question as to which of these mechanisms dominates is the focus of this article.
More generally, scholars have noted that we lack clarity on the link between corruption and regulation (Fazekas 2017). The majority of empirical studies on the causes and consequences of regulation use the World Bank’s Doing Business indicators to measure the quality of regulation. These indicators come from surveys that ask experts to comment on a small domestically owned manufacturing company, usually in a country’s commercial capital. This focus may bias the data toward the regulatory experience of firms in the center, which may differ considerably from the experience of firms across a country’s regions, as administrative and state capacity to enforce compliance with regulation may differ significantly within countries. Monitoring in provinces may not be as stringent and there may be important differences in infrastructure, and population density, as well as other cultural and historical factors. Indeed, previous research finds that corruption can vary within an economy. For example, Cole, Elliott, and Zhang (2009) find that it varies in the case of China, Ledyaeva, Karhunen, and Kosonen (2013) in Russia, and Gillanders (2014) across a sample of economies.
Of course, many factors besides corruption also contribute to the quality of regulation including institutional quality, geographic factors, and different legal traditions. Good institutions may produce better regulations and foster more accountability among the government agencies that design and enforce regulations. Furthermore, higher-quality institutions may help societies to resist processes such as regulatory capture and make it more difficult for special interest groups to lobby for regulation (or deregulation) that benefits only a narrow segment of society. In line with these arguments, Djankov et al. (2002) find that countries with larger, less democratic, and more interventionist governments regulate business entry more heavily. La Porta et al. (1997) find there is a strong association between different legal traditions and a broad range of regulatory outcomes, including the protection of investors. Similarly, Botero et al. (2004) find a strong association between legal tradition and the regulation of labor markets. In summary, the literature on the quality of regulation points to corruption, institutions, and historical factors as key predictors. However, a related literature on the growth effects of corruption argues that there are particular circumstances in which corruption might be beneficial, which we now consider.
Corruption and Efficiency
One of the most controversial debates in economics centers on whether corruption “greases” or “sands” the wheels of commerce. The debate centers on the effect of corruption in poor regulatory environments. If bribery works in these places, it may help businesses to reduce the cost of compliance with bad regulations, or speed things up when dealing with slow public officials, thus raising growth and productivity. On the other hand, corrupt officials may find it easier to use regulation as a tool to extract larger bribes where institutional quality is low, making it less likely that corruption will feed into higher growth. In this article, we do not focus on the growth effects of corruption but we note that regulation is a central feature of this argument, as it is the primary channel through which the “grease” of bribes affects growth and productivity.
While the literature advances the argument that corruption may increase growth under constraints, it is aware also of the potential costs of corruption. Bribery is an illegal and inherently risky activity. In most countries, severe cases are punished by imprisonment and in some countries, public officials have been executed for corruption. Moreover, the average firm may not realize any advantage from bribery if it is a tool used by corrupt public officials to harass firms according to their ability to pay bribes. Indeed, individual firms may benefit from paying a bribe to skip the queue but on average corruption may stifle firm activity through more burdensome regulation, as corrupt officials extract larger bribes from the most profitable businesses. Not to mention the possibility that an inefficient firm may pay the largest bribe by compromising on quality to do so (Rose-Ackerman 1997). Finally, we should not assume that firms always direct bribes at regulations that strangle economic development when they may sometimes use bribery to circumvent or eliminate good regulations (Bertrand et al. 2007).
There are many studies that test the impact of corruption on the economy. For example, Mauro (1995) finds that corruption is associated with lower growth in two datasets covering between 68 and 57 countries from 1971 to 1983. Méon and Sekkat (2005) find that corruption reduces growth in a sample of 63 to 71 countries from 1970 to 1998 and that growth is even worse as governance deteriorates. However, Méon and Weill (2010) argue that testing the overall impact of corruption on growth is not a direct test of the grease hypothesis; nor is an overall negative effect inconsistent with the idea that corruption may grease the wheels. Rather, they argue that researchers should focus on whether corruption helps countries with weak institutions to take advantage of their factor endowments. They study 69 countries from 2000 to 2003 using the World Bank’s Control of Corruption (CC) and Transparency International’s Corruption Perceptions Index (CPI). In some estimations, they find a statistically significant positive marginal effect of an increase in corruption on efficiency in poorly governed countries, and in others, the effect becomes insignificant in these countries (Méon and Weill 2010: 253). Following this study, Dreher and Gassebner (2013) find that corruption is associated with a higher rate of firm entry in the presence of administrative barriers to entry in a sample of 43 countries from 2003 to 2005, using the CC and CPI to measure corruption and the World Bank’s Doing Business indicators to measure regulation. 3
Both Méon and Weill’s (2010) and Dreher and Gassebner’s (2013) works are sophisticated in their approach to testing the grease hypothesis. However, like many studies in the literature, they rely on macro indicators of corruption perceptions. Aidt (2009: 271), who finds against the hypothesis, argues “that all the claims made about the corruption-growth nexus based on statistical analysis of the perception-based indices of corruption disappear when a cross-national index of managers’ actual experience with corruption is used to approximate corruption.” Indeed, Kaufmann and Wei (1999) find that firms that pay more bribes spend more time dealing with regulation and suffer a higher cost of capital, in a study that uses data from three worldwide firm-level surveys from 1995 to 1997. Fisman and Svensson (2007) find that the bribery rate is associated with a reduction in firm growth of 3 percent in a survey of Ugandan firms from 1995 to 1997. 4
Lessons from the Existing Literature
The literature on the determinants of regulation and the related literature on the growth effects of corruption contain useful lessons for our study. The first is that we must distinguish clearly between regulation in principle and in practice if we are to understand whether corruption eases the burden of regulation. Ideally, empirical tests should incorporate measures of both de facto and de jure regulation, to understand how regulation is experienced by firms as well as its formal quality or lack thereof. The second is that there are reasons to expect that corruption and regulatory quality can vary within an economy. Finally, we must consider both the general association between corruption and regulation and the possibility that the impact of corruption on regulation is contingent on the existing institutional and regulatory context. Recent contributions on the contingent effect of corruption on the economy agree that it may have an overall negative effect while having a positive effect under some conditions, and it is possible that the same is true of the association between corruption and regulation.
Data and Method
Our main sources of data are World Bank Enterprise Surveys conducted between 2005 and 2009. This sample facilitates a direct comparison with the existing literature which uses data from this period—in particular, the study of Breen and Gillanders (2012), which used data from 2000 to 2009. Thus, any difference that we might find will not be attributable to a change in the time period under consideration. The Enterprise Surveys are representative firm-level surveys on a wide range of topics relevant to the business environment. Formal firms in the manufacturing and services sectors are surveyed, excluding entirely state-owned firms. At the country level, the data is a highly unbalanced panel with some countries surveyed once and others surveyed multiple times.
We use four outcome variables that come from survey questions about the extent to which regulatory issues affect firm operations. Three of our four outcome variables come from questions about the extent to which (a) tax administration, (b) business licensing and permits, and (c) customs and trade relations are constraints to the respondent’s firm’s operations. Specifically, firms are asked if the phenomenon in question is “No Obstacle, a Minor Obstacle, a Major Obstacle, or a Very Severe Obstacle to the current operations of this establishment.” Note that the tax question is explicitly about how the administration of taxation serves as an obstacle to operations. Firms are separately asked about the extent to which tax rates are an obstacle. Thus, the tax question captures costs faced by firms through preparing and filing taxes (either internally or through hiring external professionals) and meeting with tax officials.
Our fourth outcome variable captures firms’ responses to the following question: In a typical week over the last 12 months, what percentage of total senior management's time was spent in dealing with requirements imposed by government regulations?
5
Each of our regulatory constraint variables captures firm-level perceptions of the extent to which regulation is problematic because it is costly and (or) time-consuming. 6 While not objective, they are at least based on the firm’s own experiences as opposed to the perceptions of others. Furthermore, our variable which focuses specifically on the percentage of senior management time spent dealing with overall regulation provides a different view of the regulatory burden, as one can imagine situations where firms might consider something to be time-consuming but not necessarily burdensome and vice versa. At all levels of aggregation, when examining a constraint variable, we are interested in the percentage of firms in each country or subnational unit that report that the factor in question is a major or very severe obstacle to their operations. Similarly, when examining the time spent dealing with regulations we are interested in the average number of hours reported.
Our subnational units do not necessarily correspond to real administrative or geographical regions. For example, Kazakhstan is divided into center, north, south, east, and west, whereas the areas surveyed in Kenya are Kisumu, Mombasa, Nairobi, and Nakuru. We obtained our macro-level averages of these variables from the Enterprise Surveys’ website and for our subnational analysis, we generated averages of the firm-level data for each survey unit. We dropped countries with only one region and regions with only one firm.
Our main explanatory variable is corruption. Following Gillanders (2014), we measure corruption from an Enterprise Survey question that asks whether corruption is “No Obstacle, a Minor Obstacle, a Major Obstacle, or a Very Severe Obstacle to the current operations of the establishment.” Like our outcome variables, this is not entirely objective because it contains a subjective appraisal but unlike common indices of corruption, it is based on firms’ own experiences of corruption. While we acknowledge the potential shortcomings of this measure, it has two desirable features. First, the commonly used metrics from Transparency International (CPI) and the World Bank (CC) are largely based on appraisals by so-called experts and therefore have been criticized on these grounds by many authors as being subject to perception biases (Fan, Lin, and Treisman 2009; Reinikka and Svensson 2006; Svensson 2003) and a tendency to lag reality (Kenny 2009; Knack 2007). Second, and crucially for our purposes, this firm-level information allows us to generate subnational indicators. Gillanders (2014) demonstrates that there is meaningful subnational variation in corruption according to this measure.
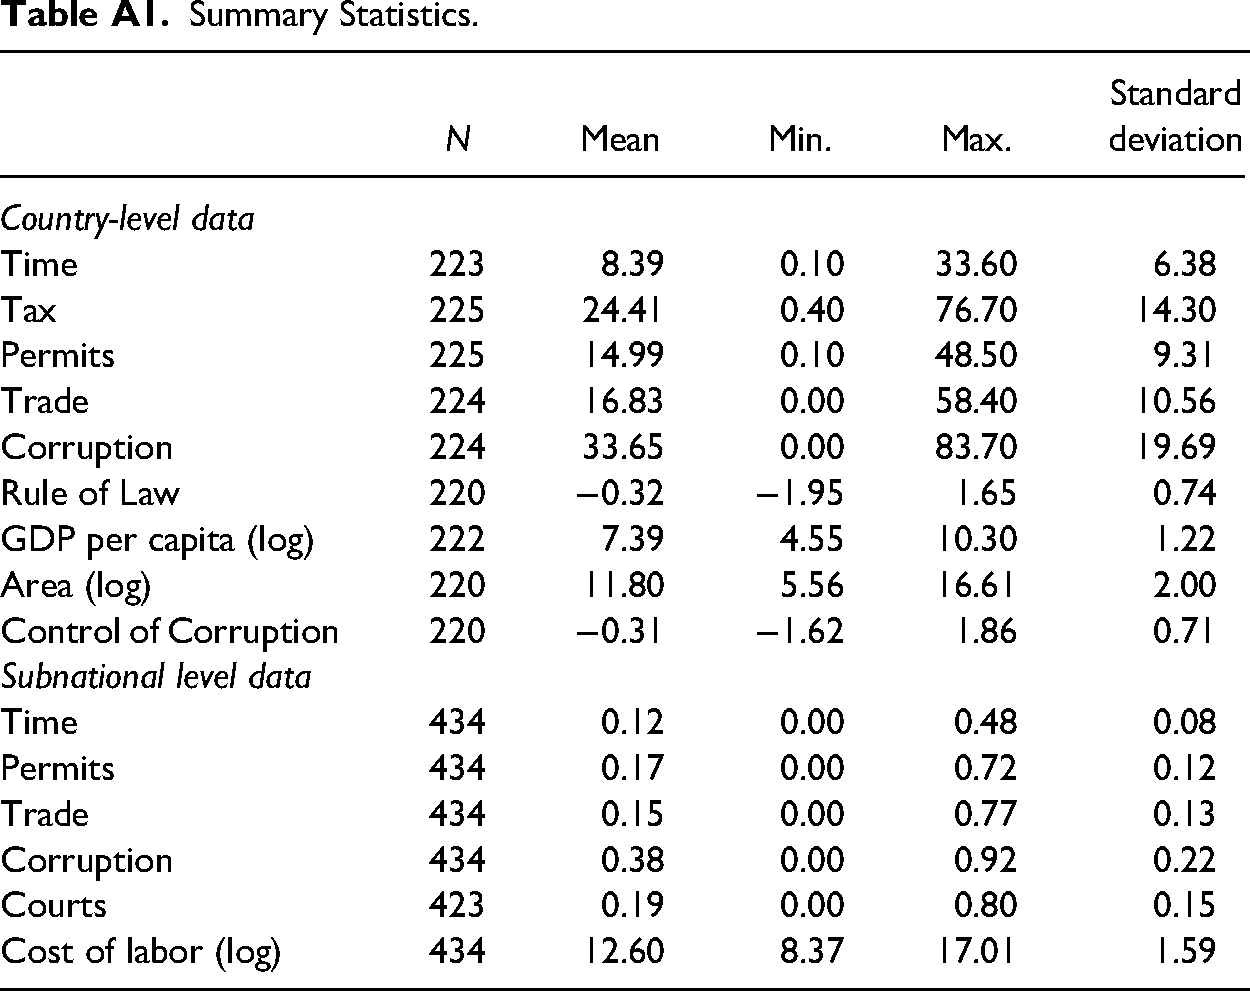
We control for the Rule of Law from the World Governance Indicators, as a proxy for institutional quality, gross domestic product (GDP) per capita, and land area in square kilometers from the World Development Indicators . Our subnational level control variables are generated from the Enterprise Survey. Appendix Table A1 presents summary statistics for all of the variables used in this article.
Endogeneity is an obvious concern at both the national and regional level, and while we can include country-fixed effects to account for omitted variables and unobserved heterogeneity, there are conditions whereby poor regulation and regulatory practice may incentivize corruption (Djankov et al. 2002; Holcombe and Boudreaux 2015). Instrumental variable strategies have been employed in cross-country settings to address this concern. For example, Breen and Gillanders (2012) use distance to the equator, ethnolinguistic fractionalization, and the age of the state as instruments for corruption. In our context, these instruments fail to pass the standard diagnostic and are suspect on an intuitive level. Furthermore, no comparable, or sensible, instruments can be generated from the Enterprise Surveys for use in the regional data. We are therefore limited to exploring associations between corruption and regulation.
Results
Country-Level Results
Figure 1 illustrates a strong association between the extent to which corruption is viewed by firms within a country to be a problem and our four measures of regulatory burden. The first panel shows that the time spent by senior managers dealing with regulation increases as the percentage of firms identifying corruption as a major constraint increases. A similar relationship is evident in panels 2 to 4, which focus on how much of a problem tax, business licensing and permits, and trade are for firms. We now proceed to test their robustness to the inclusion of covariates.
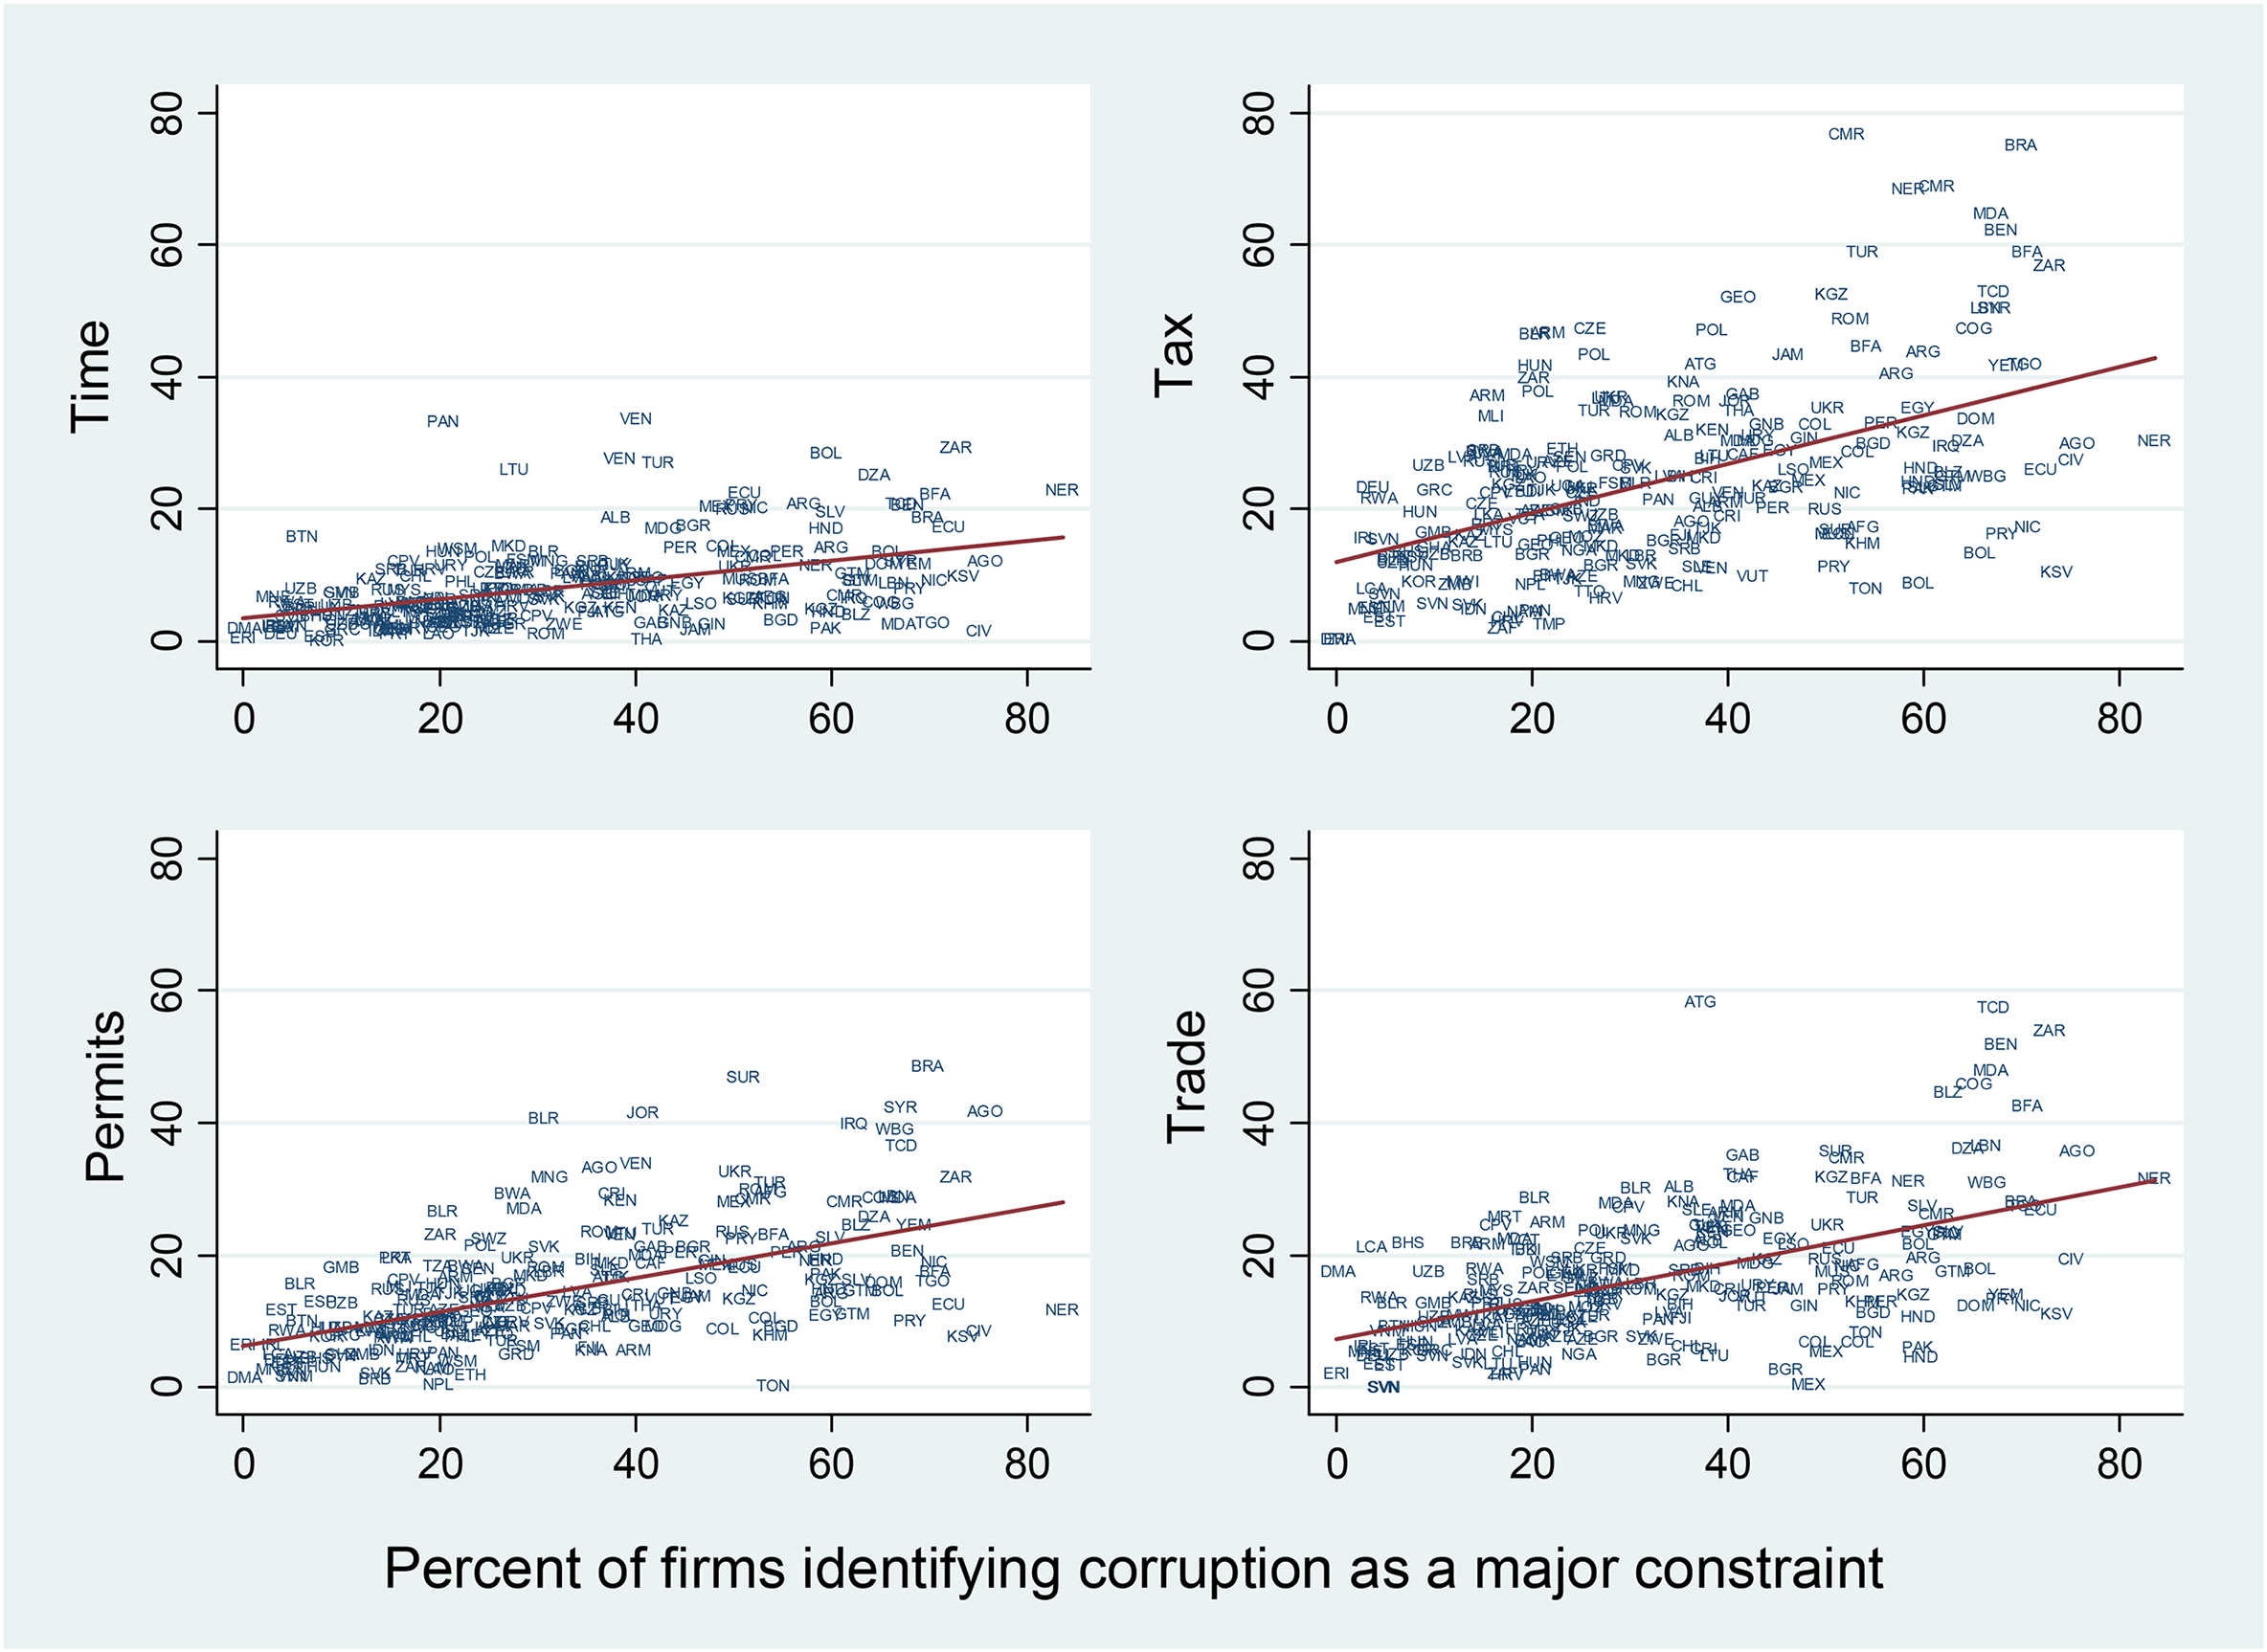
Corruption and regulatory burden at the country level.
Table 1 presents estimates of the relationship between corruption and our four regulatory constraint variables, controlling for several potentially important variables. First, we control for general institutional quality using the World Bank’s Rule of Law indicator. In places where the overall “rules of the game” are better, this may translate also into a better business environment that imposes fewer unnecessary constraints on firms. Second, we control for GDP per capita to allow for the possibility that richer countries have greater state capacity and thus more effective regulatory systems. Finally, we control for the geographic size of a country because larger countries may be harder to administer and slower to reform.
Country-Level Results.
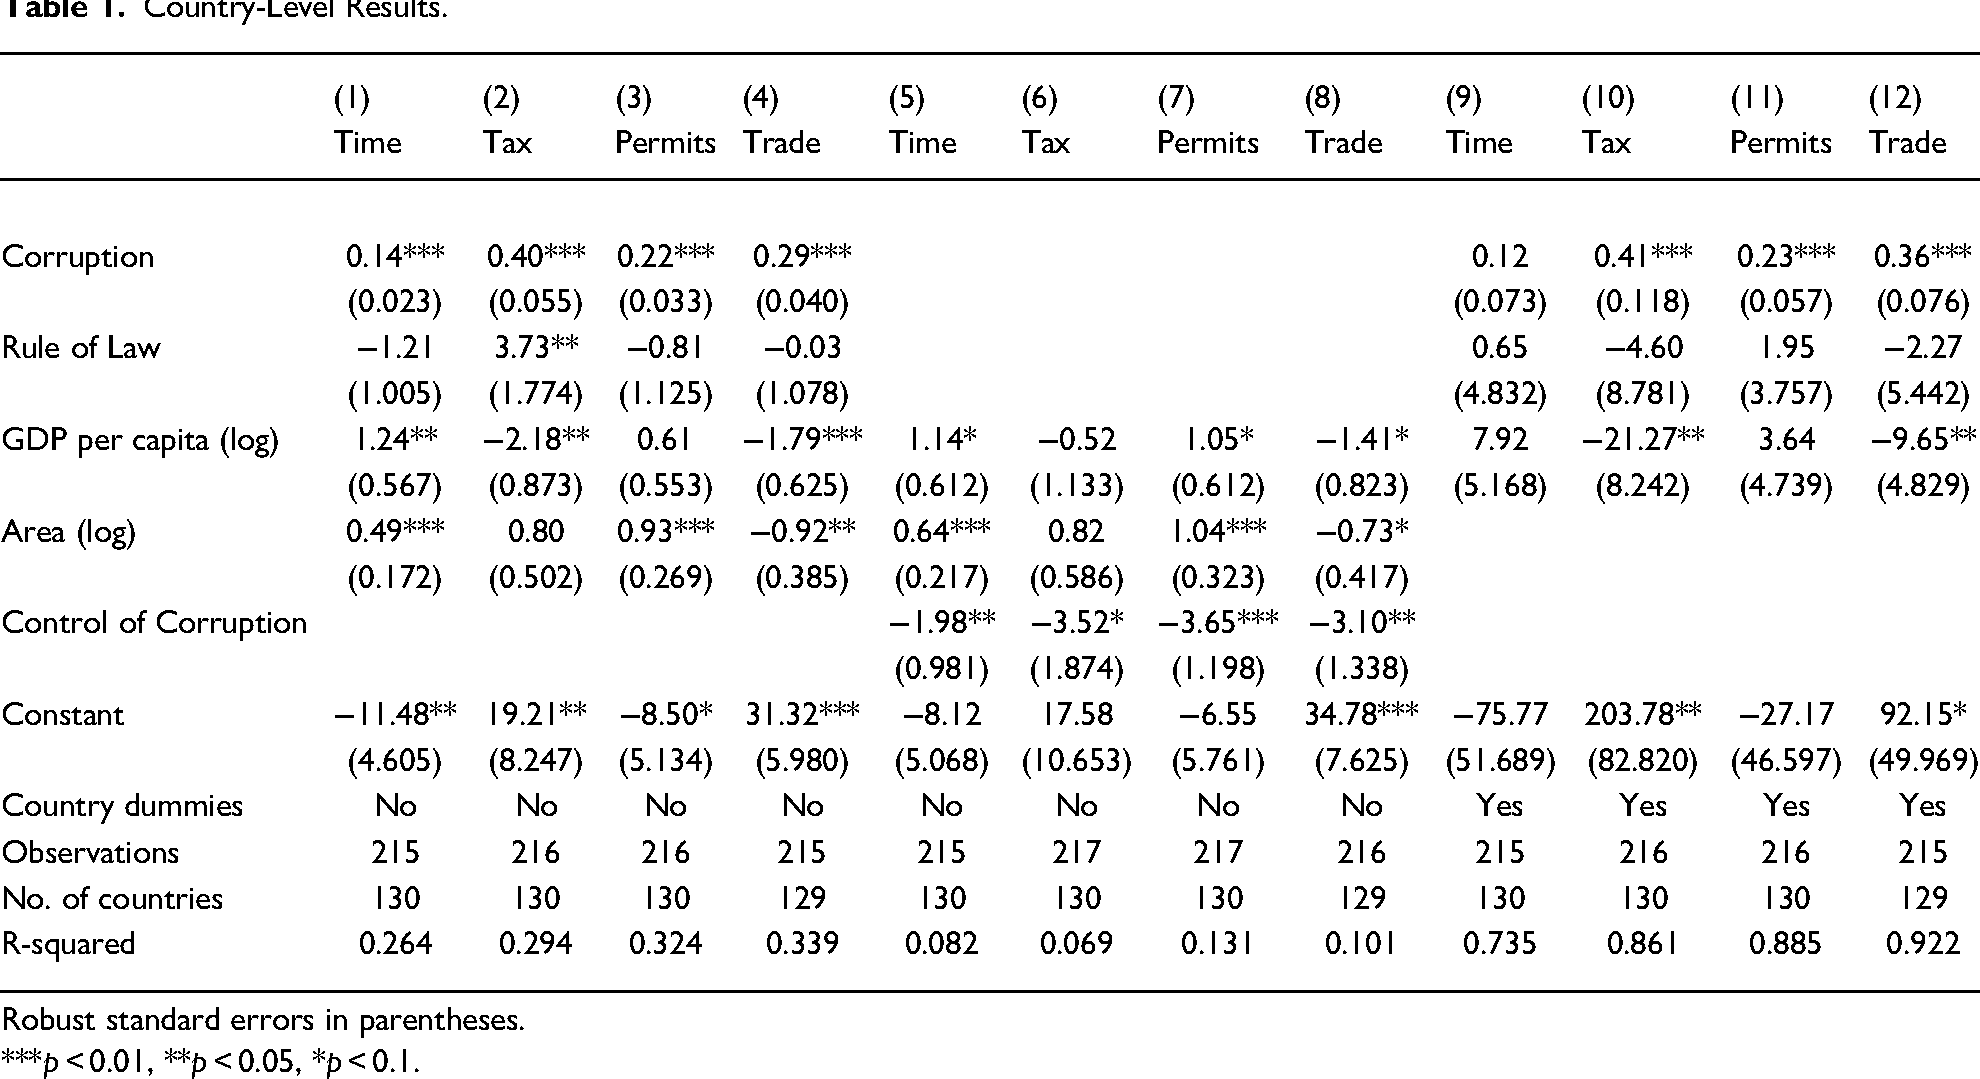
Robust standard errors in parentheses.
***p < 0.01, **p < 0.05, *p < 0.1.
We find that corruption is a significant predictor of the burden of regulation across our four outcomes: more corrupt countries tend to have more burdensome regulation, at least from the point of view of their firms. Furthermore, institutional quality, as measured by the Rule of Law, is statistically insignificant, except the model in Column 2 where tax administration is the outcome variable. These results are largely in line with the findings of Kaufmann and Wei (1999) and Breen and Gillanders (2012). Interestingly, the senior managers of firms in richer countries report that they spend more of their time dealing with regulation but at the same time view some aspects of regulation as less burdensome. This reinforces the need to examine multiple aspects of the regulatory environment. Finally, the results pertaining to country size are mixed: our time and permit indicators are negatively affected by country size whereas the country size is associated with firms reporting less burdensome trade and customs regulations.
Corruption, as a secretive illegal act, is very challenging to measure and we therefore test our results with a different measurement. The CC index compiled by the World Bank differs considerably from the Enterprise Survey measure of corruption, as it is based on multiple data sources, including expert opinion. The scale is also different, running from −2.5 to 2.5. Corruption indicators based on expert perceptions are potentially subject to perceptions biases whereby corruption is inferred from its commonly assumed consequences, such as excessive regulation. Therefore, as a robustness check columns 5–8 of Table 1 substitute the World Bank’s CC variable for the World Bank Enterprise Survey measure. We drop the Rule of Law from these specifications as it is highly correlated with the CC variable (0.91). For the most part, these specifications are in line with our previous findings, with the larger coefficient attributable to the compressed scale of the CC variable. The key difference is the results with respect to the burden of taxation, where the association with corruption is no longer statistically significant at the 5 percent level.
Columns 9–12 add country-fixed effects to the model to allow for cultural and other unobserved characteristics that may drive both corruption and regulatory burdens and perceptions of the same. The findings from these models are broadly in line with those reported in columns 1–4; the magnitude of the coefficients are similar but corruption is no longer a statistically significant predictor of the time managers spend dealing with regulation. From these results, we conclude that corruption is associated with more burdensome regulation in the domains of taxation, licensing, and trade. However, the evidence is less clear that this burden manifests itself in terms of senior management time. This is consistent with firms hiring additional staff or outside agencies to process the additional red tape imposed by corruption.
Regional Level Results
Having established that corruption is associated with more burdensome regulations at the country level, we proceed to test this relationship using subnational data. Figure 2 illustrates that there is a substantial within-country variation to be explained in each of our four indicators. In this figure, the top of each bar represents the maximum observed subnational value within a country, the bottom the minimum, and the point is the average. We also observe that the within-country variation does not have any obvious relationship to the average within a country, as the height of the bars does not increase as we move along the x-axis.
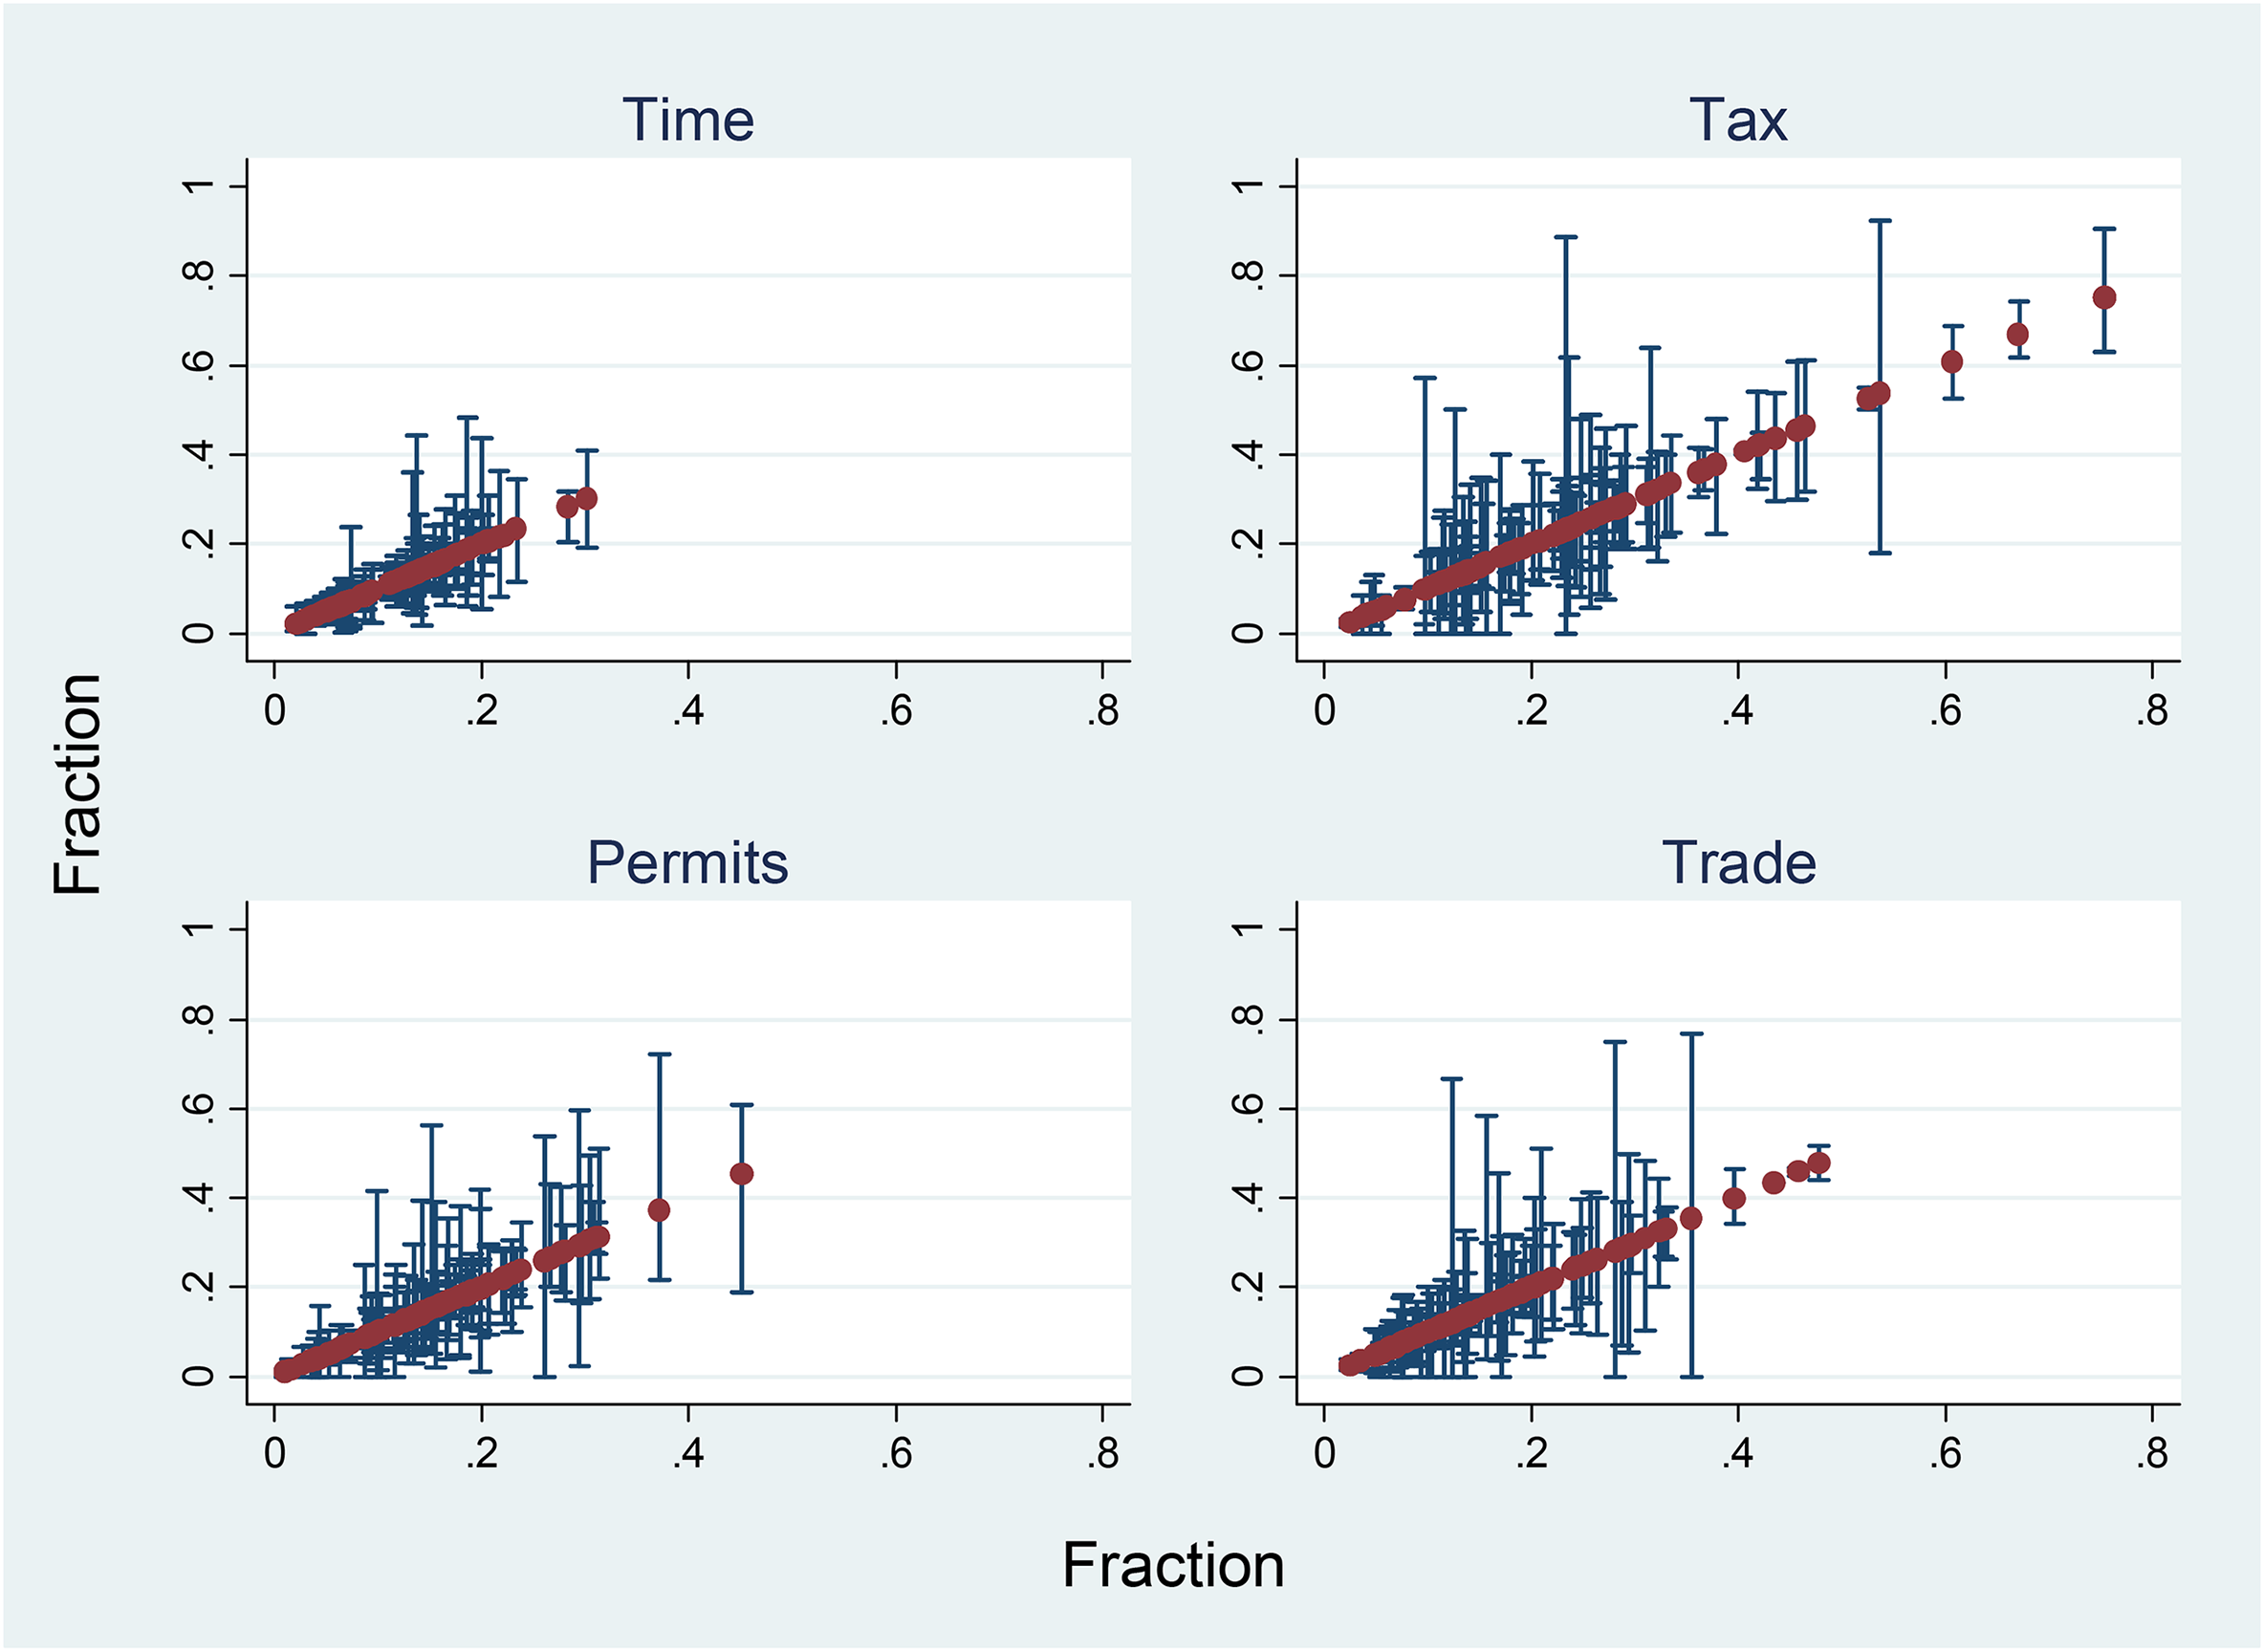
Within-country variation in regulatory burden.
Table 2 presents our subnational results. We control for many of the same factors as the country-level analysis. The first control variable—Courts—is our proxy for the quality of institutions, and captures the fraction of firms in a subnational unit that reports that the courts are a major or very severe obstacle to their operations. The annual Economic Freedom of the World report puts forward judicial independence and the impartiality of the courts as key elements in the protection of property rights. These variables have been used to examine the importance of institutional quality in relation to the shadow economy (Torgler and Schneider 2009) and subjective well-being (Bjørnskov, Dreher, and Fischer 2010). As larger firms are likely to have more regulatory obligations, our second control variable is the average total cost of labor. The Enterprise Survey does not contain any geographic information that would allow us to control the area. When we control for these factors, columns 1, 3, 5, and 7 show us that there is a strong association between corruption and the burden of regulation at the subnational level. More corrupt subnational units tend to have more burdensome regulations in the eyes of their firms. These findings lend support to Breen and Gillanders (2012). However, unlike Breen and Gillanders (2012), we do find a role for institutional quality, which is statistically significant in most of our specifications, except for the time spent dealing with regulation. Moreover, the magnitude of the institutional coefficient is larger than the corruption coefficient in most cases. As both variables are expressed in terms of the share of firms that view either corruption or the courts as a major or very severe obstacle, this suggests that institutional quality also plays an important role in the quality of the business environment.
Subnational Level Results.
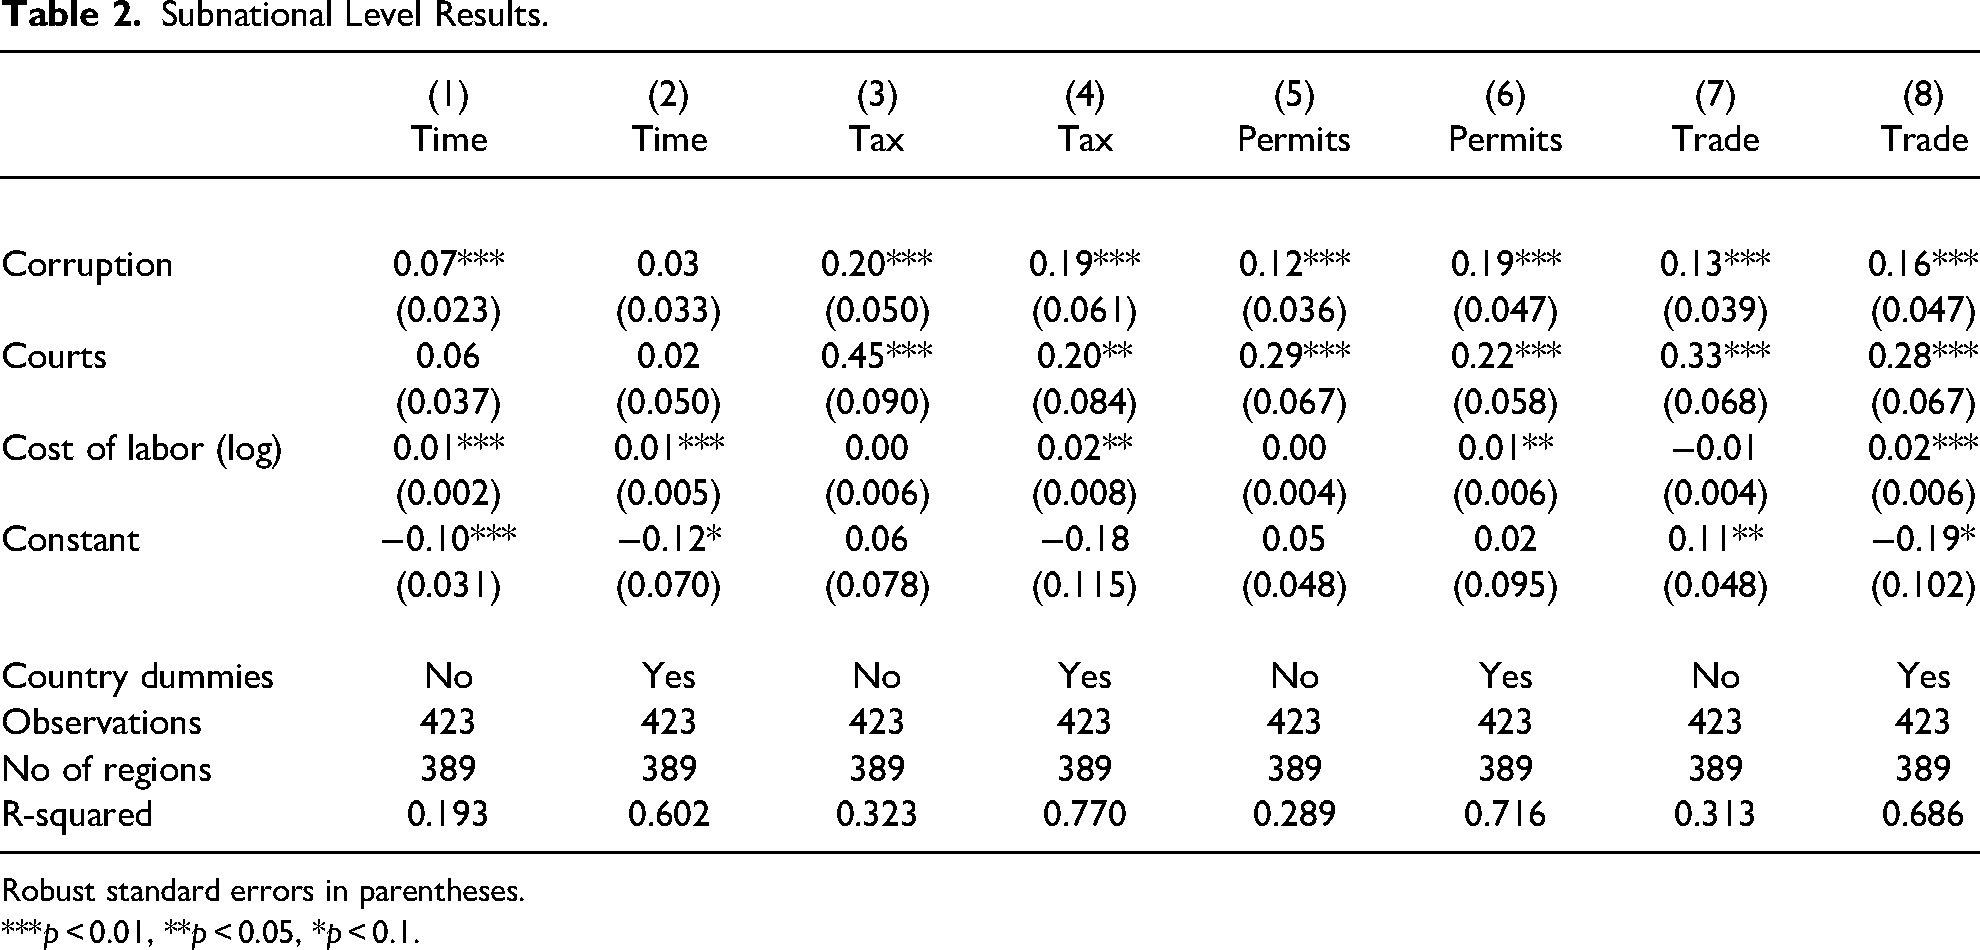
Robust standard errors in parentheses.
***p < 0.01, **p < 0.05, *p < 0.1.
Columns 2, 4, 6, and 8 introduce country-fixed effects to the specification as it is likely that country-level factors play a role in shaping both regulatory outcomes and corruption. Allowing for this cross-country heterogeneity, corruption is still associated with the regulatory burden in most of our specifications, except for senior management time spent dealing with regulation. Furthermore, the magnitude of the relationship is robust to the inclusion of country dummies, and the relationship between institutional quality and regulatory burden also holds.
Taken together, our findings point to a consistent association between corruption and the burden of regulation at the subnational level. Our findings are in line with the results from the country-level data and suggest that corruption generates a real burden for firms. We also see a role for broader institutional quality at this level: subnational units in which the courts are more of a constraint are places where the environment is less conducive to business.
The story is somewhat different when it comes to the time that senior managers spend dealing with regulation. Here, we find no meaningful association when we control for country-fixed effects. In columns 2 and 3, corruption is not associated with the amount of time it takes to deal with overall regulation. The burden of corruption on firms is still greater in these subnational units, but the cost of dealing with overall regulation is not necessarily time-consuming for managers. Once again the results are consistent with the cost of corruption-induced red tape being realized in terms of additional staff costs and professional fees rather than senior management time.
Corruption Under Low-Quality Regulation and Low-Quality Institutions
We now consider the conditional case for corruption; that is, the possibility that it can help in regimes that consist of low-quality regulation and weak Rule of Law. First, we present findings that control for de jure regulation using the World Bank’s Doing Business rank and the sub-rankings from Doing Business that correspond to the specific measures of regulatory constraint that we collected from the Enterprise Surveys. In Table 3, columns 1 to 8 add the Doing Business rank as a control variable. Estimates for each of our four regulatory constraint variables are presented with and without country dummies. Columns 9–14 add the Doing Business sub-rankings pertaining to tax, permits, and trade as additional control variables. Estimates in these columns are also presented with and without country dummies.
Subnational Level Results and Doing Business Rank.
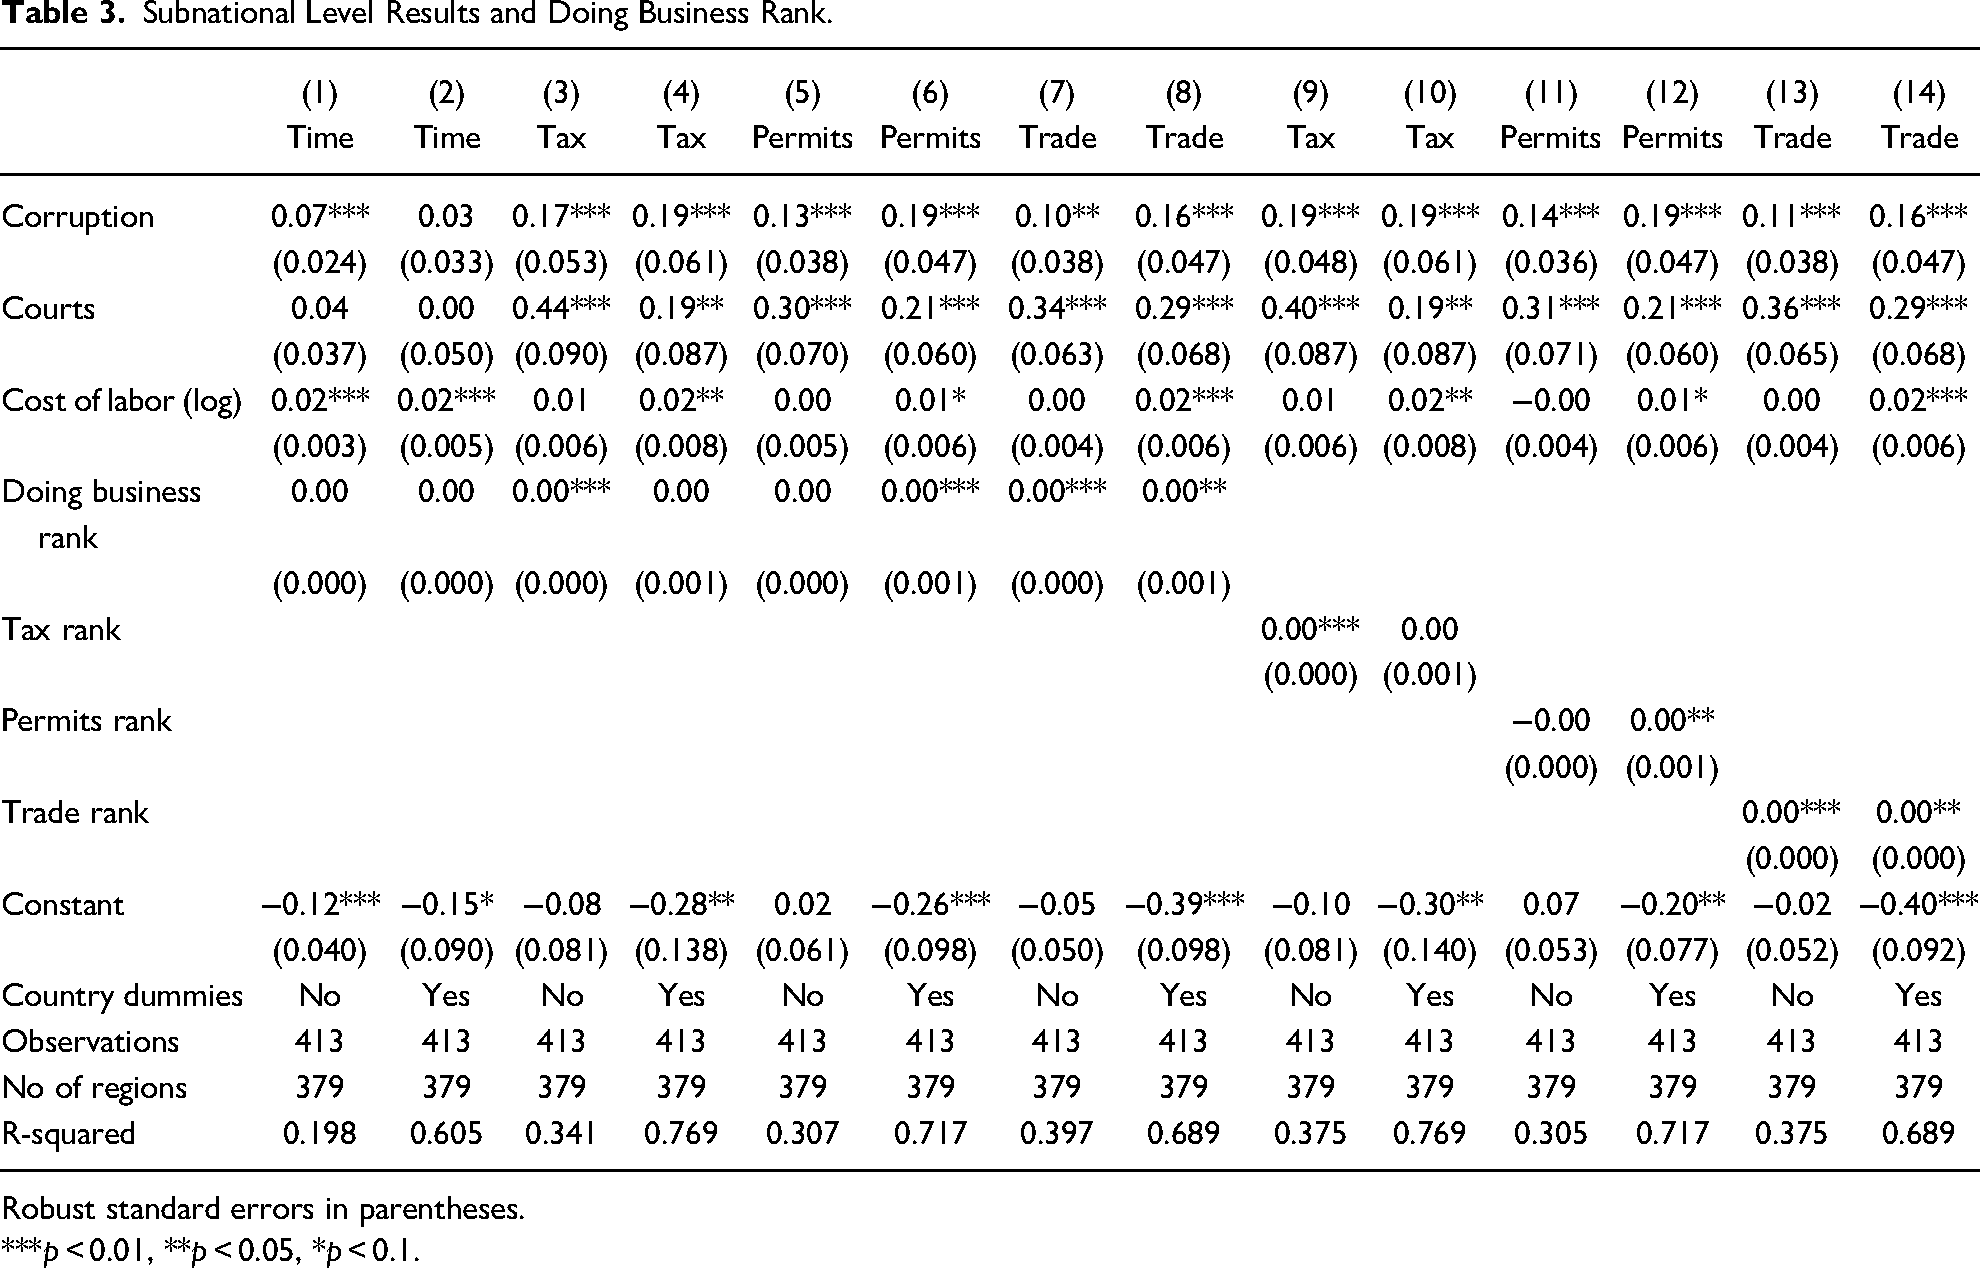
Robust standard errors in parentheses.
***p < 0.01, **p < 0.05, *p < 0.1.
Our findings regarding the association between corruption and the burden of regulation are robust to the inclusion of these variables and the size of the corruption coefficients is largely unchanged. However, the “way things ought to be done” as measured by Doing Business, is associated with the real burden of regulation in several specifications. In particular, models which center on the regulatory constraints regarding tax, permits, customs, and trade regulations exhibit some response to de jure regulation both in relation to the overall Doing Business rank and the more focused sub-rankings. Stricter regulations “on the books” matter for the real burden of regulation in some instances, but this does not undermine our earlier findings regarding corruption and the magnitude of the association is not very large.
Table 4 presents our findings from sub-samples defined by Doing Business and Rule of Law performance. The sub-samples relate to subnational units that are in countries that score in the bottom fiftieth and twenty-fifth percentiles of the Doing Business rank and Rule of Law rank. In these sub-samples, the association between the overall time spent dealing with regulation and corruption is statistically insignificant. The statistical association between our other regulatory constraint variables and the level of corruption is consistent, for the most part, with the findings presented in Table 3. In fact, the magnitude of the association between corruption and regulatory constraint is greater in most cases across tax, permits, and trade. While it is still possible that corruption facilitates growth by enabling the most efficient firms to avoid regulation, overall, our findings do not support the hypothesis that corruption greases the wheels for the average firm under regimes that display poor regulation or weak institutions. 7
Subnational Sample Splits by Doing Business Rank and Rule of Law.
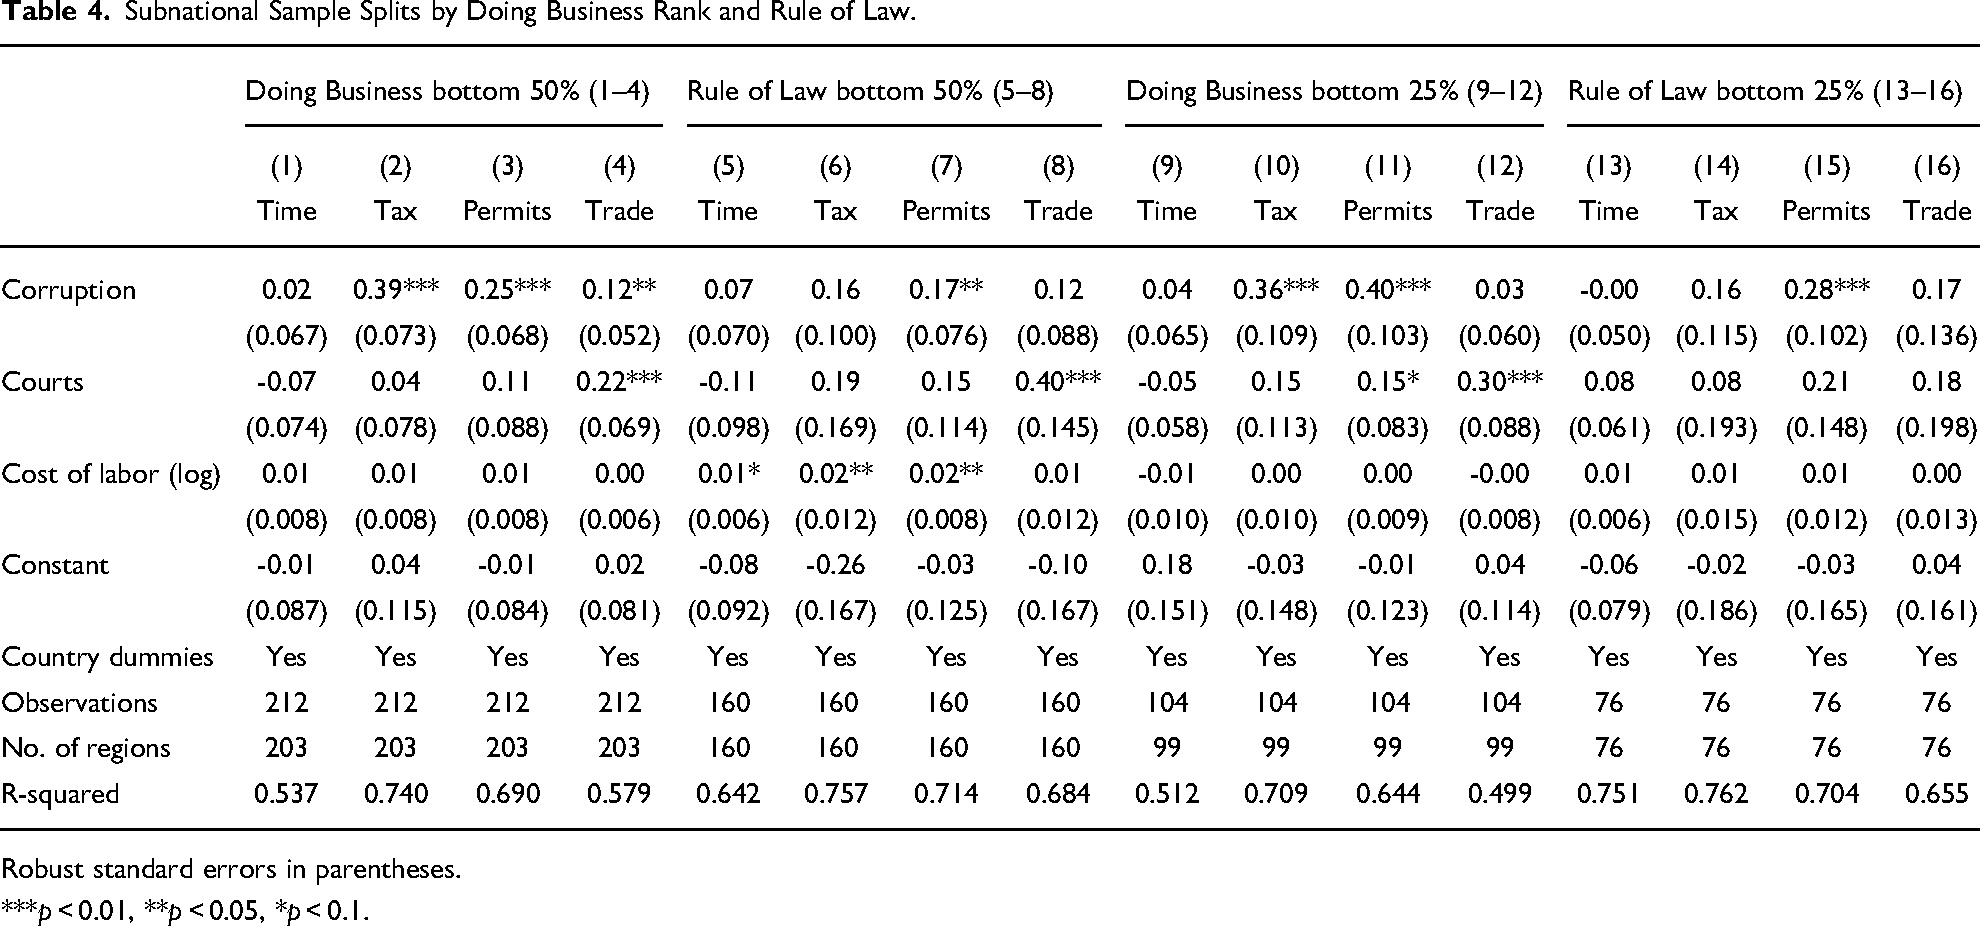
Robust standard errors in parentheses.
***p < 0.01, **p < 0.05, *p < 0.1.
Firm-level results
Thus far, our analysis has aggregated data from large and small firms in a variety of sectors. By examining our findings using firm-level data, we can control for these factors. We next ask if an individual firm faces a higher burden of regulation when it is in a more corrupt region. We include controls for the size of the firm in terms of the number of employees (small <20, medium 20–99, and large >99) and the sector the firm operates in as the burden of regulation faced by firms of different sizes and types could be different. We estimate ordinary least-squares models for the outcome capturing the percentage of senior management time spent dealing with regulation. For the other outcomes, we create dummy variables that take a value of one if the respondent answers that the issue is a major or very severe obstacle to the firm’s current operations and zero if it is seen as a moderate, minor, or no obstacle. In these cases, we estimate probit models and report the marginal effects. We control for unobserved country-level heterogeneity in all cases and also the subnational indicator of institutional quality used above—the local average view of the courts as a barrier to firm operations. Interest lies with the estimated relationship between a firm’s regulatory burden and the local environment in terms of corruption as measured by the share of firms that view corruption to be a major or very severe obstacle to their operations.
Table 5 presents the results of this firm-level analysis. We find that firms in more corrupt regions are more likely to consider tax, permits, and trade regulations to be a constraint. As was the case above, we find that the overall time spent dealing with regulation is not associated with corruption and that institutional quality, as proxied by the average view of the courts, is significant across the board. The findings from this exercise are in line with our results at the country and subnational levels. Corruption increases the extent to which regulation is a burden to firms. As this burden is not manifested via demands on senior management time, it is possible that this translates into firms facing additional staff needs and greater recourse to external professionals such as lawyers and accountants.
Firm Level Results.
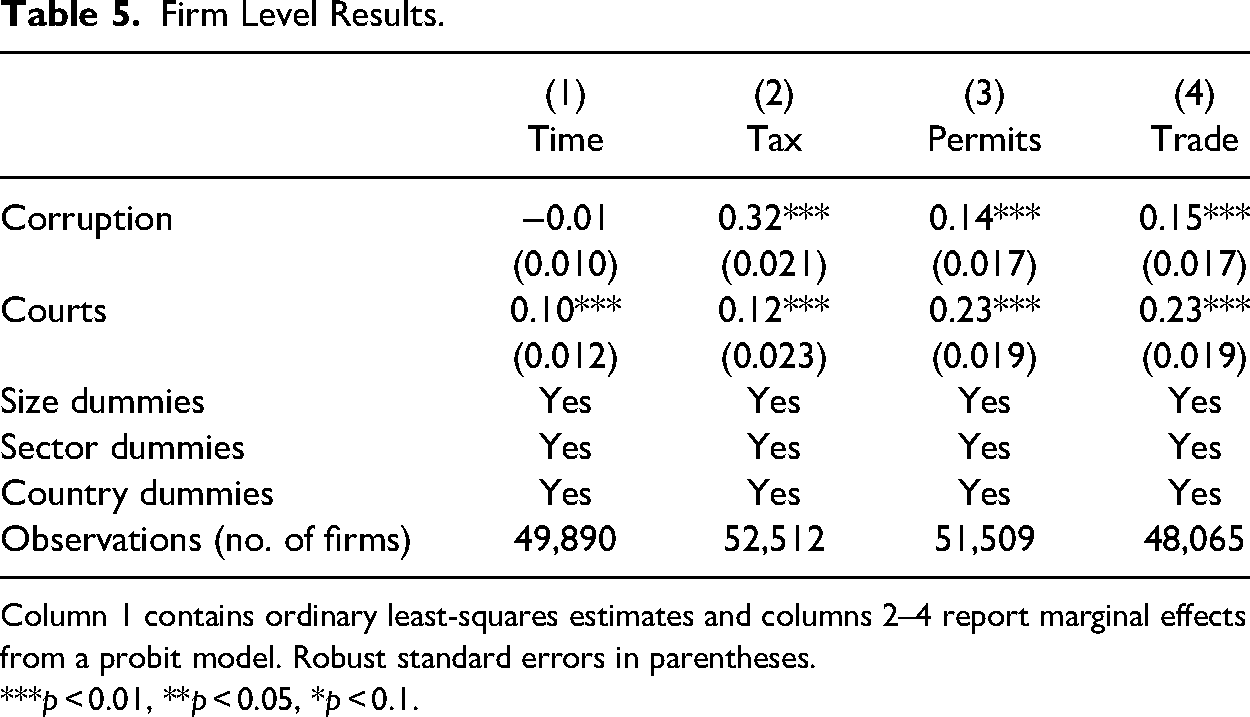
Column 1 contains ordinary least-squares estimates and columns 2–4 report marginal effects from a probit model. Robust standard errors in parentheses.
***p < 0.01, **p < 0.05, *p < 0.1.
Conclusions
We have presented evidence that regulation is likely to be a greater burden in more corrupt places. In these places, while business managers do not tend to report spending more time dealing with regulation, it is the case that a wide range of regulatory issues is seen as greater obstacles to their operations. These findings are robust to additional exogenous controls and alternative measures of the main variables. We extended our analysis to consider whether these associations hold at the subnational level, when controlling for de jure regulation, and in sub-samples characterized by weak regulations and low-quality institutions. Again, we find that corruption is associated with more burdensome regulation in almost all specifications. In summary, it seems that corruption does not ease the burden of regulation but probably makes it worse by imposing additional costs on businesses.
Our findings lend support to previous work which argues that misgovernance is partly responsible for low-quality regulation (Breen and Gillanders 2012; Djankov et al. 2002; Guriev 2004; ), as well as a large body of research that finds that corruption has a negative impact on many social and economic outcomes (Gupta, Davoodi and Alonso-Terme 2002). Our findings suggest that policymakers should implement institutional and policy reforms to address the quality of regulation. However, institutional reforms by themselves may not be enough to improve the business environment if corrupt officials find ways to work around them. Strategies to control corruption, in addition to top-down institutional reforms, are a path to an improved business environment. Such reforms include monetary incentives, information and transparency measures, and investment in technologies that increase the costs of corruption.
Finally, our results have implications for the hypothesis that corruption greases the wheels of an economy that suffers from poor institutions. While our results are not enough evidence to reject outright the hypothesis, they do lead us to question elements of that argument that link corruption to less burdensome regulation and thus greater productivity and growth. If corruption positively affects growth under weak governance, we suggest that it must do so through other channels than lifting the average regulatory burden on firms.
Footnotes
Declaration of Conflicting Interests
The authors declared no potential conflicts of interest with respect to the research, authorship, and/or publication of this article.
Funding
The authors received no financial support for the research, authorship, and/or publication of this article.
Notes
Author Biographies
Appendix
Summary Statistics.
| N | Mean | Min. | Max. | Standard deviation | |
|---|---|---|---|---|---|
| Country-level data | |||||
| Time | 223 | 8.39 | 0.10 | 33.60 | 6.38 |
| Tax | 225 | 24.41 | 0.40 | 76.70 | 14.30 |
| Permits | 225 | 14.99 | 0.10 | 48.50 | 9.31 |
| Trade | 224 | 16.83 | 0.00 | 58.40 | 10.56 |
| Corruption | 224 | 33.65 | 0.00 | 83.70 | 19.69 |
| Rule of Law | 220 | −0.32 | −1.95 | 1.65 | 0.74 |
| GDP per capita (log) | 222 | 7.39 | 4.55 | 10.30 | 1.22 |
| Area (log) | 220 | 11.80 | 5.56 | 16.61 | 2.00 |
| Control of Corruption | 220 | −0.31 | −1.62 | 1.86 | 0.71 |
| Subnational level data | |||||
| Time | 434 | 0.12 | 0.00 | 0.48 | 0.08 |
| Permits | 434 | 0.17 | 0.00 | 0.72 | 0.12 |
| Trade | 434 | 0.15 | 0.00 | 0.77 | 0.13 |
| Corruption | 434 | 0.38 | 0.00 | 0.92 | 0.22 |
| Courts | 423 | 0.19 | 0.00 | 0.80 | 0.15 |
| Cost of labor (log) | 434 | 12.60 | 8.37 | 17.01 | 1.59 |