
Abstract
How much redistribution does Uruguay accomplish through social spending and taxes? How progressive are revenue collection and social spending? What could be done to further increase redistribution and improve redistributional effectiveness? A standard fiscal incidence analysis shows that Uruguay achieves a nontrivial reduction in inequality and poverty when all taxes and transfers are combined. Direct taxes are progressive and indirect taxes are practically neutral. Social spending on direct transfers, contributory pensions, education, and health is quite progressive in absolute terms except for tertiary education, which is almost neutral in relative terms. Specific suggestions for improving the effectiveness are suggested.
Uruguay is an upper-middle-income country with a gross national income per capita of US$12,412 (2005 purchasing power parity [PPP]) in 2009 and a population of 3.3 million people (table 1). Primary government spending (total minus debt servicing) to gross domestic product (GDP) equaled 27.9 percent in 2009; Uruguay has a medium-sized government when compared with other countries in Latin America. With a long tradition of providing public services and social benefits, social spending (including contributory pensions) was equivalent to 21.7 percent of GDP.
Social Spending by Component, Number of Beneficiaries, and Monthly Mean Transfer in 2009.
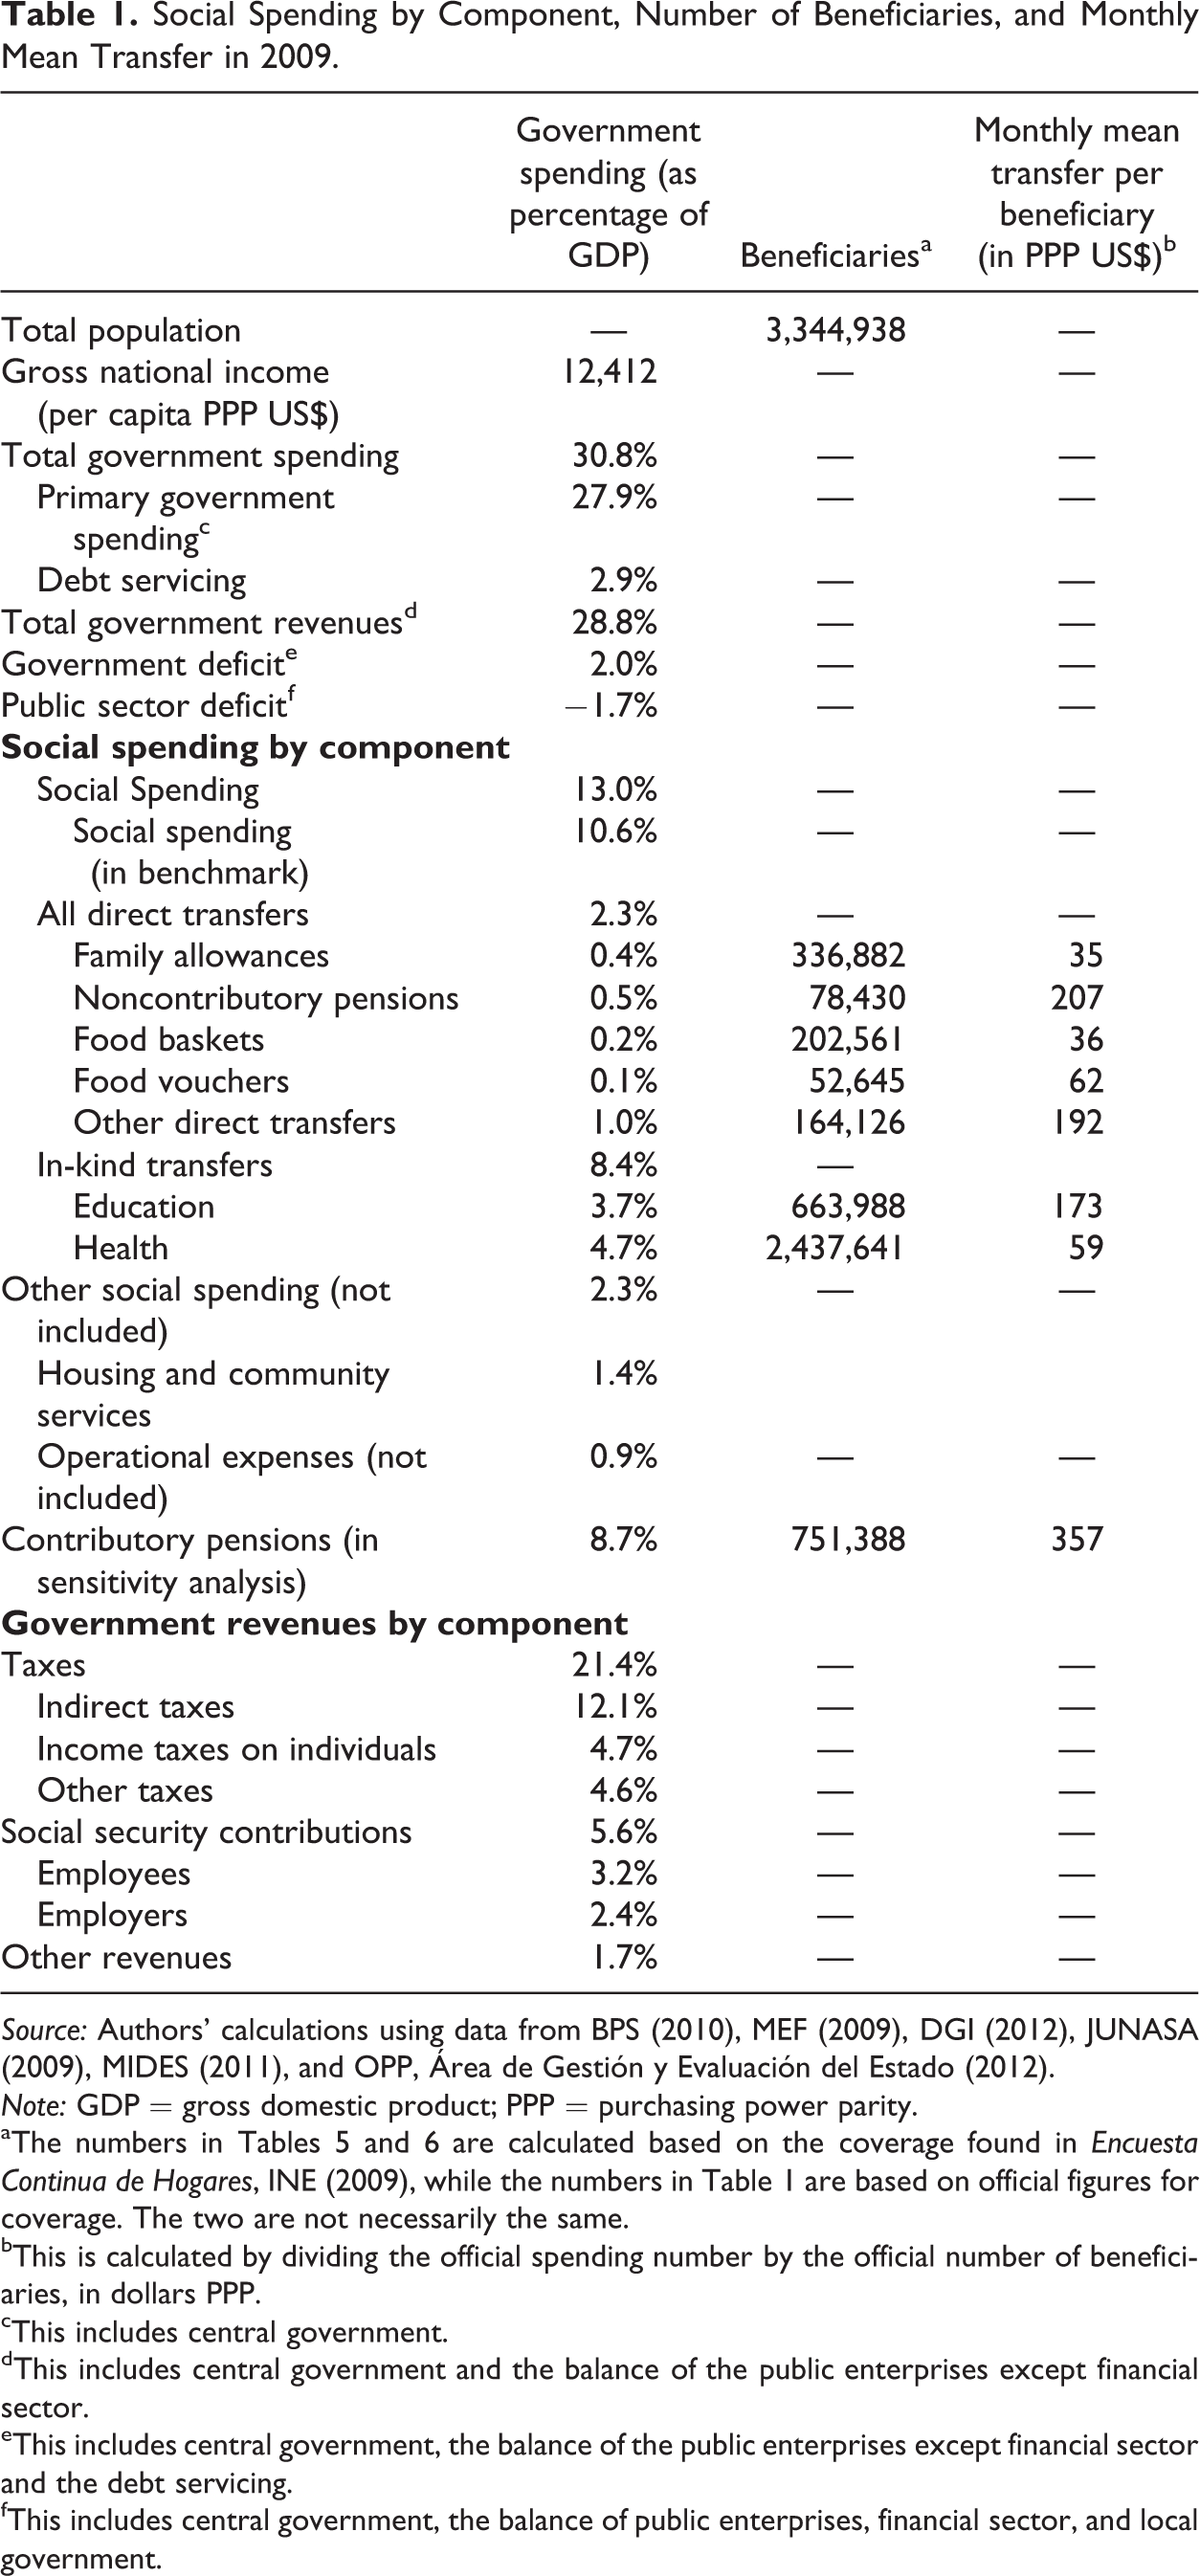
Source: Authors’ calculations using data from BPS (2010), MEF (2009), DGI (2012), JUNASA (2009), MIDES (2011), and OPP, Área de Gestión y Evaluación del Estado (2012).
Note: GDP = gross domestic product; PPP = purchasing power parity.
aThe numbers in Tables 5 and 6 are calculated based on the coverage found in Encuesta Continua de Hogares, INE (2009), while the numbers in Table 1 are based on official figures for coverage. The two are not necessarily the same.
bThis is calculated by dividing the official spending number by the official number of beneficiaries, in dollars PPP.
cThis includes central government.
dThis includes central government and the balance of the public enterprises except financial sector.
eThis includes central government, the balance of the public enterprises except financial sector and the debt servicing.
fThis includes central government, the balance of public enterprises, financial sector, and local government.
How much redistribution does Uruguay accomplish through social spending and taxes? How progressive are revenue collection and social spending? What could be done to further increase redistribution and improve redistributional effectiveness? Using the Encuesta Continua de Hogares (2009)—hereafter ECH—and the Encuesta de Gastos e Ingresos de los Hogares (2006)—hereafter EGIH—collected by the Instituto Nacional de Estadística (INE) of Uruguay, and following the general methodology discussed in detail by Lustig, Pessino, and Scott (2014), we analyze the impact of social spending on inequality and poverty. We define a benchmark scenario in which contributory pensions are under market income and a sensitivity analysis in which they are considered a government transfer. This analysis does not incorporate behavioral, life cycle, or general equilibrium effects nor does it look into the macroeconomic sustainability of taxation and social spending patterns. Nonetheless, this study is one of the most detailed incidence analyses for Uruguay to date.
Social Spending and Taxes in Uruguay 1
Social Spending
We define social spending as direct transfers and in-kind transfers. Direct transfers include family allowances, noncontributory pensions, other (cash) transfers, and food transfers. In-kind transfers include education and health benefits. In the sensitivity analysis, social spending also includes contributory pensions.
Direct Transfers
Noncontributory pensions (Pensión a la vejez e invalidez)
The noncontributory pensions program, in place since 1919, is available to low-income adults older than sixty-four years of age (over sixty-nine years of age prior to July 2009) and disabled individuals who are not eligible for benefits from the contributory system. The noncontributory pension program provides monetary transfers of lesser value than those in the contributory system. As shown in table 1, the average contributory pension is US$357 PPP per month and the average noncontributory pension is US$207 per month. In 2009, 92 percent of individuals older than sixty-four years were covered by either a contributory (751,388 individuals) or a noncontributory pension (78,430 individuals). Note that although approximately one-third of workers in the last ten years have not contributed to the formal social security system, the vast majority of the elderly receive contributory pensions. This is because until 1996, there were no formal records of contributions; therefore, the elderly were eligible to receive a contributory pension by simply presenting a testimony that they had contributed enough to be entitled to the minimum. In this context, the noncontributory pensions were equivalent to 0.5 percent of GDP in 2009.
Family allowances program (Asignaciones Familiares)
In 1999, within a context of increased poverty, the coverage of the family allowances program (which until that time had been available only to those who were social security system contributors) was expanded to include noncontributing families with an income below US$100 per month, and a female head of household or an unemployed member. In 2004, it was expanded to cover all low-income families. The program was a means-tested conditional cash transfer program whose transfer was conditional on school attendance and periodic health checkups for children. The beneficiaries were children under nineteen years of age who were attending school, as well as those who had not yet entered elementary school. In 2008, a new, targeted, noncontributory program was created. The target population remained the same, but the new program has increased benefits and wider coverage. The income threshold to be eligible is higher, but other characteristics that help identify the poor (such as type of housing) were added to determine eligibility. The benefit increases with the number of children, but at a decreasing rate, and is greater for a child attending secondary school than for one studying in an elementary school. 2 In 2009, there were 336,882 beneficiaries (41 percent of children of eligible age) with an average monthly transfer of US$35 PPP. The program’s budget was equal to 0.4 percent of GDP in 2009.
Food programs
There are food assistance benefits that are administered by different agencies. Without considering the food assistance provided in schools, these programs account for 0.3 percent of GDP. The most traditional food assistance programs offer free food baskets (Canastas alimentarias) and dining room service (Comedores) to those in greatest need. In 2009, the number of beneficiaries was 202,561 and the monthly average transfer was US$36 PPP. As of 2006, there is also a means-tested food voucher (Tarjeta Uruguay Social) targeted to households with children under eighteen, which allows households to obtain food and hygiene products, free of charge. 3 In 2009, the number of beneficiaries was 52,645 and the monthly average transfer was US$62 PPP.
Other direct transfers
The social security system administers a set of programs directed to its contributors: unemployment insurance, maternity and family benefits, disability coverage, and sickness allowances. These programs, hereafter called other direct transfers, have low requirements in terms of length of time of contribution and are either means tested or designed to smooth the impact of idiosyncratic shocks such as unemployment. Other direct transfers were equivalent to 1.0 percent of GDP in 2009.
In-kind Transfers
Health
Public expenditure on health care (4.7 percent of GDP) is comprised of two programs. The first is direct public health care for people living in poverty (2.4 percent of GDP). It is financed with general government revenues. The second, the National Health Insurance system, launched in 2007 (2.3 percent of GDP) and subsidizes private health care for workers, their spouses and dependent children younger than eighteen. It currently covers some inactive workers, and the intention for the future is to attain universal coverage. The National Health Insurance is financed by a specific tax described later.
Education
Public education spending is 3.7 percent of GDP. At all levels of education, there are two systems: a free, public education system and a private system. The public education system has the larger enrollment and accounts for 85 percent of elementary school enrollment, 82 percent of secondary school enrollment, and 83 percent of postsecondary enrollment. At present, preschool (five-year-olds), elementary school, and the first three years of secondary school are mandatory. In the educational component of social spending, we also include a day care program (Centro de Atención Integral a la Familia) whose target beneficiaries are poor children up to three years of age.
Contributory Pensions
The largest component of social spending is the contributory pensions program (8.7 percent of GDP in 2009), which includes the retirement and the survivors’ pension. The program was created toward the end of the nineteenth century for workers in specific sectors. During the twentieth century, coverage was extended to all workers, including the self-employed. Currently, the system is organized on a pay-as-you-go pillar administered by the public sector and an individual capitalization fund pillar administered by a private company selected by the contributor. Though contributions are compulsory for all workers, 32 percent of workers did not contribute to social security (ECH and INE) in 2009. The minimum age for retirement is sixty years (sixty-four years prior to July 2009) with a minimum of thirty years of contributions. In the benchmark scenario, contributory pensions are included under market income. In the sensitivity analysis, they are included under government transfers.
Other Social Spending
This analysis does not include the operational expenses of the social security system (0.9 percent of GDP) or housing and community services (1.4 percent of GDP) because we cannot identify the specific benefits allocated to each household.
Taxes
Of the taxes levied by the government, 56 percent are indirect taxes, with the value-added tax (VAT) accounting for a predominant share.
Direct Taxes
Direct taxes on personal income account for 22 percent of the government’s tax revenues. They include a tax on personal income, created in 2007, that treats income derived from work, pensions, and capital separately. Income derived from wages and pensions is taxed at progressive rates, but income from capital is taxed at a flat rate. Deductions are allowed for all levels and are basically associated with family-related responsibilities.
Direct taxes also include a specific tax that finances the National Health Insurance system. It depends on the beneficiary’s level of earnings and on whether the worker is the sole beneficiary, or if his or her family is also covered. Finally, there is a small tax on private labor earnings that support a Labor Retraining Fund.
Indirect Taxes
The VAT’s base rate is 22 percent. Goods and services considered basic necessities are exempt (e.g., education and milk), or are taxed at a rate of 10 percent (e.g., several types of food, such as meat and bread and health care items). In addition, there are taxes on specific products such as fuel, alcoholic beverages, tobacco, automobiles, and various other articles. Indirect taxes account for 12.1 percent of GDP, of which 7 percent is paid by households and the rest by firms.
Other Taxes
The remaining 22 percent of total tax revenues come from taxes on business revenues and on the property of individuals and legal entities. These taxes are not included.
Data and Methodological Highlights
The incidence analysis is carried out using Uruguay’s household survey (ECH). The survey is collected by the National Statistics Institute and has national coverage. 4 It reports the individual characteristics, labor activities and income net of taxes, and contributions of all household members by source including government cash transfers.
We use five income concepts in our incidence analyses: market, net market, disposable, post-fiscal, and final income. 5 Market income 6 is total current income before direct taxes, 7 equal to the sum of gross (pretax) wages and salaries in the formal and informal sectors (also known as earned income); income from capital (dividends, interest, profits, rents, etc.) in the formal and informal sectors (excludes capital gains and gifts); auto-consumption; imputed rent for owner-occupied housing; private transfers (remittances and other private transfers such as alimony); and retirement pensions from the contributory social security system. Net market income equals market income minus direct personal income taxes on all income sources (included in market income) that are subject to taxation and all contributions to social security except for the portion going toward pensions. 8 Disposable income is equal to the sum of net market income plus direct government transfers (mainly cash transfers but can include food transfers). Post-fiscal income is defined as disposable income plus indirect subsidies plus indirect taxes (e.g., VAT, sales tax, etc.). Final income is defined as post-fiscal income plus government transfers in the form of free or subsidized services in education, health, and housing minus co-payments or user fees. A detailed description of how each income concept is constructed in Uruguay is available upon request. 9
The survey does not include the amount of taxes and contributions paid. Thus, we use the schedule of contributions to the social security system and the schedule of direct personal income taxes in order to impute them. As the survey reports whether the worker contributes to the social security system, we use this information to perform the calculations. We assume that workers who do not pay the contributions also do not pay direct taxes; for details, see Bucheli et al. (2014). Note that these calculations mean that direct taxes and contributions are entirely paid by workers. 10
The ECH reports pensions after taxes, so we calculate the taxes on pensions. In addition, the ECH inquires about public program coverage: family allowances, school attendance by education level, type of health care, and access to food benefits. In the case of family allowances, we assign the benefit according to the formula. For the in-kind benefits, we assign a benefit equivalent to the ratio spending/beneficiaries, calculated with the administrative registers. The average benefit for each program is reported in table 1, though in education and health we assign the average benefit by subprogram (Bucheli et al. 2014). These benefits are not scaled up.
In order to estimate the indirect taxes paid by each household, we use the EGIH collected by INE between November 2005 and October 2006. We identify fifty-two consumption baskets using two criteria: a high substitutability and the same tax rate. For each basket, we run a multiple regression with household spending on each basket of goods as the dependent variable and a set of independent variables that are available both in EGIH and in ECH, such as the household income, the size of the household, the average years of schooling of the adults of the household, a deprivation index, the total hours worked in the labor market by all the members of the household, the other direct transfers (equivalent to 1.0 percent of GDP in 2009) participation of age-groups by sex in the household (we consider teenage groups), and a set of regional dummies. The first five variables are introduced as a polynomial of degree three in order to have a more parsimonious functional form. Using the coefficients from these regressions, we estimate the consumption on each of the fifty-two baskets for the ECH. 11 We then estimate the indirect taxes assuming no evasion. 12
Social Spending, Taxes, and Income Redistribution in Uruguay: Main Results
Impact on Inequality and Poverty
Table 2 presents the Gini coefficient and headcount ratio (using the international poverty lines of US$2.50 PPP and US$4 PPP per day and the national moderate poverty lines, which is US$7.8 PPP in 2009) for the benchmark scenario and sensitivity analysis.
Gini and Headcount Index for Different Income Concepts.
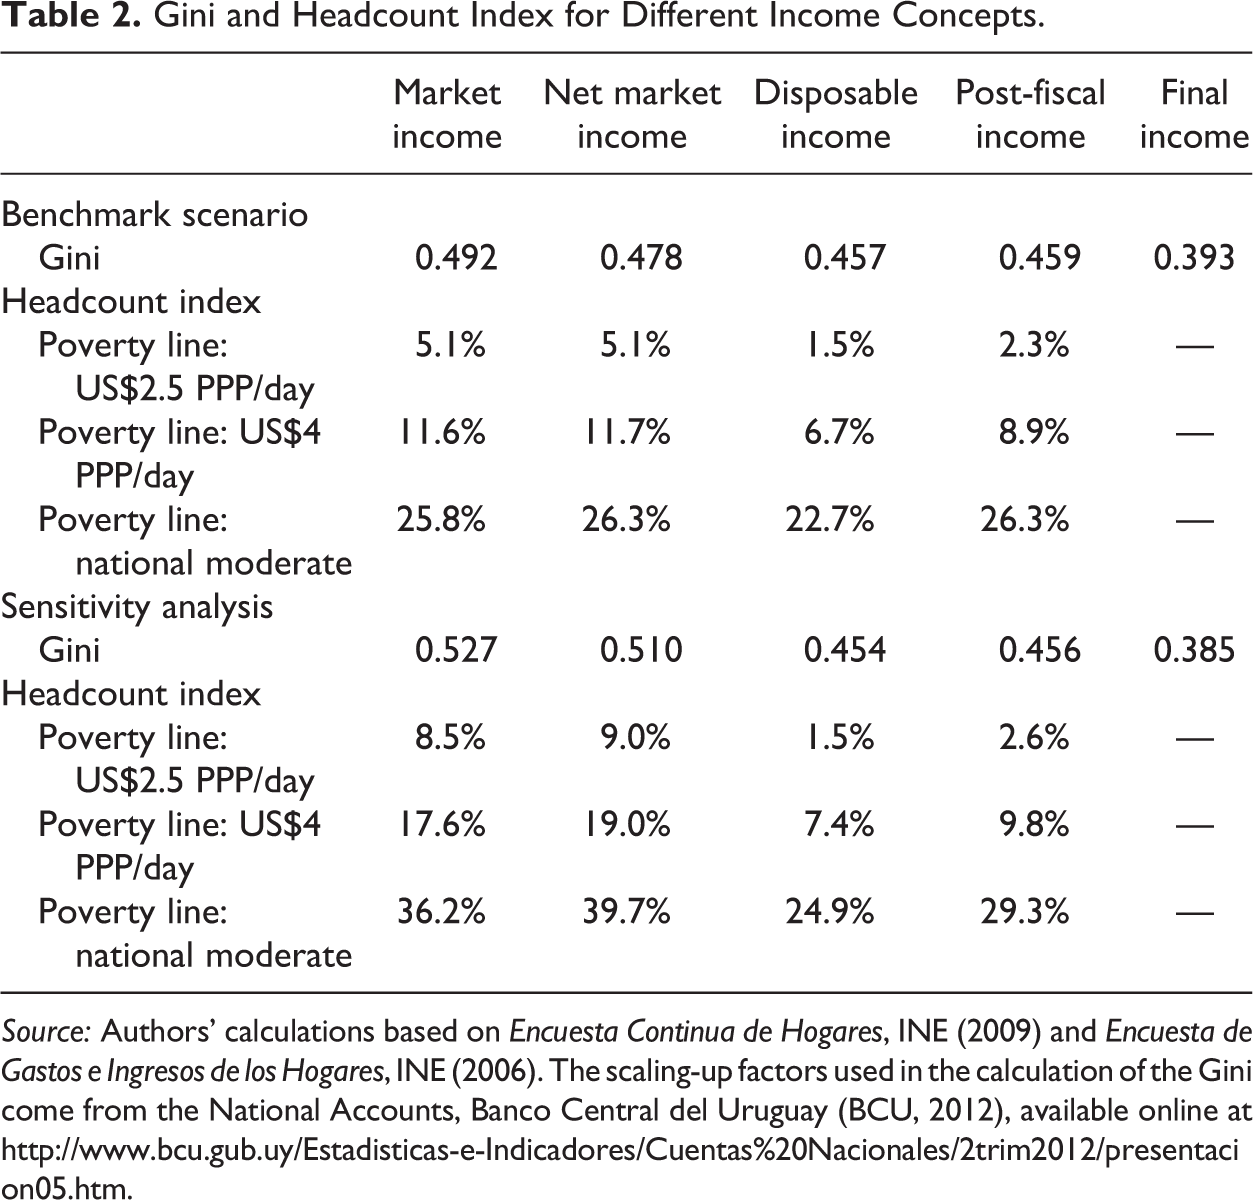
Source: Authors’ calculations based on Encuesta Continua de Hogares, INE (2009) and Encuesta de Gastos e Ingresos de los Hogares, INE (2006). The scaling-up factors used in the calculation of the Gini come from the National Accounts, Banco Central del Uruguay (BCU, 2012), available online at http://www.bcu.gub.uy/Estadisticas-e-Indicadores/Cuentas%20Nacionales/2trim2012/presentacion05.htm.
The market income Gini is higher than the net market income Gini indicating that direct taxes have an equalizing effect. Direct transfers lower inequality and poverty: the disposable income Gini (with respect to the market income Gini) declines by 7 percent, and the disposable income extreme poverty headcount ratio by 71 percent. Indirect taxes leave the Gini practically unchanged (with respect to disposable income Gini) and, as expected, increase extreme and moderate poverty. In-kind transfers in education and health have the largest effect in terms of lowering inequality: the final income Gini is 20 percent lower than the market income Gini. The trends are the same in the sensitivity analysis. It is worth noting that the Gini coefficient and headcount ratio of market income when contributory pensions are considered part of market income (benchmark scenario) are lower than when pensions are classified as a government transfer (sensitivity analysis). This means that contributory pensions have an important equalizing and poverty-reducing effect. Previous studies about the redistributive effect of social spending (Llambí et al. 2009) and taxes (Amarante et al. 2011) obtain similar qualitative results.
Redistributive Effectiveness
In table 3, we present the reductions in inequality and poverty due to social spending by program and the effectiveness indicators for the benchmark scenario. The effectiveness indicator is defined as the effect on inequality (or on poverty) of the transfers being analyzed divided by their relative size (as a percentage of GDP).
Gini and Headcount Index Variations and Redistributive Effectiveness—Benchmark Analysis.
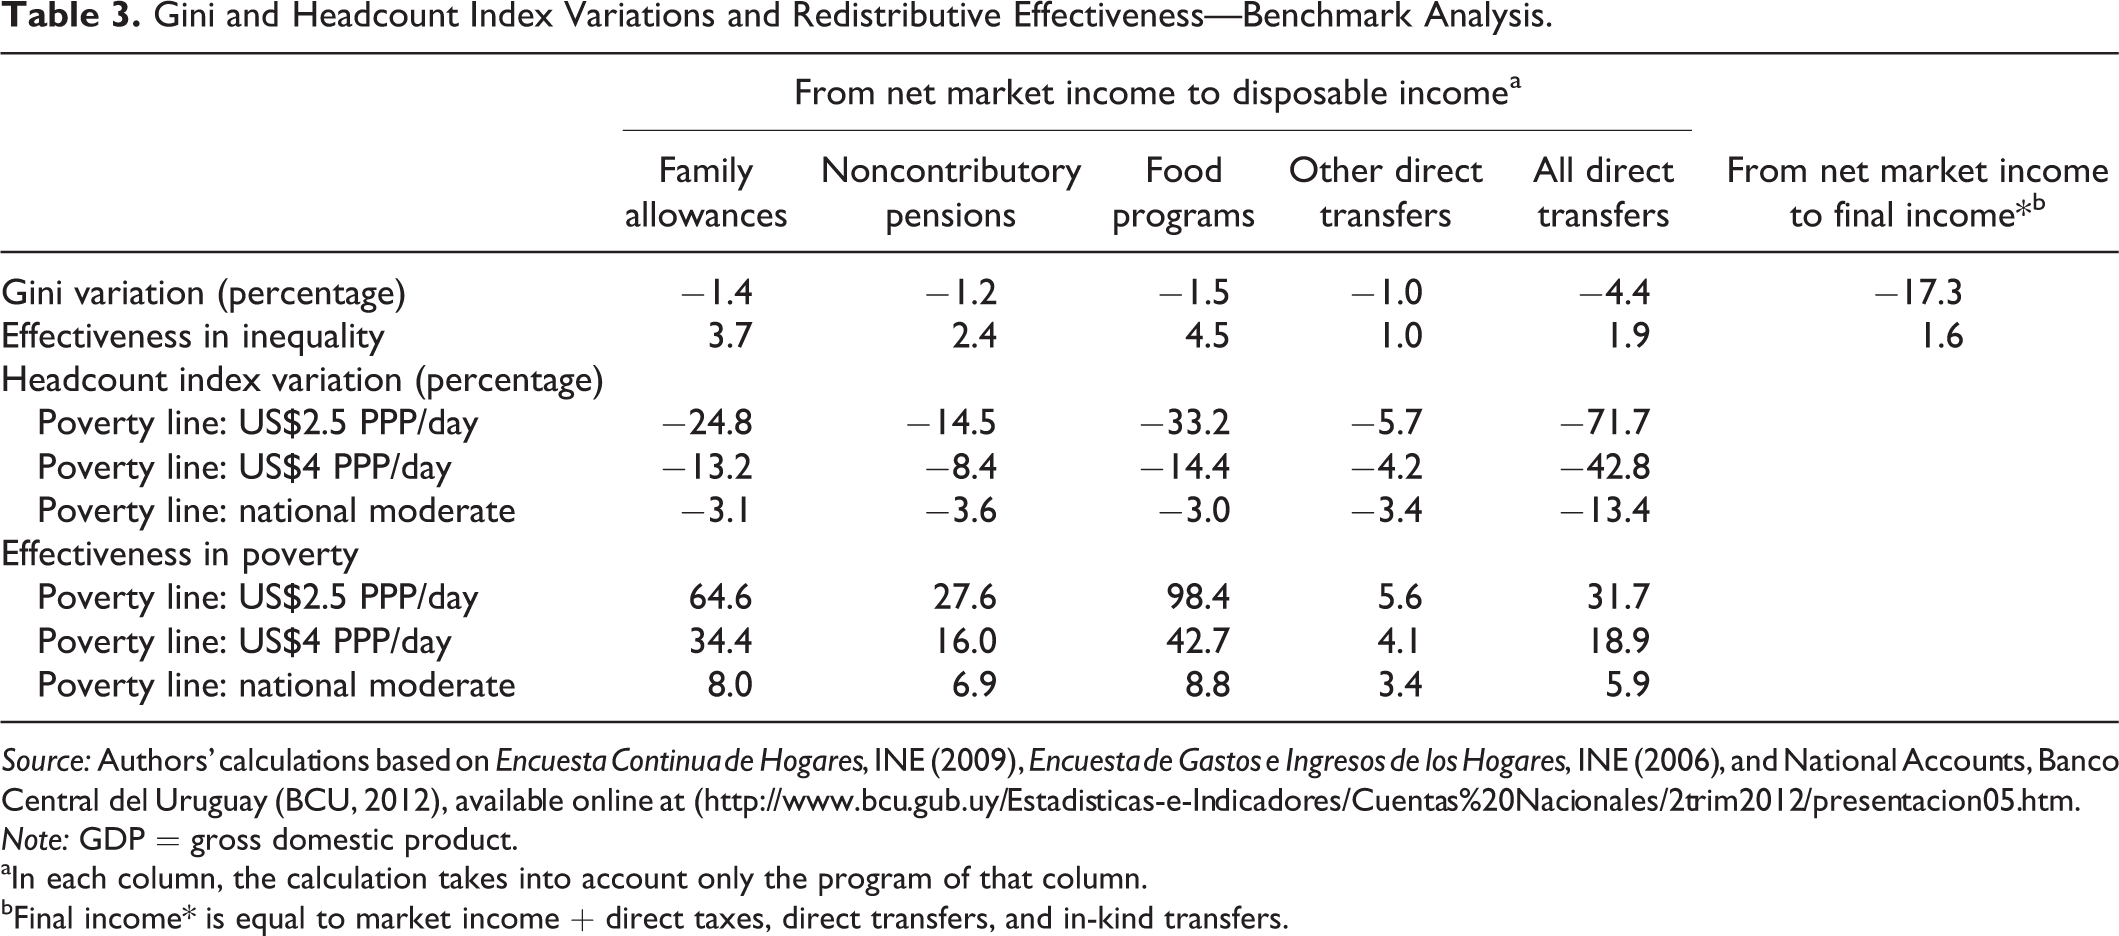
Source: Authors’ calculations based on Encuesta Continua de Hogares, INE (2009), Encuesta de Gastos e Ingresos de los Hogares, INE (2006), and National Accounts, Banco Central del Uruguay (BCU, 2012), available online at (http://www.bcu.gub.uy/Estadisticas-e-Indicadores/Cuentas%20Nacionales/2trim2012/presentacion05.htm.
Note: GDP = gross domestic product.
aIn each column, the calculation takes into account only the program of that column.
bFinal income* is equal to market income + direct taxes, direct transfers, and in-kind transfers.
Direct transfers reduce the Gini index 4.4 percent. All of the programs contribute to this reduction and have a similar effect. The effectiveness indicator is 1.9, and once again, all of the programs contribute to this result. The combination of direct and in-kind transfers reduces the Gini index by 17.3 percent. The effectiveness indicator is 1.6. These results suggest that the redistributive effectiveness of direct transfers is slightly higher than the effectiveness of in-kind transfers.
Direct transfers also reduce poverty. The lower the poverty line, the higher the reduction of the headcount ratio and the higher the effectiveness indicator. Thus, direct transfers are particularly important in reducing extreme poverty and are more effective in reducing extreme poverty (rather than moderate poverty). This reduction is due to the combination of the four programs included in direct transfers. However, family allowances and food have the highest impact on the reduction of extreme poverty.
Incidence Analysis
In order to perform the incidence analysis, we calculate the ratio of benefits to market income by market income deciles. As shown in table 4, the incidence of direct taxes and social spending follows an income equalizing pattern: it rises and declines with income, respectively. All of the social programs follow this pattern. Indirect taxes, in contrast, show the opposite, and the two poorest deciles get hit the hardest.
Incidence of Taxes and Transfers—Benchmark Analysis (percentages).
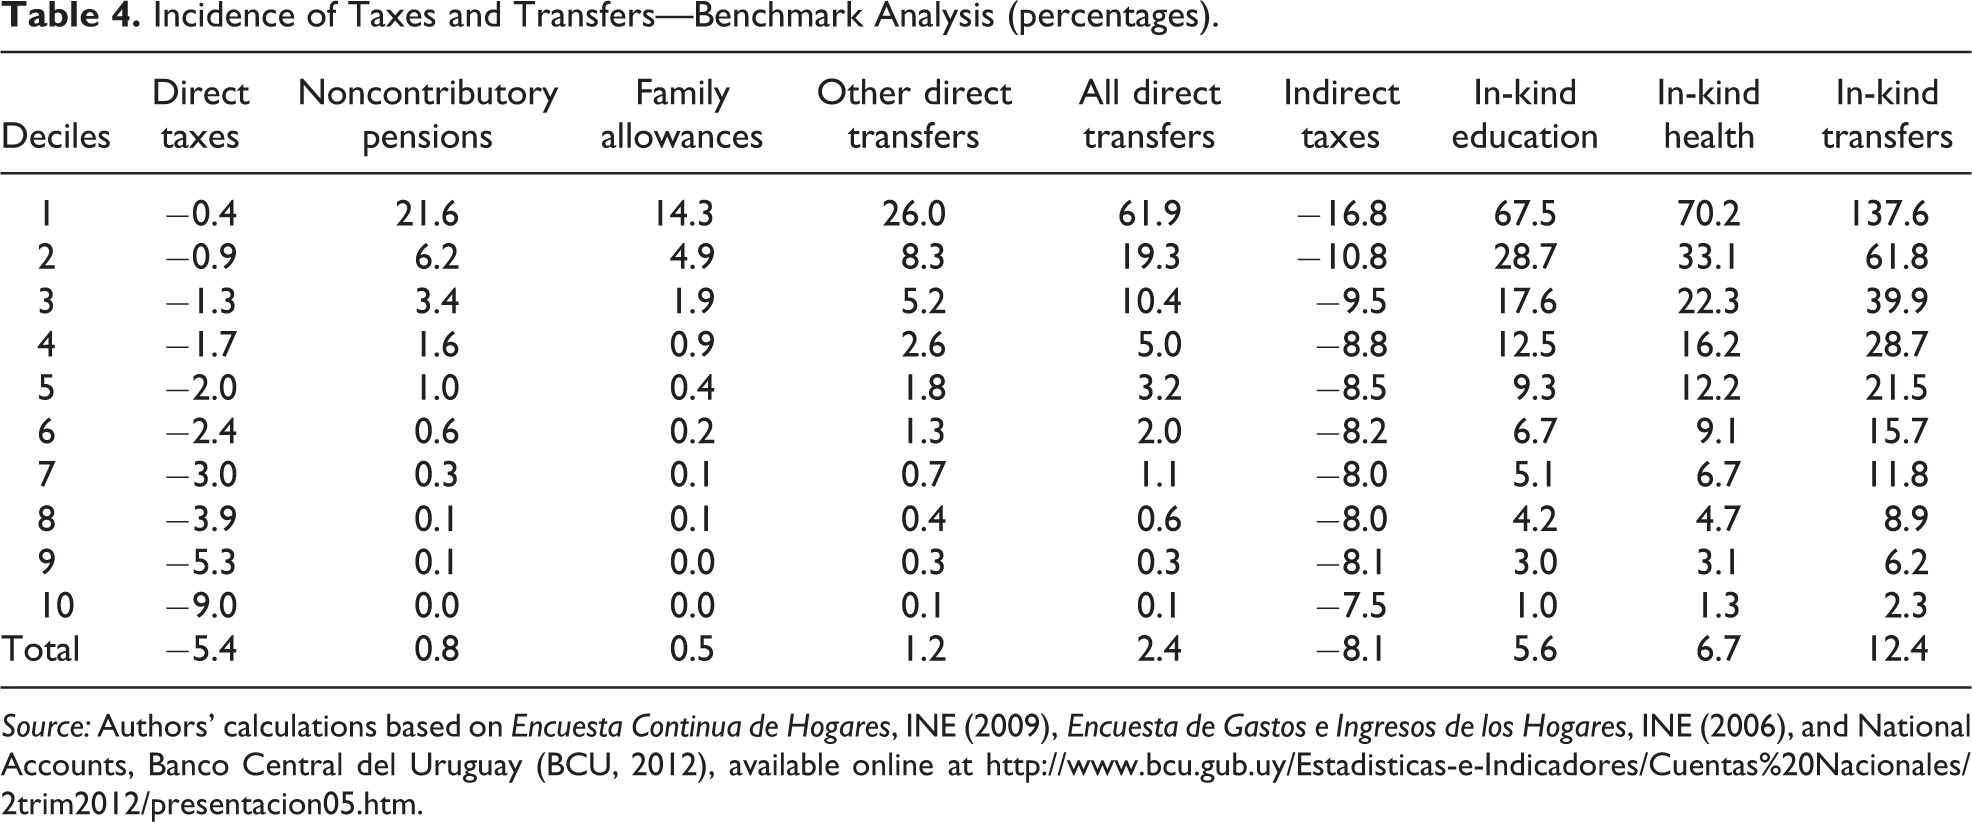
Source: Authors’ calculations based on Encuesta Continua de Hogares, INE (2009), Encuesta de Gastos e Ingresos de los Hogares, INE (2006), and National Accounts, Banco Central del Uruguay (BCU, 2012), available online at http://www.bcu.gub.uy/Estadisticas-e-Indicadores/Cuentas%20Nacionales/2trim2012/presentacion05.htm.
The combination of benefits and taxes increases the income of the bottom deciles but pushes down the income of the highest deciles, as shown in figure 1. When contributory pensions are considered a government transfer (the sensitivity analysis), the effect of social spending is much higher for the bottom deciles. This is because contributory pensions go to households whose market income in the sensitivity analysis case (which does not include income from contributory pensions) is low or negligible.
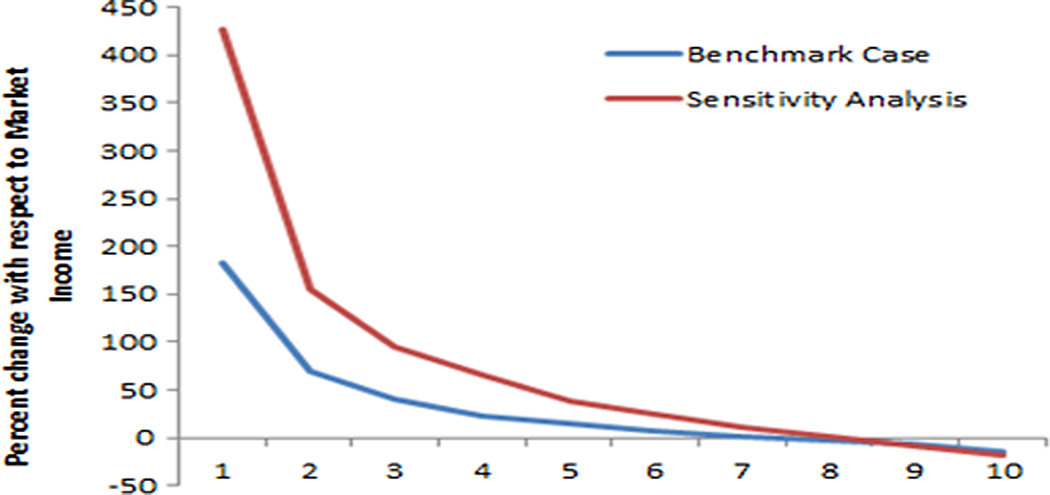
Changes between market income and final income by decile—benchmark and sensitivity analysis.
Progressivity
The concentration coefficient for social spending indicates that social spending is progressive in absolute terms. Figure 2 presents the concentration coefficient for all of the programs sorted by progressiveness. The only components of social spending that are not progressive in absolute terms are spending on secondary and tertiary education. No components are outright regressive (or unequalizing), which can be seen by the fact that no program has a concentration coefficient greater than does the market income Gini. However, it is worth noting that tertiary education in Uruguay is almost neutral in relative terms. Its concentration coefficient, at 0.47, is quite close to the market income Gini of 0.49.
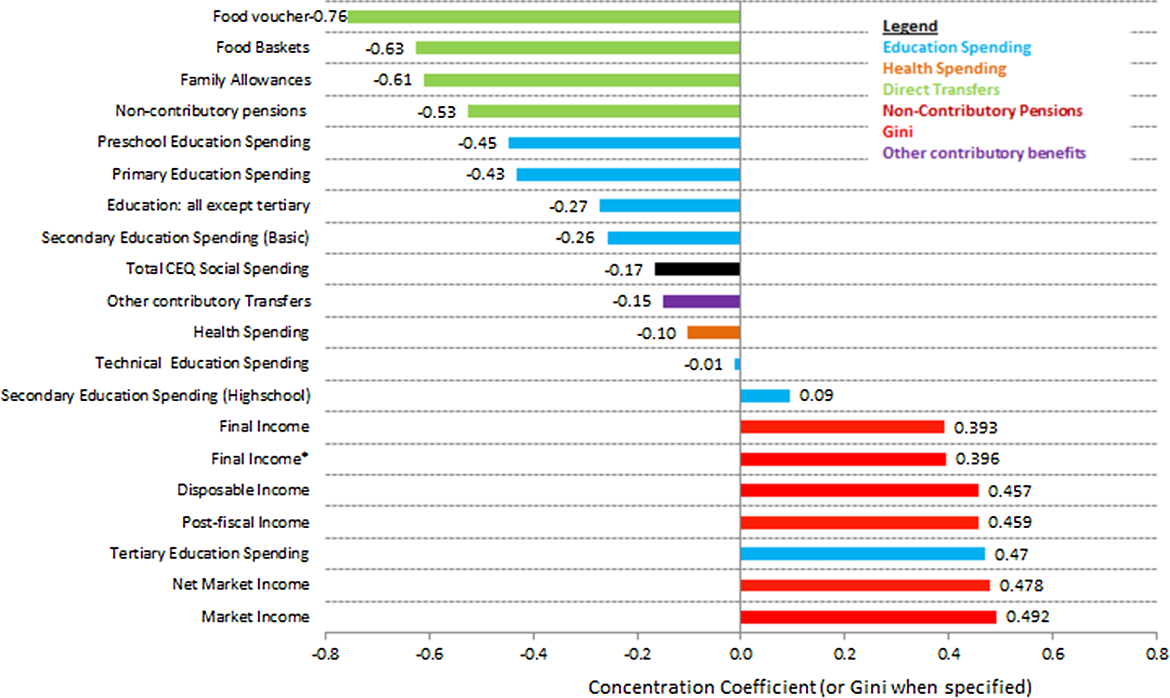
Concentration coefficient by spending category and for total social spending.
The results for tertiary education may be explained by the persistence of the high dropout rate in high school. Indeed, several studies show that the drop-out rate has remained high for the last two decades affecting mainly people at the bottom of the distribution (Bucheli and Casacuberta 2000; Casacuberta and Bucheli 2010). Consequently, the access to tertiary education is lower than in other Latin American countries with similar human development such as Chile, Argentina, and Costa Rica (Economic Commission for Latin America and the Caribbean [ECLAC] 2010). Some additional statistics give an idea of the new generation’s educational capital. In 2009, an estimated 31 percent of the population between twenty-one and twenty-five years of age had not completed the mandatory nine years of schooling; 45 percent had completed between nine and twelve years of schooling, and 24 percent had at least initiated a program of postsecondary education. In this context, people of low socioeconomic background have a low probability of accessing tertiary education (Boado and Fernández 2010; De Armas and Retamoso 2010). Thus, in spite of the high participation of public institutions in enrollment, there is almost neutral spending on tertiary education.
Enhancing the Redistributive Capacity
Due to direct transfers, extreme poverty is reduced quite significantly, the use of resources is effective in this respect, and most of the government’s social spending is progressive in absolute terms. Could these impacts be increased? In order to answer this question, we consider three indicators presented in tables 5 and 6: the per capita benefit for the extreme and moderate poor, the coverage of direct transfers among the poor, and the percentage of benefits from direct transfers going to the nonpoor. To define extreme and moderate poverty, we use the international lines of US$2.50 PPP and US$4 PPP per day.
Per Capita Income and per Beneficiary Direct Transfers and Coverage by Market Incomea Group—Benchmark Analysis.
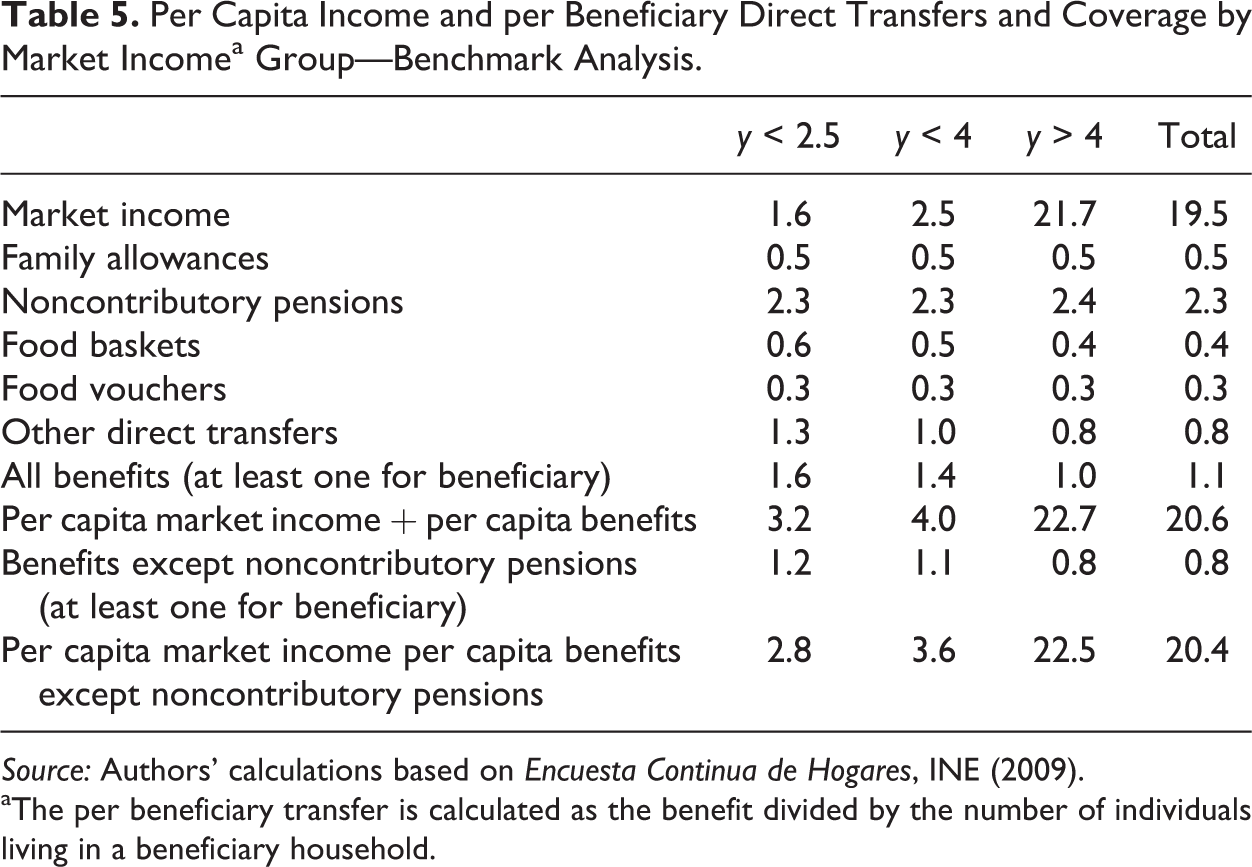
Source: Authors’ calculations based on Encuesta Continua de Hogares, INE (2009).
aThe per beneficiary transfer is calculated as the benefit divided by the number of individuals living in a beneficiary household.
Program Coverage by Market Income Group and Distribution of Benefits—Benchmark Analysis.
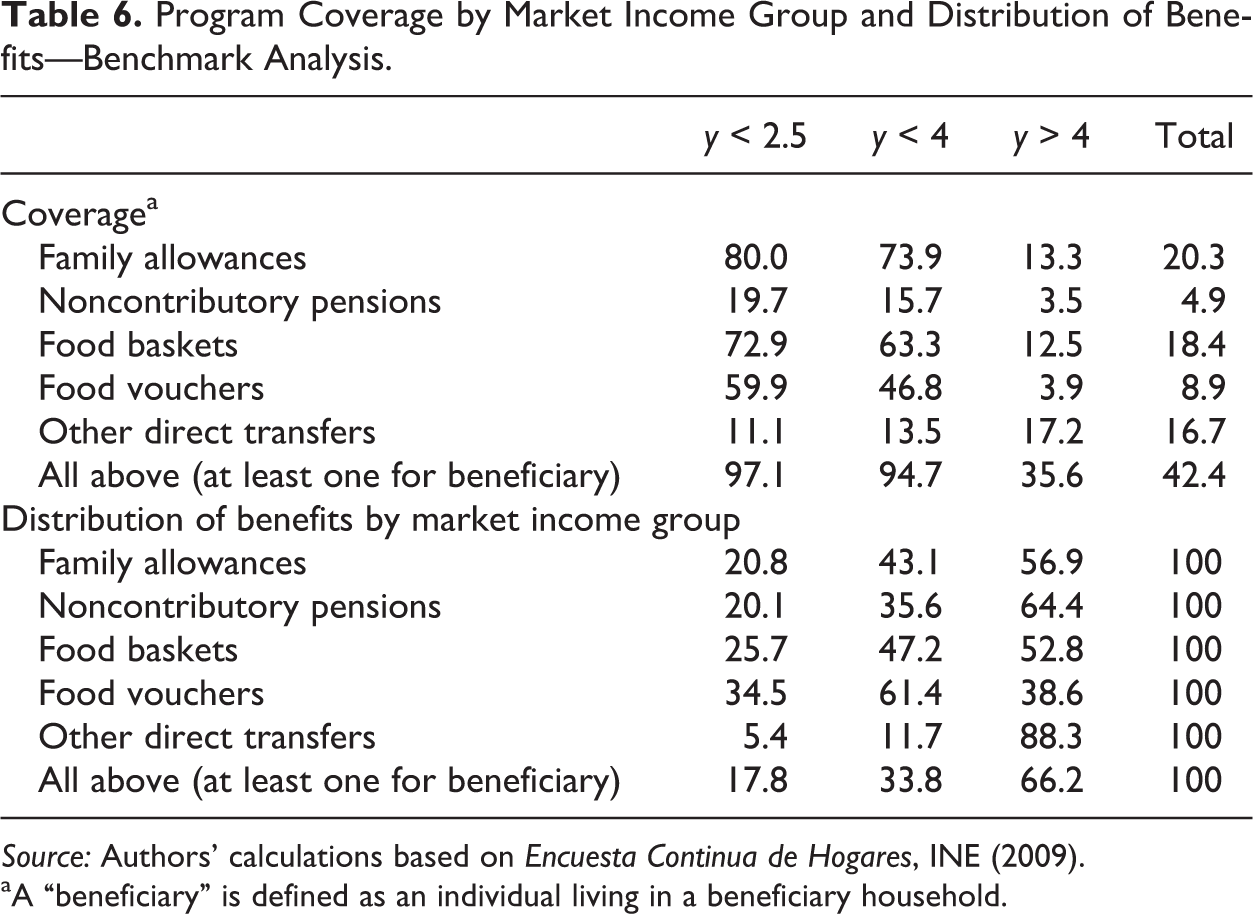
Source: Authors’ calculations based on Encuesta Continua de Hogares, INE (2009).
aA “beneficiary” is defined as an individual living in a beneficiary household.
In table 5, we report the per capita income market and the average transfer (among beneficiary households) for different market income groups. As one can see, the sum of per capita income and average transfer is US$3.2 PPP for the group in extreme poverty. When we consider the group in moderate poverty, the sum is US$4.0 PPP. Thus, the average direct transfer received by the beneficiaries in extreme and moderate poverty appears to be enough to move them out of extreme and moderate poverty, respectively.
The high level of the average transfer is driven by the noncontributory pensions. However, only 16 percent of people in moderate poverty are in households that are reached by this program (table 6); remember that by definition noncontributory pensions are directed at individuals who are sixty-five years old or older. Thus, we recalculate the average transfer excluding noncontributory pensions. As shown in Table 5, in this case, the average per capita transfer is US$1.2 and US$1.1 PPP per day for beneficiaries in extreme and moderate poverty, respectively. We still find that the sum of transfers plus market income is higher than the threshold of extreme poverty (US$2.8). However, this is not true for moderate poverty: the sum is US$3.6 PPP.
Around 5 percent of the Uruguayan poor do not receive any direct transfers (table 6). While it is difficult to analyze this population because of its size, the majority of the noncovered poor belong to households with children. If the government were able to reach these excluded families with the family allowances and the food voucher programs (both oriented to households with children), the coverage of direct transfers would increase to 99 percent of the poor.
Hence, neither the average per capita transfer nor the lack of coverage among the poor seems to be behind the “persistence” of moderate disposable income poverty. But moderate poverty could be sensitive to programs oriented to households with children. Are there leakages? As shown in table 6, the nonpoor captures 66 percent of direct transfers. Note that the national poverty line is higher than US$4 PPP. Among existing programs, the food basket and food voucher programs have potential to improve coverage and targeting: the former covers 47 percent of the poor while 53 percent of spending on this program goes to the nonpoor; the numbers for the food voucher program are 61 percent and 39 percent, respectively. In contrast, the family allowance program and the noncontributory pension program have a very high rate of coverage among the beneficiary group (poor families with children and the elderly, respectively). The category of other direct transfers includes some contributory programs not linked to the poverty status of families.
The government should determine whether or not the solution is to increase the size of transfers (other than noncontributory pensions). In addition to fiscal considerations, several other factors should be assessed. Would poverty be eradicated by simply giving more money to the poor, or do the post-transfers poor require more nuanced interventions that address issues of dysfunctional behavior (such as alcoholism and drug abuse)? It would also be very important to assess whether increasing the size of a transfer would be self-defeating if, for example, this decreases the adult labor force participation or hours worked.
Concluding Remarks
Uruguay achieves a nontrivial reduction in inequality and poverty when all taxes and transfers are combined. Direct taxes are progressive and indirect taxes are practically neutral. Social spending is quite progressive in absolute terms. Social spending on education and health is quite progressive except for tertiary education, which is almost neutral in relative terms. When contributory retirement pensions are treated as a transfer, they are progressive in absolute terms.
Although poverty by international standards is low and direct net transfers contribute to this outcome significantly, extreme poverty is not eradicated by transfers. In addition, while direct transfers help households that receive noncontributory pensions to move out of moderate poverty, but they are not enough (on average) to do the same with the beneficiary households of other programs. An assessment of other factors may shed light on how cash transfer programs need to change before poverty can be eradicated.
The lack of progressivity of tertiary education in an otherwise progressive pattern of social spending stands out. Undergraduate education in Uruguay is free, and enrollment does not require passing an entrance examination. In addition, students from poor families have access to scholarships. In spite of this, the proportion of university-age (18–24) individuals who attend tertiary education among the extreme poor and moderate poor (measured by the income market) is less than 1 percent and 2 percent, respectively. The main problem seems to be a high drop-out rate in secondary school (68 percent of the 18–24 age group did not finish secondary school). A better understanding of the dynamics behind this phenomenon could lead to corrective measures and make public spending on tertiary education more progressive.
Footnotes
Declaration of Conflicting Interests
The author(s) declared no potential conflicts of interest with respect to the research, authorship, and/or publication of this article.
Funding
The author(s) received no financial support for the research, authorship, and/or publication of this article.