
Abstract
Background
Poor sleep can contribute to poorer health and socioemotional outcomes. Sleep health can be influenced by a range of individual and other socioecological factors. Perceptions of neighborhood physical and social characteristics reflect broader social-level factors that may influence sleep, which have not been well studied in the Australian context. This study examined the association between perceived neighborhood characteristics and sleep in a large sample of Australians.
Methods
Data were from 9,792 people aged 16 years or older, from Waves 16 and 17 of the nationally representative Household, Income and Labour Dynamics in Australia Survey. Associations between perceived neighborhood characteristics (neighborly interaction and support, environmental noise, physical condition, and insecurity) and self-reported sleep duration, sleep disturbance, and napping were examined using multiple logistic regression models.
Results
“Neighborhood interaction and support” and “neighborhood physical condition” were not significantly associated with any sleep outcomes after adjusting for relevant covariates. However, “environmental noise” and “neighborhood insecurity” remained significantly associated with sleep duration and sleep disturbance. None of the neighborhood characteristics were associated with napping. Furthermore, associations did not significantly vary by gender.
Conclusions
This study highlights the potential benefit of public health policies to address noise and safety in neighborhoods to improve sleep.
Sleep is a critical pillar of health. Insufficient sleep duration and poor-quality sleep are associated with a wide variety of adverse health outcomes, including poorer cardiovascular health (Yin et al., 2017), increased risks of hypertension (Meng et al., 2013), cancer, injuries, diabetes (Shan et al., 2015), obesity (St-Onge et al., 2016), mental ill-health (Li et al., 2016), and all-cause mortality (Yin et al., 2017). Sleep also predicts a broad range of developmental, work-related, and social outcomes (Staton et al., 2019). Much previous research has focussed on understanding individual differences that predict sleep health, but these individual characteristics are nested within wider geographic, social, and other environmental contexts (Taylor et al., 1997). A socioecological framework posits that individual-level influences (e.g., genetics, beliefs, and attitudes about sleep, health, wellbeing, etc.) operate within a social level (e.g., family, neighborhood, work, etc.), which are further embedded in a societal level (e.g., public policy, globalization, etc.) to influence insufficient or poor-quality sleep (Grandner, 2019). Although it is increasingly acknowledged that sleep occurs in a social context, the social determinants of sleep are not as well understood as individual-level factors.
The characteristics of the neighborhoods in which we reside have been shown to influence a wide variety of health and wellbeing outcomes, including physical and mental health (Galster, 2012). The neighborhood attributes most commonly identified as relevant for individual health and wellbeing are neighborhood physical/environmental deprivation (e.g., noise and pollution, neighborhood disorder/disarray) and neighborhood social characteristics (e.g., crime and safety, social capital) (Tampubolon, 2012). Sleep disturbance has been proposed as a potential pathway through which such neighborhood characteristics can affect health and wellbeing outcomes (Hale et al., 2010, 2013; Simonelli et al., 2017).
A growing body of research suggests that the neighborhood context is important for sleep across the life course (Billings et al., 2020; Hale et al., 2015; Kim, Branas, et al., 2022). Findings typically show that sleep quality and sleep quantity are poorer in neighborhoods with less desirable social, physical, and safety characteristics, particularly for women in these neighborhoods (e.g., Bassett & Moore, 2014). Neighborhood characteristics have been operationalized in a range of ways, including (a) physical characteristics of the neighborhood environment (e.g., greenspace, walkability, light, noise, traffic, etc. (Hale et al., 2019) and (b) social characteristics of the neighborhood (e.g., area-level socioeconomic condition, crime rates, and perceptions of social cohesion, neighborhood safety, and amenity). In addition, research studies have examined these factors using objective data (e.g., greenspace, crime rates, employment rates) or subjectively via self-report (i.e., people’s perceptions of their neighborhood attributes). Much of the research in this area has been conducted in the context of the Americas (Bassett & Moore, 2014; Simonelli et al., 2015), particularly in the United States (Alhasan et al., 2020; Chambers et al., 2016; Chen-Edinboro et al., 2015; DeSantis et al., 2013; Hale et al., 2013). It is unclear whether these same relationships would also be observed in Australia, where neighborhood characteristics are embedded within a different societal, political, and historical context. There are substantial country-level differences in neighborhoods because of the differences in historical and contemporary policies that influence residential segregation along socioeconomic and racial/ethnic lines between countries, differences in levels of urbanization (e.g., Australia is a particularly urbanized country), and variations in urban planning. As such, it is important to expand the contexts within which neighborhood effects are explored to broaden country-level comparisons. We identified only one previous Australian study that examined the relationship between the area-level social context (i.e., economic conditions) and sleep duration (Perales & Plage, 2017). Using data from the Household, Income and Labour Dynamics in Australia (HILDA: Wave 13) Survey, these researchers found that individuals residing in areas with high unemployment rates slept less than individuals in areas with low unemployment rates. However, to date, no Australian research has examined subjective perceptions of the wider neighborhood social contexts (both physical and social) on sleep.
The aim of this article is to examine whether neighborhood characteristics are associated with insufficient sleep duration, sleep disturbance, and napping using nationally representative data from Australian households. Understanding perceptions of neighborhood social and physical characteristics on sleep quality and quantity may provide insights into mechanisms underlying health and social disadvantage disparities. We hypothesize that negative perceptions of neighborhood characteristics (neighborhood interaction and support, noise, physical condition, and insecurity) will be associated with an increased likelihood of insufficient sleep and sleep disturbance.
A large literature documents the variety of factors that influence sleep from all levels of the socioecological model. To examine the unique associations of perceived neighborhood characteristics with sleep, we also hypothesize that these associations will remain significant after adjustment for sociodemographic, physical and mental health, housing, and area of residence factors. Finally, in light of previous research, we also hypothesized that these associations would be stronger for women than for men.
Method
Data
Data for this study were from the HILDA Survey, which is a nationally representative household-based longitudinal study that began in 2001. The focus of the survey is on family and household formation, income, and work. The survey is funded by the Commonwealth Department of Social Services and is managed by the Melbourne Institute. The design (Watson & Wooden, 2012) and recruitment procedures for this survey have been reported extensively in publications, and the survey manual has detailed methodology and sampling information (Summerfield et al., 2018). In brief, this panel study collects information annually. Initial sampling involved a large national probability sample of Australian households. The Wave 1 sample consisted of 7,682 responding households and 13,969 responding persons. The initial sample comprised all members of the household aged 15 years or older who provided at least one Wave 1 (2001) interview, known as continuing sample members. The sample was replenished in Wave 11 (2011) with 2,153 additional households and 4,009 responding persons. Data were collected via face-to-face interviews and self-completed questionnaires.
Selection of Analytic Sample
Figure 1 presents the process of participant selection into the current study. Data for the sleep indicators and covariates were taken from the Wave 17 (2017) survey, which is only the second time these sleep items have been included in HILDA since they were first introduced in Wave 13. The Wave 17 survey did not collect information on people’s perceptions of their neighborhood; thus, data for the exposure variables (i.e., neighborhood characteristics) were taken from the Wave 16 survey. There were 17,570 participants in Wave 17. We excluded 1,149 participants who completed Wave 16, but not Wave 17. A further 3,068 participants were excluded because of moving address between waves, as their perceptions of their neighborhood from Wave 16 may no longer be relevant for their current area of residence. Participants who reported sleep duration that met age-based criteria for “not recommended” long sleep (see Figure 1, below; n = 223) were excluded due to small case numbers. Participants with missing data for the outcome and/or exposure variables were also excluded (n = 4,487). The final analytic sample was 9,792 participants. This analytic sample had similar sample characteristics to the total survey sample in Wave 17 (N = 17,570 participants; see Supplemental Table A). The study design is a lagged cross-sectional analysis of a panel survey.
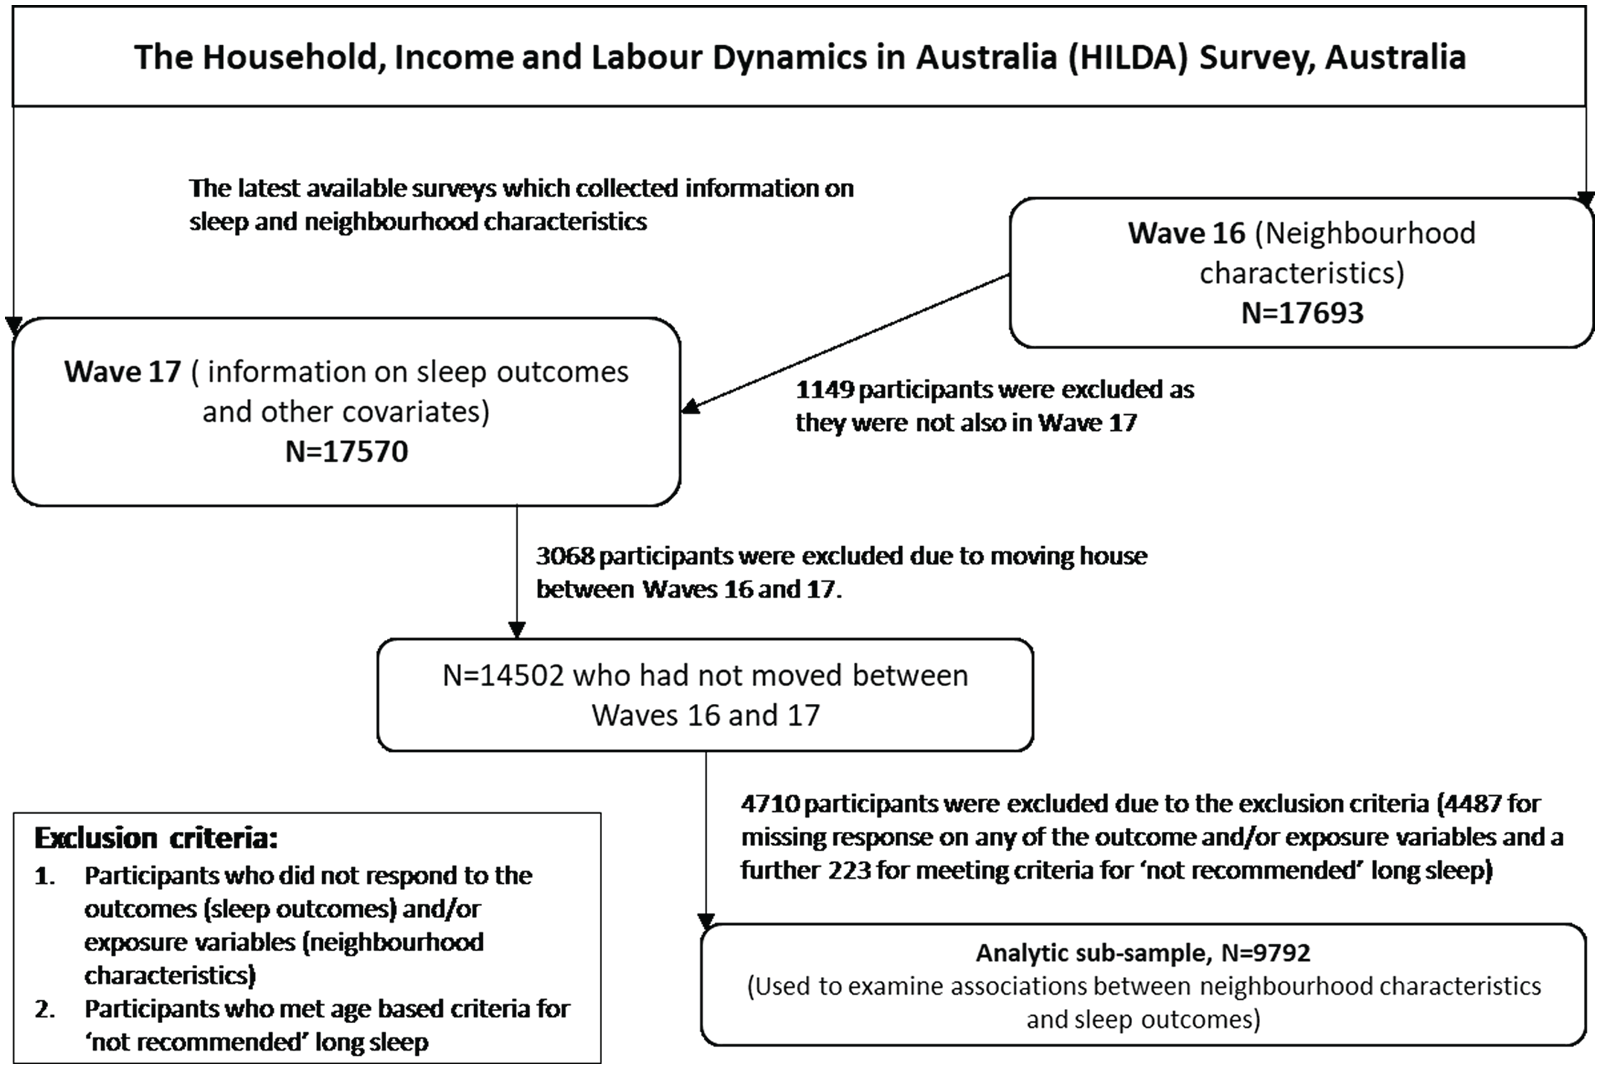
Visual Depiction of the Flow for the Selection of the Analytic Sub-Sample.
Measures
Sleep
The HILDA sleep module items asked participants about sleep duration, sleep disturbances, sleep quality, and napping. Some of these items were phrased differently depending on whether the participant was currently employed or not. To assess sleep duration, currently employed participants were asked the following questions: “Thinking of the past month, how many hours of actual sleep do you usually get on a workday night?” and “How many hours of actual sleep do you usually get on a non-work night?”. For participants who were currently not employed, these same questions were asked, except the term “workday night” was replaced with “weekday night,” and “non-work night” was replaced with “weekend night.” It was emphasized to participants that the hours of actual sleep may be different from the number of hours spent in bed. Responses were recorded as the number of hours reported or “don’t know.” Naps were assessed with two questions: Participants were first asked “And in a typical week, do you get any sleep from daytime or evening naps?”. Response options included yes, no, and “don’t know.” Participants who stated “yes” were asked “And how many hours of sleep do you get from such naps in a typical week?”.
For this article, we calculated night-time sleep duration. The average daily night-time sleep duration was calculated separately for participants currently working and those not currently working using the following formula: for those not currently working, (5 × weekday sleep + 2 × weekend sleep)/7, and for those currently working, (X × workday sleep + X × nonworkday sleep)/7. For persons currently working, X is based on the days worked/not worked in their main job (not all jobs).
Sleep disturbance was assessed by combining responses to a sleep quality item and items about sleep initiation and maintenance. The sleep quality item asked the following question: “In the past month, how would you rate your sleep overall?”. Response options were: very good (1), fairly good (2), fairly bad (3), and very bad (4). An additional two items were used to assess the frequency of sleep disturbance experienced over the previous month: “cannot get to sleep within 30 minutes” and “wake up in the middle of the night or early in the morning.” A 5-point frequency rating scale was used for these sleep disturbance items (1 = not during the past month, 2 = less than once a week, 3 = once or twice a week, 4 = three or four times a week; 5 = five or more times a week).
From the HILDA sleep items, we derived three outcome variables (see Table 1), with reference to the age-based National Sleep Foundation guidelines for the sleep duration outcome (Hirshkowitz et al., 2015; see Supplemental Table B).
Definitions for the Derived Sleep Outcomes.
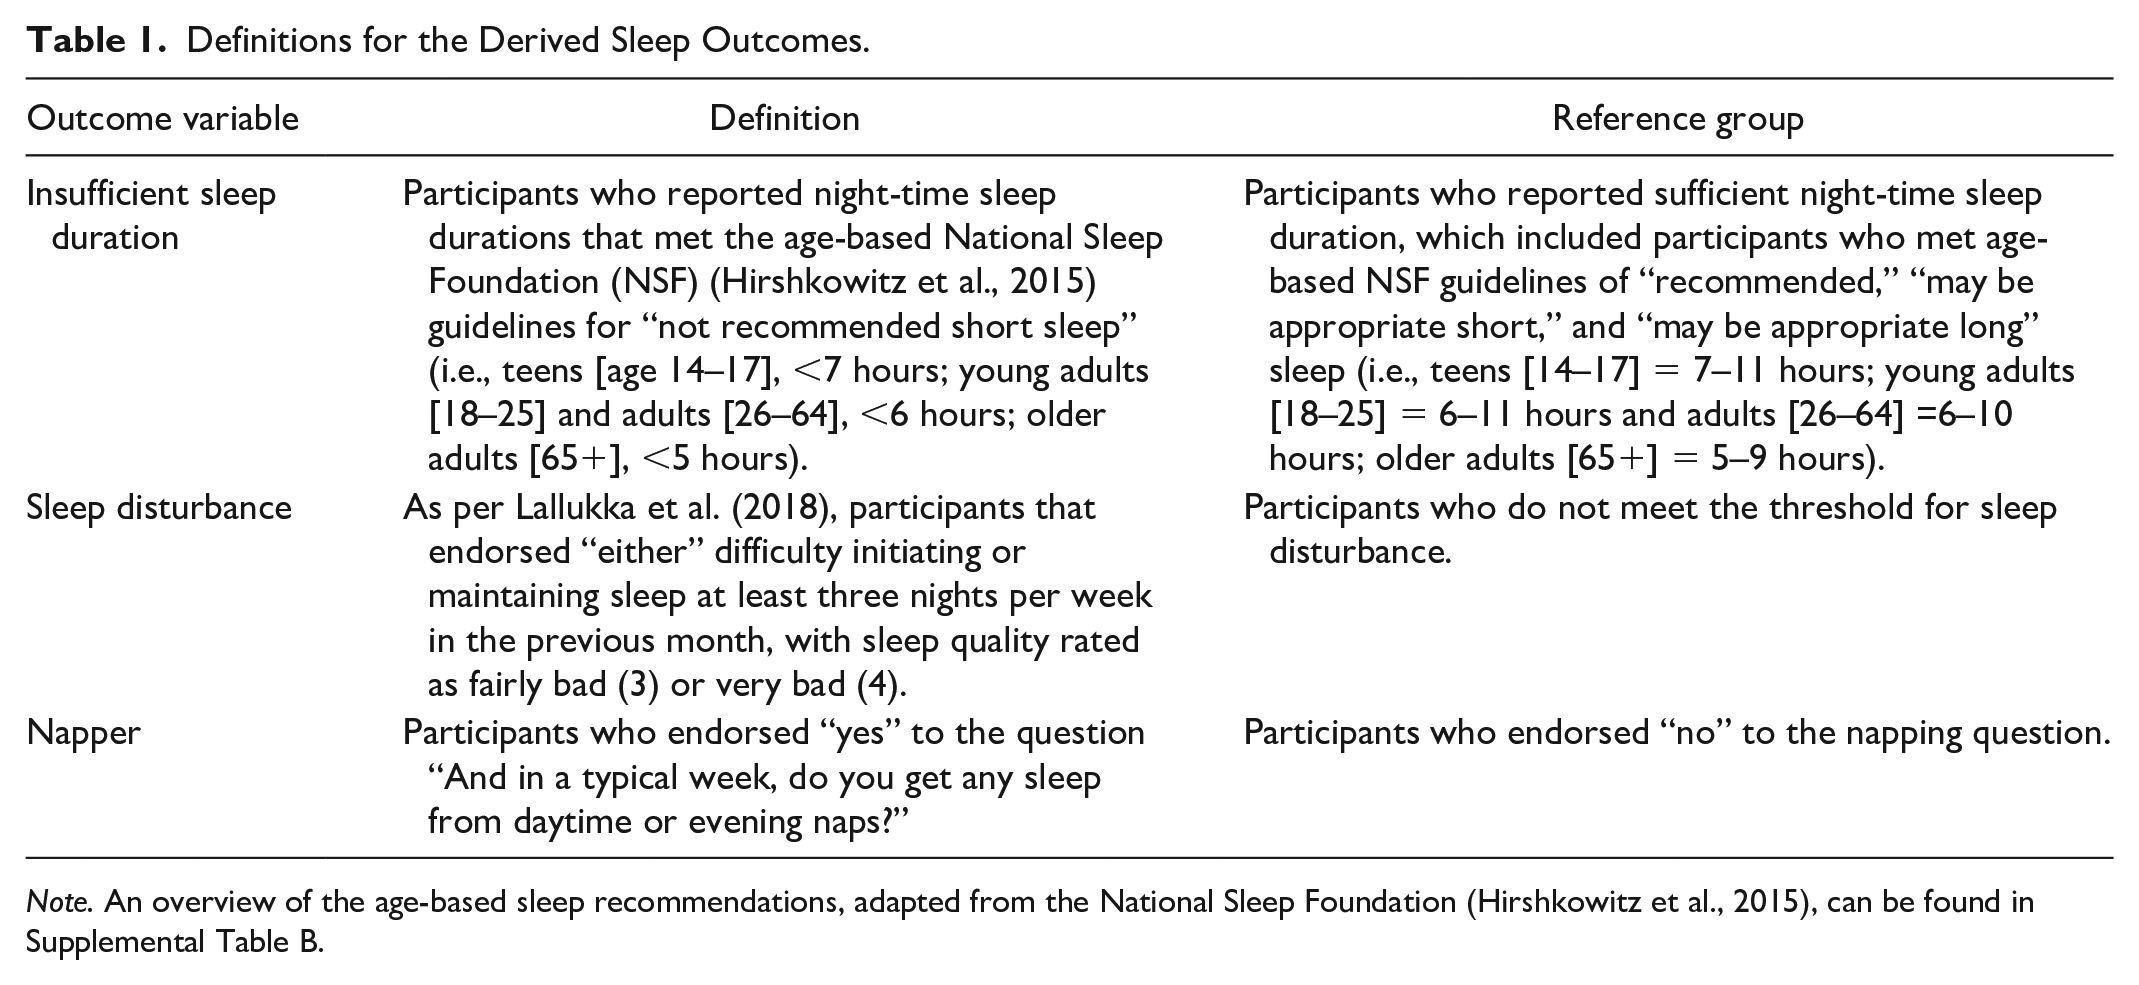
Note. An overview of the age-based sleep recommendations, adapted from the National Sleep Foundation (Hirshkowitz et al., 2015), can be found in Supplemental Table B.
Perceptions of Neighborhood Characteristics
The key exposure variables in this study were perceptions of neighborhood characteristics. This study examined 10 HILDA survey items assessing participants’ perceptions of the frequency in which events or behaviors occurred in their neighborhood on a 5-point rating scale (1 = never happens, 2 = very rare, 3 = not common, 4 = fairly common, 5 = very common). The specific neighborhood characteristics were (a) neighbors help each other out; (b) neighbors do things together; (c) traffic noise; (d) noise from airplanes, trains, or industry; (e) homes and gardens in bad condition; (f) rubbish and litter lying around; (g) teenagers hanging around on the streets, (h) people being hostile and aggressive, (i) vandalism and deliberate damage to property; (j) burglary and theft. These items were based on similar items from the British Social Attitudes Survey and have been aggregated into subscales previously (Shields et al., 2009). Four mean subscales were derived from these items: “neighborly interaction and support” (Items 1 and 2), environmental noise (Items 3 and 4), local neighborhood physical condition (Items 5 and 6), and “insecurity in the neighborhood” (Items 7–10). The approach to creating these subscales is similar to that of Shields et al., with the exception that we separated “environmental noise” and “local neighborhood physical condition” items from their “local disamenity” subscale that combined Items 3–6. We needed to separate the environmental noise items from the physical condition items because of the clearly established links between noise and sleep. Higher scores on neighborly interaction and support are indicative of more affable neighborly interactions, whereas lower scores are indicative of greater incivility. Higher scores on environmental noise, local neighborhood physical condition, and insecurity in the neighborhood are indicative of greater dissatisfaction with the neighborhood environment (more noise, litter and houses in poor condition, and frequently reported hostility, vandalism, burglary, and theft).
Covariates
Interindividual and social-level covariates were selected based on prior literature that has identified a relationship with sleep. Covariates were reported in Wave 17 data. Sociodemographic covariates included age, gender, education, employment status, shift work status, country of birth/Indigenous Australian cultural background, and living with children aged 0–4 years. Health-related covariates included body mass index, smoking status, physical activity, alcohol consumption, pain, and psychological distress. Housing and neighborhood covariates were housing tenure (i.e., whether renting or owning), socioeconomic indexes for areas (SEIFA), and remoteness.
Data Analysis
There were three outcome variables (insufficient sleep duration, sleep disturbance, and napping) and four exposure variables (neighborly interaction and support, environmental noise, neighborhood physical condition, and neighborhood insecurity) in this study. Descriptive statistics explored the distribution of the outcome and exposure variables. Regression analyses were performed to examine associations between neighborhood characteristics and the sleep outcomes. Considering the clustered survey design and the binary outcome variable, a panel logistic regression model (xtlogit in STATA) was used. We first estimated simple models (Model 1) including only a single neighborhood characteristic. Next, we estimated an adjusted model (Model 2) including a single neighborhood characteristic as well as all covariates. Model 3 extended Model 2 by including an interaction term of neighborhood characteristics and gender variables to understand if the association of neighborhood characteristics with sleep outcome varied between male and female participants. Odds ratios for the unadjusted models and adjusted odds ratios (AOR) for the models with 95% confidence interval were reported in this study.
Missing Data
We handled missing data on covariates by using multiple imputation (MI) statistical techniques. In MI, the distribution of observed data is used to estimate a set of plausible values for missing data to create a “complete” data set. To address the different variable types (e.g., binary, ordinal, continuous), we used chained equations, a sequence of univariate imputation methods with fully conditional specification of prediction equations using the STATA command mi impute chained. The imputation routine consisted of 1,000 iterations to create 20 imputed data sets. The imputations were validated by comparing distributions of covariates before and after imputation. The imputation accuracy was assessed using the following parameters: relative increase in variance, fraction of missing information, degrees of freedom, relative efficiency, and the between-imputation and within-imputation variance estimates. Regression analyses were conducted in both the available sample and imputed full sample (i.e., complete sample after imputing missing values). We did not observe significant differences in the estimates between the imputed sample and the available case sample. Therefore, we report estimates from the imputed sample.
Results
Data were included from 9,792 participants. Participants were aged between 16 and 98 years (M = 48.13; SD = 18.4), and 52.1% of respondents were female. Table 2 shows the sociodemographic characteristics of the sample. Overall, the proportions of insufficient sleep duration, sleep disturbance, and napping were 17.52% (95% CI = [16.78, 18.29]), 20.26% (95% CI = [19.48, 21.10]), and 29.60% (95% CI = [28.70, 30.51]), respectively (Supplemental Table C). Variations in the proportions of poor sleep outcomes across different covariates, and bivariate associations between covariates and sleep outcomes, are also presented in Supplemental Table C.
Study Participant Characteristics (N = 9,792).
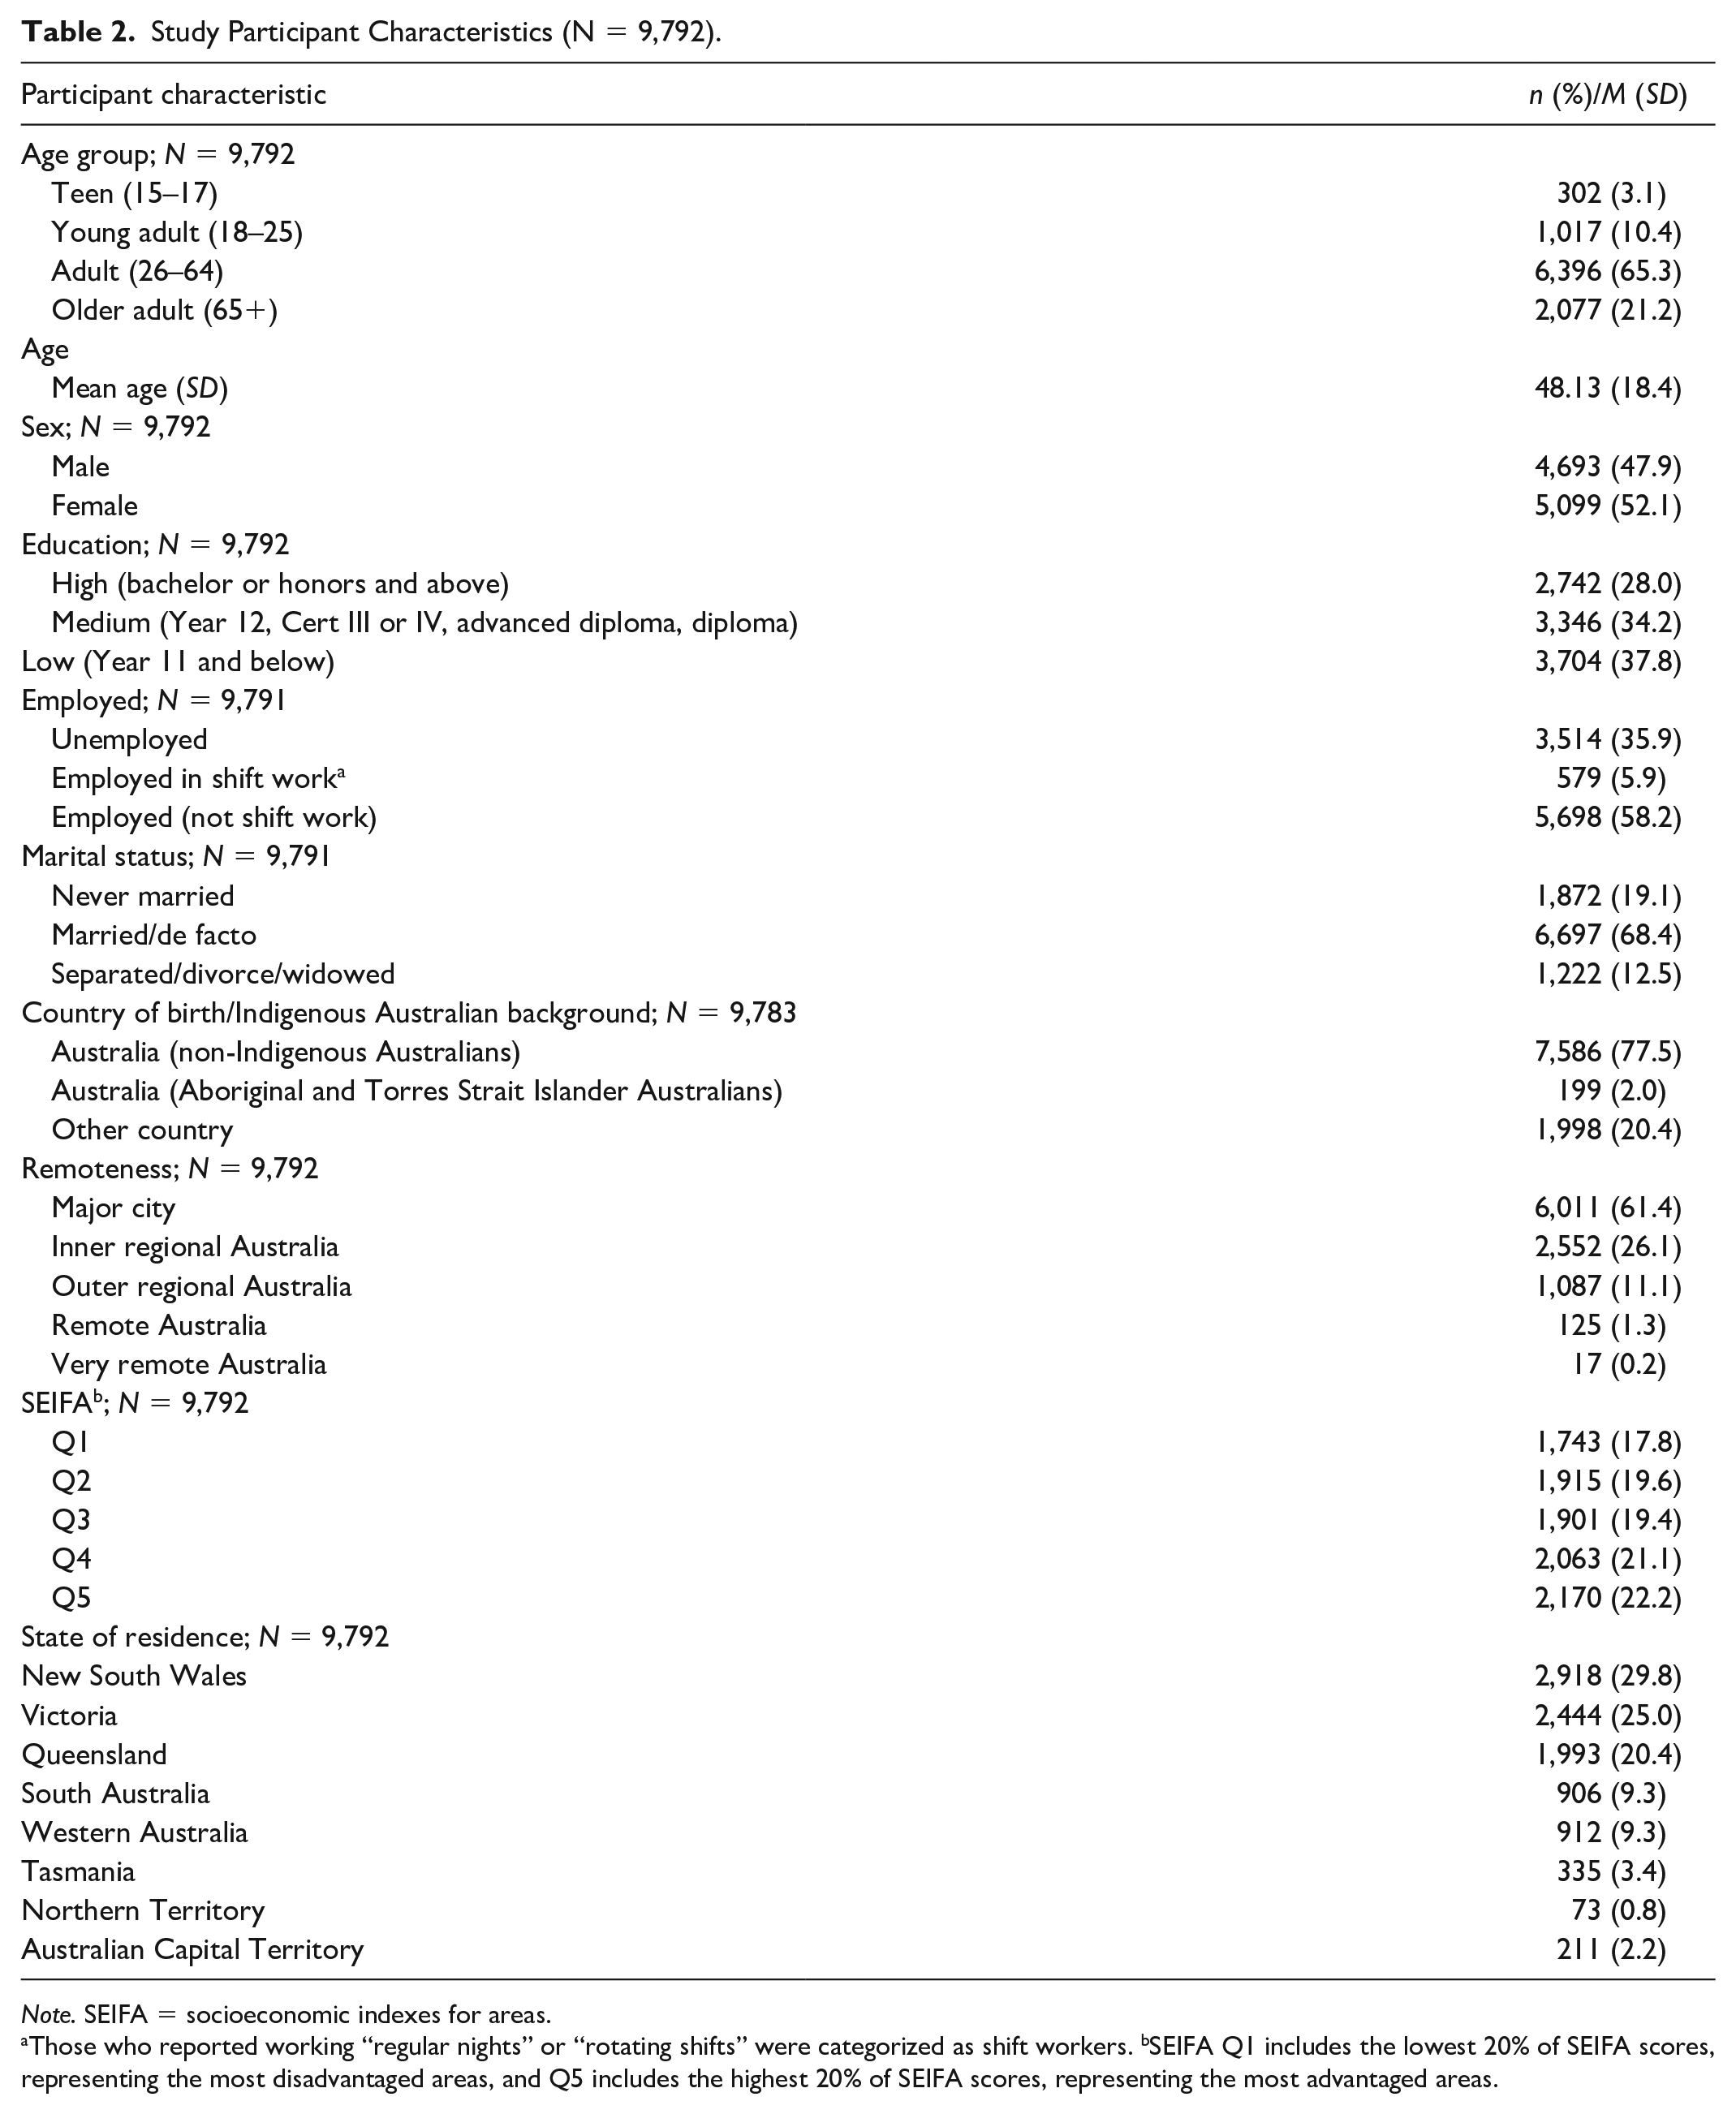
Note. SEIFA = socioeconomic indexes for areas.
Those who reported working “regular nights” or “rotating shifts” were categorized as shift workers. bSEIFA Q1 includes the lowest 20% of SEIFA scores, representing the most disadvantaged areas, and Q5 includes the highest 20% of SEIFA scores, representing the most advantaged areas.
Table 3 shows the mean scores on the exposure variables (i.e., neighborhood interaction and support, environmental noise, neighborhood physical condition, and neighborhood insecurity) among participants with and without insufficient sleep duration, sleep disturbance, and napping. Table 3 shows that the mean scores of the neighborhood index across the environmental noise, physical condition, and insecurity domains were higher among participants who had poor sleep outcomes than those among participants who did not. For example, the mean (SD) score of neighborhood noise was 2.81 (0.97) for participants who had insufficient sleep duration, whereas it was 2.66 (.93) for participants who did not (Table 3).
Descriptive Statistics for Neighborhood Variables by Sleep Outcomes.
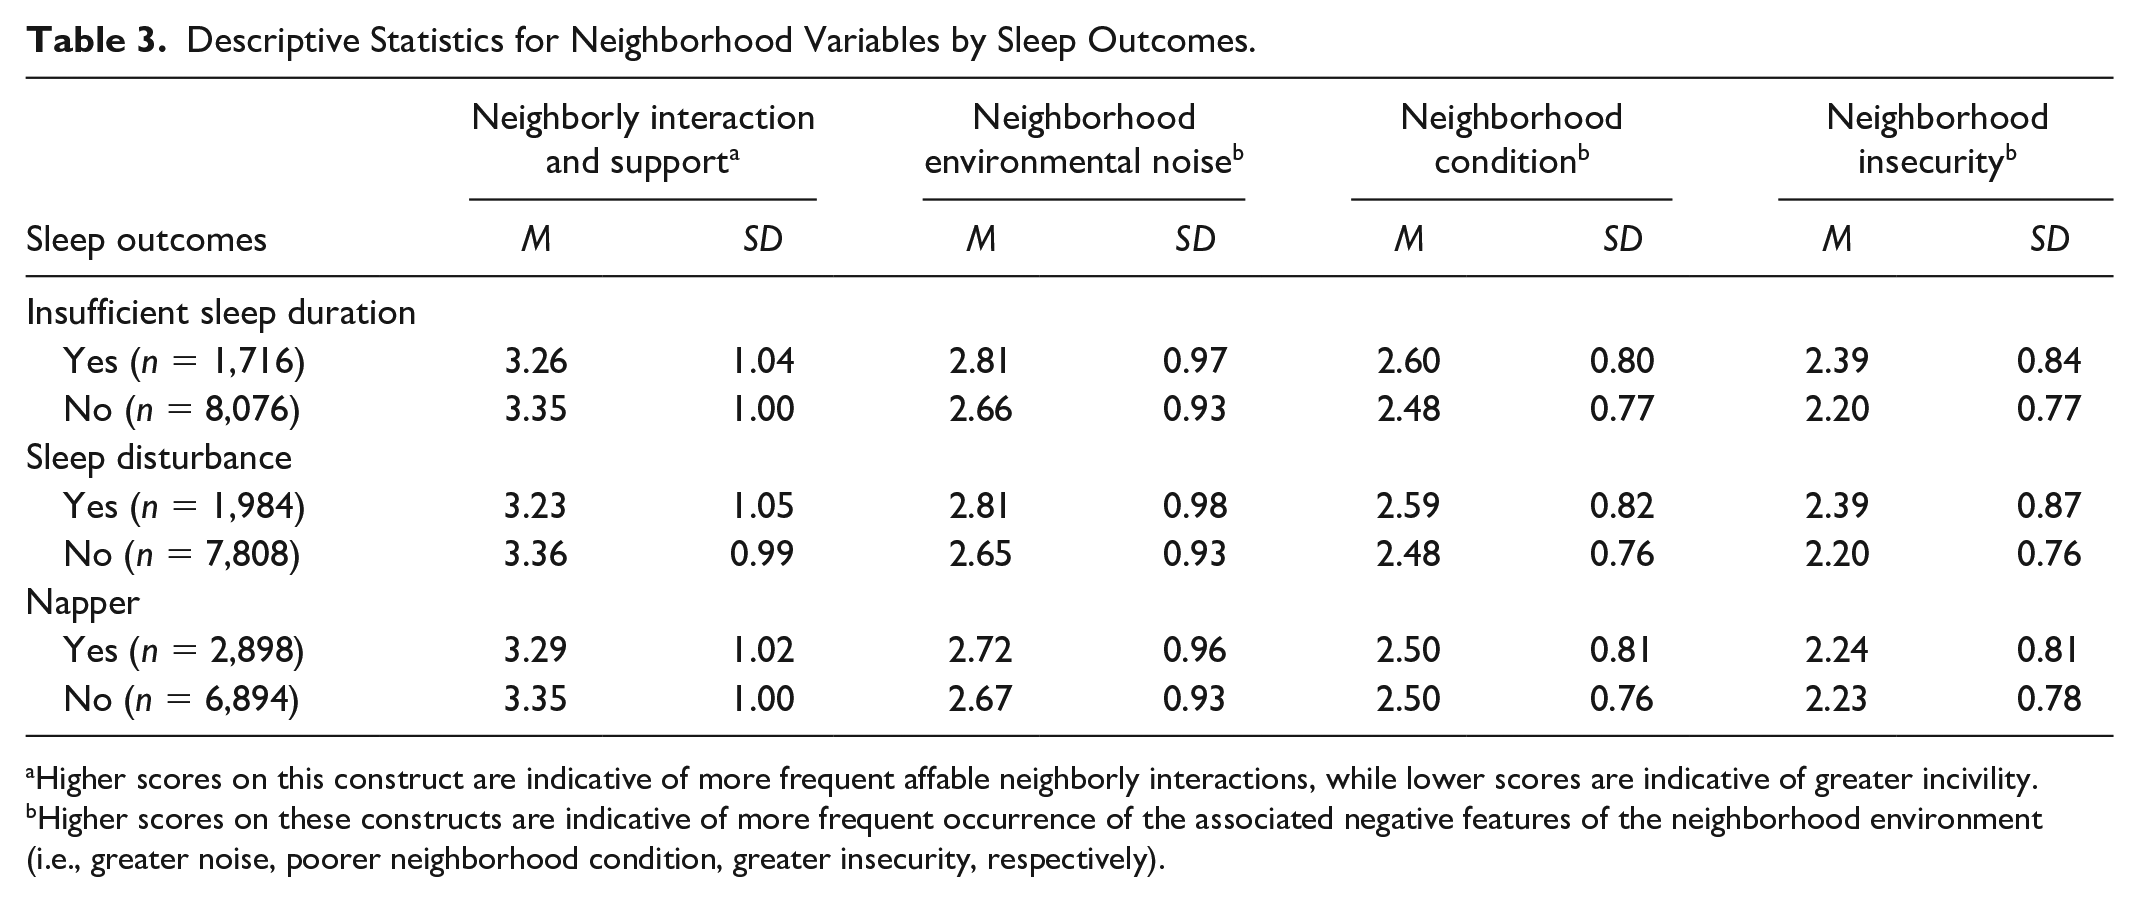
Higher scores on this construct are indicative of more frequent affable neighborly interactions, while lower scores are indicative of greater incivility. bHigher scores on these constructs are indicative of more frequent occurrence of the associated negative features of the neighborhood environment (i.e., greater noise, poorer neighborhood condition, greater insecurity, respectively).
Table 4 presents the unadjusted and adjusted associations between the four neighborhood characteristic variables (i.e., neighborhood interaction, environmental noise, neighborhood physical condition, and neighborhood insecurity) and the three self-rated sleep outcomes. The AORs in Table 4 show that greater perceived environmental noise was significantly associated with increased odds of insufficient sleep (AOR = 1.06) and sleep disturbance (AOR = 1.06) after adjustment. Greater perceived neighborhood insecurity was also associated with increased odds of insufficient sleep (AOR = 1.12) and sleep disturbance (AOR = 1.13) after adjustment. There was no statistically significant adjusted association between any of neighborhood characteristics and napping. Neighborly interaction and support and neighborhood physical condition were not significantly associated with any of the sleep outcomes after adjustment. Furthermore, the association between the neighborhood characteristics and sleep outcomes did not significantly vary by gender (see Supplemental Table D).
Associations Between Neighborhood Characteristics and Sleep Outcomes (n = 9,792).
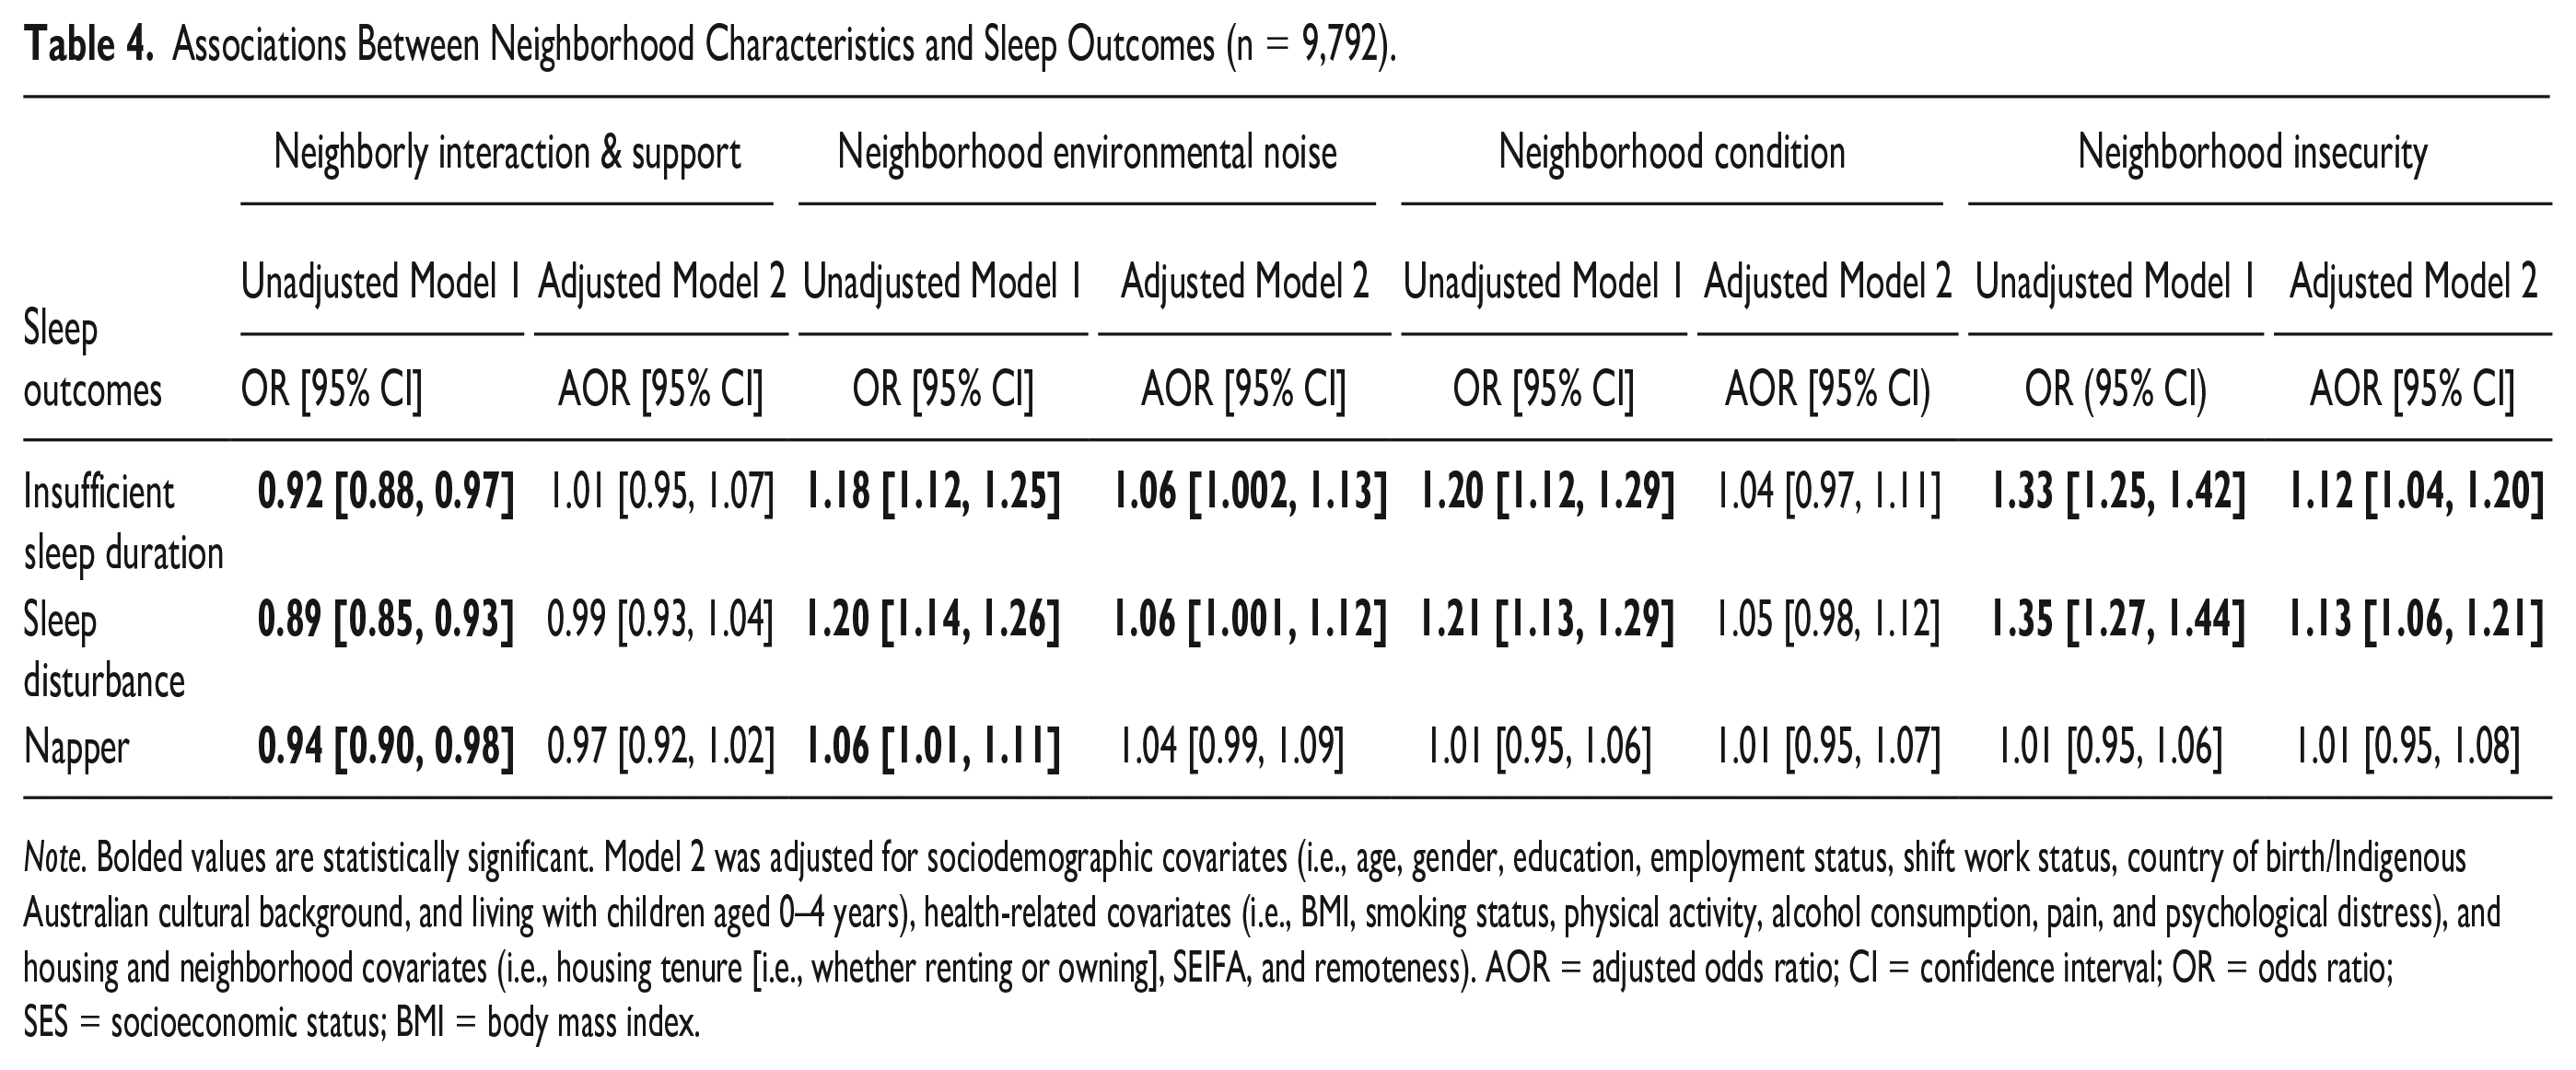
Note. Bolded values are statistically significant. Model 2 was adjusted for sociodemographic covariates (i.e., age, gender, education, employment status, shift work status, country of birth/Indigenous Australian cultural background, and living with children aged 0–4 years), health-related covariates (i.e., BMI, smoking status, physical activity, alcohol consumption, pain, and psychological distress), and housing and neighborhood covariates (i.e., housing tenure [i.e., whether renting or owning], SEIFA, and remoteness). AOR = adjusted odds ratio; CI = confidence interval; OR = odds ratio; SES = socioeconomic status; BMI = body mass index.
Discussion
The aim of this study was to examine the associations between perceived neighborhood characteristics and self-rated sleep outcomes in Australians. Our results suggest that perceptions of greater environmental noise and insecurity in neighborhood environments were associated with greater likelihood of insufficient sleep and sleep disturbance, but not napping. Importantly, these associations persisted after adjustment for key demographic, health, socioeconomic, and household area-level factors. In addition, the associations did not vary by gender. The perceived neighborhood effects in this study were modest but statistically significant. There are several potential mechanisms linking perceptions of one’s neighborhood context (social and physical) with individual sleep behaviors. Hale et al. (2013) hypothesized three plausible pathways: psycho-physiological pathways (e.g., arousal, stress), ambient exposures (noise, temperature, light, air quality), and health behaviors (e.g., physical activity, accessing services), which may operate dynamically within the neighborhood context to influence sleep.
The finding that perceptions of greater neighborhood insecurity are associated with increased risk of insufficient sleep duration and sleep disturbance provides further support to the notion that sleep insecurity and sleep health can be socially determined at the neighborhood level. Our finding is consistent with that of other studies from the United States (DeSantis et al., 2016; DeSantis et al., 2013; D. A. Johnson et al., 2016; D. A. Johnson et al., 2017; Nam et al., 2018; Simonelli et al., 2017), Europe (Duncan et al., 2017), as well as Mexico, Ghana, South Africa, India, China, and Russia (Hill et al., 2016), which have found that respondents who feel less safe in their neighborhoods are more likely to self-report sleep problems. Our finding is also consistent with research using objective measures of both sleep and indices of neighborhood crime characteristics (Kim, Troxel, et al., 2022; Richardson et al., 2021; Troxel et al., 2018). However, not all studies have found an association between perceived safety and sleep outcomes (S. L. Johnson et al., 2009), and the reliability of the association with different dimensions of sleep is not always observed. For example, Johnson et al. found an association of perceived neighborhood safety with daytime sleepiness, but not with sleep duration (D. A. Johnson et al., 2015). In line with the first hypothesized pathways between neighborhood contexts and sleep by Hale et al., perceptions of neighborhood insecurity may heighten vigilance or induce a psycho-physiological stress response, processes which are not conducive to sleep (Hale et al., 2010). Indeed, evolutionary theory suggests that perceived sleep insecurity would be associated with shorter sleep duration to minimize time spent vulnerable to threat (Dahl, 1996; Hale et al., 2019; Samson et al., 2017). In addition, residents who perceive their neighborhood as less safe may be less inclined to engage in outdoor physical activity, resulting in decreased exposure to factors that may improve sleep outcomes including natural light, physical activity, and greenspace (Astell-Burt et al., 2013; Burns et al., 2021; Ding et al., 2011; Kim, Branas, et al., 2022; Kredlow et al., 2015). This explanation is consistent with the third plausible pathway (i.e., health behaviors) by Hale et al. (2013) explaining the relationship between neighborhoods and sleep. In support of this theory, previous research did report that more crime was associated with less physical activity within Australian small local areas (Astell-Burt et al., 2015). Overall, our findings add to the substantial body of literature that indicates an association between perceptions of neighborhood safety and poorer sleep outcomes.
In this study, frequent neighborhood environmental noise was associated with increased likelihood of insufficient sleep duration and sleep disturbance. This finding is consistent with prior research examining the influence of perceived noisiness of the neighborhood on insomnia symptoms (Evandt et al., 2017; Simonelli et al., 2017), as well as sleep quality (Pirrera et al., 2014) and sleep onset latency (Pirrera et al., 2014). Objectively measured noise has also been associated with sleep duration, quality (B. S. Johnson et al., 2018), and disturbances (Perron et al., 2016). Indeed, one study reported that daytime and night-time noise annoyance (i.e., noisy neighborhoods, aircraft noise at night, and road traffic noise) at baseline predicted the onset of sleep disturbances 5 years later, demonstrating that noise disturbances may have a long-term impact on sleep (Beutel et al., 2020). However, not all studies have found an association between noise and sleep disturbance. For example, no association was found between exposure to objectively measured outdoor wind turbine noise level and sleep disturbance (Michaud et al., 2016) or between local airport noise and sleep disturbance after controlling for individual and area-level SES (Holt et al., 2015). Discrepant findings may be due to the different quality and context of the noise measured in these studies compared with dynamic and random neighborhood noise due to intermittent traffic and human interactions. The theoretical link between place-based environmental noise and sleep is perhaps obvious, occurring via immediate physiological interruption of sleep, as per the second hypothesized plausible pathway (i.e., ambient exposure) between neighborhood context and sleep by Hale et al. (2013). Specifically, noise can shorten the sleep period in terms of time taken to fall asleep, waking earlier than otherwise, and/or via increased awakenings (Muzet, 2007). Secondary effects of the noise disturbance, including annoyance and/or hyperarousal, can also impact evaluations of sleep quality and quantity and impacts to daytime functioning due to disturbed sleep (D. A. Johnson et al., 2018; Muzet, 2007). Furthermore, noisy neighborhoods may also co-occur with other environmental factors that have been shown to negatively impact sleep, including increased artificial light at night (e.g., noise due to industrial complexes, central business districts, or night-life precincts) (Xiao et al., 2020) and decreased greenspaces (Astell-Burt et al., 2013). Research examining the influence of environmental noise on sleep problems has been largely concentrated in European countries (Smith et al., 2022). This body of research has shown that the majority of the burden of disease from environmental noise in Europe is attributable to noise-induced sleep disturbance (World Health Organization, 2011; Smith et al., 2022). As such, our findings may indicate that the burden of disease due to noise-induced sleep disturbance may also be a substantial problem in Australia. Therefore, further research, which captures time-of-day and objective measures of noise and sleep, is warranted.
Perceptions of poor physical condition of the neighborhood environment (including littering and housing in poor condition) were not associated with sleep and napping indicators in our study. The findings in the literature are mixed in relation to neighborhood physical condition (often referred to as “neighborhood disorder”) and sleep outcomes. Our results are consistent with another study that also observed a nonsignificant relationship between these variables (e.g., DeSantis et al., 2016); however, our results are inconsistent with a range of other studies that have observed such a relationship (Chambers et al., 2016; D. A. Johnson et al., 2016; Troxel et al., 2020). Adding to the mixed findings in the literature, other studies have found an association between neighborhood disorder and only one of a number of sleep outcomes examined (i.e., only wake after sleep onset [Troxel et al., 2018] or insomnia [Hall Brown & Mellman, 2014]). As such, results are mixed, and the population studied (i.e., the context), in combination with the methods used to assess both sleep and neighborhood environment, is an important consideration for future studies.
Perceptions of neighborly interaction and support were not associated with self-rated sleep outcomes in our study. This finding contrasts with many studies that have investigated constructs of sleep with social capital and social cohesion (Alhasan et al., 2020; Bassett & Moore, 2014; Chen-Edinboro et al., 2015; DeSantis et al., 2016; DeSantis et al., 2013; D. A. Johnson et al., 2017; Murillo et al., 2021; Robbins et al., 2019). For example, the study of low-income, predominantly African American neighborhoods by Kim et al. found that the perceived social cohesion was associated with a decreased risk of objectively measured insufficient sleep. However, other studies have also reported nonsignificant associations between social cohesion and sleep outcomes after adjustment for confounders (D. A. Johnson et al., 2016; Nomura et al., 2010; Troxel et al., 2018; Watanabe et al., 2020). Likely reasons for such discrepant findings in the literature could be that much previous research has examined neighborhood factors within predominantly high-density urban settings, compared with the more geographically diverse and representative sample examined in this study. It is likely that the different social, environmental, and socioeconomic contexts impact sleep in unique ways.
None of the measures of neighborhood characteristics were associated with napping. To our knowledge, napping has not yet been examined in adult populations for this topic. The null finding in this study is in contrast to previously reported associations between parent-reported frequency of neighborhood crime and time spent napping in Mexican American adolescents (McHale et al., 2011). Our findings suggest that napping may be explained by more individual (gender, age, employment) than neighborhood characteristics. This study only examined napping as “present” or “absent,” but napping varies on a range of dimensions including duration and frequency. As such, further research into these factors may be warranted.
This study used a cross-sectional analysis approach, with a 1-year lag between the exposures and outcomes that were each measured only once, to examine the associations between neighborhood characteristics and sleep, but this design limits causal inferences (Astell-Burt et al., 2013). Although our proposed conceptual model would hypothesize that neighborhood characteristics affect sleep, it is possible that insufficient sleep duration and sleep disturbance can cause individuals to appraise their neighborhood environment more negatively if they themselves are tired and irritable from poor sleep. Longitudinal designs are needed to better control for confounding variables, including selection bias (i.e., people who sleep better selecting into certain types of neighborhoods; Astell-Burt et al., 2013; Hedman & van Ham, 2012; Mayne et al., 2021). Second, we used subjective measures of sleep duration, sleep disturbance, and napping. Objectively measured sleep may reveal insights into the associations between perceptions of neighborhood characteristics and physiology of sleep. The sleep duration measures available to us used an “average” duration approach for typical work/week days and nonwork/weekend nights. Objectively measured sleep could improve these estimates and provide additional information about regularity of sleep-wake behavior, another important indicator of sleep health that could be affected by neighborhood characteristics. Furthermore, this study examines one of several social-level environments that may influence sleep according to socioecological models. Factors such as workplace and school/learning environments were not examined in this study but may also operate to influence sleep or interact with perceptions of an individual’s residential neighborhood. Despite these limitations, very few studies have assessed the relationship between perceptions of neighborhood characteristics and sleep in large population studies, and to our knowledge, ours is the first to examine these associations in an Australian context, extending the generalizability of previous findings to a different cultural context.
Sleep is a key input to health and wellbeing. Our findings suggest that perceptions of the neighborhood characteristics matter for sleep, in that neighborhoods perceived to be noisy and insecure may play a role in determining sleep quality (e.g., sleep disturbance) and sleep quantity. Very often, interventions to improve sleep focus on individual-level factors. These interventions may have limited effectiveness if the level of control an individual has on their life is limited by upstream factors (D. A. Johnson et al., 2019). In contrast, social policy approaches to improving sleep using place-based interventions may better address inequalities in sleep security. Improving neighborhood conditions, for example, via public health policies to minimize disruptive residential noise, and improving safety may provide opportunities to improve sleep, thereby contributing to addressing the disparities in health and social disadvantage. The social patterning of sleep suggests that sleep should be reported at a national level and included in national public health agendas. Improving sleep security, and reducing sleep health disparities, should be a priority.
Supplemental Material
sj-docx-1-heb-10.1177_10901981231177687 – Supplemental material for Perceived Neighborhood Characteristics and Sleep in Australian Adults
Supplemental material, sj-docx-1-heb-10.1177_10901981231177687 for Perceived Neighborhood Characteristics and Sleep in Australian Adults by Shannon L. Edmed, M. Mamun Huda, Cassandra L. Pattinson, Kalina R. Rossa and Simon S. Smith in Health Education & Behavior
Supplemental Material
sj-docx-2-heb-10.1177_10901981231177687 – Supplemental material for Perceived Neighborhood Characteristics and Sleep in Australian Adults
Supplemental material, sj-docx-2-heb-10.1177_10901981231177687 for Perceived Neighborhood Characteristics and Sleep in Australian Adults by Shannon L. Edmed, M. Mamun Huda, Cassandra L. Pattinson, Kalina R. Rossa and Simon S. Smith in Health Education & Behavior
Supplemental Material
sj-docx-3-heb-10.1177_10901981231177687 – Supplemental material for Perceived Neighborhood Characteristics and Sleep in Australian Adults
Supplemental material, sj-docx-3-heb-10.1177_10901981231177687 for Perceived Neighborhood Characteristics and Sleep in Australian Adults by Shannon L. Edmed, M. Mamun Huda, Cassandra L. Pattinson, Kalina R. Rossa and Simon S. Smith in Health Education & Behavior
Supplemental Material
sj-docx-4-heb-10.1177_10901981231177687 – Supplemental material for Perceived Neighborhood Characteristics and Sleep in Australian Adults
Supplemental material, sj-docx-4-heb-10.1177_10901981231177687 for Perceived Neighborhood Characteristics and Sleep in Australian Adults by Shannon L. Edmed, M. Mamun Huda, Cassandra L. Pattinson, Kalina R. Rossa and Simon S. Smith in Health Education & Behavior
Footnotes
Author Contributions
Shannon Edmed: Writing—original draft (lead); Conceptualization (equal); Methodology (equal).
M. Mamun Huda: Formal analysis (lead); Visualization (lead); Conceptualization (equal); Methodology (equal); Writing—review & editing (equal).
Cassandra Pattison: Conceptualization (equal); Writing—review & editing (equal).
Kalina Rossa: Conceptualization (equal); Writing—review & editing (equal).
Simon Smith: Supervision (lead); Conceptualization (equal); Methodology (equal); Writing—review & editing (equal).
Authors’ Note
This article uses unit record data from Household, Income and Labour Dynamics in Australia Survey [HILDA] conducted by the Australian Government Department of Social Services (DSS). The findings and views reported in this article, however, are those of the author[s] and should not be attributed to the Australian Government, DSS, or any of DSS’ contractors or partners. DOI: 10.26193/PTKLYP.
Consent to Participate
All participants provided written informed consent.
Declaration of Conflicting Interests
The author(s) declared no potential conflicts of interest with respect to the research, authorship, and/or publication of this article.
Ethical Considerations
Ethics approval for HILDA were obtained from the University of Melbourne Human Research Ethics Committee. We received approval to use HILDA data for the current study from the Department of Social Services. This study included research involving human participants.
Funding
The author(s) disclosed receipt of the following financial support for the research, authorship, and/or publication of this article: This research was supported by the Australian Government through the Australian Research Council’s Center of Excellence for Children and Families over the Life Course (Project ID CE200100025).
References
Supplementary Material
Please find the following supplemental material available below.
For Open Access articles published under a Creative Commons License, all supplemental material carries the same license as the article it is associated with.
For non-Open Access articles published, all supplemental material carries a non-exclusive license, and permission requests for re-use of supplemental material or any part of supplemental material shall be sent directly to the copyright owner as specified in the copyright notice associated with the article.