
Abstract
Keywords
Key Points
Objective jump height benchmarks can help ballet teachers calibrate their assessments.
Jump height relates to teacher ratings but doesn’t fully determine them, as teachers also integrate aesthetic elements like control and fluidity.
A 13-year-old female achieves high ratings at 28 cm, a 17-year-old female at 29 cm, while males need 30 cm (age 12) or 38 cm (age 17).
Introduction
Jumping is a fundamental motor skill central to athletic development and vocational dance training. Within the fundamental motor skill (FMS) framework, 1 competence in locomotor abilities such as jumping supports broader physical activity participation and forms the foundation for more refined, domain-specific skills.1-3 Jumping performance is multifaceted, influenced by neuromuscular coordination and stretch-shortening cycle optimization beyond strength alone.4-6
Among domains requiring advanced jumping proficiency, vocational ballet represents a particularly demanding context with jumping practiced daily, and students’ training hours reaching up to 30 hours per week. 7 The jumping load may reach up to 270 jumps per class, ranging from small bounces to maximal complex efforts. 8 As the students progress, both the jumping load and the complexity of the jumps increase. Blanco and colleagues demonstrated that countermovement jump (CMJ) height and reactive strength index correlate with grand jeté performance, suggesting that mechanical power measured via standardized CMJ relates to balletic jumping execution. 9
Despite jumping’s centrality, physiological metrics are rarely included in routine dancer assessments, contributing to scarce reference values and an inability to evaluate performance against normative benchmarks. 10 Without objective data, teachers and students rely on how jumps feel or look, perceptual appraisals, central to pedagogy but whose accuracy and relationship to objective measures remain largely unexamined in young dancers.
Research in related aesthetic sports provides relevant context for interpreting perception-performance relationships. In gymnastics, coach ratings show moderate-to-strong correlations with competition scores but exhibit systematic biases, with coaches rating their own athletes more favourably. 11 Figure skating demonstrates better inter-rater reliability for technical elements than artistic components. 12 Athlete self-assessments often deviate from coach ratings and objective metrics, with patterns varying by experience, sex, and domain. 13 These findings suggest experienced observers make valid judgements, but perceptual ratings don’t fully correspond to objective measures.
Establishing relationships between subjective ratings and objective measures bridges the gap between scientific assessment and pedagogical practice. While laboratory testing provides precise, reproducible metrics for tracking development, 14 these methods remain underutilized in coaching contexts where observational assessment dominates due to practical constraints. 15 If perceptual ratings demonstrate meaningful correspondence with objective measures, teachers gain confidence their judgements align with quantifiable indicators, potentially motivating periodic objective testing to calibrate observation. 16 In the dance context specifically, the absence of objective benchmarks creates challenges for translating teachers’ subjective assessments into actionable training targets. To bridge the gap between dance educators and sport scientists, practical tools could translate the familiar 1 to 5 performance ratings into physical benchmarks (in centimeters). These “teacher-anchored thresholds” would clarify performance expectations, help identify students needing targeted strength training, and create a shared language for youth development programs. 17
This exploratory study, therefore, investigated how perceptual ratings reflect objective jump performance in adolescent ballet dancers. CMJ height provides an objective measure of vertical jump performance but does not capture all aspects of jump quality that teachers may consider. For this reason, moderate rather than perfect correspondence between ratings and CMJ was anticipated. Specifically, the study aimed to produce teacher-anchored CMJ thresholds that could provide sex- and age-specific benchmarks for calibrating teacher observations, setting training goals, and monitoring student progress in applied dance settings. We hypothesized that: (1) teacher and student ratings (1-5 scale) would be positively associated with CMJ performance, with moderate effect sizes expected given ratings likely incorporate elements beyond vertical displacement; and (2) student-teacher ratings would show partial agreement with systematic differences across developmental stages. As an exploratory aim, receiver operating characteristic (ROC) analysis was used to derive data-driven cut-points that classify higher versus lower CMJ performers within sex- and age-stratified groups. Stratifying analyses by sex and year-group accounted for systematic age-related increases in jump performance.
Methods
Study Design
A cross-sectional, single-session study was conducted in the second term (January-April) of an academic year in a full-time vocational ballet school in the United Kingdom, with adolescent dancers aged between 11 and 19 years old. Ethical approval was attained from the University of Wolverhampton ethics committee (12/20/NK1/UOW).
Participants
An open invitation for participation was verbally given to 8 year-groups (n = 166) at the school, with an age range 11 to 19 years. The students needed to be injury free at the time of the data collection, therefore any students who were either on modified or no participation were excluded All the ballet teachers consented to participate in the study. Parental informed consent and student assent was attained from all those who participated in the study.
Procedure
Prior to formal testing, the ballet teachers at the school (n = 8 teachers) were informally consulted verbally via informal discussions to identify key elements they considered when evaluating jumping ability. Teachers consistently emphasized time in the air (jump height) and springiness during repetitive jumps (reactive ability), which informed the selection of CMJ height and reactive strength index (RSI) as outcome measures. All teachers held professional teaching qualifications and had extensive experience (10+ years) teaching at vocational level.
Anthropometry was recorded before performance testing: stature was measured to the nearest millimeter with a portable stadiometer (SECA 213, Hamburg, Germany), and body mass to the nearest gram using a wireless column scale (SECA 704s). Leg length (cm) was measured from the anterior superior iliac spine (ASIS) to the lateral malleolus using a standard measuring tape in supine position. Testing began with a dynamic warm-up consisting of 2 minutes of light rope skipping, followed by dynamic stretches targeting the major lower-limb muscle groups (i.e., quadriceps, hamstrings, calves). All participants were familiar with the tests as they were part of their fitness screening at the beginning of the academic year.
The same teachers who were consulted about jumping ability also assessed the students in their regular classes, providing ratings independently from the objective testing. During a regular ballet class held in one of the school’s studios on a sprung floor, with students wearing standard ballet shoes, teachers observed each student performing two standardized jump sequences to pre-recorded music at an agreed tempo. The music was recorded by a school pianist at a tempo appropriate for the following sequences:
Maximum jump height sequence: Échappé sauté change ×3 followed by changement ×2. Tempo: 3/4
Reactive strength sequence: starting in fifth (ballet position), then sautés in first (ballet position) ×4 followed by changements ×4. Tempo: 2/4
The description of the sequences is based on the Royal Academy of Dance syllabus. 18 The sequences were assessed separately with a different tempo. Following these observations, teachers rated each student’s jumping ability on a 5-point Likert scale (1 = poor, 5 = excellent) immediately after the sequences. Teachers were instructed to provide an overall judgement of jump quality based on the observed performances. Each student was rated by their regular class teacher, resulting in ratings from eight different teachers across the sample. To maintain ecological validity, no additional rating anchors or exemplars were provided beyond the scale endpoints, allowing teachers to apply their professional judgement as they would in routine pedagogical assessment. Teachers rated students independently in groups of two or three students at a time, depending on the size of their class, without consultation between raters. While this approach prioritizes ecological validity over controlled inter-rater reliability, it reflects authentic decision-making in applied dance settings where teachers routinely evaluate students using implicit, experience-based criteria.
CMJ jump height and the reactive strength index (RSI) were assessed using the Optojump Next system (Microgate, Bolzano, Italy; software version 1.10.19). Participants performed three barefoot countermovement jumps (CMJ) 19 and three drop jumps (DJ) from a 30 cm box in a non-fatigued state. For DJs, they stepped off the box without pushing, kept hands on hips, landed with both feet together, and rebounded immediately to maximize height. Standard cues were: “the floor is hot, on contact jump as high and as fast as you can.” Trials with contact time ≥0.30 s were discarded and repeated after the prescribed rest. The Optojump Next recorded flight time and contact time; CMJ height was derived from flight time, and RSI was calculated as jump height (m) ÷ contact time (s). Rest intervals were 30 s between CMJs and 60 s between DJs. The highest CMJ and mean RSI across three trials were retained for analysis. 19
Following the jump testing, students self-rated their performance on each of the two jump tasks (CMJ and DJ) using the same 5-point Likert scale (1 = poor, 5 = excellent). They did so without knowledge of their teacher’s ratings or their objective CMJ scores, ensuring that all ratings were collected independently. For this analysis, the students’ rating of their CMJ performance was used as the self-rating measure. CMJ height was selected as the primary outcome for this analysis due to its direct correspondence with the “time in the air” element identified by teachers and its stronger relationship with teacher ratings during preliminary examination. RSI results are reported in Supplemental Materials.
Statistical Analyses
All analyses focused on CMJ height as the primary outcome; parallel RSI analyses are in Supplemental Materials. Analyses were stratified by sex and year-group bands (Y7-9, Y10-11, Y12-14) to account for age-related increases in jump performance while maintaining adequate sample sizes for threshold estimation (n = 12-37 per group). Outliers were flagged using Tukey’s rule (1.5 × IQR) and retained unless attributable to error, with sensitivity analyses excluding flagged points.
Teacher-anchored thresholds
Adjacent-category ROC analysis mapped teachers’ 1 to 5 ratings to CMJ cut-points (cm) within each sex-by-year group. This approach identifies the CMJ values that best separate adjacent rating categories, translating teachers’ subjective judgements into objective performance benchmarks. For each boundary k = 2, 3, 4, 5, ROC curves discriminated rating ≥k versus rating ≤k−1, with optimal thresholds (tk) determined by Youden’s J (Sensitivity + Specificity-1). This yielded four ordered cut-points partitioning CMJ into five teacher-anchored bands. Thresholds were constrained to be non-decreasing within groups. For each boundary, the Area Under the Curve (AUC) with 95% Confidence Intervals (Cis), sensitivity/specificity at tk, and bootstrap 95% CIs for threshold uncertainty were reported. The Receiver Operating Characteristic (ROC) direction was verified such that higher CMJ corresponds to higher ratings (AUC ≥ 0.5).
Comparison of discriminative ability across groups
DeLong tests were used to compare AUC values between sexes within the same year-group and between year-groups within the same sex, testing whether CMJ-rating correspondence differed systematically by developmental stage or sex.
Agreement analyses
Student-teacher agreement on the 1 to 5 scale was evaluated using quadratically weighted Cohen’s k and 5 × 5 confusion matrices. Directional bias was tested using Wilcoxon signed-rank tests on paired differences (Teacher-Student), reporting median difference, test statistics, and effect size r. Because fine-grained distinctions on a 5-point scale may be difficult for both students and teachers to make reliably, and because binary distinctions around competency thresholds have greater practical utility for progression decisions, ratings were collapsed to (i) high (4-5) versus not-high (1-3) and (ii) excellent (5) versus not-excellent (1-4), with McNemar’s tests comparing paired 2 × 2 tables. Discordant counts, McNemar’s χ2, paired odds ratios with 95% CIs, binary Cohen’s k (with bootstrap CIs), and percent agreement were reported. Because k is sensitive to marginal prevalence, k alongside percent agreement was also reported.
Additional analyses
Cumulative link (proportional-odds) models with CMJ as predictor confirmed ROC-derived thresholds. AUCs were compared between sexes and year-groups using DeLong tests. Sensitivity analyses examined: (i) leg-length adjustment via residualized CMJ; (ii) teacher clustering effects using cluster-robust CIs; (iii) alternative dichotomies; (iv) outlier exclusion; and (v) RSI/anthropometry as covariates. Full sensitivity results are available upon request. Analyses used R (v2024.12.1) with pROC, binom, and MASS/ordinal packages.
Results
Participant Characteristics
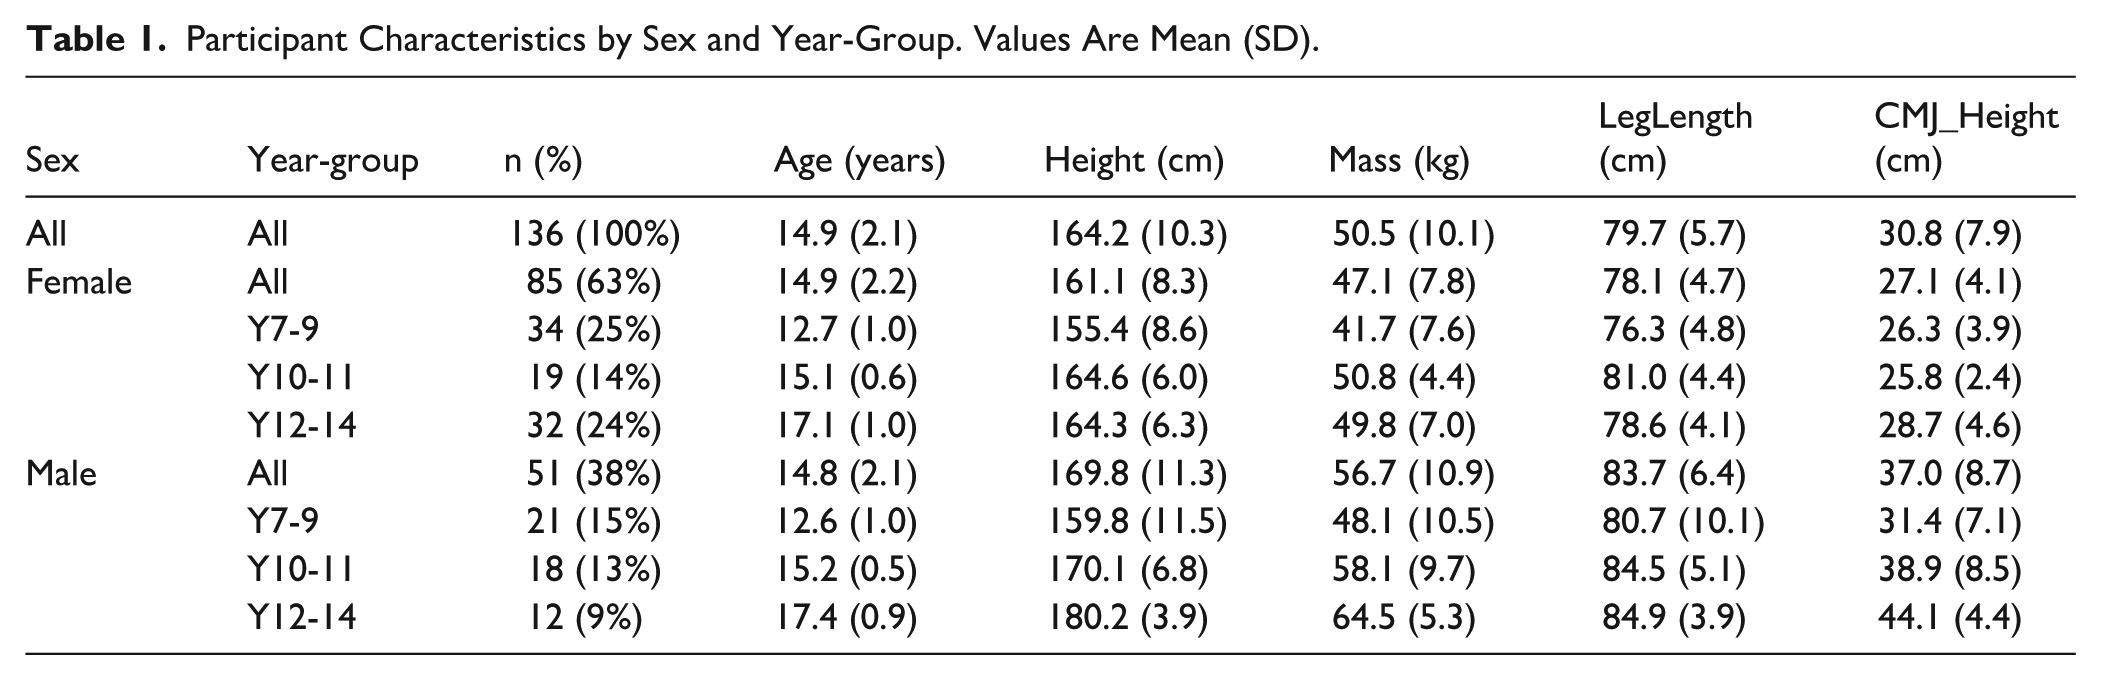
Of the 166 students invited to participate, 136 consented and completed CMJ testing, yielding a participation rate of 82% (85 females, 51 males). Eleven students from this cohort were absent on the day of in-class teacher assessments and were therefore excluded from analyses involving teacher ratings. Consequently, the final analytic sample with complete paired data was 125 students, representing 92% of those tested and 75% of the originally invited population. One hundred and twenty-five students were included in ROC analyses, distributed across 3 year-group bands (Years 7-9: n = 51; Years 10-11: n = 32; Years 12-14: n = 42). Mean (±SD) CMJ height was 27.1 (±4.1) cm for females and 37.0 (±8.7) cm for males, with values increasing across year-groups in both sexes (range: 14.7-65.9 cm overall). Participant characteristics by sex and year-group are presented in Table 1, including age, height, body mass, leg length, and CMJ performance. Visual inspection of CMJ distributions identified no implausible values; all data were retained for primary analysis (sensitivity analyses excluding statistical outliers are reported in the Supplemental Material).
Participant Characteristics by Sex and Year-Group. Values Are Mean (SD).
Teacher-Anchored Centimeter Thresholds
Teacher-anchored CMJ thresholds for adolescent ballet dancers increased systematically with age and were higher in males than females (Table 2, Figure 1). For females, thresholds distinguishing high jump performance (rating ≥4) ranged from 28.1 cm in Years 7-9 to 29.0 cm in Years 12-14. Male thresholds for the same rating boundary were higher: 30.0 cm (Y7-9), 32.5 cm (Y10-11), and 38.0 cm (Y12-14). At the upper end, a rating of excellent (≥5) was associated with a CMJ of 29.1 cm for Y7-9 females, rising to 31.8 cm for Y12-14 females, while for males the corresponding values were 49.6 cm (Y7-9) and 43.0 cm (Y12-14). In groups where certain rating categories were absent or insufficiently represented, corresponding boundaries could not be estimated and are omitted from Table 2.
Teacher-Anchored CMJ Cut-Points (cm) by Sex and Year-Group with Bootstrap 95% CIs, ROC AUC with 95% CIs, and Sensitivity/Specificity at the Selected Cut-Point.
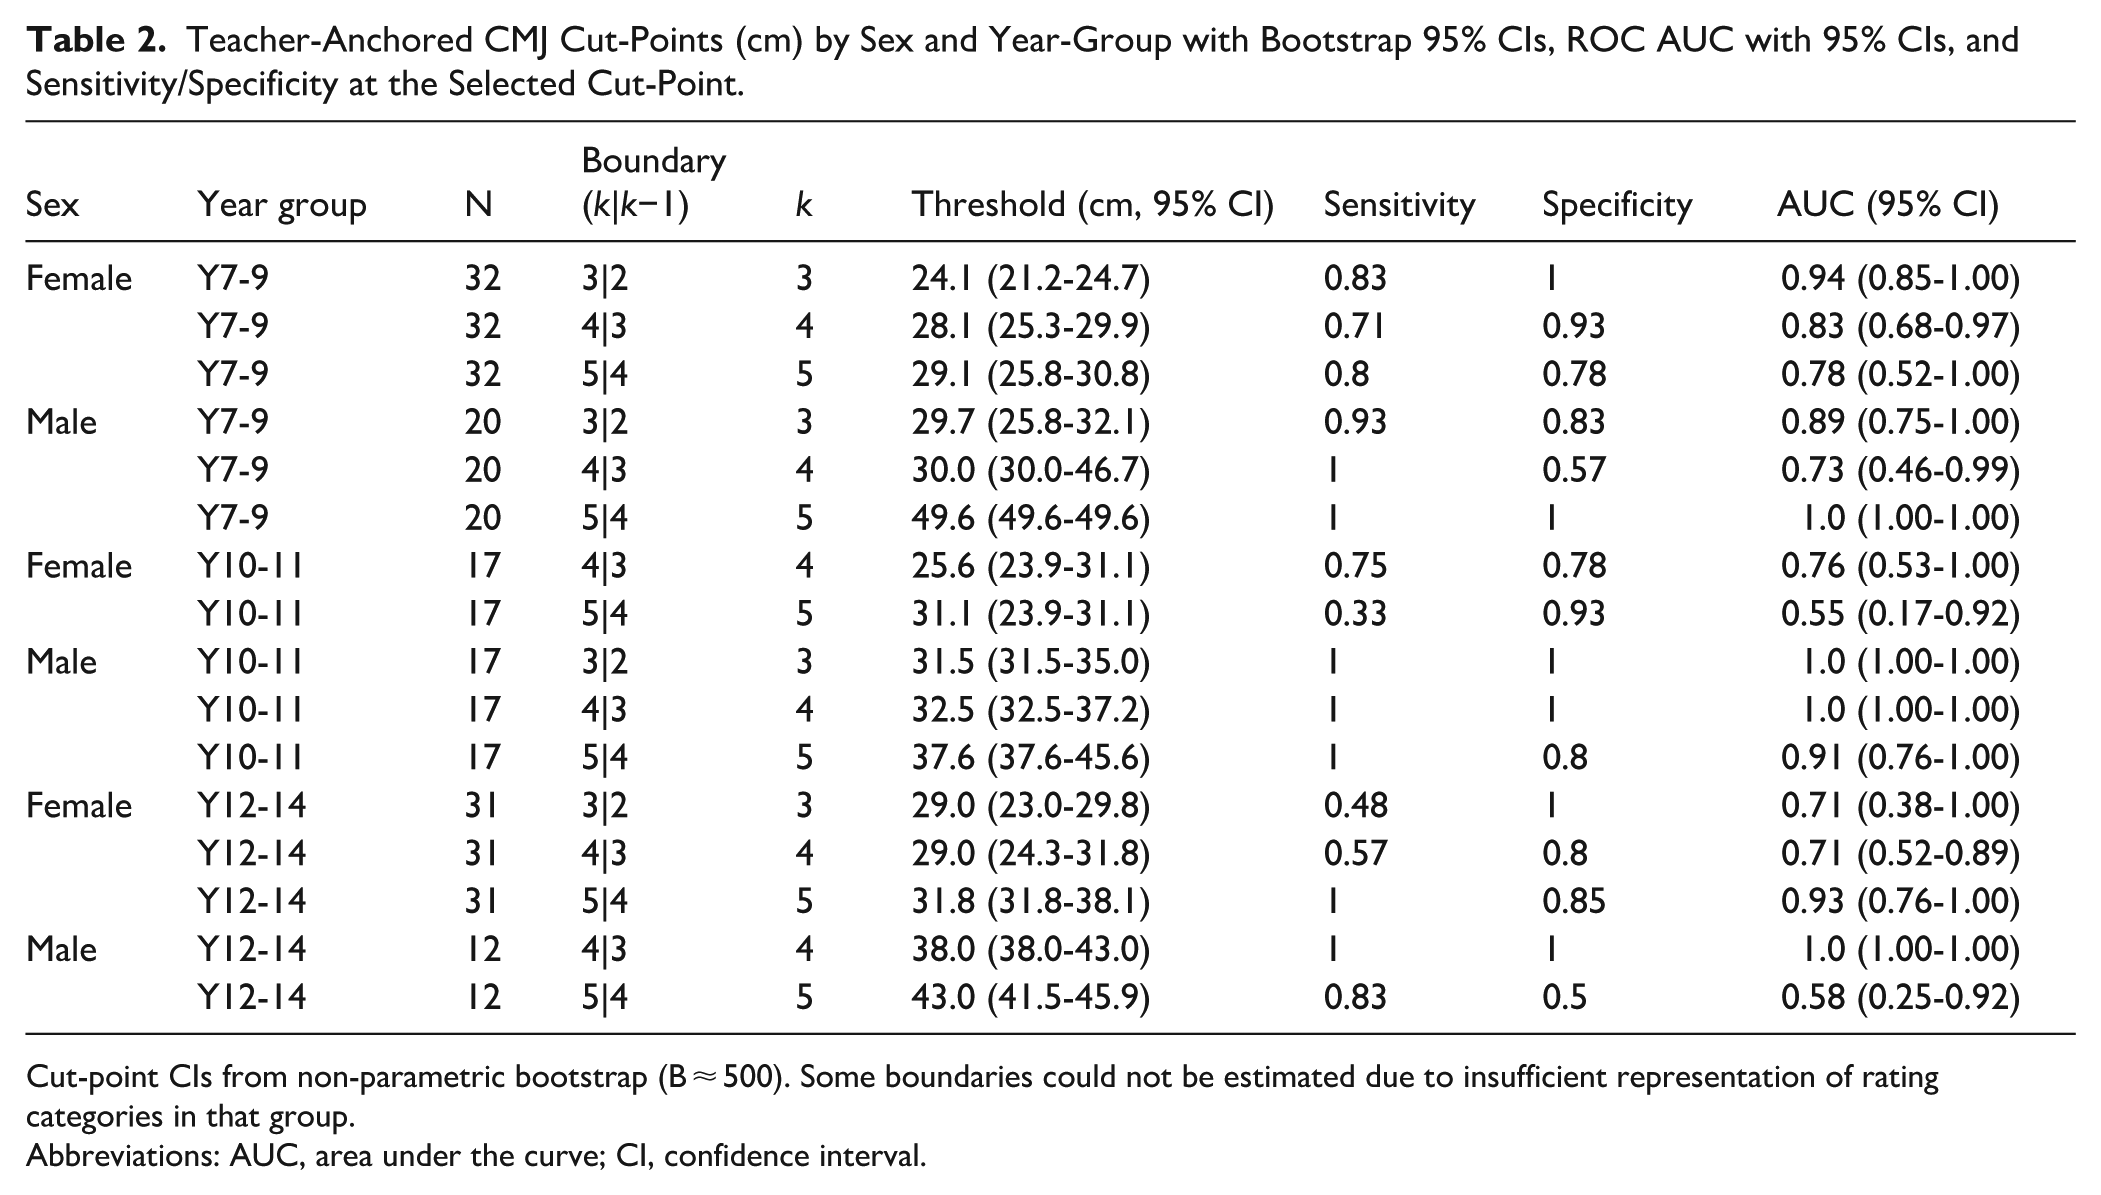
Cut-point CIs from non-parametric bootstrap (B ≈ 500). Some boundaries could not be estimated due to insufficient representation of rating categories in that group.
Abbreviations: AUC, area under the curve; CI, confidence interval.
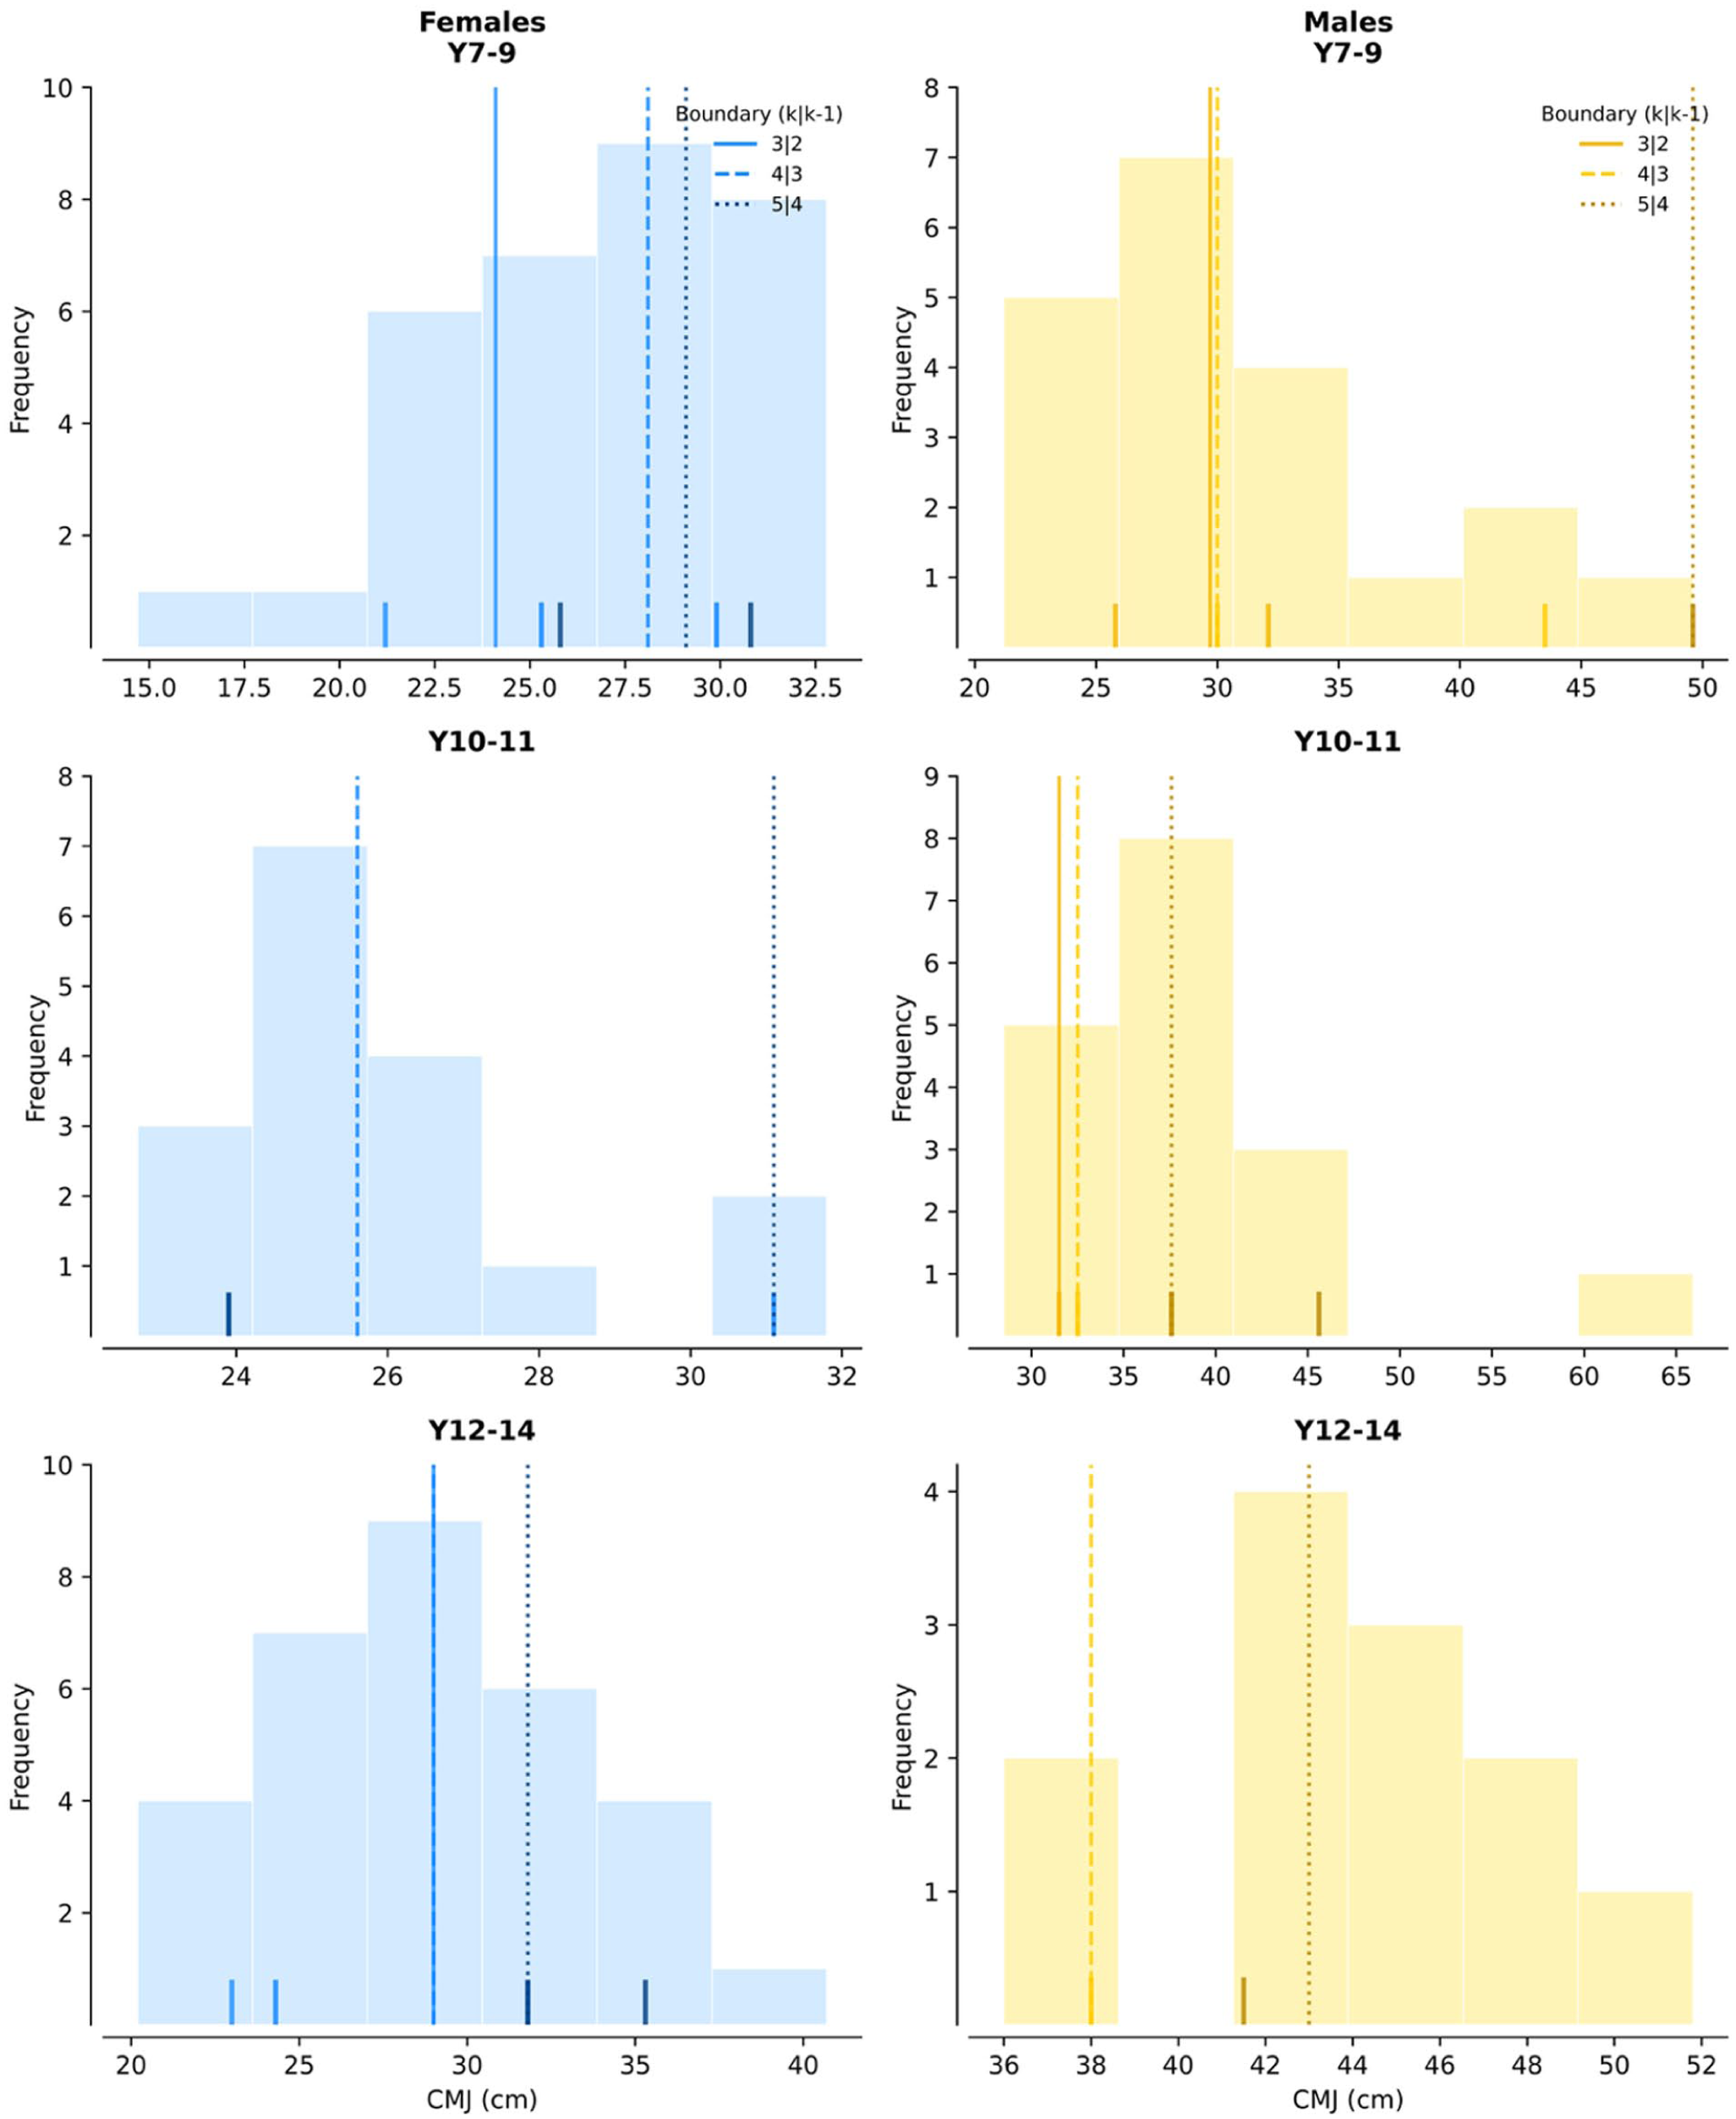
CMJ histograms with vertical teacher-anchored cut-points and CI ticks for each sex × year group.
These sex- and age-specific benchmarks mean that a 13-year-old female jumping 28 cm would exceed the threshold for “high” performance (rating ≥4: 28.1 cm), whereas a 17-year-old male at the same absolute height would fall below teacher expectations for that rating level (threshold: 38.0 cm). At the upper end, achieving “excellent” performance (rating 5) required 29.1 cm for Y7-9 females but 49.6 cm for Y7-9 males.
ROC analyses demonstrated that CMJ height discriminated meaningfully between adjacent teacher rating categories, with AUC values ranging from 0.55 to 1.00 across estimable boundaries (Table 2). Discrimination was strongest in younger groups (F Y7-9: AUCs 0.78-0.94; M Y10-11: AUCs 0.91-1.00) and more variable in other groups (F Y10-11: 0.55-0.76; F Y12-14: 0.71-0.93; M Y7-9: 0.73-1.00; M Y12-14: 0.58-1.00). Perfect discrimination (AUC = 1.00) occurred at several boundaries in male groups, reflecting complete separation of CMJ values between rating categories at these specific cut-points. Bootstrap 95% CIs for individual thresholds ranged from 2-8 cm in most cases; where CIs for adjacent thresholds overlap, those CMJ ranges represent approximate bands rather than strict cut-points (Figure 1).
Student-teacher agreement on the full 1 to 5 scale was summarized with quadratically weighted k and visualized with 5 × 5 contingency heatmaps. Agreement was partial across groups, with visible patterns of both under- and over-rating.
Student-Teacher Agreement
Full ordinal scale (1-5)
Student-teacher agreement on the full 1 to 5 scale was evaluated using quadratically weighted Cohen’s kw and visualized with 5 × 5 confusion matrices (Figure 2). Weighted k values ranged from 0.05 to 0.55 across groups: F Y7-9 kw = 0.41; F Y10-11 kw = 0.05; F Y12-14 kw = 0.55; M Y7-9 kw = 0.40; M Y10-11 kw = 0.33; M Y12-14 kw = 0.17. These values indicate slight to moderate agreement, with strongest agreement in older females (F Y12-14: kw = 0.55, moderate) and weakest in mid-adolescent females (F Y10-11: kw = 0.05, slight agreement). The confusion matrices reveal visible patterns of both under- and over-rating, with disagreement typically within one category rather than extreme discordance.
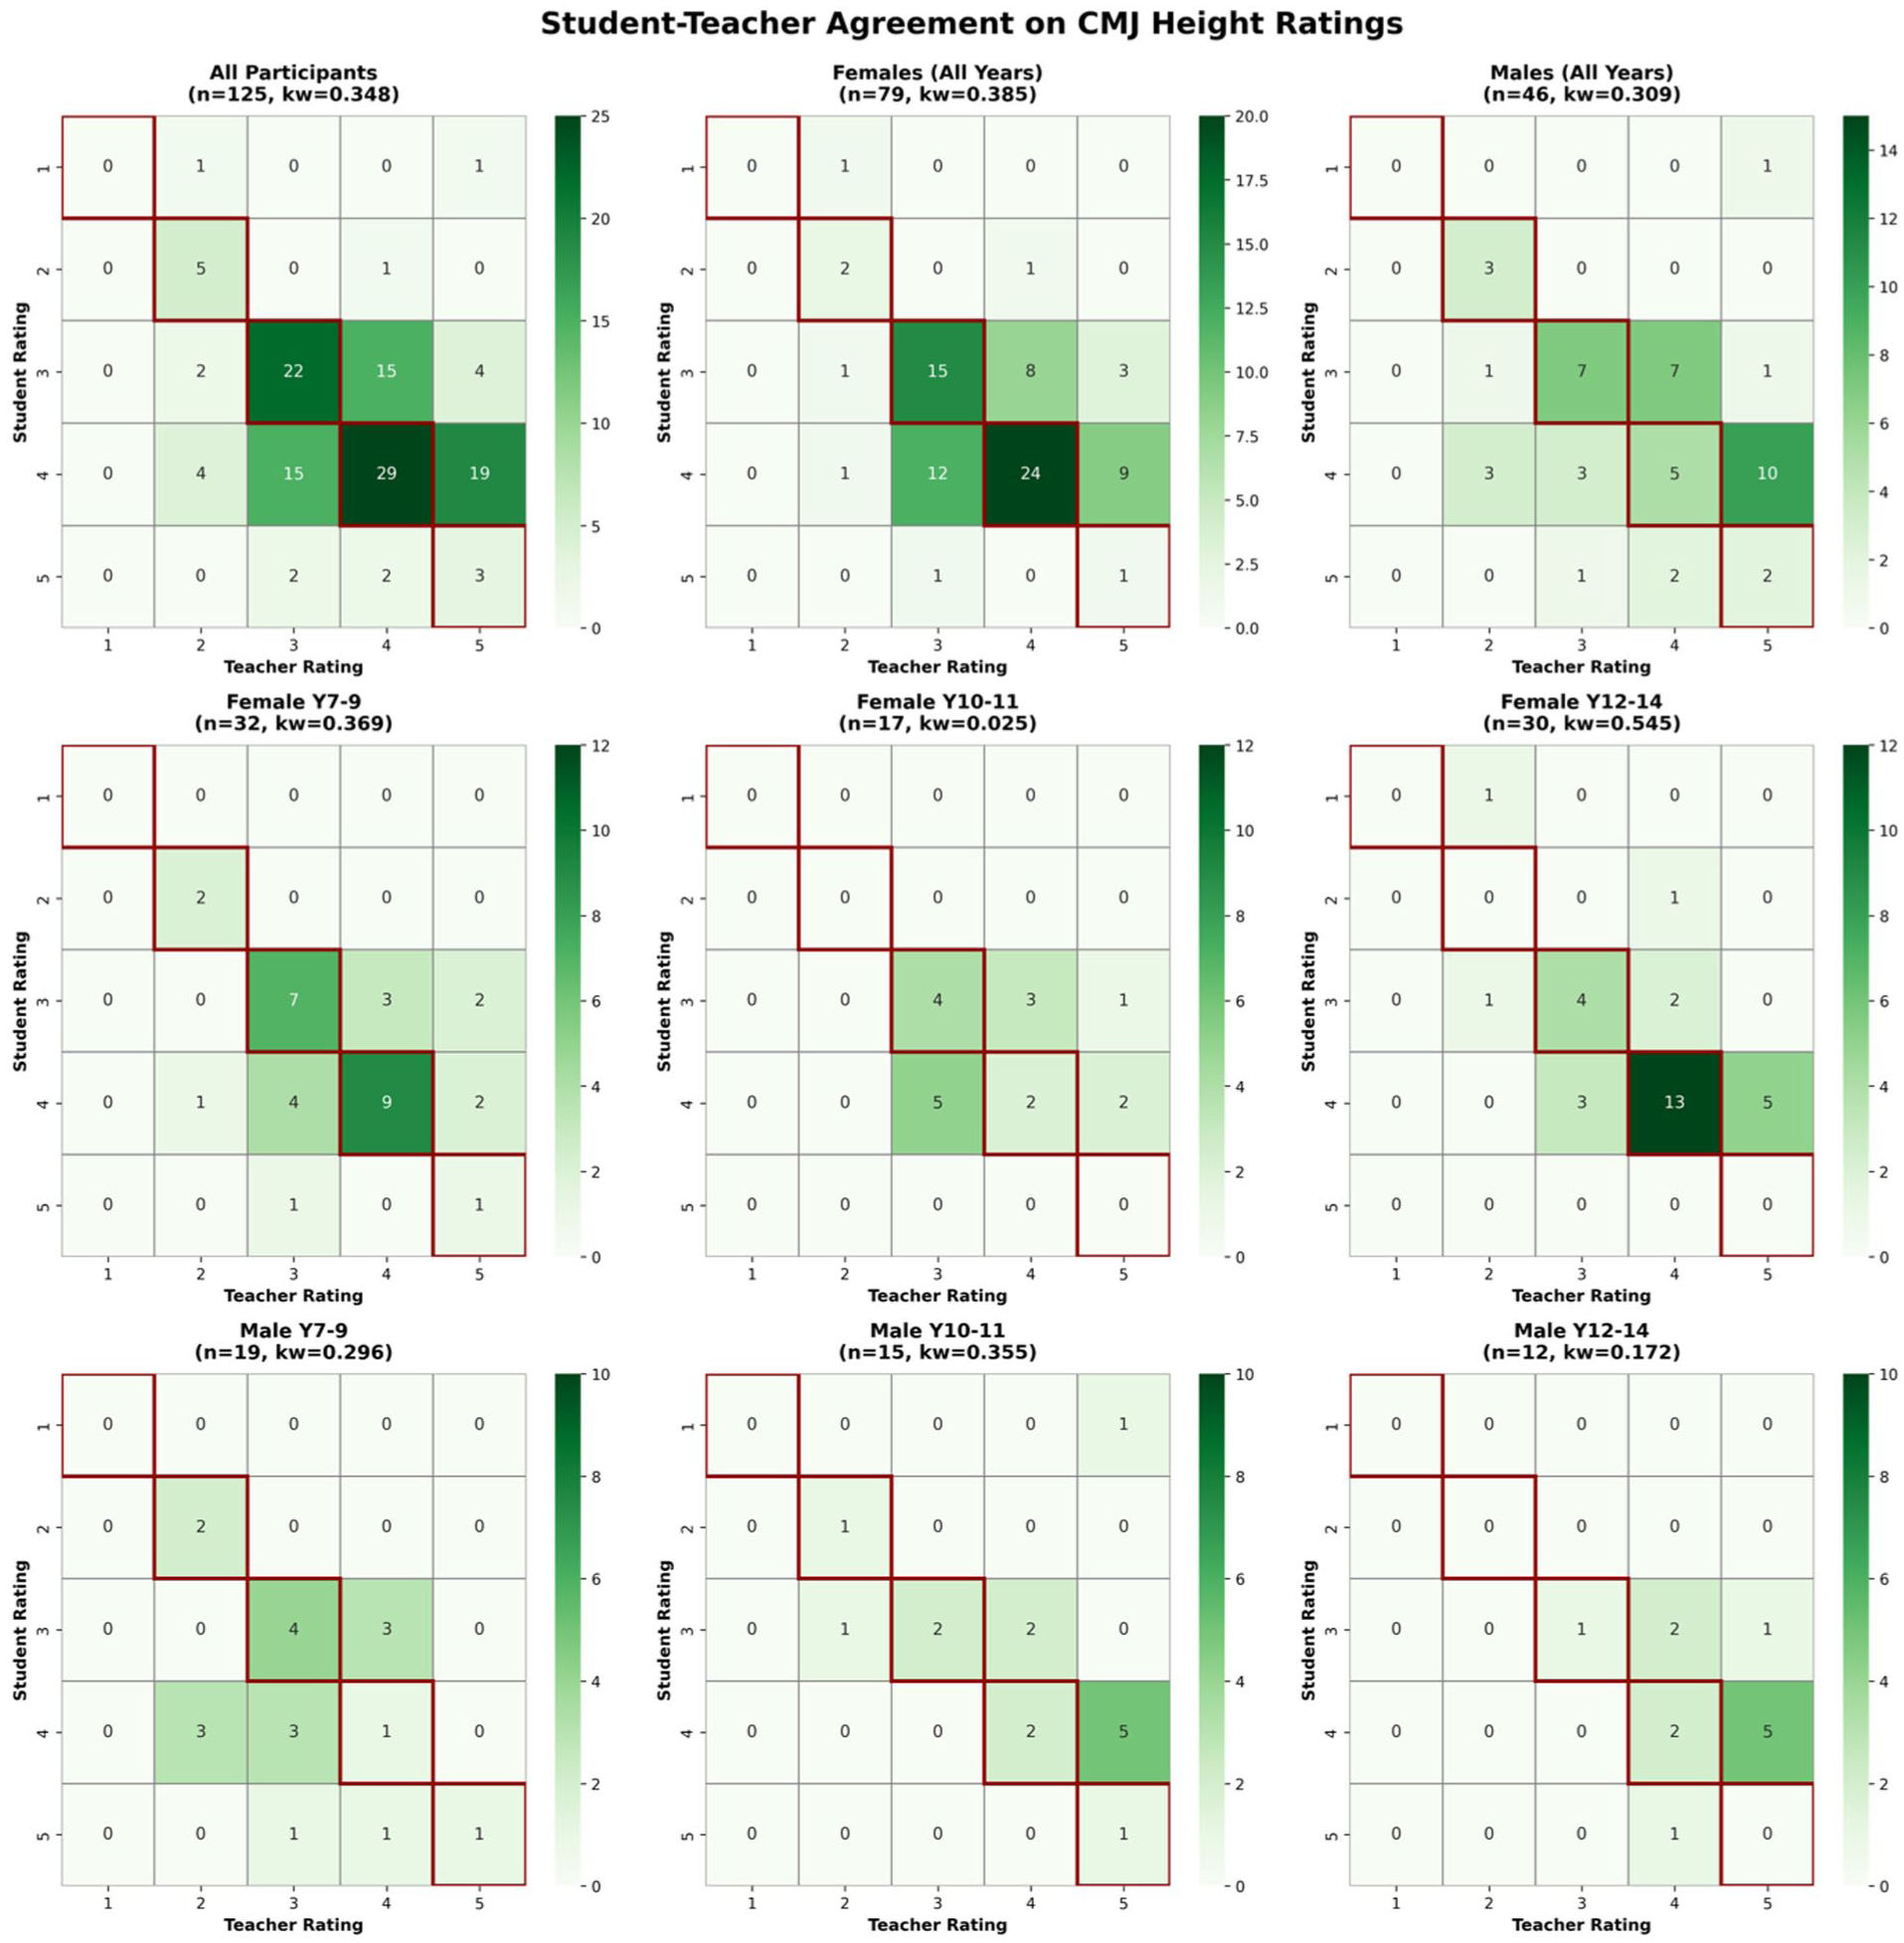
Student (rows) × teacher (columns) heatmaps showing cell counts for the full sample (top left) and stratified by sex and year-group.
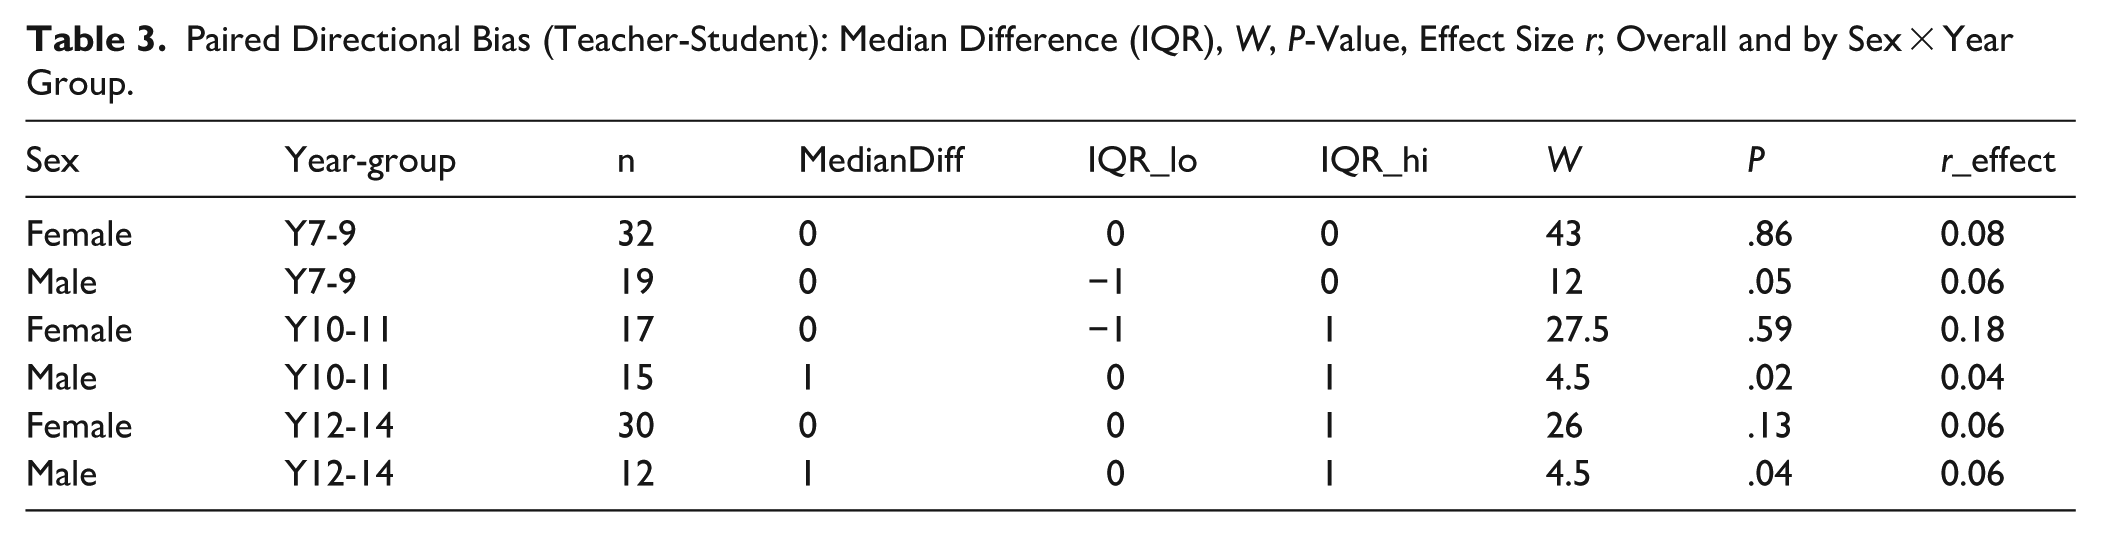
Directional bias on the full 1 to 5 scale (Wilcoxon signed-rank tests, Table 3) showed that teachers rated older males approximately one category higher than self-ratings (M Y10-11: median difference = 1, P = .02; M Y12-14: median difference = 1, P = .04), while other groups showed no systematic directional bias.
Paired Directional Bias (Teacher-Student): Median Difference (IQR), W, P-Value, Effect Size r; Overall and by Sex × Year Group.
Binary agreement: High (4-5) versus Not-high (1-3). Ratings were collapsed to assess agreement on whether students achieved high performance (ratings 4-5) versus lower performance (1-3). Agreement ranged from 47% to 80% across groups (Table 4). Chance-corrected agreement (k) was near chance in F Y10-11 (k = −0.06, 95% CI −0.55 to 0.42) and M Y7-9 (k = −0.03, −0.46 to 0.38); fair in F Y7-9 (k = 0.31, −0.04 to 0.62) and M Y12-14 (k = 0.31); and moderate to substantial in M Y10-11 (k = 0.59, 0.19 to 1.00) and F Y12-14 (k = 0.52, 0.13 to 0.80). The direction of disagreement varied: in older males teachers rated high more often than students (M Y10-11: FP 0 vs FN 3; M Y12-14: FP 0 vs FN 3), whereas in younger groups students rated high more often than teachers (F Y7-9: FP 6 vs FN 5; M Y7-9: FP 7 vs FN 3).
Paired Binary Agreement for High (4-5) Versus Not-High (1-3): TP/FP/FN/TN Counts, Percent Agreement, Binary k with Bootstrap 95% CIs, by Group.
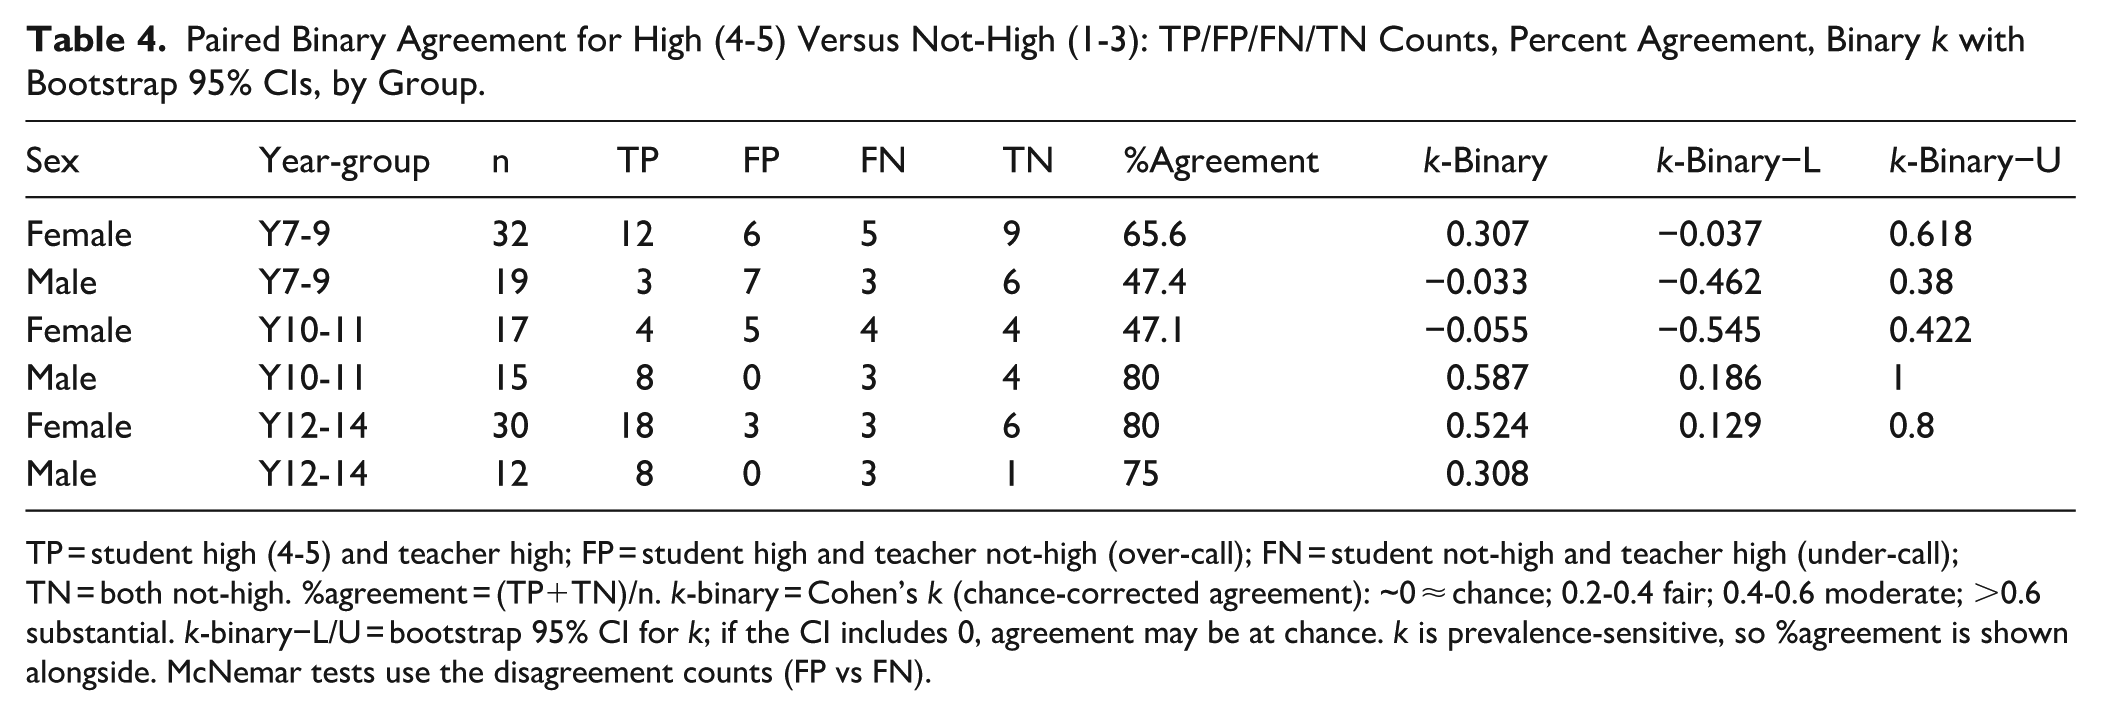
TP = student high (4-5) and teacher high; FP = student high and teacher not-high (over-call); FN = student not-high and teacher high (under-call); TN = both not-high. %agreement = (TP+TN)/n. k-binary = Cohen’s k (chance-corrected agreement): ~0 ≈ chance; 0.2-0.4 fair; 0.4-0.6 moderate; >0.6 substantial. k-binary−L/U = bootstrap 95% CI for k; if the CI includes 0, agreement may be at chance. k is prevalence-sensitive, so %agreement is shown alongside. McNemar tests use the disagreement counts (FP vs FN).
Binary agreement: Excellent (5) Versus Not-excellent (1-4). When ratings were collapsed to isolate the excellent category (rating 5) versus all others (1-4), agreement ranged from 42% to 90% across groups (Table 5). Teachers assigned excellent ratings more frequently than students rated themselves, with this asymmetry most pronounced in males Years 10-11 (6 students rated excellent by teachers only vs 0 by students only; χ2 = 4.17, P = .03). Female groups showed similar directional trends but did not reach statistical significance (e.g., F Y12-14: 5 vs 0; χ2 = 3.2, P = .06). In males Years 7-9, the pattern reversed (0 vs 2; χ2 = 0.5, P = .50) but was not significant.
Agreement Results for Excellent (5) Versus Not (1-4), Overall and by Year Group; Teacher-Only Versus Student-Only Discordance and Paired OR (95% CI).
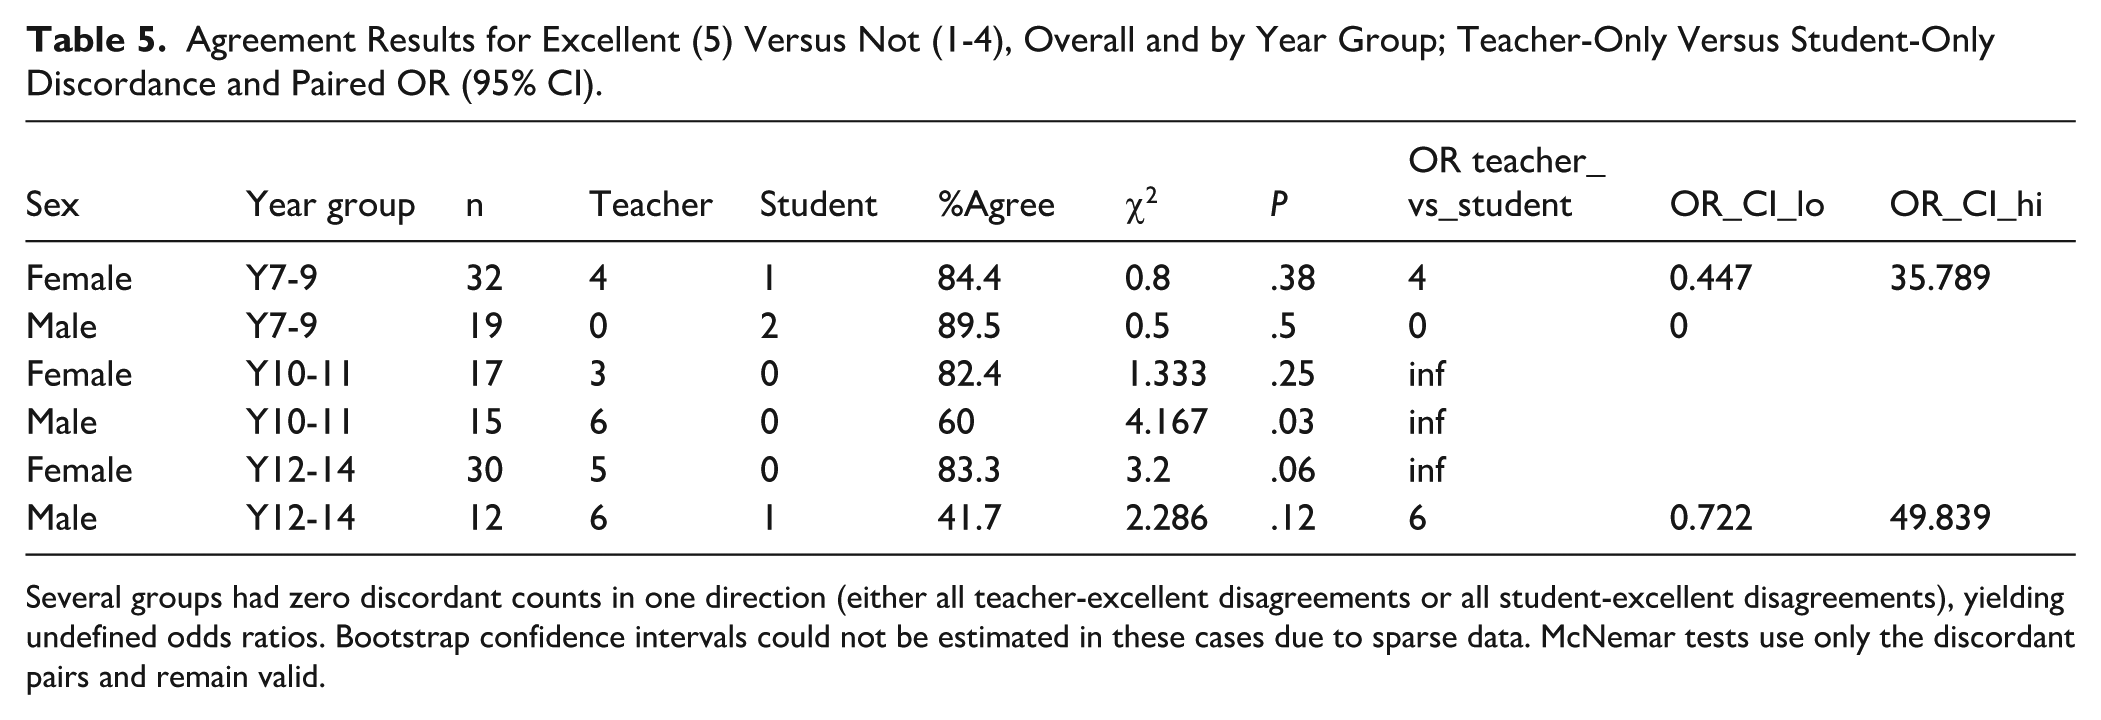
Several groups had zero discordant counts in one direction (either all teacher-excellent disagreements or all student-excellent disagreements), yielding undefined odds ratios. Bootstrap confidence intervals could not be estimated in these cases due to sparse data. McNemar tests use only the discordant pairs and remain valid.
Parallel ROC analyses were conducted using teacher rebound ratings (assessing springiness/reactive ability) and objective RSI measures. RSI thresholds for high performance (rating ≥4) ranged from 1.80-2.09 for females and 2.26-2.58 for males across year-groups, with AUC values ranging from 0.46 to 0.98 (Supplemental Material). Student-teacher agreement on rebound ratings showed similar patterns to height ratings but with generally lower concordance: percent agreement ranged from 38% to 59% for high (4-5) versus not-high (1-3) classifications, compared to 52% to 81% for height ratings. Agreement for the excellent (5) versus not-excellent (1-4) dichotomy ranged from 56% to 88% for rebound ratings versus 42% to 92% for height ratings. As with height ratings, teachers more frequently assigned high rebound ratings than students self-rated (McNemar’s tests: P < .05 in multiple groups, see Supplemental Table SY). Given the greater variability in RSI discriminative ability and the marginal difference in correlations with overall teacher judgements (RSI: r = 0.51 vs CMJ: r = 0.55, P < .001 for both), subsequent discussion focuses on CMJ-derived thresholds as the primary practical benchmarks, while acknowledging that springiness represents a distinct but related dimension of jump quality that teachers consider. Complete RSI threshold estimates, agreement matrices, and sensitivity analyses are provided in Supplemental Materials.
Sensitivity Analyses
Sensitivity analyses examined the stability of primary findings. Adjusting CMJ for leg length via residualization produced nearly identical cut-points (mean shift <1.5 cm). Cluster-robust confidence intervals accounting for teacher clustering (n = 8) did not alter inferences. Excluding Tukey-flagged outliers (n = 26, 17% of sample) shifted thresholds by <2 cm on average without changing rank-ordering. Finally, cumulative link models including RSI, stature, and body mass as covariates attenuated CMJ coefficients modestly but did not reverse significance, indicating CMJ height as the primary driver of ratings. Full sensitivity results are provided in Supplemental Material.
Discussion
This study established sex- and age-specific CMJ thresholds anchored to teachers’ ordinal ratings of jump quality in adolescent ballet dancers and examined student-teacher agreement patterns. Three key findings emerged. First, teacher-referenced thresholds were higher in males than females and increased with age, consistent with sex- and maturation-related differences in vertical jump performance.7,10,20 Second, CMJ demonstrated moderate to excellent discriminative ability (AUCs 0.55-1.00) indicating that jump height contributes meaningfully to pedagogical judgements but does not fully determine them. Third, student-teacher agreement was partial and varied systematically: females showed slight-to-moderate agreement (kw = 0.05-0.55), while older males were rated approximately one category higher by teachers than by themselves (median difference = 1, P < .01).
The systematic rise in CMJ thresholds across year-groups (F Y7-9: 24.1 cm to F Y12-14: 31.8 cm; M Y10-11: 31.5-37.6 cm) aligns with normative developmental trajectories showing ~2 cm/year gains during adolescence and 15% to 20% higher male values.10,20 The systematic rise in CMJ thresholds across year-groups contrasts with an earlier cohort at this institution (2016-2017), where female dancers showed minimal development across adolescence (Y7-9: 23.9 cm; Y10-11: 23.6 cm; Y12-14: 25.0 cm). 7 The more typical developmental trajectory observed in the current female cohort may reflect changes in strength and conditioning programming implemented between data collection periods. However, both datasets are cross-sectional comparisons of different cohorts rather than longitudinal tracking of the same individuals, limiting causal inference about programming effects. DeLong tests revealed no significant differences in discriminative ability between sexes or year-groups (all P > .05), suggesting CMJ-rating correspondence is developmentally consistent despite absolute threshold shifts. This supports stratified, group-specific benchmarks rather than pooled cut-points.
The thresholds provide practical calibration tools: a 13-year-old female achieving 28 cm would be rated high (threshold ≥4: 28.1 cm), while a 16-year-old male at the same height would be not-high given higher expectations (threshold ≥3: 31.5 cm). These benchmarks make transparent what teachers implicitly consider when evaluating students at different stages, supporting equitable progression decisions and targeted training.
Teachers observed ballet-specific jumps (échappé sauté, changement) incorporating turnout, arm positions, and controlled landings, aesthetic elements absent in standardized parallel CMJ. That CMJ discriminates above chance (moderate to excellent AUCs) validates its utility, but teachers are evaluating more than vertical displacement. They presumably integrate how high students jump with how they produce that height: stiffness regulation, eccentric control, fluidity, elements that distinguish competent from expert performers, 9 but that CMJ cannot capture.
Agreement patterns revealed systematic biases rather than random disagreement. For females, agreement was modest across all age groups (kw = 0.05-0.55), with no consistent directional bias. The weakest agreement occurred in mid-adolescence (F Y10-11: kw = 0.05, slight), possibly reflecting a transitional period of growth in which rapid physical changes and shifting self-perceptions create calibration challenges. 21 Strongest agreement emerged in older females (F Y12-14: kw = 0.55, moderate), suggesting that experience and maturation improve alignment between self-assessment and teacher judgement. 13
For males, teachers consistently rated older students approximately one category higher than the students’ self-ratings (P < .01), an effect that was large in magnitude. This systematic under-rating aligns with self-critical tendencies in vocational dance training, where mirror-dominated environments and continuous correction cultivate harsh self-evaluation against internalized ideals exceeding realistic standards.22-25 This pattern may be more pronounced in older males if their training places a greater emphasis on jumping performance compared to that of females. Evidence from professional ballet dancers suggests that the mean duration of jumping sections is higher for males than females. 8 Whether this reflects adaptive perfectionism or maladaptive self-perception warrants further investigation.
Weighted kappa values (0.05-0.55) fall within the “slight to moderate” range typical of ordinal agreement studies, 26 suggesting that teacher-student calibration in dance resembles patterns observed in other judged sports where subjective evaluation is inherent.11,12 Binary analyses revealed improved agreement when dichotomizing around competency (high 4-5 vs not-high 1-3), suggesting students and teachers align more on whether proficient than how proficient. This has practical relevance: binary decisions may be more reliable than fine-grained ratings for communicating progress. Teachers applied excellent (5) more readily than students (OR = 6.5, P < .001), illustrating calibration challenges at the scale’s upper end.
Several boundaries in male groups showed perfect discrimination (AUC = 1.00), with no overlap in CMJ values between adjacent rating categories. While this demonstrates strong CMJ-rating correspondence at specific thresholds, small sample sizes (e.g., M Y12-14 n = 12) and wide confidence intervals (e.g., M Y7-9 4|3: 30.0-46.7 cm) suggest these estimates require validation in larger samples. Where discrimination is strong (AUC > 0.70) and confidence intervals are narrow (<5 cm), thresholds can guide specific training targets (e.g., “progress from 26 to 28 cm to meet Year 9 female rating ≥4”); where AUC is moderate or CIs are wide, thresholds serve as approximate reference points for identifying students substantially above or below age-appropriate expectations rather than precise cut-points for individual programming decisions.
From a measurement perspective, our thresholds derive from CMJ height obtained via Optojump Next, a photoelectric system demonstrating good concurrent validity and reliability versus force platforms. 27 This supports the use of centimeters as a practical reporting unit for teacher-anchored bands in applied settings where force platforms are unavailable.
Moreover, an important methodological consideration concerns the nature of RSI assessment and its correspondence with teacher ratings of springiness. Teachers observed students performing repeated jumps during petit allegro sequences (sautés ×4, changements ×4), which are characteristic of ballet class and emphasize rapid, repetitive stretch-shortening cycle activity with minimal ground contact times. In contrast, RSI was derived from single drop jumps from a 30 cm box, representing a maximal-effort protocol. Research demonstrates that RSI values obtained from repeated jump tests and single drop jumps capture different reactive strength qualities and cannot be used interchangeably. 28 Ballet dancers may express reactive abilities more effectively through the repetitive jump patterns characteristic of petit allegro and therefore a repetitive test like the 10/5 rebound jump test may be more appropriate. 29
Limitations and Future Directions
Several limitations warrant consideration. Stratification by sex and year-group was necessary to account for developmental differences in jumping capacity but resulted in modest sample sizes in some groups (range: n = 12-37). ROC analyses in smaller groups were sometimes based on few cases, producing unstable AUC estimates (occasionally approaching 1.00) and wide bootstrap confidence intervals (5-10 cm for cut-points). Several boundaries could not be estimated due to sparse rating categories. These thresholds should be interpreted as preliminary estimates requiring validation in larger independent samples.
Each student was rated by a single teacher (n = 8 total). While sensitivity analyses indicated that teacher clustering did not materially alter conclusions, this nesting may have inflated apparent CMJ-rating correspondence. Multiple raters per student would enable formal inter-rater reliability estimation and clarify whether agreement patterns reflect stable teacher judgements or rater-specific biases.
Generalizability is constrained by the single-school UK ballet sample. These dancers train 17 to 30 hours weekly in a structured vocational curriculum; whether thresholds apply to recreational dancers, pre-professional programs with different training loads, or different ballet training programs remains unclear. Replication across dance genres (contemporary, jazz, hip-hop) would clarify whether the moderate CMJ-rating correspondence observed here reflects ballet-specific technical demands or generalizes to jumping assessment more broadly. Cultural context may also matter: grading conventions, aesthetic priorities, and teacher training pathways vary internationally and could influence how teachers weight vertical displacement versus other jump qualities.
The study’s cross-sectional design cannot address threshold stability. Longitudinal designs tracking within-student CMJ and rating changes across training seasons would clarify whether teachers recalibrate expectations as cohorts develop or whether thresholds remain fixed. Future work should investigate whether incorporating force-time variables (eccentric rate of force development, reactive strength index, stiffness) improves correspondence with ratings, as teachers likely consider springiness and control beyond height alone. Intervention studies testing whether providing teachers with objective CMJ feedback improves student-teacher calibration could assess practical utility for professional development.
Practical Applications
The sex- and age-specific CMJ thresholds provide dance educators with concrete benchmarks for translating familiar 1 to 5 jump quality ratings into objective centimeter values. A teacher observing a Year 10 male jumping 33 cm can identify this performance as exceeding the high rating threshold (≥4: 32.5 cm), providing evidence-based support for advancement decisions. Equally, a Year 12 female jumping 27 cm falls below the threshold for rating ≥4 (29.0 cm), signalling potential benefit from targeted power development. These thresholds enable teachers to calibrate observational judgements against quantifiable standards, reducing reliance on subjective recall and facilitating more equitable evaluation across students and training stages.
For strength and conditioning coaches, the thresholds offer age- and sex-appropriate training targets. Rather than prescribing generic “improve jump height” goals, coaches can set specific benchmarks aligned with pedagogical expectations (e.g., “progress from 26 cm to 28 cm to meet Year 9 female rating ≥4”). Periodic CMJ testing allows objective tracking of neuromuscular development, identifying students whose physical capacities lag behind technical skill or vice versa.
Where CMJ showed modest discriminative ability (AUC < 0.70), teachers are evaluating jump quality beyond vertical displacement, likely including reactive ability, eccentric control, and aesthetic execution. Feedback should integrate CMJ height with complementary measures (reactive strength index, landing mechanics) rather than height alone. The binary high/not-high classification (ratings 4-5 vs 1-3) demonstrated better agreement than the full 1-5 scale, suggesting this simplified framing may be more reliable for communicating competency milestones.
The systematic under-rating in older male dancers (teachers rating ~1 category higher than self-ratings) warrants educator attention. If self-critical tendencies reflect maladaptive self-perception, interventions providing objective feedback may help recalibrate student self-assessment.
Beyond dance, the teacher-anchored thresholding methodology transfers to any domain where practitioners make ordinal judgements about physical performance (physical education, gymnastics, figure skating), making implicit pedagogical standards explicit and supporting evidence-based practice where subjective evaluation remains central.
Conclusion
This study established sex- and age-specific CMJ thresholds that translate teachers’ 1 to 5 jump quality ratings into objective centimeter benchmarks for adolescent ballet dancers. Three principal findings emerged. First, teacher-anchored thresholds increased systematically with age and were higher in males than females, reflecting normative developmental trajectories in vertical jump performance. Second, CMJ height discriminated meaningfully between rating categories (AUCs 0.55-1.00), indicating that objective jump performance contributes to pedagogical judgements but does not fully determine them, as teachers integrate multiple dimensions of jump quality beyond vertical displacement. Third, student-teacher agreement varied systematically, with older males demonstrating self-critical tendencies (rating themselves approximately one category lower than teachers), while females showed modest agreement across age groups with no consistent directional bias. These findings provide dance educators with practical, evidence-based benchmarks for calibrating observational assessment against quantifiable standards, while highlighting the complementary roles of objective testing and pedagogical expertise in supporting adolescent dancer development.
Supplemental Material
sj-docx-1-dmj-10.1177_1089313X261431883 – Supplemental material for Teacher and Student Perceptions of Jump Quality: Deriving Objective Thresholds and Examining Rating Agreement in Adolescent Ballet Dancers
Supplemental material, sj-docx-1-dmj-10.1177_1089313X261431883 for Teacher and Student Perceptions of Jump Quality: Deriving Objective Thresholds and Examining Rating Agreement in Adolescent Ballet Dancers by Raluca-Ioana Mihaila, Anna Schrefl, Scarlett Brass, Ella Dennehy, Matt Wyon, George Metsios and Nico Kolokythas in Journal of Dance Medicine & Science
Supplemental Material
sj-docx-2-dmj-10.1177_1089313X261431883 – Supplemental material for Teacher and Student Perceptions of Jump Quality: Deriving Objective Thresholds and Examining Rating Agreement in Adolescent Ballet Dancers
Supplemental material, sj-docx-2-dmj-10.1177_1089313X261431883 for Teacher and Student Perceptions of Jump Quality: Deriving Objective Thresholds and Examining Rating Agreement in Adolescent Ballet Dancers by Raluca-Ioana Mihaila, Anna Schrefl, Scarlett Brass, Ella Dennehy, Matt Wyon, George Metsios and Nico Kolokythas in Journal of Dance Medicine & Science
Footnotes
Acknowledgements
The authors gratefully acknowledge the ballet teachers at Elmhurst Ballet School for their willingness to integrate objective testing into their pedagogical practice and for their openness in sharing the criteria they use when evaluating student performance. This study would not have been possible without their forward-thinking approach to bridging artistic and scientific assessment methods. We also thank the senior leadership team at Elmhurst Ballet School for supporting research innovation. A special thank you to Judith Rowann, the at the time rehabilitation ballet teacher, for her wisdom and guidance over the years. Finally, we acknowledge the student dancers who participated in testing and rating procedures alongside their demanding training schedules.
Author Contributions
Raluca-Ioana Mihaila: Research concept, study design, literature review, data collection, data analysis interpretation, writing. Anna Schrefl: Research concept, study design, literature review, data analysis interpretation, review/edit. Scarlett Brass: Literature review, data collection, data analysis interpretation, review/edit. Ella Dennehy: Literature review, data collection, data analysis interpretation, review/edit. Matt Wyon: Research concept, study design, data analysis interpretation, review/edit. George Metsios: Research concept, study design, data analysis interpretation, review/edit. Nico Kolokythas: Research concept, study design, data collection, data analysis interpretation, statistical analyses, writing.
Funding
The authors received no financial support for the research, authorship, and/or publication of this article.
Declaration of Conflicting Interests
The authors declared no potential conflicts of interest with respect to the research, authorship, and/or publication of this article.
Supplemental Material
Supplemental material for this article is available online.