
Abstract
Individuals experience loneliness when they perceive a deficiency in the quality or quantity of their social relationships. In the present meta-analysis, we compiled data from 75 longitudinal studies conducted in Asia, Australia, Europe, and North America (N = 83, 679) to examine the rank-order and mean-level development of loneliness across the life span. Data were analyzed using two- and three-level meta-analyses and generalized additive mixed models. The results indicate that the rank order of loneliness is as stable as the rank order of personality traits and follows an inverted U-shaped trajectory across the life span. Regarding mean-level development, loneliness was found to decrease throughout childhood and to remain essentially stable from adolescence to oldest old age. Thus, in contrast to other personality characteristics, changes in loneliness are not generally related to age. Implications for theory are discussed.
Keywords
During their phylogenetic history, humans have evolved into social animals sharing a need to belong and to be socially included (Axelrod & Hamilton, 1981; Baumeister & Leary, 1995; Cacioppo, Cacioppo, Cole, et al., 2015). Social relationships are part and parcel of an individual’s environment and constitute a resource of support. Both the sheer availability and diversity of social relationships are, therefore, of utmost importance for health and well-being (Cohen, 2004; Fiori, Antonucci, & Cortina, 2006; House, Landis, & Umberson, 1988; Sarason, Sarason, & Gurung, 1997). Given this fundamental importance, it comes as no surprise that social isolation—defined as the objective lack of a broader social network (de Jong Gierveld, van Tilburg, & Dykstra, 2006)—has been shown to have detrimental effects on a wide variety of health-related, hormonal, and neuroanatomical outcomes in humans (Caspi, Harrington, Moffitt, Milne, & Poulton, 2006; Holt-Lunstad, Smith, Baker, Harris, & Stephenson, 2015; House et al., 1988; Shankar, McMunn, Banks, & Steptoe, 2011; Shankar, McMunn, Demakakos, Hamer, & Steptoe, 2017) and animals (Cacioppo, Capitanio, & Cacioppo, 2014; Capitanio, Hawkley, Cole, & Cacioppo, 2014; Hawkley, Cole, Capitanio, Norman, & Cacioppo, 2012).
In contrast to social isolation, loneliness occurs when individuals perceive qualitative or quantitative features of their social relationships as deficient (de Jong Gierveld, 1998; Ernst & Cacioppo, 1999; Hawkley & Cacioppo, 2010; Marangoni & Ickes, 1989; Perlman & Peplau, 1981). Thus, individuals might be lonely even if they have a large personal network, or do not feel lonely despite having only few confidants. Indeed, the results of several studies support the subjective nature of loneliness by showing that the association between the objective size of individuals’ social networks and loneliness is weak, whereas aspects of relationship quality are more closely related to loneliness (Green, Richardson, Lago, & Schatten-Jones, 2001; Luhmann & Hawkley, 2016; Pinquart & Sörensen, 2001b; Stokes, 1985). A large body of research has been devoted to identifying the predictors, correlates, and consequences of loneliness (Bosma, Jansen, Schefman, Hajema, & Feron, 2015; Goossens et al., 2015; Hawkley, Masi, Berry, & Cacioppo, 2006; Hawkley, Thisted, Masi, & Cacioppo, 2010; Kamiya, Doyle, Henretta, & Timonen, 2014; Luhmann & Hawkley, 2016; Savikko, Routasalo, Tilvis, Strandberg, & Pitkälä, 2005; Shankar et al., 2011; for reviews, see Buecker, Maes, Denissen, & Luhmann, 2018; Cacioppo, Cacioppo, Capitanio, & Cole, 2015; Ernst & Cacioppo, 1999; Hawkley & Cacioppo, 2010; Hawkley & Capitanio, 2015; Pinquart & Sörensen, 2001a, 2001b). In sharp contrast, surprisingly little is known about the stability and change of loneliness across the life span. In the present article, we conducted a comprehensive meta-analysis of longitudinal studies to fill this gap, thereby particularly focusing on the rank-order and mean-level development of loneliness.
The Development of Loneliness
Age differences in loneliness have been investigated in numerous studies (Luhmann & Hawkley, 2016; Perlman, 1990; Queen, Stawski, Ryan, & Smith, 2014; Schnittker, 2007; Victor & Yang, 2012; Yang & Victor, 2011). Most of these studies reported loneliness to be high in adolescence, low in middle adulthood, and again high in old age, hence following a U-shaped trajectory (Perlman, 1990; Victor & Yang, 2012; Yang & Victor, 2011). Other studies, in contrast, have also reported a bell-shaped (Schultz & Moore, 1988), a negative linear (Schnittker, 2007), a complex nonlinear (Luhmann & Hawkley, 2016), or no association (Queen et al., 2014) between age and loneliness. These studies, however, are limited, in that, they (a) are all based on cross-sectional data and (b) have almost exclusively focused on adult participants. The cross-sectional nature of these studies is particularly challenging for two reasons: First, it restricts the developmental processes that can be examined to mean levels. Mean-level development, however, is only one of many aspects relevant for the understanding of the life span development of psychological characteristics (Mund, Zimmermann, & Neyer, 2018; Roberts, Wood, & Caspi, 2008). Second, age- and cohort effects are confounded in cross-sectional studies. For this reason, cross-sectional studies cannot provide insights on longitudinal developmental trends (Kraemer, Yesavage, Taylor, & Kupfer, 2000).
The almost exclusive focus on age differences in loneliness among adult participants is also problematic because the results of several studies have shown that children as young as 6 years have a basic understanding of what it means to be lonely (Asher & Paquette, 2003; Cassidy & Asher, 1992). Furthermore, loneliness has the same negative consequences for the mental health of children as it has for adults (for a review, see Hawkley & Capitanio, 2015), which underscores the importance of including samples of children when examining the development of loneliness.
Mean-Level and Rank-Order Development of Loneliness
Mean-level development describes whether the level of a given characteristic changes on average in the population (Mund et al., 2018; Roberts et al., 2008). Prior research on such mean-level changes in loneliness has been focused on specific age periods such as adolescence (e.g., Vanhalst, Goossens, Luyckx, Scholte, & Engels, 2013) or old age (e.g., Cacioppo, Hughes, Waite, Hawkley, & Thisted, 2006). A comprehensive overview of the mean-level development of loneliness across the life span based on longitudinal data is still missing.
If individuals change in different directions or at different rates, differential development—or interindividual differences in intraindividual change—can be observed (Mund et al., 2018; Roberts et al., 2008). Differential development has most often been examined by analyzing the stability of the rank order of individuals between two adjacent measurement occasions. The basic idea behind this approach is that if some individuals change their position in the rank order, they have changed more than others. If the rank order remains stable and individuals keep their position, the differences between individuals on a given characteristic remain stable as well (Mund et al., 2018). It should be noted that mean-level and differential development are, theoretically, independent of each other. Differential development might well be observable despite perfect mean-level stability, whereas mean-level changes might occur with or without shifts in the rank order of individuals (Mund et al., 2018; Roberts & DelVecchio, 2000; Roberts, Walton, & Viechtbauer, 2006; Roberts et al., 2008). Several meta-analyses have addressed the question of differential development for a variety of psychological characteristics (e.g., Briley & Tucker-Drob, 2014; Ferguson, 2010; Roberts & DelVecchio, 2000; Trzesniewski, Donnellan, & Robins, 2003). In contrast, a study on the stability of interindividual differences in loneliness across the life span is missing as of yet.
Factors Influencing the Development of Loneliness
Several variables have been found to influence the levels of loneliness at a given point in time and to moderate differences between individuals. In the present study, we will investigate whether these variables also affect developmental trends in loneliness over time.
Cohort
Development does not only occur across the life of individuals but also across generations. Birth cohort effects have been reported for several characteristics that are associated with loneliness, including the Big Five personality traits (Smits, Dolan, Vorst, Wicherts, & Timmerman, 2011; Twenge, 2001), attachment styles (Konrath, Chopik, Hsing, & O’Brien, 2014), self-esteem (Twenge & Campbell, 2001), subjective well-being (Sutin et al., 2013a), and depressive symptoms (Twenge, Joiner, Rogers, & Martin, 2018). With regard to loneliness, the results of the existing cross-temporal studies are somewhat inconsistent. Levels of loneliness have been found to be stable across cohorts of children (Clark, Loxton, & Tobin, 2015; Lempinen, Junttila, & Sourander, 2018) and to decrease across cohorts of emerging adults (Clark et al., 2015). For old age, several studies from Europe found loneliness to be stable (Dahlberg, Agahi, & Lennartsson, 2018; Eloranta, Arve, Isoaho, Lehtonen, & Viitanen, 2015; Nyqvist, Cattan, Conradsson, Näsman, & Gustafsson, 2017; Victor et al., 2002) or to decrease (Hülür et al., 2016) across cohorts, whereas a study from China found marked increases (Yan, Yang, Wang, Zhao, & Yu, 2014). However, cross-temporal studies pertain to the overall mean level of a characteristic across cohorts, but do not consider developmental trends within age groups. With respect to loneliness, it is yet unclear whether and to what extent its age-related development is affected by historically different circumstances.
Culture
Johnson and Mullins (1987) posited that loneliness should be more prevalent in countries that strongly emphasize cohesion than in more individualistic societies. Although mean levels of loneliness appear to vary across countries (Stack, 1998), studies that directly compared two or more countries concerning their levels of loneliness arrived at inconsistent conclusions (Fokkema, de Jong Gierveld, & Dykstra, 2012; İmamoğlu, Küller, İmamoğlu, & Küller, 1993; Martin, Hagberg, & Poon, 1997; Rokach, Orzeck, Cripps, Lackovitz-Grgin, & Penezic, 2001; van Tilburg, Havens, & de Jong Gierveld, 2004; Yang & Victor, 2011). It has to be noted, though, that these studies have compared participants from countries with presumably very similar value system (e.g., Canada vs. Croatia or Canada vs. Italy vs. the Netherlands). Comparative studies with participants from more diverse cultural backgrounds, for instance, from North America and Asia (Anderson, 1999; Hawkley, Gu, Luo, & Cacioppo, 2012), in contrast, have found Asian participants to score higher on loneliness. It is yet unclear whether the cultural background of participants also affects the mean-level and rank-order development of loneliness across time.
Sex
In several studies, women have been found to report higher levels of loneliness than men (Borys & Perlman, 1985; Luhmann & Hawkley, 2016; Pinquart & Sörensen, 2001b). Similar findings have also been reported for several personality characteristics (Feingold, 1994). However, there seem to be no substantial sex differences regarding the mean-level and rank-order development of broad personality characteristics such as the Big Five (Ferguson, 2010; Roberts & DelVecchio, 2000; Roberts et al., 2006). In case of loneliness, it is yet unclear whether differential and mean-level development are affected by gender.
Measures of loneliness
Loneliness is typically assessed with either a direct or an indirect measure (de Jong Gierveld et al., 2006; Marangoni & Ickes, 1989). When direct measures are employed, individuals are asked to rate whether or how often they feel lonely, which requires self-labeling (Marangoni & Ickes, 1989). Most single-item measures, which have been widely used in research on loneliness (Pinquart & Sörensen, 2001b), but also multi-item scales such as the Loneliness and Aloneness Scale for Children and Adolescents (LACA; Marcoen & Brumagne, 1985; Marcoen, Goossens, & Caes, 1987), or the Loneliness and Social Dissatisfaction Scale (LSDQ; Asher, Hymel, & Renshaw, 1984; Asher & Wheeler, 1985; Cassidy & Asher, 1992), are direct measures of loneliness.
Indirect measures, in contrast, avoid any reference to the construct under scrutiny and their items do not contain terms such as loneliness or lonely. The University of California, Los Angeles (UCLA) Loneliness Scale (Russell, Peplau, & Cutrona, 1980; Russell, Peplau, & Ferguson, 1978; Russell, 1996) and the de Jong Gierveld Loneliness Scale (dJG-LS; de Jong Gierveld & Kamphuis, 1985; de Jong Gierveld & van Tilburg, 1999, 2006) are the most prominent and widely applied representatives of indirect measures of loneliness. The results of several studies have shown that direct and indirect measures of loneliness differ from each other concerning the estimated prevalence of loneliness—with indirect measures signaling a higher prevalence—and their correlates (e.g., age, educational attainment; Shiovitz-Ezra & Ayalon, 2012; Victor, Grenade, & Boldy, 2005). Despite these differences, however, the various instruments to assess loneliness seem to capture a common core, as indicated by high convergent validity across measures (e.g., Grygiel, Humenny, Rebisz, Świtaj, & Sikorska, 2013; Maes, Vanhalst, van den Noortgate, & Goossens, 2017).
Several authors have proposed to dichotomize measurement scales to address possible social desirable responding (e.g., de Jong Gierveld & Kamphuis, 1985). This line of action has been criticized both generally (MacCallum, Zhang, Preacher, & Rucker, 2002) and specifically concerning loneliness (Marangoni & Ickes, 1989), as dichotomization might disguise relevant interindividual differences. In the present study, we examine whether the observed development of loneliness differs between dichotomized and continuous scales.
Finally, the mode of data collection (e.g., face-to-face interviews, telephone interviews, paper-and-pencil questionnaires, or online surveys) has been shown to influence the levels of loneliness (de Leeuw, Mellenbergh, & Hox, 1996; Fowler, Roman, & Di, 1998). Thus, we investigate the effects of assessment mode on the rank-order and mean-level development of loneliness.
Facets of loneliness
Whereas several researchers consider loneliness a unitary construct (Perlman & Peplau, 1981), others have proposed different facets of loneliness. For instance, Weiss (1973) suggested a distinction between social and emotional loneliness. In this conceptualization, social loneliness describes the quantitative aspect of loneliness, that is, the subjective lack of a broader support network. Emotional loneliness, in contrast, has been described as a subjective feeling of detachment, thereby representing a qualitative aspect of loneliness pertaining to the lack of deep and meaningful relationships (de Jong Gierveld et al., 2006; Ernst & Cacioppo, 1999; van Baarsen, Snijders, Smit, & van Duijn, 2001; Weiss, 1973). Following the work by Weiss (1973), several other facets of loneliness have been proposed, which mainly refer to the experience of loneliness in specific types of relationships or specific contexts. Specifically, loneliness has been found to occur in peer relationships (Asher et al., 1984; Asher & Paquette, 2003; Asher & Wheeler, 1985), partner relationships (DiTommaso & Spinner, 1997), family relationships (DiTommaso & Spinner, 1997; Goossens et al., 2009; Maes, Klimstra, van den Noortgate, & Goossens, 2015), or in the context of school life (Asher et al., 1984; Cassidy & Asher, 1992). Although all the proposed facets have been found to explain incremental and unique shares of variance in different outcome measures (e.g., DiTommaso & Spinner, 1997; Lasgaard, Goossens, Bramsen, Trillingsgaard, & Elklit, 2011; Maes et al., 2015; van Baarsen et al., 2001), not much is known about their development across the life span.
The Present Study
We pursued three goals in the present meta-analysis. First, we examined the stability of interindividual differences (i.e., rank-order stability) in loneliness across the life span. Second, we investigated patterns of mean-level development of loneliness across the life span. Third, we investigated both methodological (e.g., measurement instrument, assessment mode) and substantive (e.g., cultural background, birth cohort) moderators of the stability and change of loneliness. With the present work, we extend previous meta-analyses and large-scale studies that have focused on cross-sectional data or specific age periods (Luhmann & Hawkley, 2016; Perlman, 1990; Pinquart & Sörensen, 2001b; Yang & Victor, 2011) by compiling findings from longitudinal studies and adopting a life span perspective.
Method
Literature Search
We conducted an extensive literature search between June and December 2015. The results were updated in May 2016, May 2017, and November 2018. We applied four strategies to identify potentially relevant studies: First, we scrutinized the reference lists of pertinent previous meta-analyses (Clark et al., 2015; Holt-Lunstad et al., 2015; Perlman, 1990; Pinquart & Sörensen, 2001a, 2001b) and review papers (e.g., Cacioppo et al., 2014; de Jong Gierveld et al., 2006; Ernst & Cacioppo, 1999; Hawkley & Cacioppo, 2010; Marangoni & Ickes, 1989; Qualter et al., 2015). Second, we conducted backward searches (Reed & Baxter, 2009; White, 2009) for recent large-scale studies on loneliness (e.g., Ayalon, Shiovitz-Ezra, & Roziner, 2016; Luhmann & Hawkley, 2016; Victor & Yang, 2012; Yang & Victor, 2011). Third, we conducted forward searches (Reed & Baxter, 2009; White, 2009) for the articles that have introduced the most influential scales for measuring loneliness, including (a) the LACA (Marcoen & Brumagne, 1985; Marcoen et al., 1987), (b) the LSDQ (Asher et al., 1984; Asher & Wheeler, 1985; Cassidy & Asher, 1992), (c) the UCLA Loneliness Scale (Russell et al., 1980; Russell et al., 1978; Russell, 1996), and (d) the dJG-LS (de Jong Gierveld & Kamphuis, 1985; de Jong Gierveld & van Tilburg, 1999, 2006). Fourth, we conducted an extensive full-text search using the search terms (lone* OR ((subjective OR perceived) AND social isolation)) AND (longit* OR prospective OR panel OR follow-up OR “follow up” OR time OR change). 1 The starred search terms allowed us to find variations of the respective key word. For instance, by using lone*, we identified texts using the terms loneliness, lonesome, lonely, lonelier, and so forth. The full-text search was conducted in (a) a meta-search engine combining various psychological and sociological databases (most important, PsycINFO, PsycARTICLES, and the Psychology and Behavioral Sciences Collection), (b) the Web of Science, (c) Science Direct, (d) PubPsych, (e) PubMed (via Ovid), and (f) Google Scholar.
Inclusion Criteria
Studies were required to meet six criteria to be included in the meta-analysis. First, studies were only included if they were longitudinal, that is, if they measured loneliness at least at two measurement occasions at least 1 year apart. This criterion was chosen to reduce carry-over effects and to ensure that the observed mean-level changes reflect persistent changes in the underlying disposition rather than temporary, state-like fluctuations (see also Roberts et al., 2006). Concerning the rank-order stability, shorter time intervals could have captured aspects of consistency rather than the stability of interindividual differences in loneliness (Hertzog & Nesselroade, 1987; Nesselroade, 1988; Roberts & DelVecchio, 2000). Second, loneliness was required to be measured via self-reports, excluding informant-ratings or ratings by proxies. Third, we only included studies with participants from nonclinical samples. Fourth, we excluded studies that have assessed loneliness in response to the occurrence of specific life events such as bereavement or divorce. However, we retained studies that included a normative life transition for which no or almost no selection effects are to be expected (Neyer, Mund, Zimmermann, & Wrzus, 2014) such as the transition from kindergarten to elementary school or the transition from primary to secondary education. Fifth, prior research has shown that children as young as 6 years have an accurate understanding of loneliness (Asher & Paquette, 2003). Therefore, the primary study’s participants were required to be at least 6 years of age at the first measurement occasion. Sixth, studies were only included if their sample was not too heterogeneous with respect to age. For this criterion, we evaluated whether the study in question could be clearly assigned to one of the specified age groups. This decision was primarily based on the age range at the first measurement occasion. For instance, we excluded studies sampling individuals from age 16 to 80, unless the study reported subgroup analyses for more specific age ranges.
In addition to these primary inclusion criteria, studies were also required to meet two secondary criteria: First, we only included published articles from peer-reviewed journals and dissertations, but we did not consider unpublished manuscripts or other types of gray literature (Rothstein & Hopewell, 2009). This decision was informed by the observation that the inclusion of gray literature might actually increase rather than remove publication bias (Ferguson & Brannick, 2012). This line of action is also consistent with previous meta-analyses on similar topics (Ferguson, 2010; Roberts et al., 2006; Trzesniewski et al., 2003; Wrzus, Hänel, Wagner, & Neyer, 2013). Second, studies could only be included if they reported enough information on (a) sample characteristics, (b) the measure of loneliness employed, and (c) either test–retest correlations, raw means, and standard deviations, or all of the previous at each measurement occasion. A flowchart of the literature search is displayed in Figure 1. From an initial pool of 4,775 studies, 75 entered the final analysis.
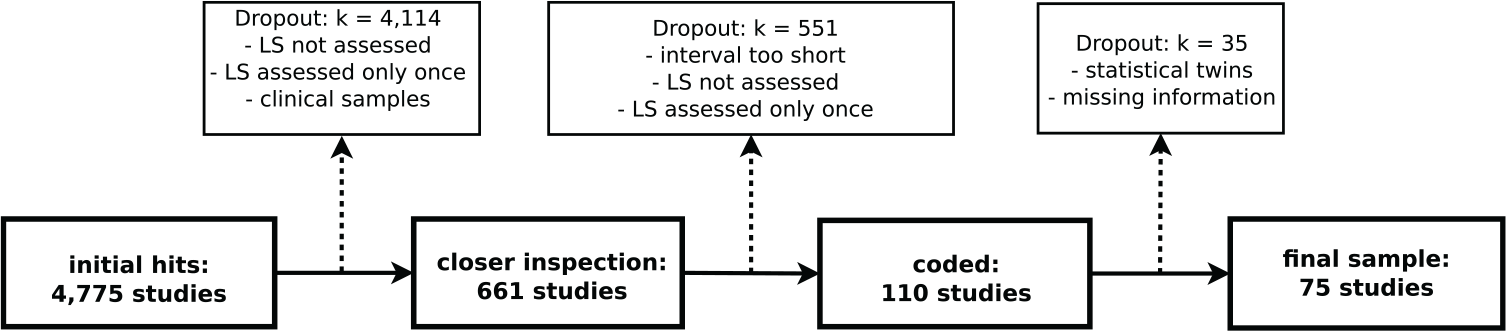
Flowchart of the literature search.
Among the 110 coded studies, several were based on the same overarching dataset (referred to as statistical twins in Figure 1). In such cases, we prioritized the study with (a) the larger sample size; (b) more measurement occasions and, hence, a longer observation period; or (c) information on both mean levels and rank-order stability.
Coding Procedure
Based on a coding sheet, information on effect sizes and study characteristics was extracted from the primary studies. Eighty-eight of the 110 coded studies (80%) were coded independently by two to four of the authors; the remaining studies were coded by the first author. If the coders disagreed on a specific coding, these differences were discussed and the respective study was reinspected until an agreement was reached. With the exception of the two studies that were used for training purposes, the agreement between the coders was very high with the intraclass correlation coefficient ranging from .91 to 1.00 (average = .97).
Age
Following the line of action of similar meta-analyses (Orth, Erol, & Luciano, 2018; Roberts & DelVecchio, 2000; Roberts et al., 2006; Wrzus et al., 2013), we grouped the primary studies into several age groups based on the reported mean age. Specifically, age was categorized into (a) childhood (6-12 years), (b) adolescence (12.1-17 years), (c) emerging adulthood (17.1-25 years), (d) young adulthood (25.1-40 years), (e) middle adulthood (40.1-60 years), (f) old age (60.1-80 years), and (g) oldest old age (80.1 years and older). If a study extended over more than two measurement occasions, this study could contribute effect sizes for multiple age groups. For instance, if a study extended over five measurement occasions with a sample age of 15, 16, 17, 18, and 19 at Waves 1, 2, 3, 4, and 5, respectively, the intervals between Wave 1 (age 15) and Wave 2 (age 16) as well as between Wave 2 and Wave 3 (age 17) would contribute information on the development of loneliness in adolescence. The correlations and mean-level differences between Wave 3 (age 17) and Wave 4 (age 18), in contrast, would contribute information on the development of loneliness in emerging adulthood, as would the data for Wave 4 (age 18) and Wave 5 (age 19). Based on these codings for each single measurement occasion, we also derived the measures of interest for the first and last measurement occasion within each age category. Reiterating on the example above, in addition to the finer grained interval-wise information, we coded information on the development of loneliness for the first (Wave 1, age 15) and last (Wave 3, age 17) measurement occasions in adolescence as well as for the first (Wave 4, age 18) and last (Wave 5, age 19) measurement occasions in emerging adulthood.
If only an age range was reported in the primary study (e.g., 30-40 years), we used the midpoint between the minimum and the maximum age (e.g., 35 years) as an estimate of the average age (Roberts & DelVecchio, 2000; Roberts et al., 2006; Wrzus et al., 2013). In studies in which average age was only reported for the first measurement occasion, the mean age at subsequent measurement occasions was calculated based on the information on the measurement intervals.
Moderators
As moderators of the effect sizes, we coded the (a) birth cohort of the sample, operationalized as the average year of birth 2 ; (b) proportion of females in the sample; (c) facet of loneliness (i.e., global, social, emotional, peer related, family related, partner related, school related, or other facet); (d) specific measure of loneliness (i.e., LACA, LSDQ, UCLA, dJG-LS, single item, or other); (e) general nature of the instrument (i.e., direct vs. indirect measure); (f) applied scoring procedure (i.e., dichotomized vs. continuous); (g) measurement mode (questionnaire, face-to-face interview, telephone interview, online questionnaire, multiple modes); (h) continent in which the study was conducted; and (i) measurement interval.
Effect sizes
As effect sizes, we coded (a) test–retest correlations of loneliness over time to examine the stability of interindividual differences in loneliness and (b) means of loneliness at each measurement occasion to examine mean-level trends across age. Some studies reported this information separately for females and males. In these cases, we not only coded the sex-specific values but also computed a weighted average score of both the correlations (using an r-to-z transformation and back-transformation to r) and the means for the full sample. Likewise, if studies reported correlations and means separately for latent classes or specific subgroups of individuals (e.g., widowed vs. married), we computed a weighted average for the full sample.
Meta-Analytic Procedure
Rank-order stability
To estimate the stability of interindividual differences in loneliness, we used the correlation coefficient r as effect size. To obtain unbiased estimates of the correlation coefficient, we first performed an r-to-z transformation for all correlations (Shadish & Haddock, 2009). The actual meta-analysis was then conducted based on these z-values. For reporting purposes, we converted the obtained z-scores back to r, as has been done in similar previous meta-analyses (Ferguson, 2010; Roberts & DelVecchio, 2000; Trzesniewski et al., 2003).
Mean-level development
We used the single-group, pretest–posttest effect size to examine the mean-level development of loneliness across the life span (Morris & DeShon, 2002), thereby again following the procedures established in similar previous meta-analyses (Orth et al., 2018; Roberts et al., 2006). This measure of effect size is calculated as follows (Morris & DeShon, 2002):
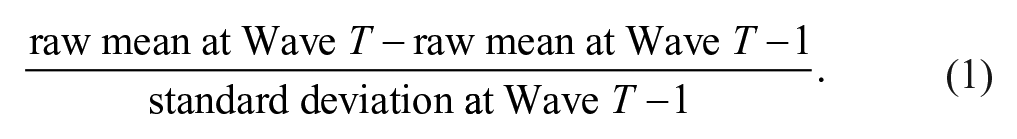
The standard errors of this effect size are adjusted based on the correlation between the pretest (Wave T − 1) and the posttest (Wave T; Morris & DeShon, 2002). In cases in which the included primary studies did not provide information on correlations, we used the correlation coefficient obtained in the meta-analysis on the rank-order stability of loneliness as an estimate of the rank-order stability within the respective age group.
General procedure
The data analysis proceeded in three steps. In the first step, we analyzed the data interval-wise. That is, if a study contained three measurement occasions each 2 years apart, we capitalized on these multiple measurement occasions to obtain precise estimates of the rank-order stability and mean-level development over shorter time intervals. This line of action enabled us to include all available information provided by the primary studies. As a consequence, some of the effect sizes were not independent anymore, as they were derived from one and the same study. To address this dependency in effect sizes, we applied three-level meta-analyses (Cheung, 2014; Konstantopoulos, 2011). In this framework, the traditional two-level nature of meta-analytic data is extended by a third level. Specifically, three-level meta-analyses allow for multiple effect sizes per study by taking into account that participants (Level 1) are nested within effect sizes (Level 2), which are nested within studies (Level 3; Cheung, 2014). In this way, three-level meta-analyses take into account that multiple effect sizes derived from the same study are correlated and, at the same time, disentangle the within- and between-study variability of these effect sizes.
In the second step, we applied traditional two-level meta-analytic models, in which we only considered the effect sizes for the first and last measurement occasions within each age group reported by a study. That is, in this part of the analysis, we capitalized on the length of the studies rather than on multiple measurements. This procedure has been applied as well in previous meta-analyses of longitudinal data (Ferguson, 2010; Roberts & DelVecchio, 2000; Roberts et al., 2006; Trzesniewski et al., 2003; Wrzus et al., 2013).
In the third step, we incorporated age as a continuous predictor. An advantage of this analytical approach is that it does not depend on the specified age groups and might, hence, yield more robust results. This part of the analysis was performed using generalized additive mixed modeling (GAMM; McKeown & Sneddon, 2014; Wood, 2006), an extension of generalized linear regression modeling (GLM). In GLM, the functional form of an assumed nonlinear association (e.g., quadratic and cubic) between a predictor (e.g., age) and an outcome (e.g., the rank-order stability of loneliness) needs to be specified a priori using higher order terms of the predictor, which might give rise to model misspecification. In GAMM, the association between the outcome and the predictor is estimated in a data-driven way using a smooth function. The smooth function consists of a number of penalized regression splines (i.e., piecewise polynomial regressions; for more detailed discussions, see McKeown & Sneddon, 2014; Wood, 2006). For the present analysis, we employed a thin plate smoother, in which the number and functional form of the separate splines are determined based on the data (in contrast to cubic splines, for example, where these parameters need to be specified in advance; Wood, 2006). As GAMM is capable of accommodating random effects, we incorporated the same multilevel structure as in the analyses based on age groups. Also paralleling the analyses based on age groups, we weighted the effect sizes of the primary studies using inverse variance weights (Hedges & Vevea, 1998). To interpret the results of GAMM, we focus on the effective degrees of freedom (edf) and the F-test for the smoothed predictor (i.e., age). The edf indicate the complexity of the smoothed association. For instance, edf around 1 indicate a linear association, edf around 2 indicate a quadratic association, edf around 3 indicate a cubic association, and so forth. The statistical significance of the smoothed predictor is examined via an F-test.
An additional decision that has to be made in meta-analyses is whether to run a fixed-effects (FE) or a random-effects (RE) model (Hedges & Vevea, 1998; Konstantopoulos & Hedges, 2009; Raudenbush, 2009; Viechtbauer, 2010). Basically, these models differ with regard to the degree of generalizability: Whereas FE models only allow conditional inferences on the selected set of studies, RE models allow an unconditional inference and, thus, a generalization of the findings above and beyond the selected study set (Hedges & Vevea, 1998; Viechtbauer, 2010). In the present meta-analysis, we ran RE models whenever possible. However, because RE models require at least k = 5 studies to arrive at unbiased estimates (Hedges & Vevea, 1998; Raudenbush, 2009), we ran FE models whenever the number of studies for a specific analysis was smaller than 5.
Moderators of effect sizes were implemented in a mixed-effects meta-regression framework, in which the observed effect sizes were regressed on one or more moderator variables (e.g., assessment method; Viechtbauer, 2010).
Publication bias was examined via regression-based procedures (Sterne & Egger, 2005). However, there is currently no method available to assess publication bias in the three-level meta-analytic framework. Hence, we were restricted to the two-level part of our analysis when examining publication bias.
All analyses were conducted with version 2.0.0 of the metafor package for R (R Core Team, 2018; Viechtbauer, 2010). For all RE models, we employed a restricted maximum likelihood estimator (Viechtbauer, 2005). GAMM was conducted using version 0.2.5 of the R package gamm4 (Wood & Scheipl, 2017). The dataset and all syntax files used for analysis are available at https://osf.io/hysc3/.
Results
Study Characteristics
Table 1 provides an overview of basic characteristics of each of the selected studies. Overall, the included 75 studies sampled 83,679 participants with an average sample size of N = 1.072.8 (SD = 1,888.15, median = 525). Forty-two of the 75 studies (56.00%) reported information on the rank-order stability of loneliness. Overall, these studies sampled N = 41,253 individuals and provided 76 effect sizes. 3 Seventy of the 75 studies (93.33%) reported information on the means of loneliness at at least two measurement occasions. Overall, these studies sampled N = 79,331 individuals and provided 132 effect sizes.
Longitudinal Studies Included in the Analysis.
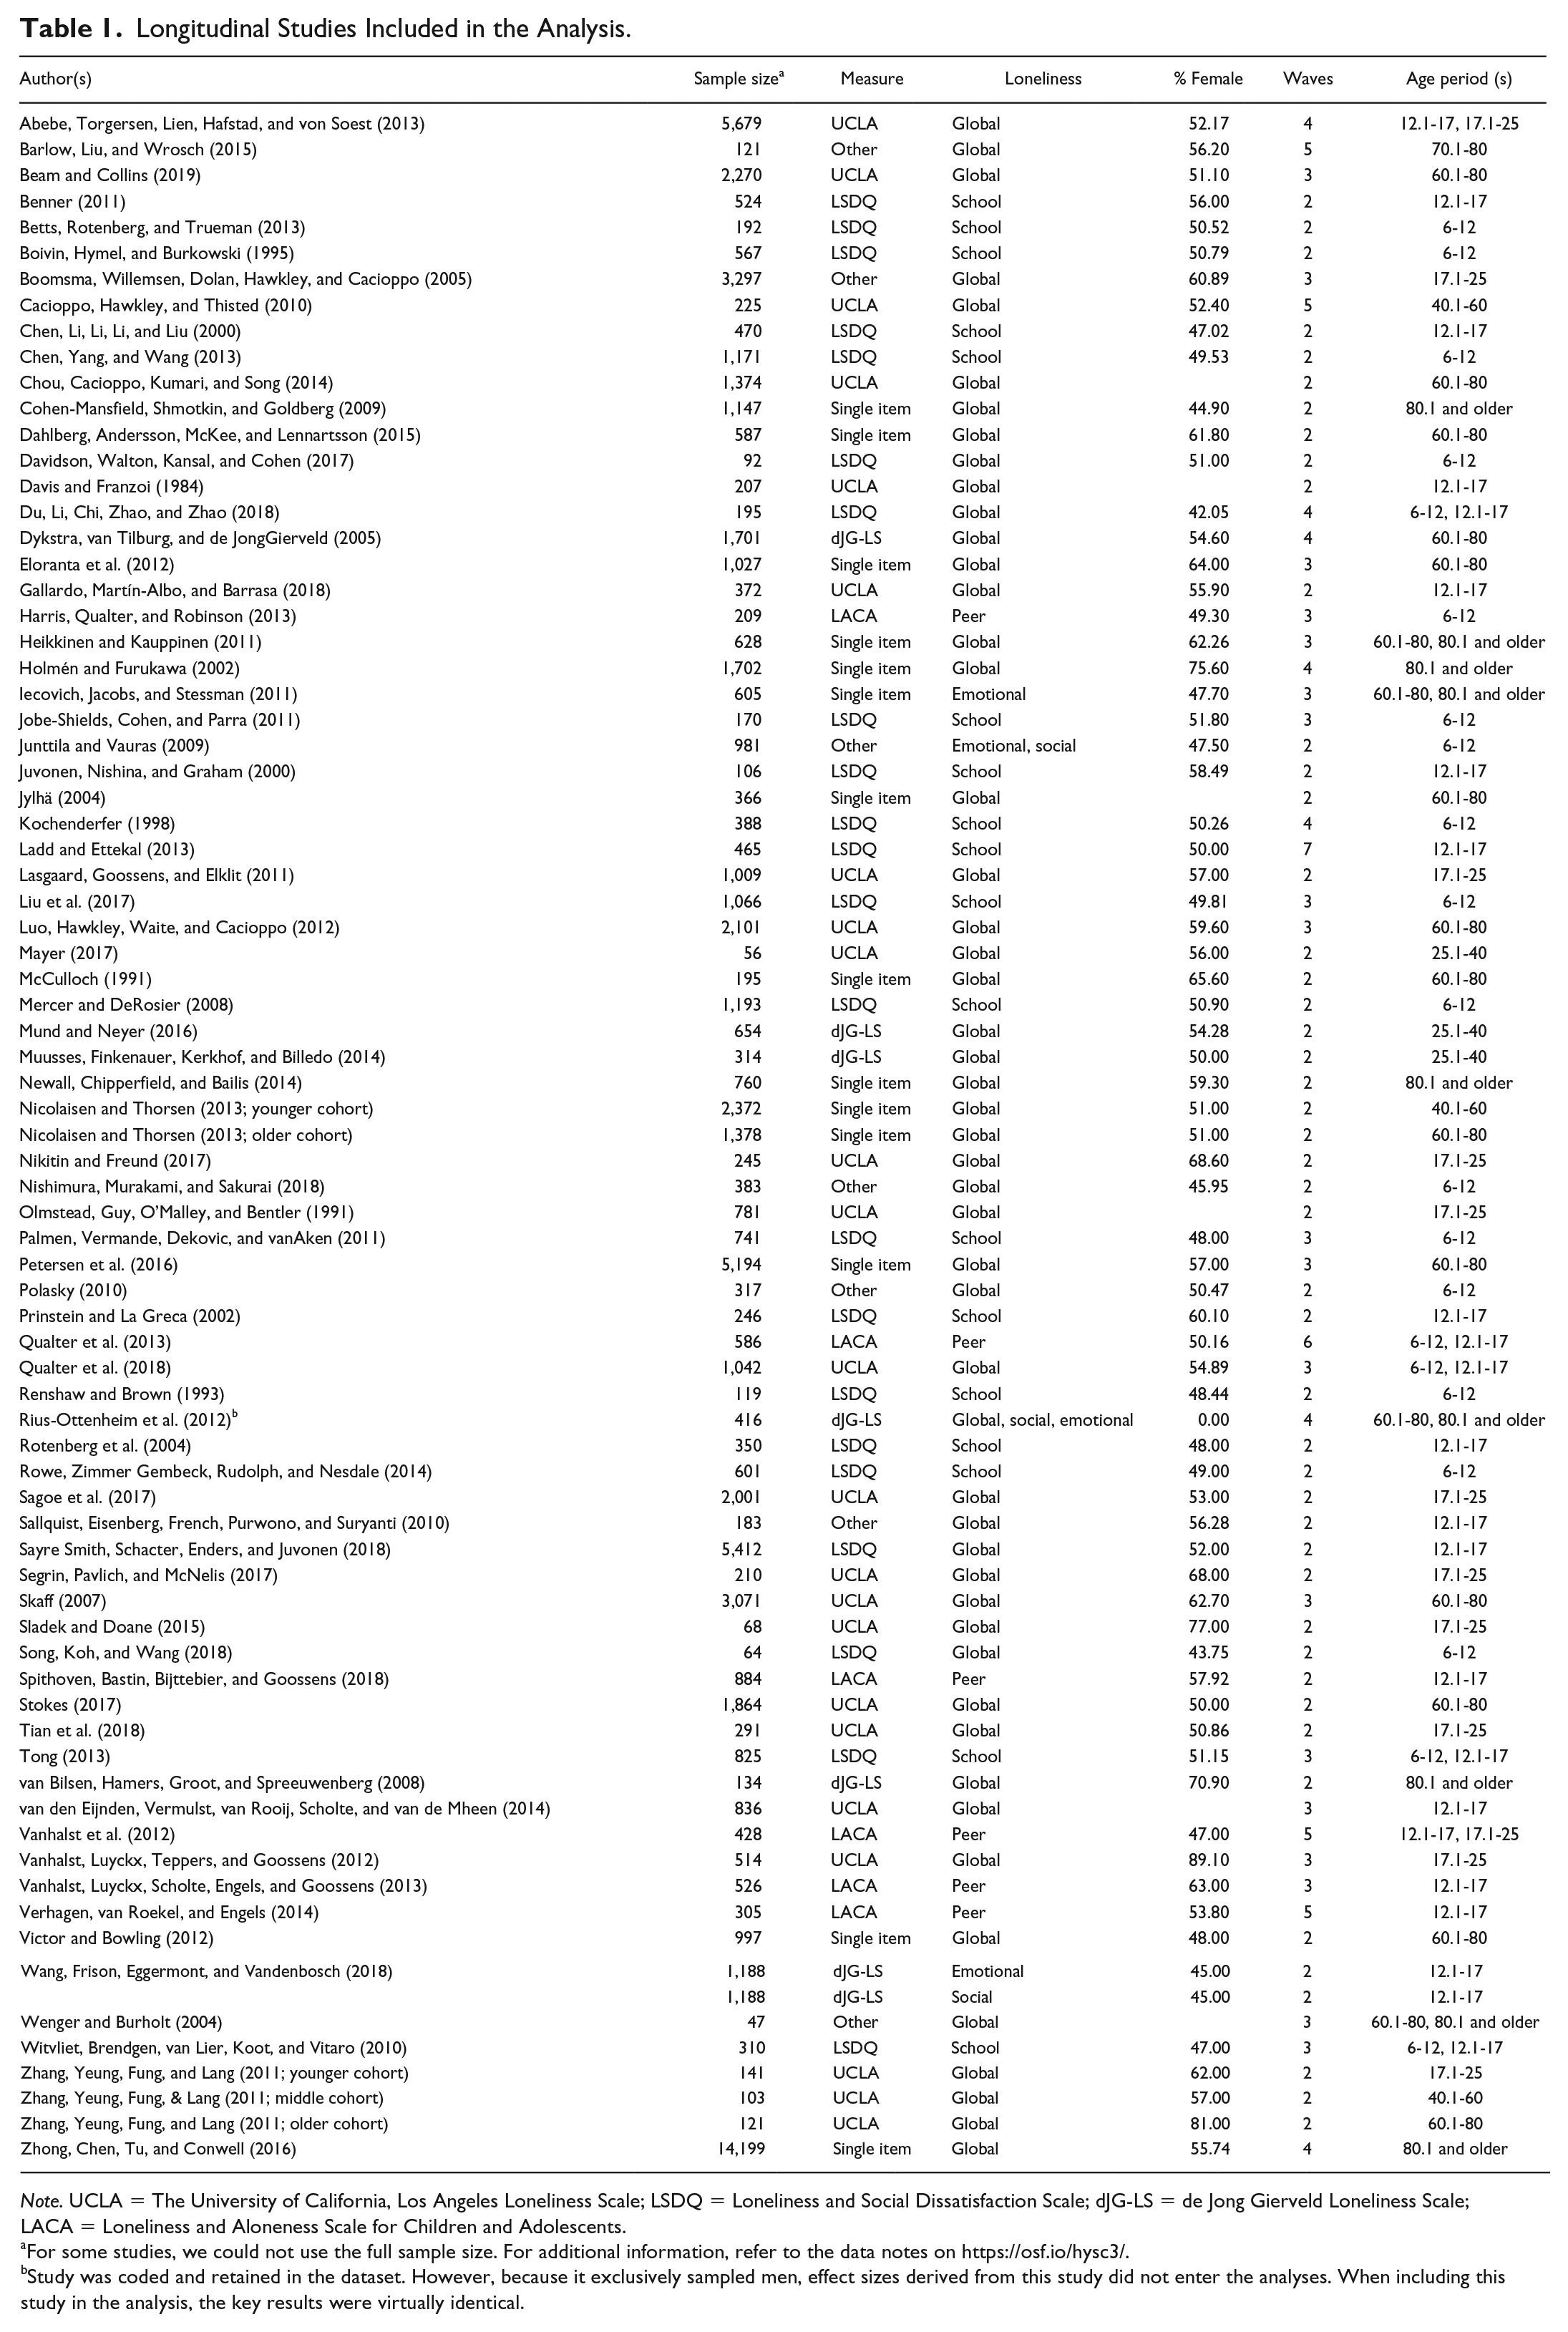
Note. UCLA = The University of California, Los Angeles Loneliness Scale; LSDQ = Loneliness and Social Dissatisfaction Scale; dJG-LS = de Jong Gierveld Loneliness Scale; LACA = Loneliness and Aloneness Scale for Children and Adolescents.
For some studies, we could not use the full sample size. For additional information, refer to the data notes on https://osf.io/hysc3/.
Study was coded and retained in the dataset. However, because it exclusively sampled men, effect sizes derived from this study did not enter the analyses. When including this study in the analysis, the key results were virtually identical.
As displayed in Table 2, females and males were, on average, equally represented in the original studies. Most of the primary studies were conducted in Europe, followed by North America (United States and Canada). Eleven studies were conducted in Asia, two in Australia. Participants of the primary studies were born between 1902 and 2004 (M = 1968).
Descriptive Statistics for Aggregated Study Characteristics.
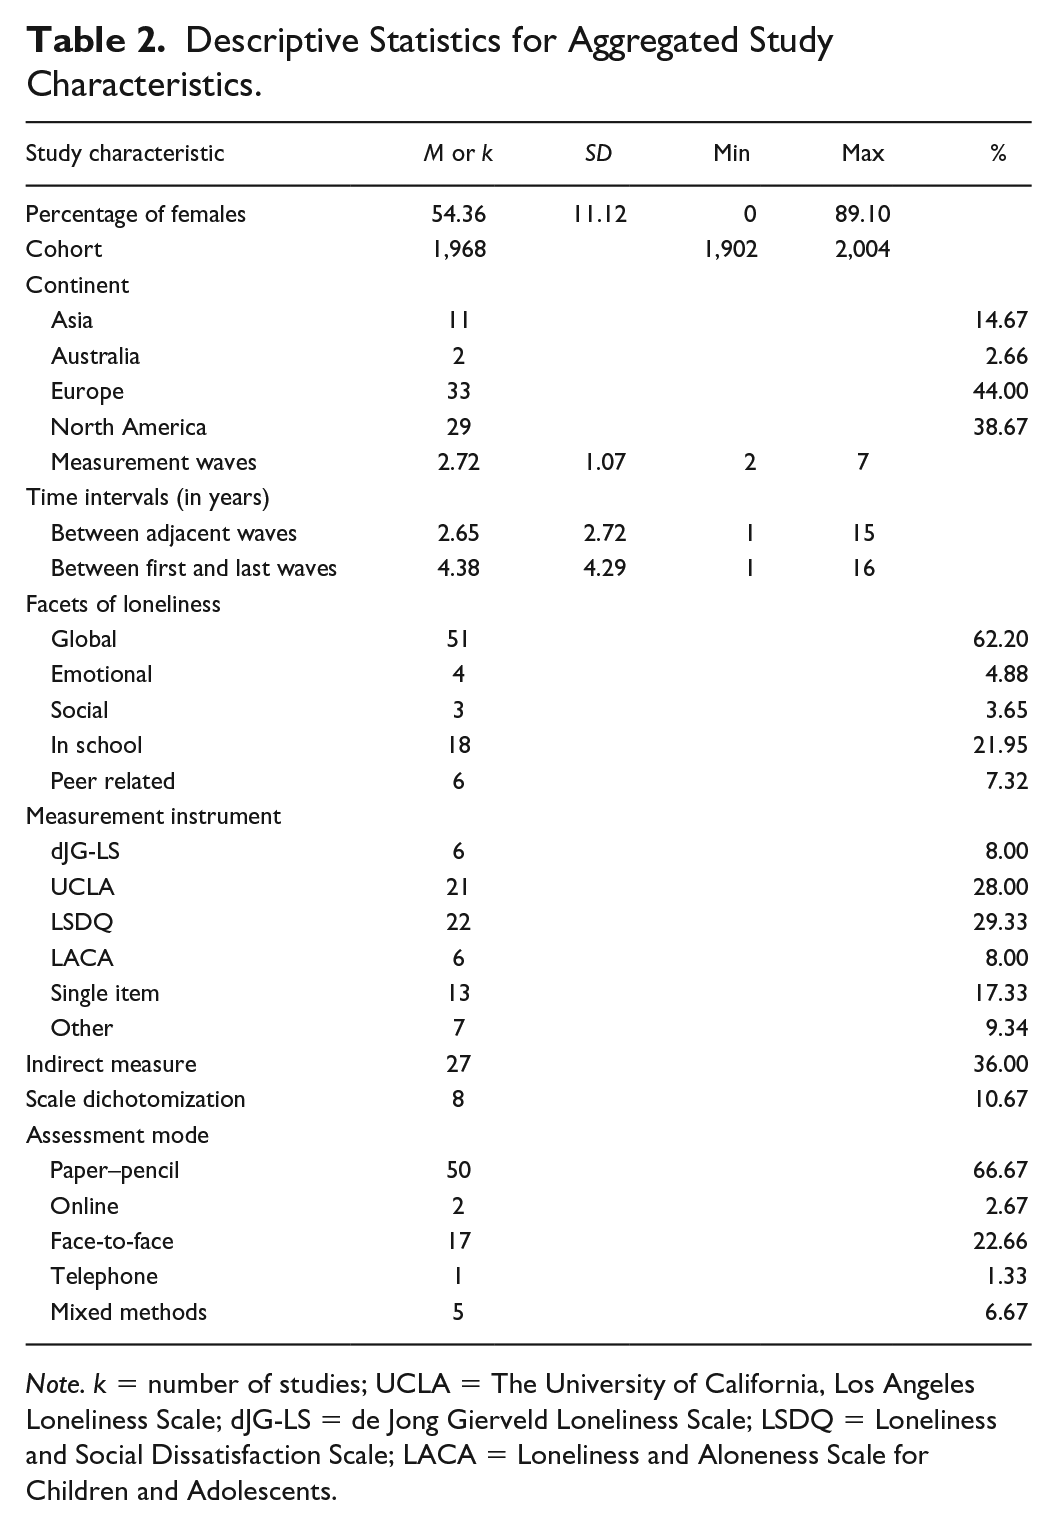
Note. k = number of studies; UCLA = The University of California, Los Angeles Loneliness Scale; dJG-LS = de Jong Gierveld Loneliness Scale; LSDQ = Loneliness and Social Dissatisfaction Scale; LACA = Loneliness and Aloneness Scale for Children and Adolescents.
Concerning the facets of loneliness, only few studies examined social and emotional loneliness over time, whereas more than two thirds of the studies (68%) examined global loneliness. In 24% of the primary studies, school-related loneliness was assessed; 8% of the studies focused on peer-related loneliness. We could not identify studies that met our inclusion criteria assessing family- and partner-related loneliness. With respect to measurement instruments, the UCLA and LSDQ were the most frequently used scales in the primary studies; only one third of the primary studies employed indirect measures of loneliness (i.e., dJG-LS or UCLA). In 11% of the primary studies, scale scores have been dichotomized. Two thirds of the studies collected data via paper–pencil questionnaires, in 23% of the studies, face-to-face interviews were employed. Online assessments (3%), telephone interviews (1%), or mixed methods (7%) were rarely employed. Table 3 summarizes the study characteristics separately for each age group.
Descriptive Statistics for Aggregated Study Characteristics by Age Group.
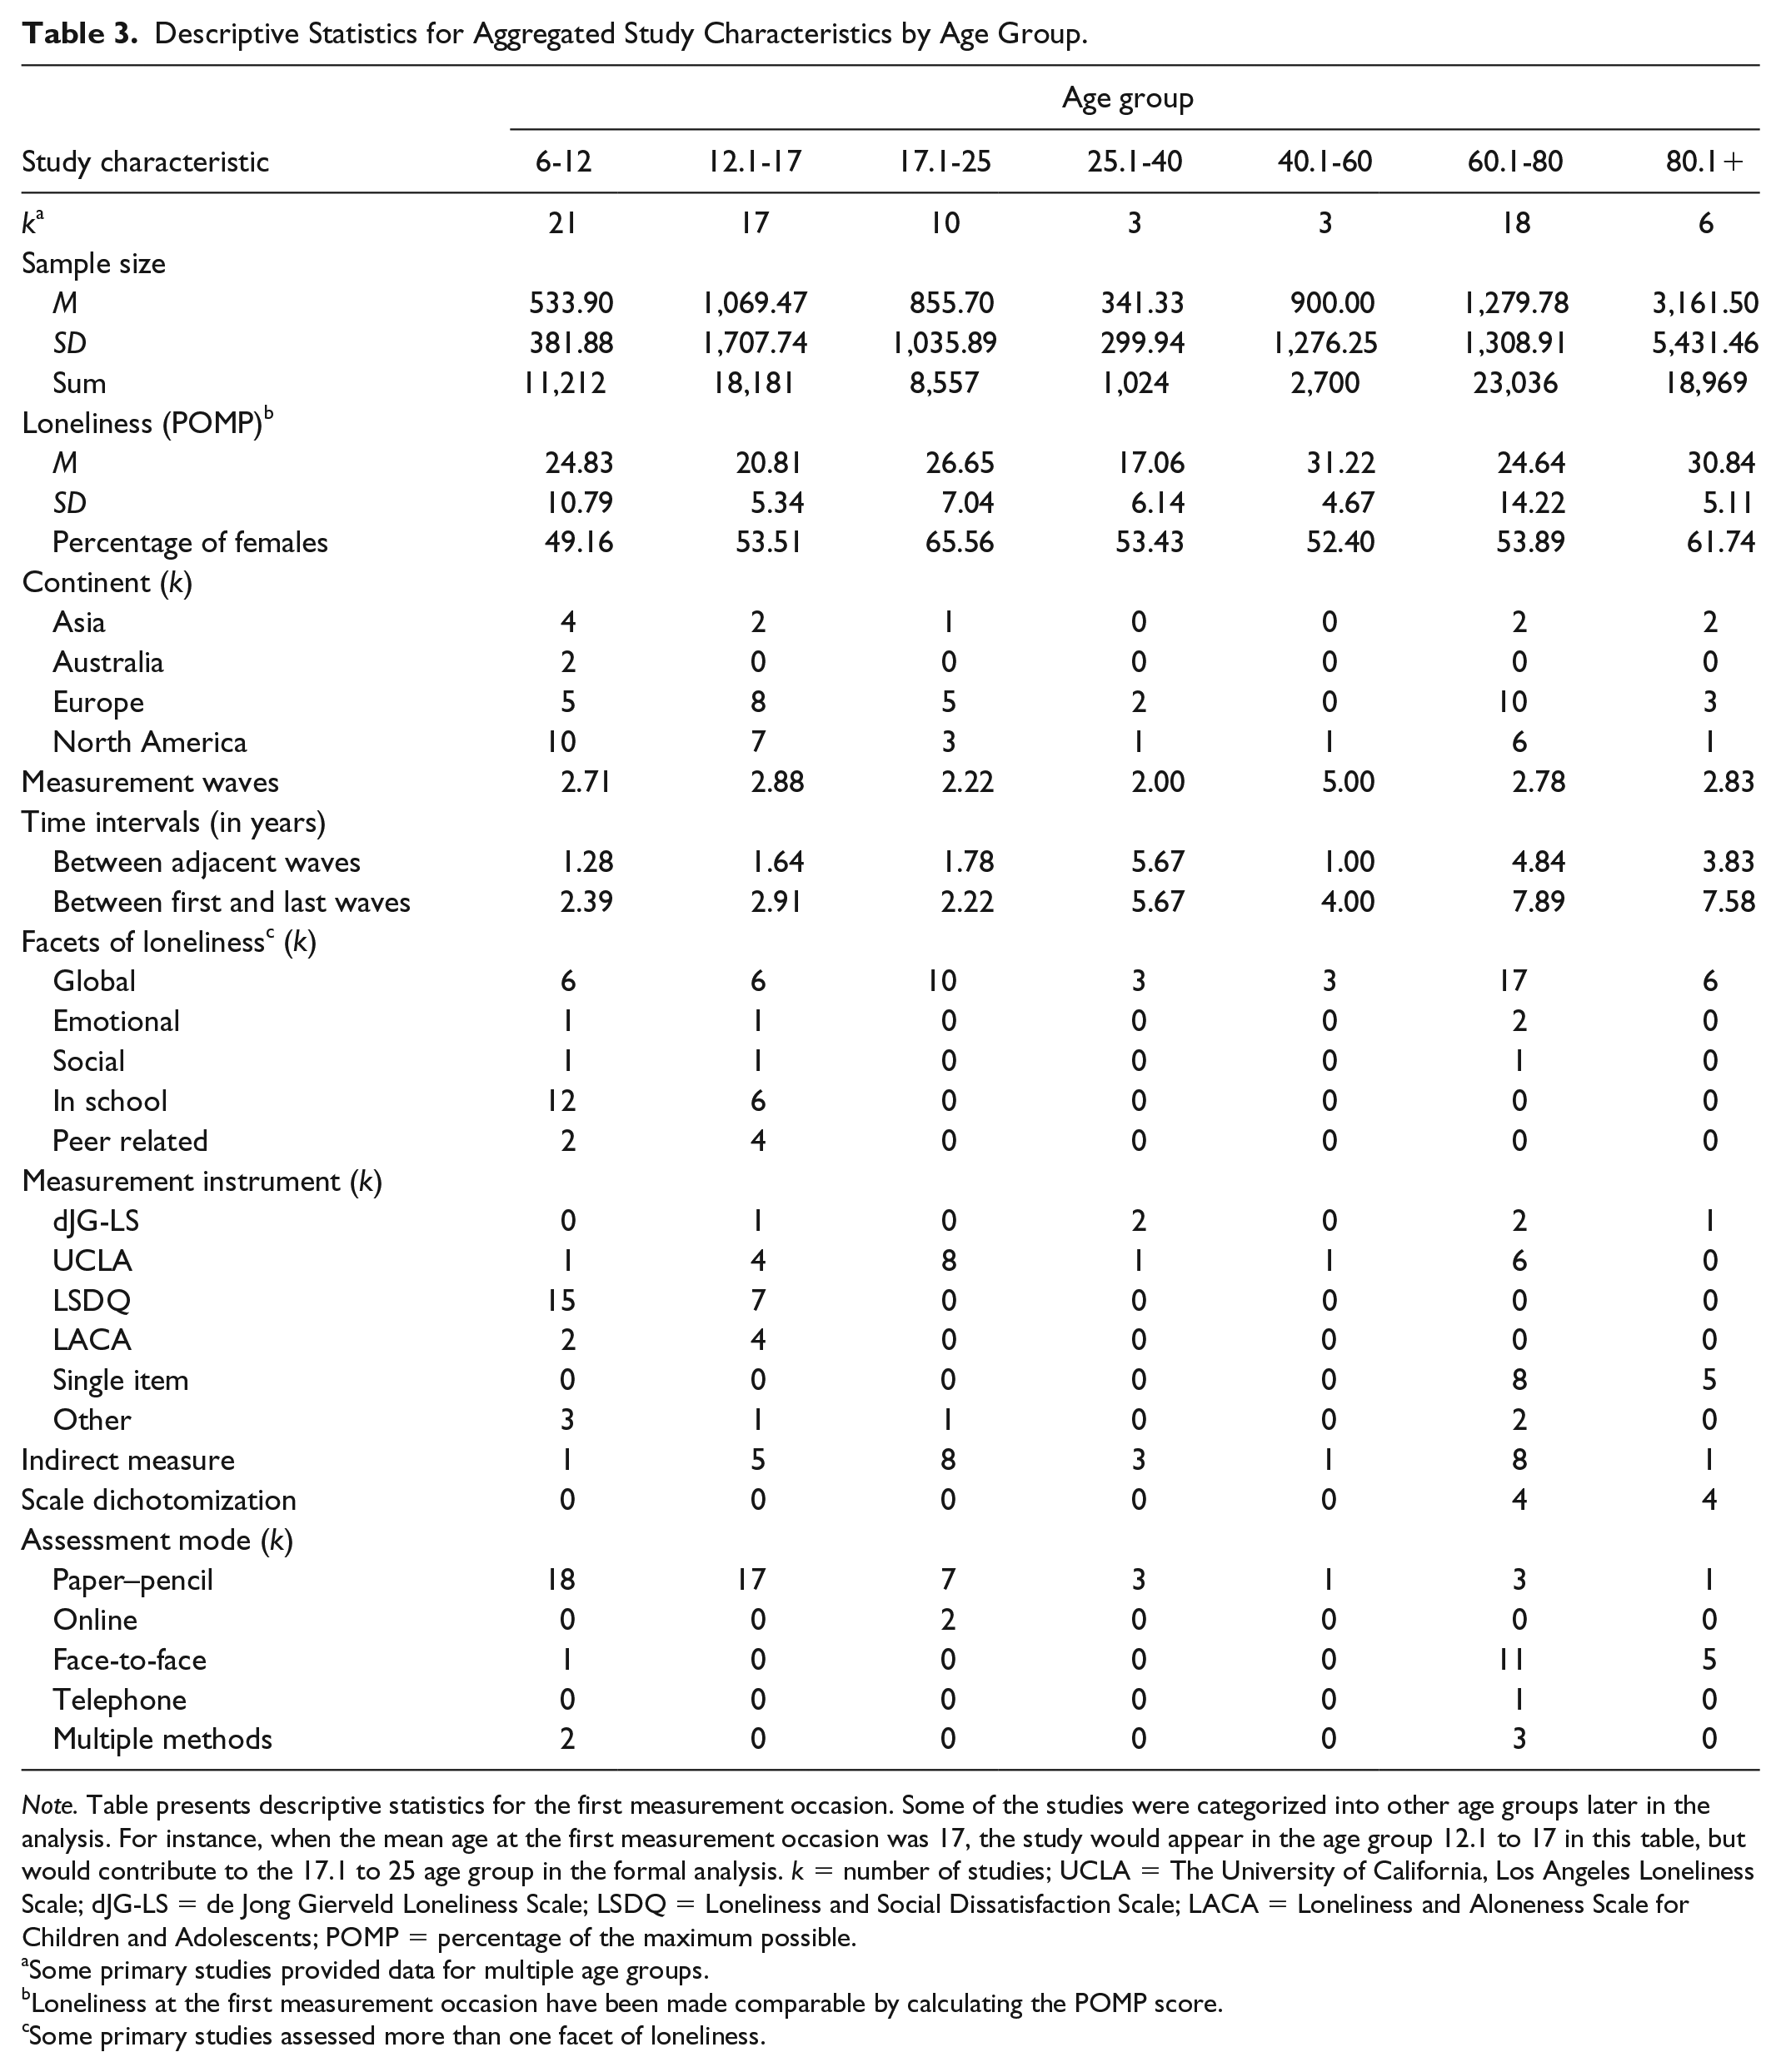
Note. Table presents descriptive statistics for the first measurement occasion. Some of the studies were categorized into other age groups later in the analysis. For instance, when the mean age at the first measurement occasion was 17, the study would appear in the age group 12.1 to 17 in this table, but would contribute to the 17.1 to 25 age group in the formal analysis. k = number of studies; UCLA = The University of California, Los Angeles Loneliness Scale; dJG-LS = de Jong Gierveld Loneliness Scale; LSDQ = Loneliness and Social Dissatisfaction Scale; LACA = Loneliness and Aloneness Scale for Children and Adolescents; POMP = percentage of the maximum possible.
Some primary studies provided data for multiple age groups.
Loneliness at the first measurement occasion have been made comparable by calculating the POMP score.
Some primary studies assessed more than one facet of loneliness.
Preliminary Analyses
In a preliminary analysis, we examined cross-sectional age differences in loneliness by using only the data of the first measurement occasion reported in the primary studies. To this end, we used the percentage of the maximum possible (POMP) score (P. Cohen, Cohen, Aiken, & West, 1999) to obtain a common scale for the different loneliness measures that have been employed in the primary studies. POMP is calculated as follows:
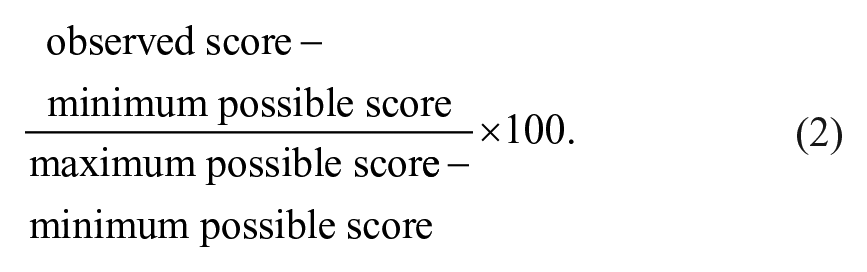
For instance, if the mean of loneliness at the first measurement occasion in a study using a scale ranging from 0 to 4 was 1, the POMP for this study would amount to 25%. Another study, which might have used a scale ranging from 1 to 5 with a mean loneliness amounting to 1.8, would result in a POMP of 20%. We calculated the unweighted average POMP for each age group (see also Table 3). The results of these analyses indicated a U-shaped pattern with a nadir in young adulthood and the highest levels of loneliness in oldest old age (see Figure 2a).
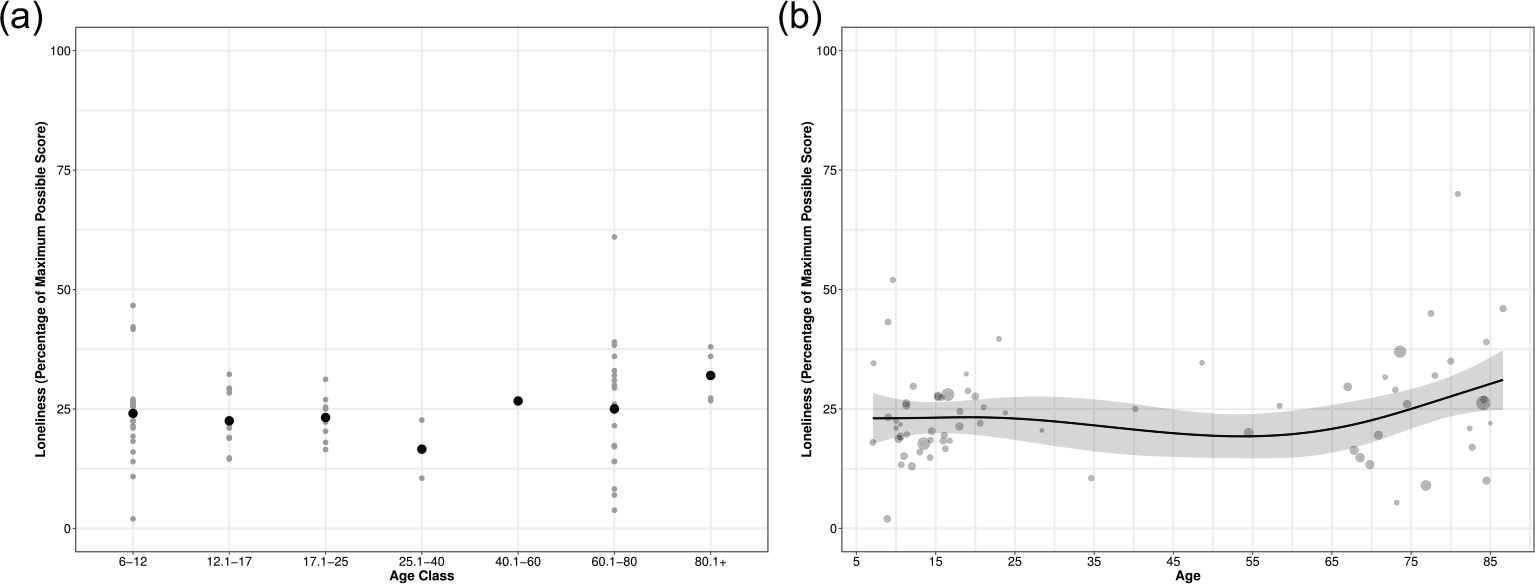
Results of the preliminary cross-sectional analysis for (Panel a) age groups and (Panel b) with age as a continuous predictor as estimated by weighted GAMM.
The cross-sectional pattern was very similar when incorporating age as a continuous predictor using GAMM (see Figure 2b). Specifically, the GAMM (weighted by the sample size of the primary studies) resulted in 2.857 edf (
Although the results of this preliminary analysis are encouraging, in that, they converge with previous cross-sectional studies on age differences (Perlman, 1990; Victor & Yang, 2012; Yang & Victor, 2011), they should also be treated with caution. On one hand, the selected longitudinal studies are not necessarily representative for all available studies on age differences due to factors such as sampling strategy, sample size, or instrumentation. On the other hand, it is not possible to extrapolate developmental patterns from such cross-sectional data (Kraemer et al., 2000). For this reason, it is important to build on the longitudinal nature of the included studies in the following analyses.
Stability of Interindividual Differences in Loneliness
As described above, the analysis of both the stability of interindividual differences in and the mean-level development of loneliness across the life span proceeded in three steps. First, we conducted interval-wise analyses to capitalize on the multiple measurement occasions realized in the primary studies (interval-wise analysis). Second, we capitalized on the length of the primary studies by investigating rank-order stability and changes in the means of loneliness between the first and last measurement occasions in each age group (maximum-length analysis). Third, in addition to using age groups, we incorporated age as a continuous predictor of the observed effect sizes using GAMM.
Interval-wise analysis
The upper part of Table 4 summarizes the main findings of the interval-wise analysis on the rank-order stability of loneliness across the life span. The left part of Table 4 displays the raw estimates of the rank-order stability of loneliness without any covariates. In the right part, we display the results of models that were adjusted for time interval. Specifically, for the interval-wise analyses, we centered the interval between measurement occasions to 1 year to obtain estimates of the 1-year stability of loneliness within each age group. The value of 1 year was chosen to enable comparisons with the rank-order stability of personality characteristics obtained by Roberts and DelVecchio (2000). 4 The results of the adjusted models are depicted in Figure 3a. In the following, we will pay particular attention to the results of the adjusted models.
Rank-Order Stability of Loneliness Across the Life Span.
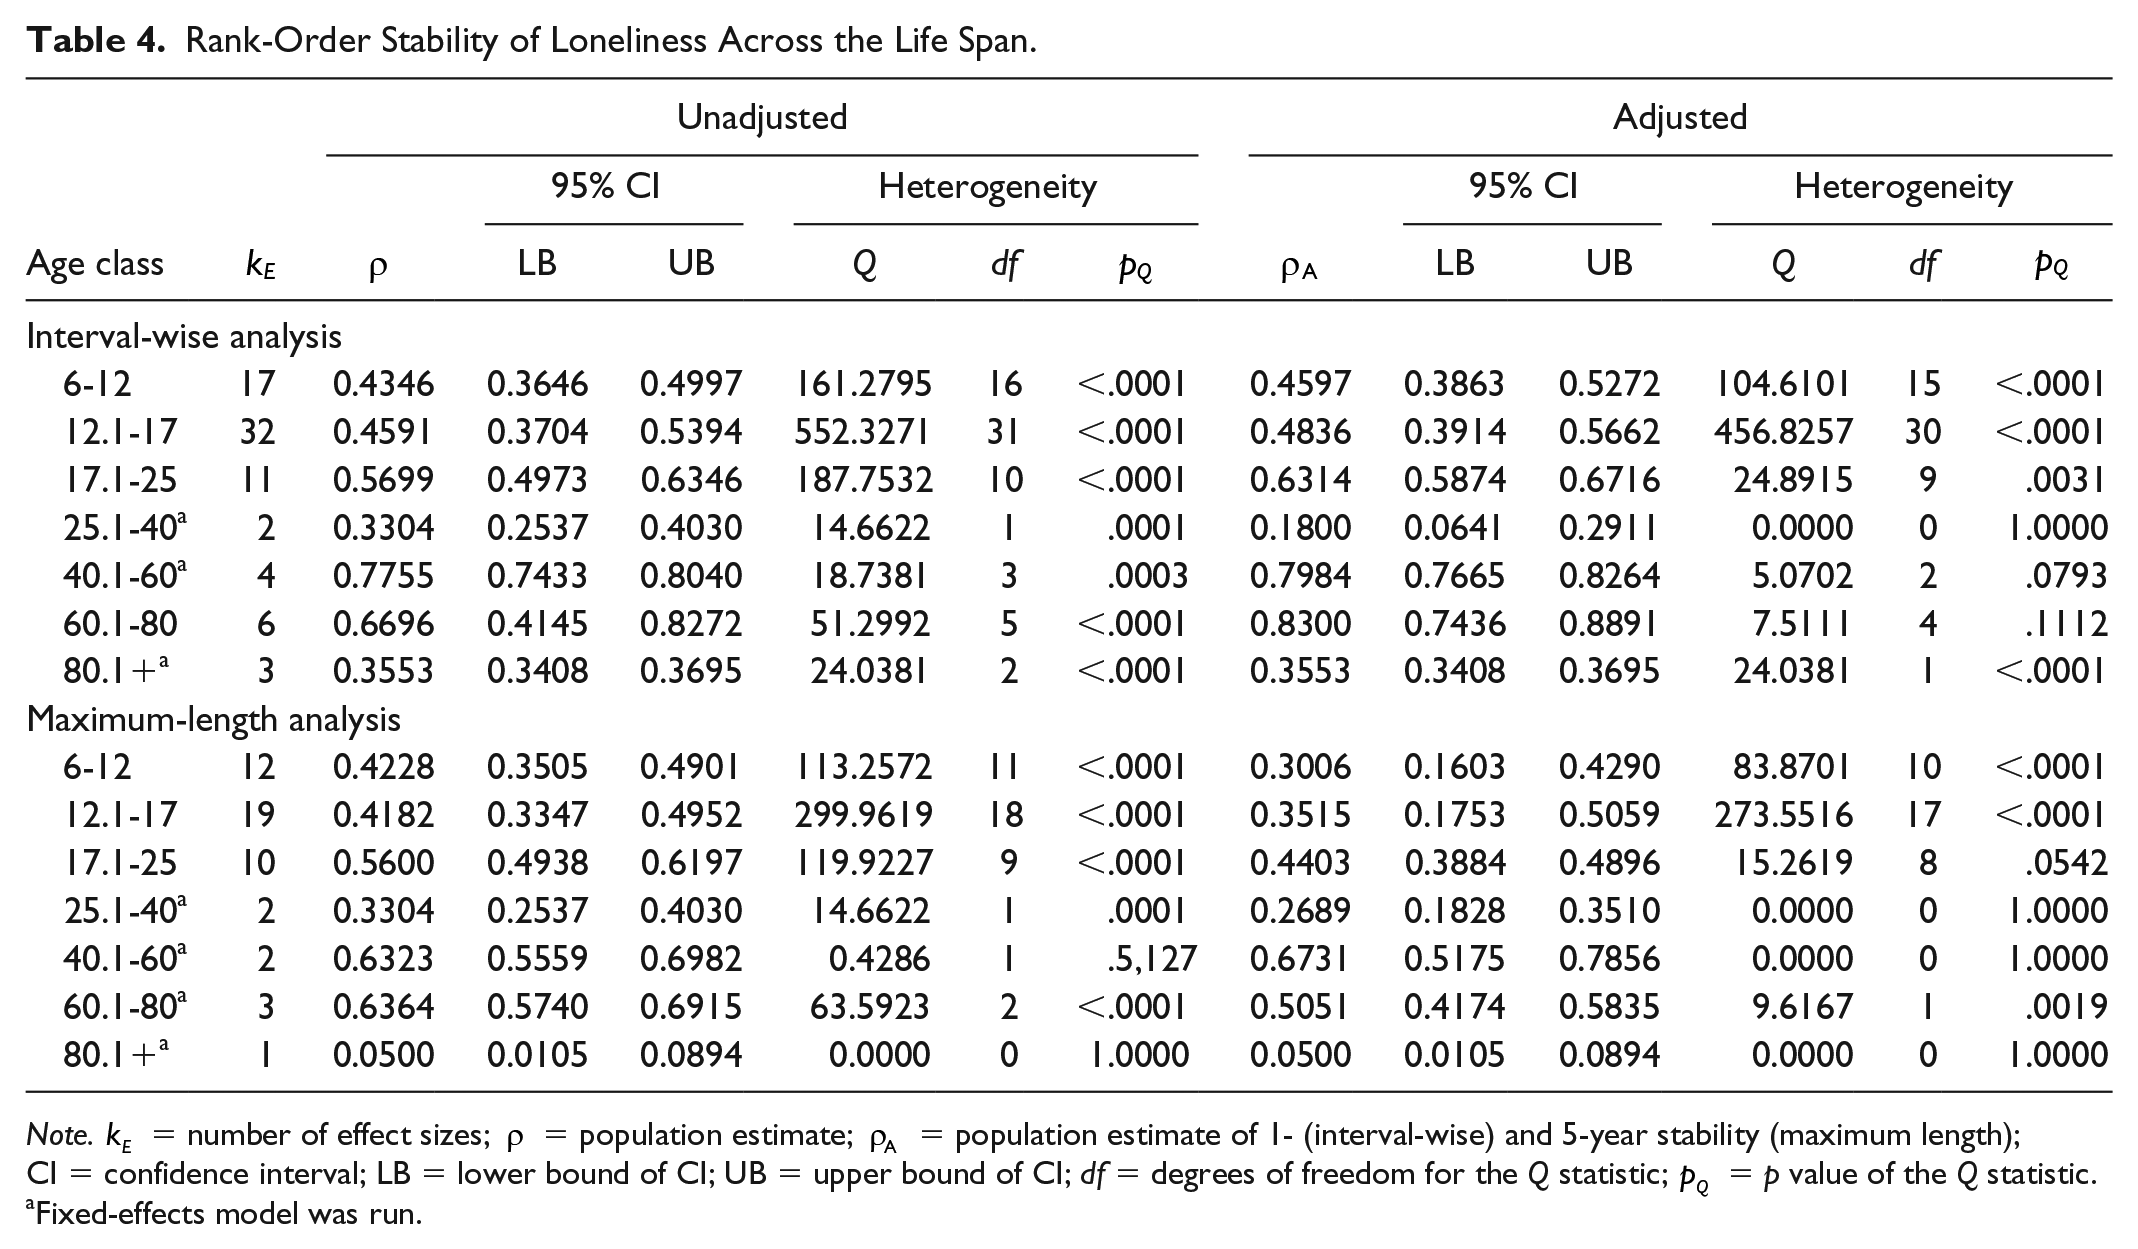
Note.
Fixed-effects model was run.
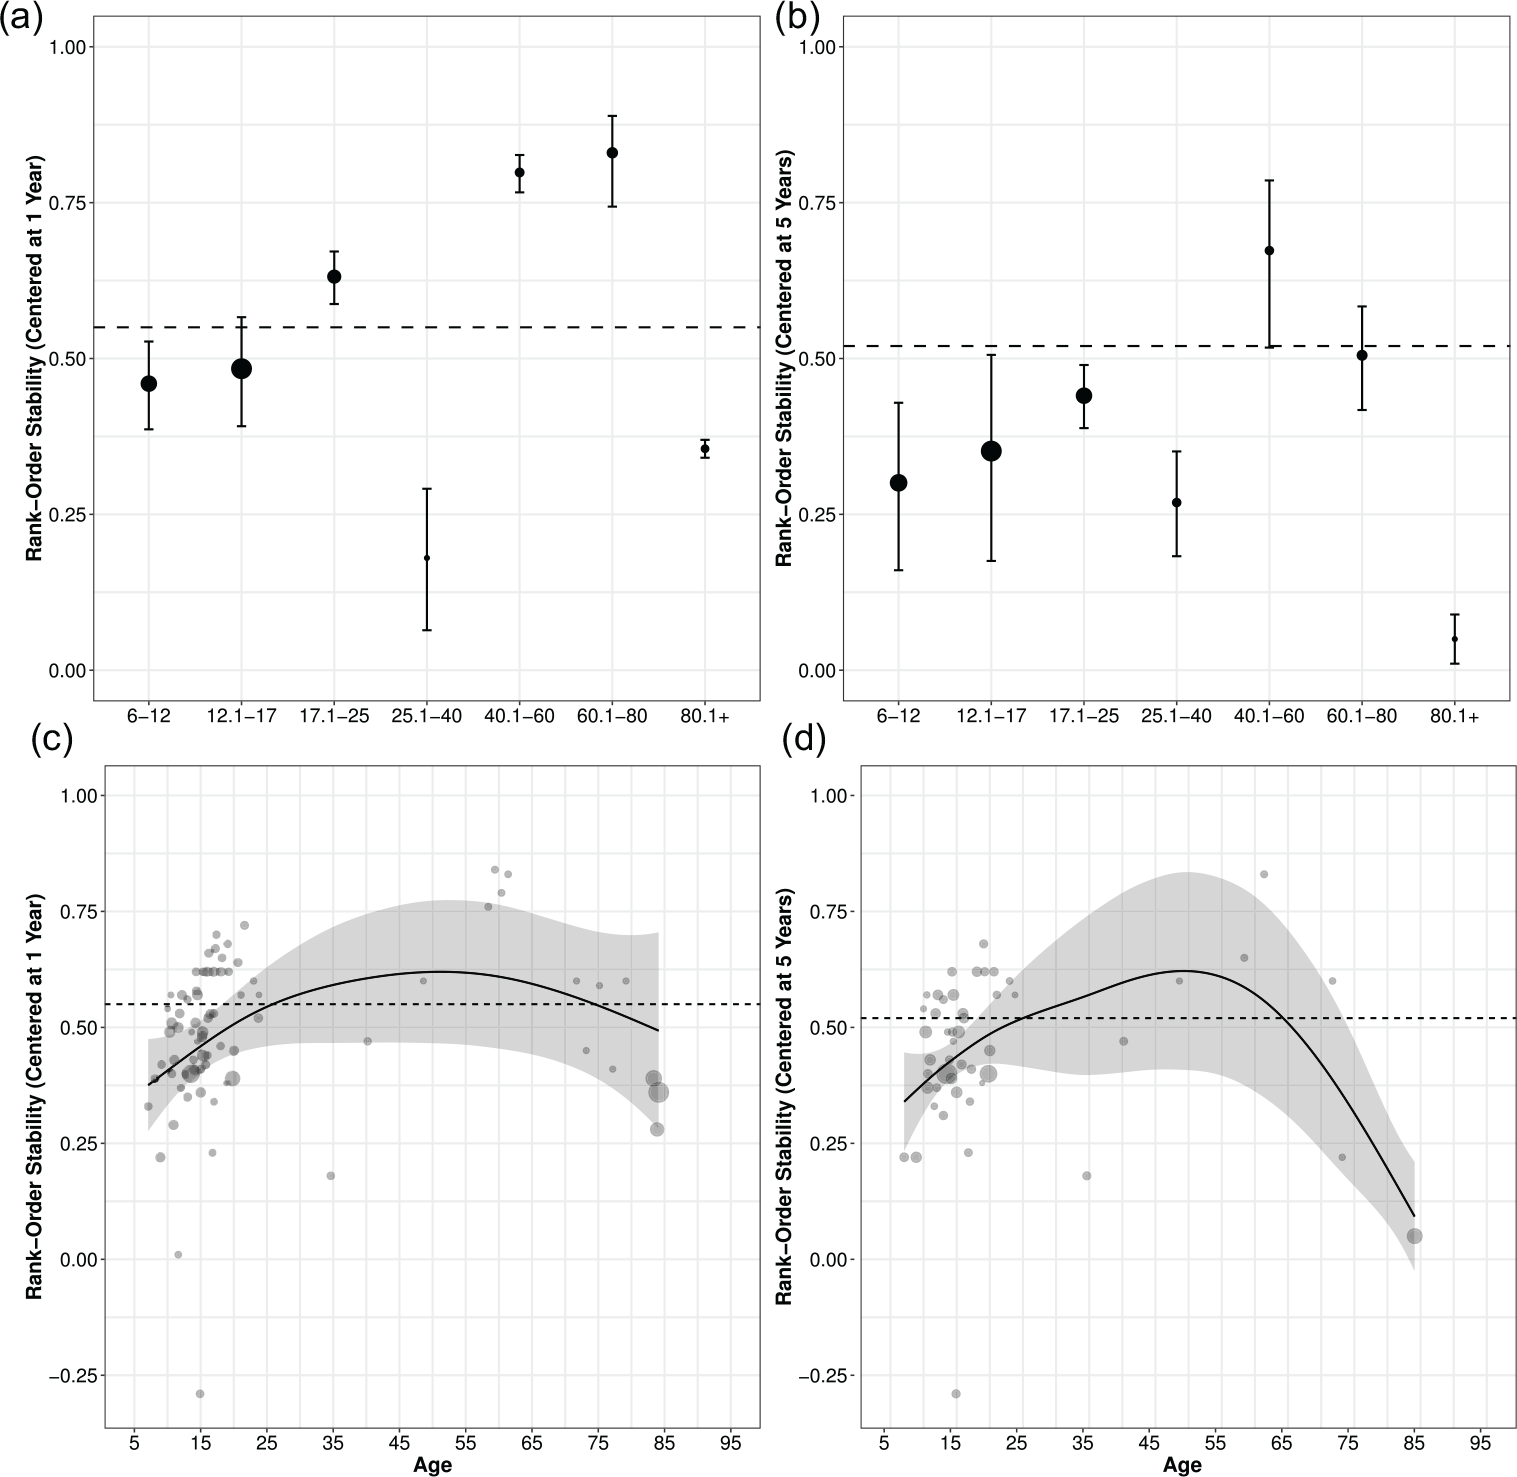
Rank-order stability of loneliness in different age groups over a period of 1 year (Panel a) and 5 years (Panel b), respectively, along with 95% confidence intervals (straight vertical lines).
As can be seen in Table 4 and Figure 3a, the stability of interindividual differences in loneliness reached small to large size with 1-year stability coefficients ranging from
Age as continuous predictor
Examining age as a continuous predictor of rank-order stability via GAMM yielded a bell-shaped association (see Figure 3c). The model estimated 2.314 edf (
Moderators
To assess moderators of the stability of interindividual differences in loneliness, we ran a series of mixed-effects meta-regressions (Viechtbauer, 2010). Specifically, building on the adjusted models displayed in Table 4, we included additional variables that might account for the heterogeneity in the observed effect sizes. As there were only few studies in several age categories and because some moderators were sparsely distributed across age groups (see Table 3), we combined all groups to run the moderator analyses (cf. Roberts & DelVecchio, 2000). The results of these analyses are displayed in the left portion of Table 5.
Moderators of Rank-Order Stability of Loneliness.
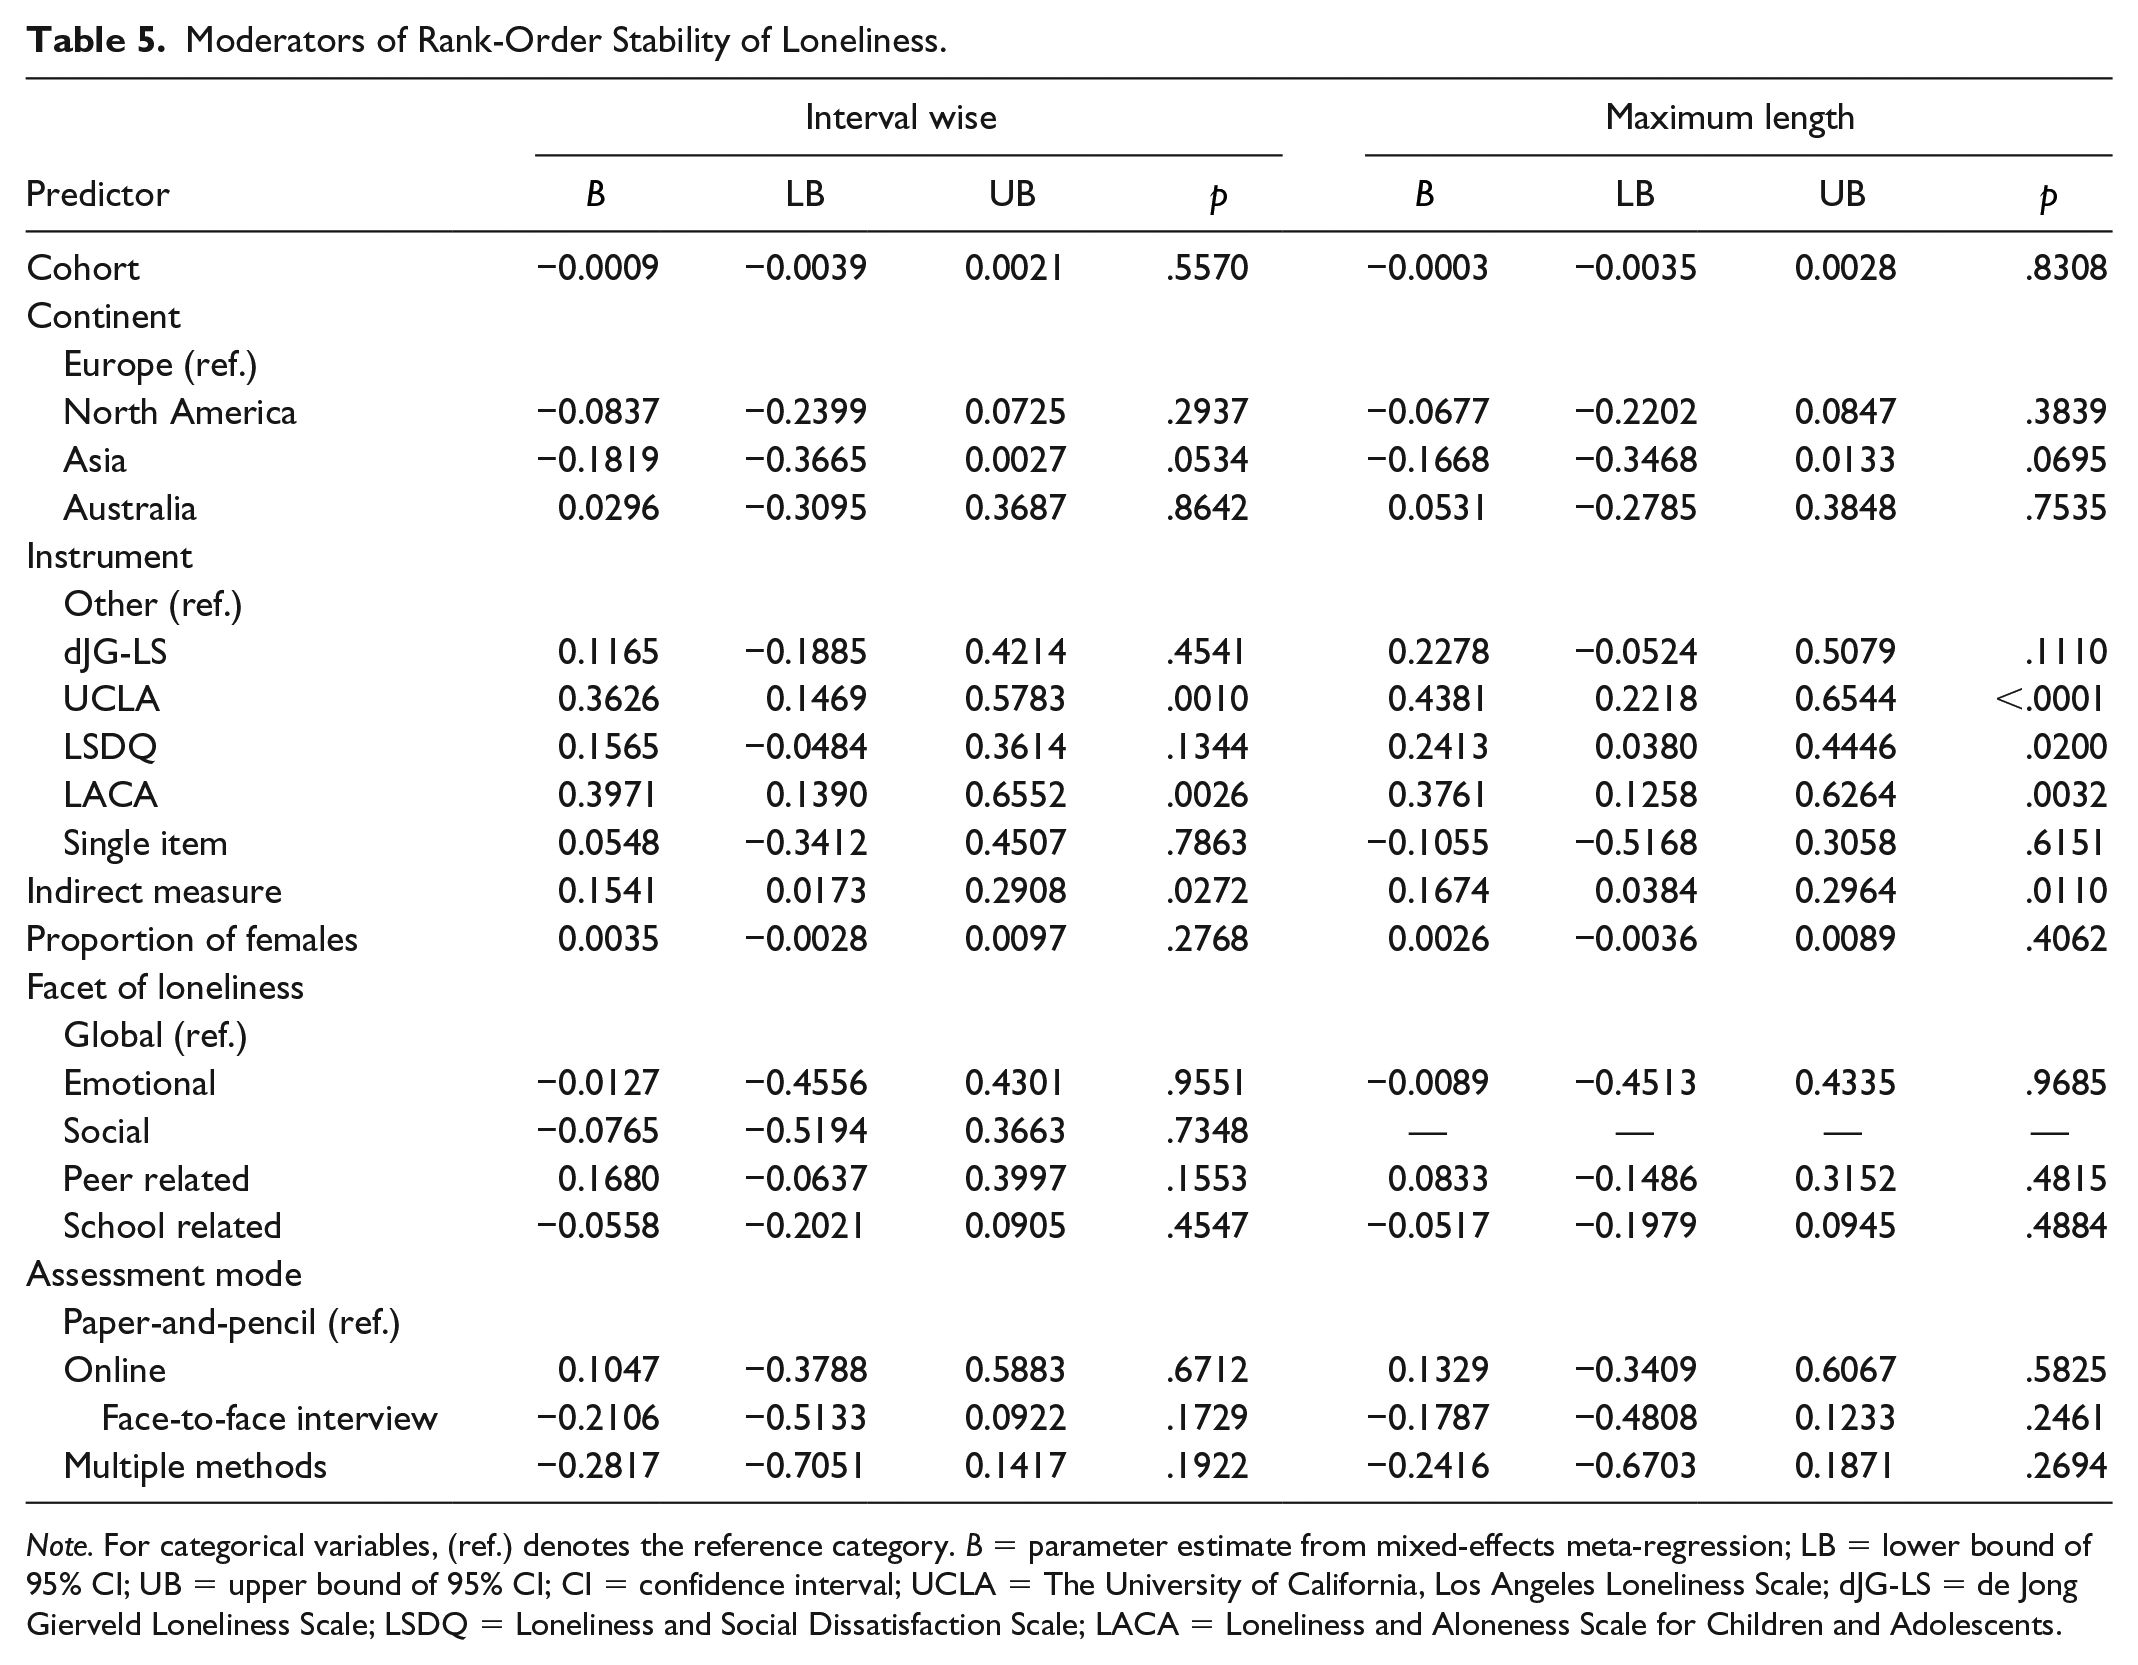
Note. For categorical variables, (ref.) denotes the reference category. B = parameter estimate from mixed-effects meta-regression; LB = lower bound of 95% CI; UB = upper bound of 95% CI; CI = confidence interval; UCLA = The University of California, Los Angeles Loneliness Scale; dJG-LS = de Jong Gierveld Loneliness Scale; LSDQ = Loneliness and Social Dissatisfaction Scale; LACA = Loneliness and Aloneness Scale for Children and Adolescents.
We found no differences in the stability coefficients for loneliness with respect to the facets of loneliness measured in the original studies, the assessment mode, the proportion of females sampled in the primary studies, the continent the sample originated from, or the birth cohort. However, we found several differences between measurement instruments. Specifically, when the UCLA or the LACA were used, the observed rank-order stability was higher than the rank-order stability as measured by other instruments (see Table 5). Furthermore, the LSDQ resulted in a lower rank-order stability than the UCLA (
Maximum-length analysis
The results for the analysis across the first and the last measurement occasions contained in each study are displayed in the lower half of Table 4. As with the interval-wise analyses described above, we will focus on the interpretation of the adjusted models. For the maximum-length analyses, we centered the time interval between the first and the last measurement occasions to 5 years. The results of these models are also displayed in Figure 3b. There was no indication of publication bias, given the nonsignificant result of the regression test (
Overall, the stability of interindividual differences in loneliness was smaller across 5 years than for the 1-year period. Specifically, the stability coefficients ranged from 0.05 in oldest old age to 0.67 in middle adulthood. The pattern, however, was very similar to the previous analysis with increasing stability from childhood to midlife, and decreases thereafter (see also Figure 3b). As before, the stability coefficients for loneliness were in most cases comparable with the average stability of other personality traits over 5 years (Roberts & DelVecchio, 2000), with the exception of oldest old age, for which the rank-order stability was close to 0. However, the results for young adulthood (Mund & Neyer, 2016; Muusses et al., 2014), middle adulthood (Cacioppo, Hawkley, & Thisted, 2010; Zhang, Yeung, Fung, & Lang, 2011), and oldest old age (Zhong et al., 2016) should be interpreted with caution as they are based on few effect sizes and are, thus, not generalizable beyond this set of studies.
Age as continuous predictor
For the maximum-length analysis, GAMM estimated 3.024 edf (
Moderators
Concerning moderators of the longer term stability of interindividual differences in loneliness, the results of the maximum-length analyses were similar to the interval-wise analyses (see Table 5). Specifically, stability coefficients did not differ between continents, birth cohorts, the facet of loneliness considered, the proportion of females in the original samples, or the assessment mode. We found, however, differences in stability coefficients with regard to the specific measurement instrument. Specifically, compared with other measures of loneliness, interindividual differences measured using the UCLA, LACA, and LSDQ were more stable over time (see right portion of Table 5). In addition, compared with the UCLA, rank-order stability was low when loneliness was measured with the LSDQ (
Mean-Level Development of Loneliness
Interval-wise analysis
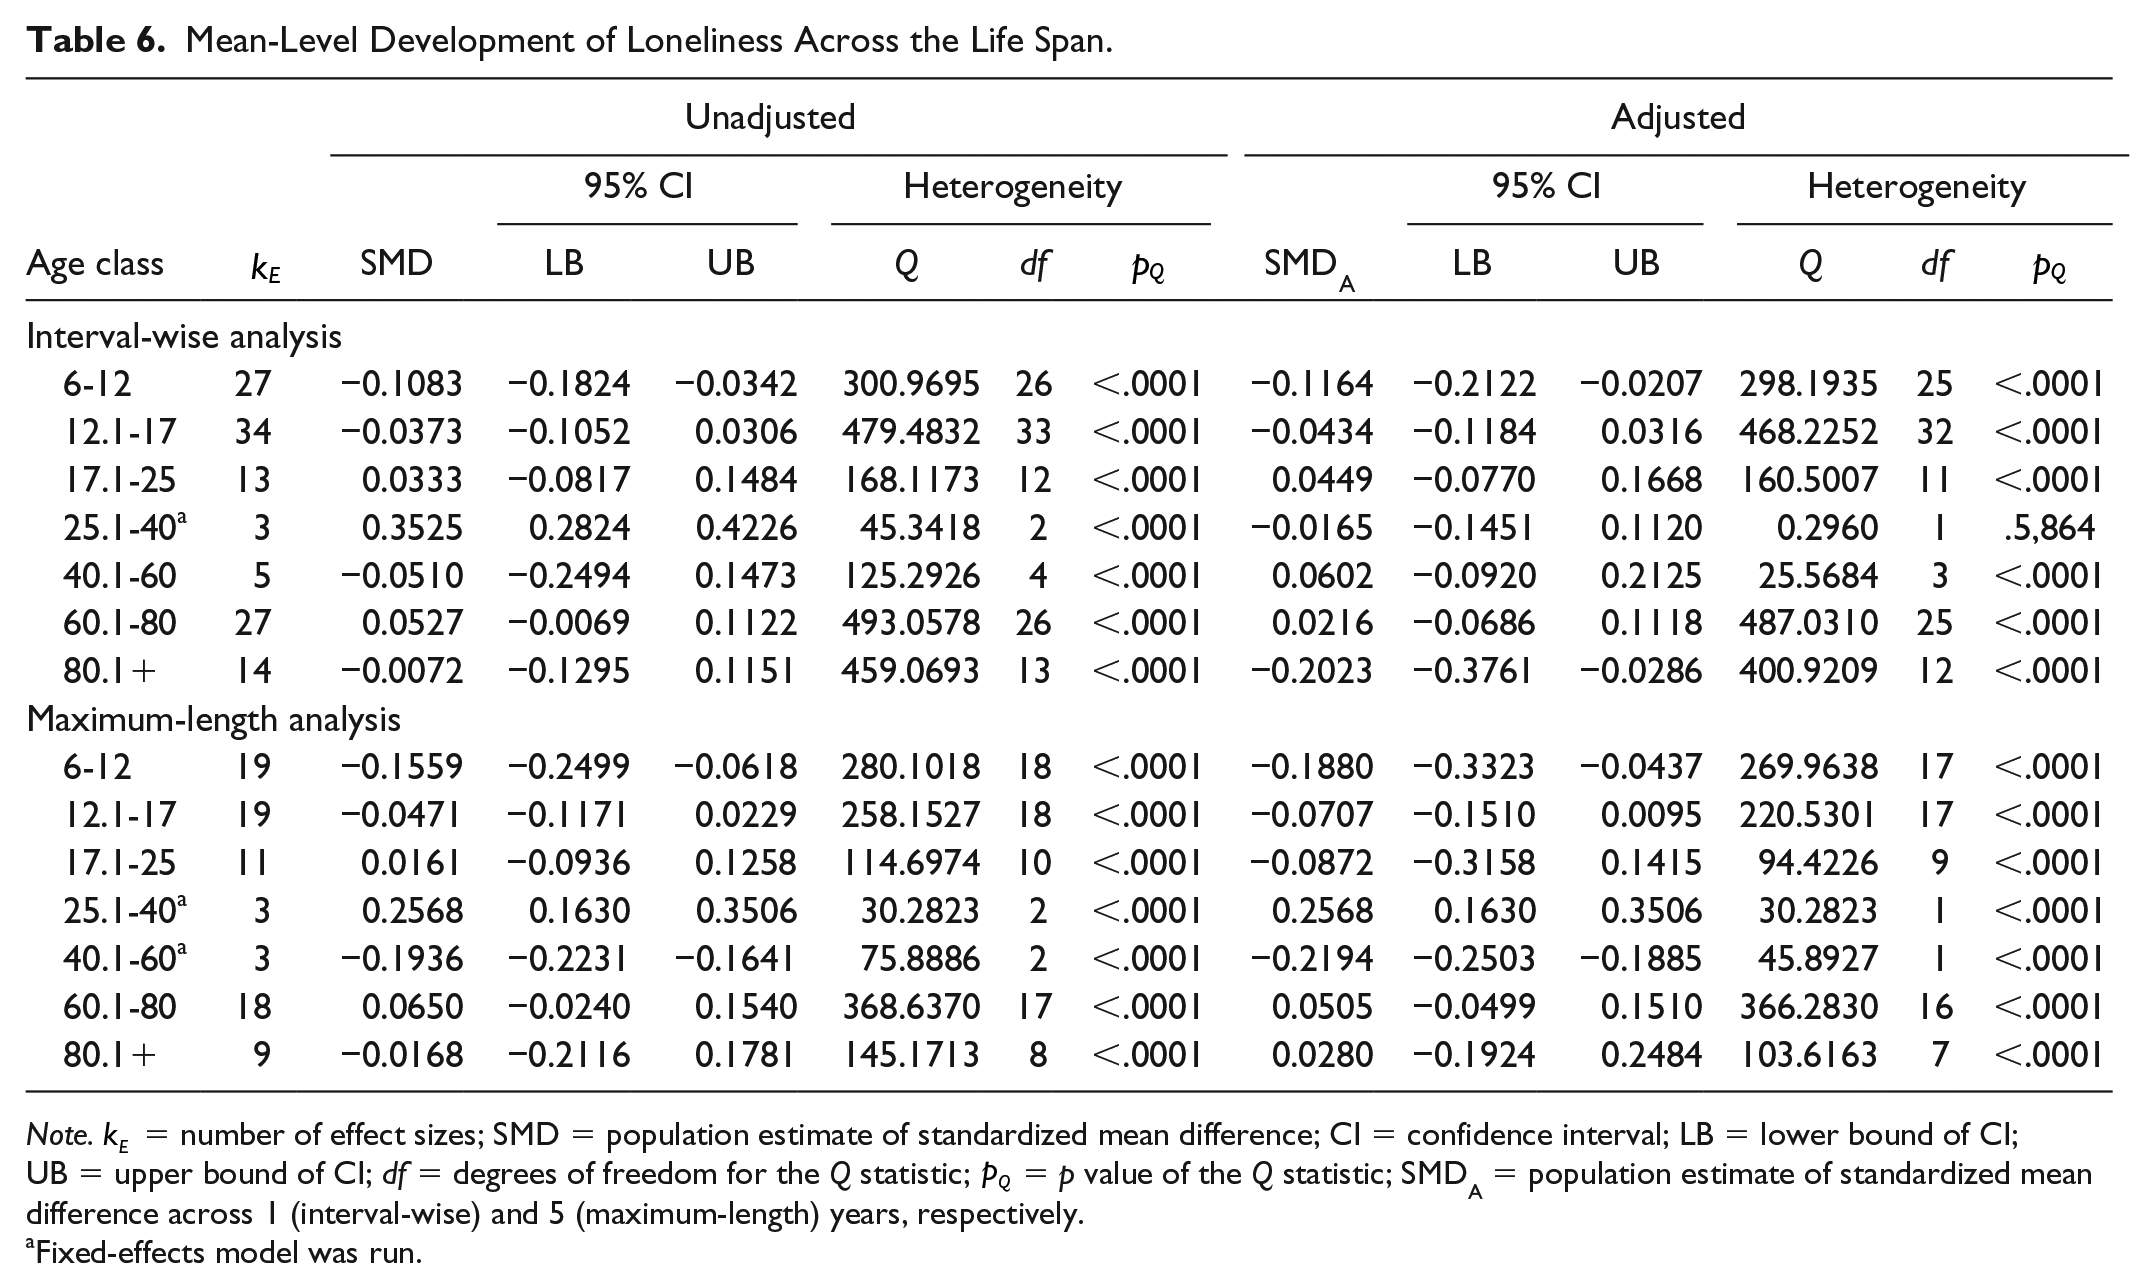
The upper part of Table 6 displays the weighted average change in the mean levels of loneliness within each age group. Figure 4a displays the results of the adjusted models, in which we estimated mean-level development over 1 year. Overall, the mean level of loneliness was found to remain rather stable across the life span, with slight decreases during childhood and oldest old age.
Mean-Level Development of Loneliness Across the Life Span.
Note.
Fixed-effects model was run.
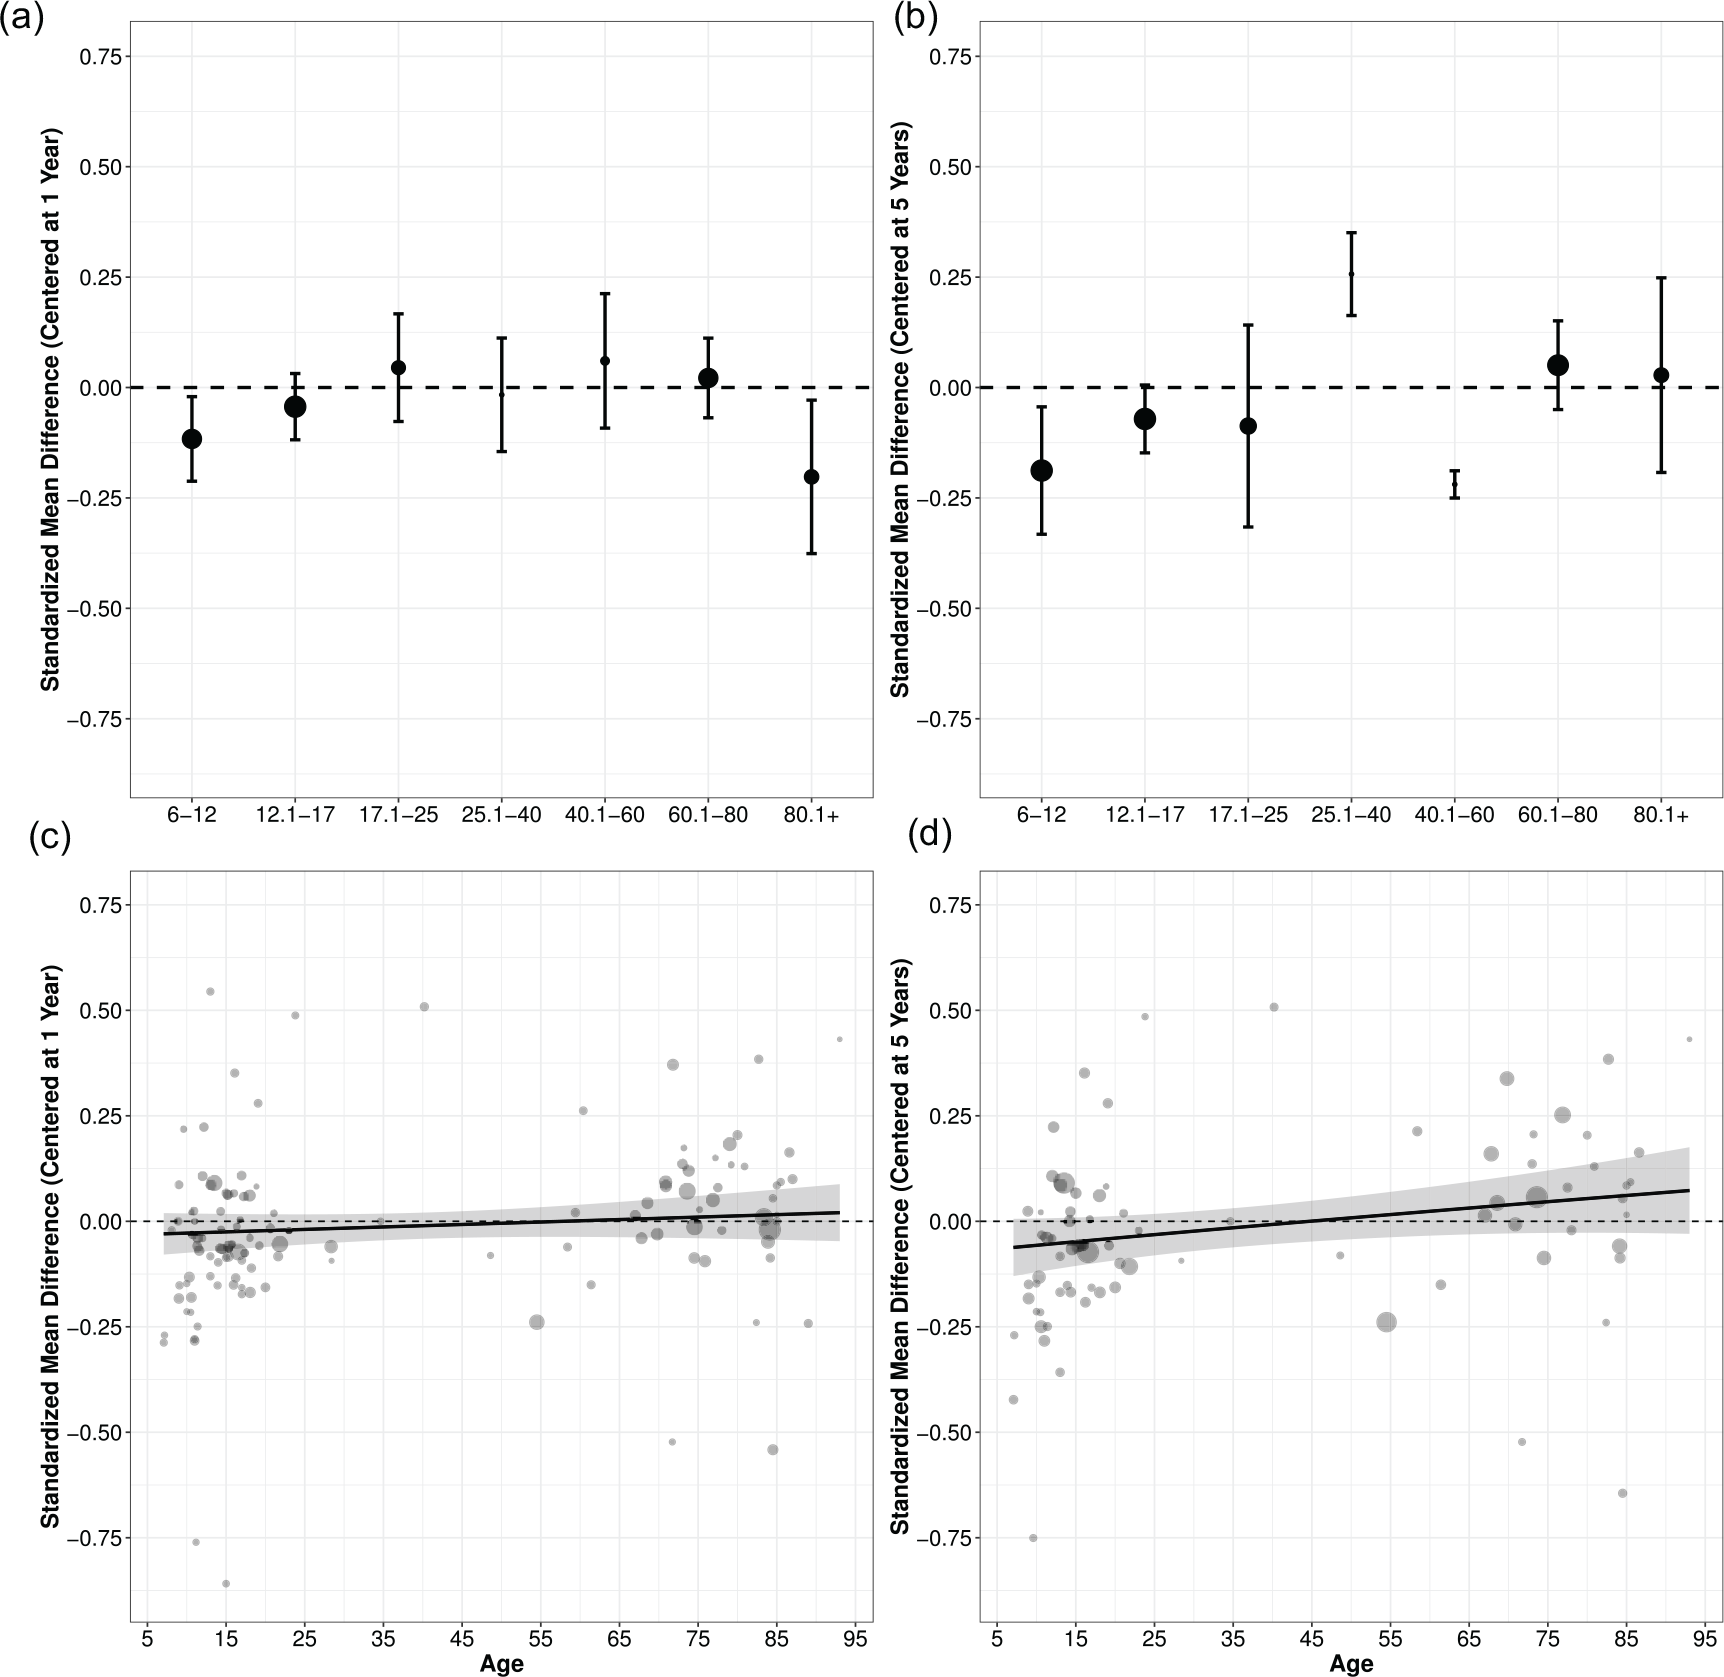
Mean-level development of loneliness in different age groups over a period of 1 year (Panel a) and 5 years (Panel b), respectively, along with 95% confidence intervals (straight vertical lines).
Age as continuous predictor
Supporting the conclusions drawn from the analysis based on age groups, we observed mean-level stability of loneliness across the life span when incorporating age as a continuous predictor using GAMM; no significant linear or higher order trend was found (see Figure 4c). Specifically, the model estimated 1 edf (
Moderators
Paralleling our previous line of action, we examined moderators of mean-level development based on the adjusted models. The results of the moderator analyses are displayed in the left portion of Table 7.
Moderators of Mean-Level Development of Loneliness.
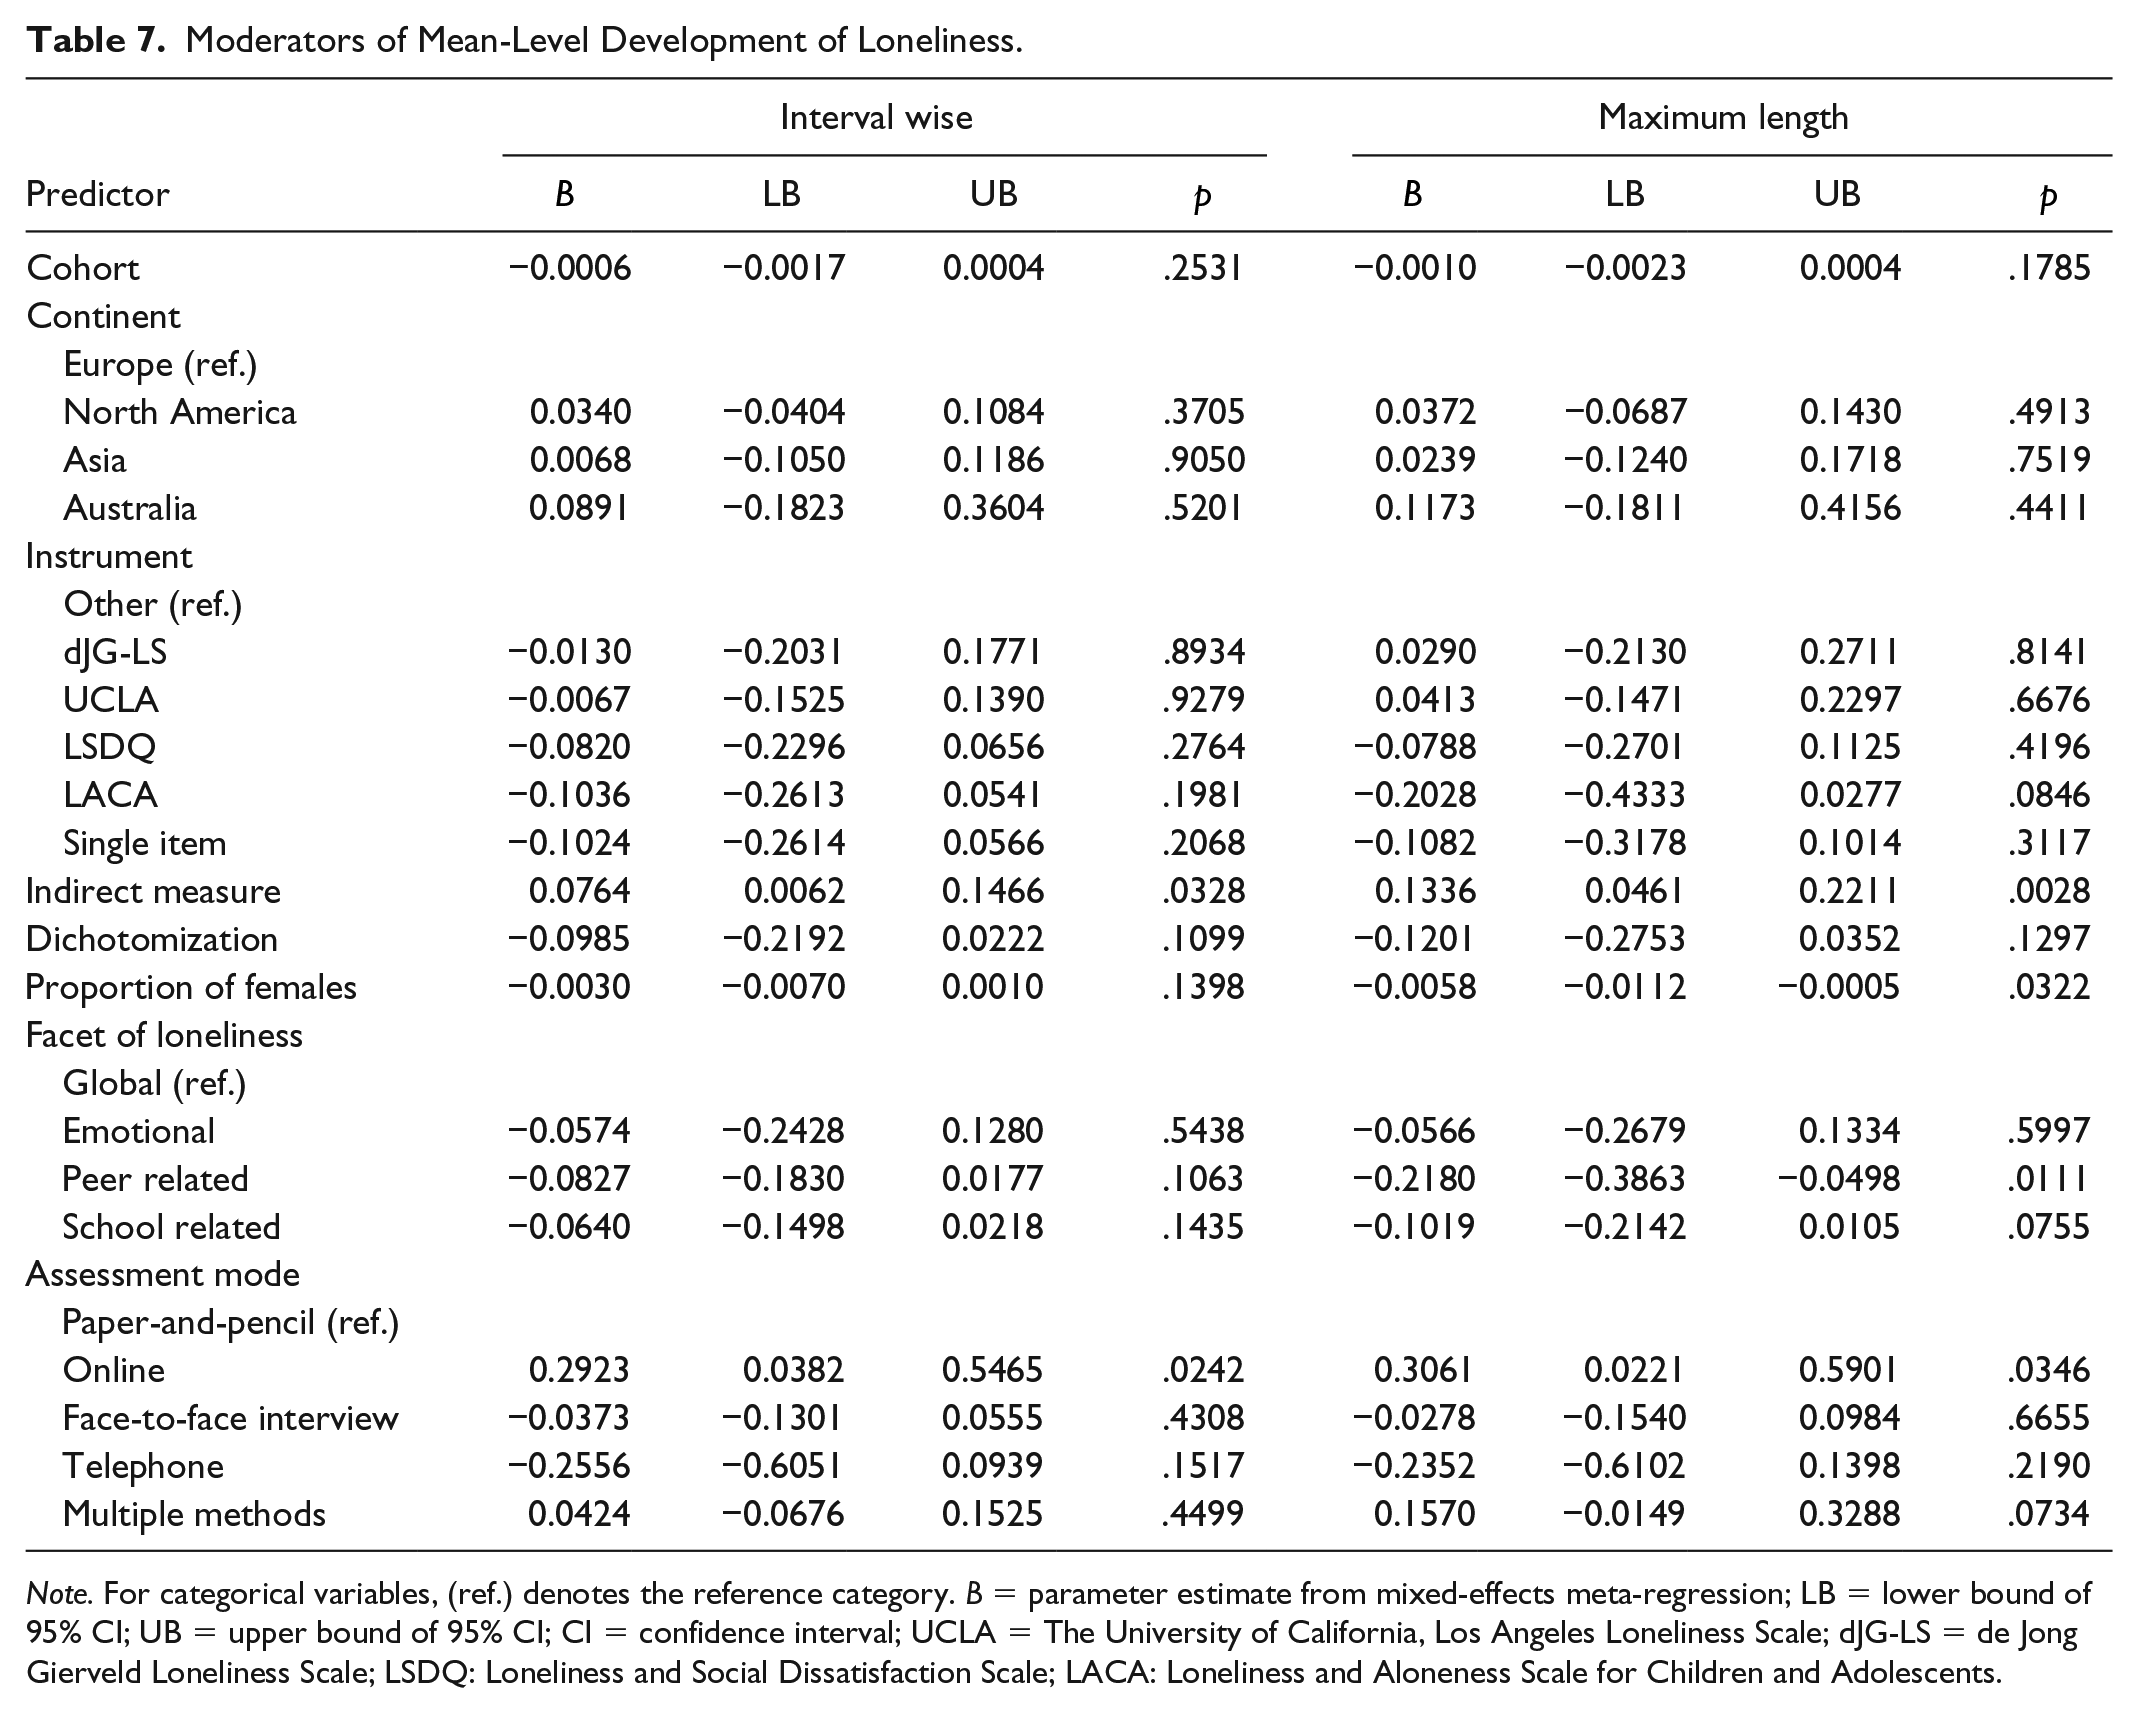
Note. For categorical variables, (ref.) denotes the reference category. B = parameter estimate from mixed-effects meta-regression; LB = lower bound of 95% CI; UB = upper bound of 95% CI; CI = confidence interval; UCLA = The University of California, Los Angeles Loneliness Scale; dJG-LS = de Jong Gierveld Loneliness Scale; LSDQ: Loneliness and Social Dissatisfaction Scale; LACA: Loneliness and Aloneness Scale for Children and Adolescents.
Differences in mean-level development were found with respect to the nature of the assessment instrument and the assessment mode. Specifically, the use of indirect measures was associated with mean-level increases (see left portion of Table 7). Furthermore, when participants were assessed online, the mean levels of loneliness tended to increase as compared with studies using paper–pencil questionnaires (
Maximum-length analysis
As displayed in the lower part of Table 6 and Figure 4b, loneliness showed no strong mean-level changes when the full length of the primary studies was taken into account. However, compared with the interval-wise analyses, in which we adjusted for a period of 1 year, changes in loneliness in childhood were more pronounced. The observed increases in loneliness during young adulthood followed by the sharp declines in middle adulthood are based on two (young adulthood) and three (middle adulthood) effect sizes, respectively. As a consequence, we ran FE models that do not allow generalizations to broader populations (Hedges & Vevea, 1998; Konstantopoulos & Hedges, 2009; Viechtbauer, 2010). Contrary to the interval-wise analysis, the maximum-length analysis did not indicate changes in the levels of loneliness in oldest old age. Given the nonsignificant result of the regression test (
Age as continuous predictor
GAMM estimated a function with 1.043 edf, which, however, did not reach statistical significance (
Moderators
With respect to moderators, we found significant effects for percentage of females in the sample, measurement instrument, facet of loneliness, and assessment mode (see right portion of Table 7). Regarding percentage of females in the original study, we found a higher proportion of females to be associated with decreases in loneliness over time.
With respect to measurement instruments, we found indirect measures of loneliness to be associated with increases in mean levels (see Table 7). Concerning the specific measurement instruments, we found that, compared with the UCLA Loneliness Scale, the LSDQ (
As for the interval-wise analysis, we found studies using an online assessment to be associated with increases in loneliness compared with studies employing paper–pencil questionnaires (
Discussion
Individuals experience loneliness when they perceive a discrepancy between the aspired quantity and the degree of intimacy and closeness in social relations and the actually experienced amount thereof (de Jong Gierveld, 1998; Ernst & Cacioppo, 1999; Hawkley & Cacioppo, 2010; Perlman & Peplau, 1981). In the present study, we extended prior research on loneliness by providing a comprehensive meta-analysis on the stability and change of loneliness across the life span through synthesizing data from 75 longitudinal studies.
Stability of Interindividual Differences in Loneliness
Overall, interindividual differences in loneliness were found to be stable over 1 year but more volatile over 5 years. The finding that interindividual differences in a given characteristic are less stable over longer time periods converges with findings from prior analyses on other constructs (Ferguson, 2010; Fraley & Roberts, 2005; Roberts & DelVecchio, 2000; Trzesniewski et al., 2003). Moreover, the results of the present study imply that interindividual differences in loneliness are—in most of the age periods examined—at least as stable as interindividual differences in other personality characteristics (Ferguson, 2010; Roberts & DelVecchio, 2000). Thus, the present findings indicate that loneliness has trait-like features and that some individuals always feel lonelier than others, irrespective of their current circumstances. However, because the stability coefficients were far away from perfect stability, there is still much room for individual and differential changes in all age groups.
The pattern of rank-order stability of loneliness across age mirrors the findings of similar meta-analyses on other personality characteristics (Ferguson, 2010; Roberts & DelVecchio, 2000; Trzesniewski et al., 2003). Specifically, we found the stability of interindividual differences in loneliness to increase from childhood through young adulthood, to peak in midlife (i.e., around age 50), and to decrease thereafter. The finding that the rank-order stability of loneliness is lower in oldest old age than in other age groups is consistent with other findings on personality development in this age period (Lucas & Donnellan, 2011; Wortman, Lucas, & Donnellan, 2012). With regard to loneliness, two recent studies also support the high amount of differential change among the oldest old (Hawkley & Kocherginsky, 2018; Yang, 2018). Although the pattern and magnitude of interindividual differences in loneliness converge with findings for other personality characteristics, it should be kept in mind that the observed pattern is partly based on very few studies, particularly in age groups older than 25.
The bell-shaped pattern of the development of interindividual differences in personality across the life span can be explained by the interplay between genetic and environmental stability. Specifically, whereas the contribution of genetic factors to the stability of interindividual differences remains stable across the life span, the influence of environmental factors on the rank-order stability increases with age (Bartels, Cacioppo, Hudziak, & Boomsma, 2008; Briley & Tucker-Drob, 2014; Kandler, 2012). Similarly, whereas genetic continuity has been found to increase from moderate levels in childhood to almost perfect stability in young adulthood, environmental continuity has been found to be modest in childhood, but to increase across adulthood and to closely approach levels of genetic stability (Briley & Tucker-Drob, 2014). Put differently, between-person differences in a wide range of personality characteristics stabilize across age because individuals increasingly succeed in constructing a relatively stable niche that suits their personality (Buss, 1987; Scarr & McCartney, 1983). With respect to loneliness, this also implies that individuals who feel lonely at a relatively young age might be caught in a niche full of unsatisfying relationships, so that their loneliness becomes self-sustaining (J. T. Cacioppo & Hawkley, 2009; Hawkley & Cacioppo, 2010; Qualter et al., 2015; Vanhalst et al., 2015). In oldest old age, the niches that individuals have constructed appear to become more fragile (Kandler, 2012), possibly due to the occurrence of adverse life events such as bereavement or the experience of frailty (Bosma et al., 2015; Hawkley & Kocherginsky, 2018; Hensley et al., 2012; Savikko et al., 2005; Yang, 2018). Such experiences give rise to stronger differential development and, hence, a lower rank-order stability.
Moderators
In the present study, we found no evidence for interindividual differences in loneliness to vary (a) across different parts of the world, (b) across birth cohorts, (c) between females and males, (d) between different facets of loneliness, or (e) between assessment modes. We found, however, interindividual differences in loneliness to be particularly stable when loneliness was measured with either the LACA or the UCLA. This finding cannot be explained by both instruments being predominantly used in age periods that are characterized by already high rank-order stability. Specifically, the UCLA was used in samples from adolescence to old age, whereas the LACA was used in studies with children and adolescents (see Table 3), and hence in age periods in which interindividual differences are less stable than in later periods in life. Despite the high convergent validity between various instruments to assess loneliness (Grygiel et al., 2013; Maes et al., 2017), this finding highlights the importance of improving the understanding of how different instruments to measure loneliness operate in different settings and how they differ in terms of correlates and consequences (Marangoni & Ickes, 1989; Shiovitz-Ezra & Ayalon, 2012; Victor et al., 2005).
Mean-Level Development of Loneliness
The results of the present meta-analysis indicate mean-level stability of loneliness across the life span. Over a period of 1 year, loneliness was found to decrease slightly in childhood and oldest old age. Over a period of 5 years, loneliness was found to decrease in childhood and midlife. Increases in loneliness were only found in young adulthood over a period of 5 years. When incorporating age as a continuous predictor, however, we found no evidence for any mean-level trends whatsoever. Before we discuss the results in more detail, it should be kept in mind that mean-level stability does not preclude the occurrence of both individual change and interindividual differences in intraindividual change (Mund et al., 2018). First, individual change might be initiated, for instance, by life events that occur for some but not all individuals (e.g., Fried et al., 2015; Hensley et al., 2012; see also Neyer et al., 2014). Second, observed sample variance in loneliness has been repeatedly shown to be attributable to several latent trajectory classes of individuals who strongly differ from each other concerning their developmental course (e.g., Harris, Qualter, & Robinson, 2013; Qualter et al., 2013; Hawkley & Kocherginsky, 2018; Schinka, van Dulmen, Mata, Bossarte, & Swahn, 2013; Vanhalst et al., 2015; Yang, 2018). The mean-level changes of these different trajectory groups might cancel each other out so that no mean-level change is observable on the sample level.
To summarize, the absence of mean-level changes in loneliness indicate that the mean-level development is not bound to age. Put differently, there seems to be no normative pattern regarding changes in loneliness across the life span. Hence, increases or decreases in loneliness cannot be considered an age-specific phenomenon; in contrast, such changes appear to be related to individual experiences.
Comparison with other characteristics
The observed pattern of mean-level changes for loneliness diverges from developmental trends for related constructs such as neuroticism, self-esteem, depression, and subjective well-being. Neuroticism has been found to decrease until age 60, when it levels off (Roberts et al., 2006). According to the results of the present meta-analysis, the mean levels of loneliness appear to decrease in childhood but to be rather stable afterward. This finding is especially important, as it has been recently demonstrated that loneliness and neuroticism share a common genetic basis (Abdellaoui et al., 2019; Aitken Schermer & Martin, 2019; for a review, see Spithoven, Cacioppo, Goossens, & Cacioppo, 2019). These findings might indicate that neuroticism reflects the overall propensity of individuals to experience negative affect, whereas loneliness reflects the tendency to experience negative affect particularly in social situations. These differences are also mirrored in moderate meta-analytic phenotypic correlations between loneliness and neuroticism in the magnitude of
In a recent meta-analysis on the mean-level development of self-esteem, Orth et al. (2018) found a bell-shaped pattern with increases during childhood, relative stability during adolescence, strong increases in emerging and young adulthood, and continued, but less steep increases until age 60, when self-esteem reached a plateau. Starting at age 70, self-esteem began to decrease until age 94. This pattern is evidently different from the pattern characterized by mean-level stability that we have found in the present study.
With regard to depression, recent large-scale longitudinal studies reported very different trajectories across the life span (Nivard et al., 2015; Sutin et al., 2013b). Specifically, Sutin et al. (2013b) found decreases in depression from age 20 to age 60 and increases thereafter. Nivard et al. (2015), in contrast, reported increases in depression from childhood until age 25, and slight decreases thereafter for women; for men, depressive symptoms slightly increased from childhood to age 25 but remained stable afterward. None of these trajectories resembles the pattern for loneliness found in the present meta-analysis.
Finally, in two large-scale longitudinal studies, subjective well-being has been found to increase with age in an almost linear fashion after accounting for cohort effects (Sutin et al., 2013a). Again, this pattern is inconsistent with the mean-level trends observed for loneliness in the present study. Taken together, the divergences between the mean-level development of loneliness, neuroticism, self-esteem, depression, and subjective well-being indicate that loneliness shows a unique developmental pattern and should be considered a personality characteristic in its own right.
Factors influencing the observed pattern of mean-level development
The results of several studies on the development of personality traits across the life span have shown that mean-level development occurs as the result of the interplay between genetic influences, unique life experiences (Bleidorn, Kandler, & Caspi, 2014; Bleidorn, Kandler, Riemann, Angleitner, & Spinath, 2009; Hopwood et al., 2011; Kandler, Kornadt, Hagemeyer, & Neyer, 2015), and geneome environment transactions (Plomin, DeFries, & Loehlin, 1977; Scarr & McCartney, 1983). Unlike rank-order stability (Bartels et al., 2008; Briley & Tucker-Drob, 2014; Kandler, 2012), however, it is unclear whether and when genetic or environmental influences predominate. Thus, although we will mainly discuss possible environmental sources for the observed pattern of mean-level development of loneliness, genetic and interaction effects might also account for these patterns (for a review, see Bleidorn et al., 2014).
In childhood, average levels of loneliness were found to decrease in the analyses across 1-year (using age groups) and 5-year intervals (using age groups). Childhood is the time when individuals establish an idea of what it means to have friends (Hartup & Stevens, 1997) and the social networks of children are, on average, very large (Hartup & Stevens, 1997; Wrzus et al., 2013). At the same time, it is the age period when individuals develop an understanding of what it means to be lonely (Asher et al., 1984; Asher & Paquette, 2003). Furthermore, there are two normative life transitions in childhood as conceptualized in the present study (i.e., ranging from 6-12 years of age)—the transition from kindergarten to school and the transition from primary to secondary education. The average decreases of loneliness in this age period suggest that many children master the challenge of finding and establishing meaningful peer relationships even in times of transition. However, this should not draw the attention away from the children who have difficulties in relating with others (Nishimura, Murakami, & Sakurai, 2018; Asher & Wheeler, 1985; Cassidy & Asher, 1992).
For the other age groups, we primarily found evidence for mean-level stability. In adolescence, this mean-level stability might be due to the relative stability of the environment, which is strongly structured by school life and characterized by stable social contacts with classmates, teachers, and friends.
In emerging and young adulthood, a peak in the size of individuals’ social networks in general and the number of friends in particular is reached (Carmichael, Reis, & Duberstein, 2015; Hartup & Stevens, 1997; Wrzus et al., 2013). As a consequence, individuals might have a large pool of affiliates from which they can choose (and change) their closest friends. At the same time, individuals have to strike a balance between having a large network, on one hand, and meaningful, intense relationships, on the other hand. The interplay between these factors might contribute to the overall stability of the mean level of loneliness in these age periods.
Midlife and old age are assumed to be characterized by stable environments (e.g., Helson, Soto, & Cate, 2006), which might also be reflected in relatively stable levels of loneliness. Another possible mechanism that might keep loneliness on a relatively stable level in these age periods is provided by socioemotional selectivity theory (Carstensen, 1992, 1995). This theory posits that individuals are selective with respect to whom they chose to keep in their network, particularly when their network begins to serve the function of emotion regulation (i.e., around age 60; Carstensen, 1995). Thus, as individuals grow older, they tend to intensify close and more intimate relationships and to let go of less close relationships.
Finally, in oldest old age, loneliness was found to decrease over shorter time periods (using age classes), but to remain stable over 5 years (using age classes and age as a continuous predictor). These divergent findings indicate large fluctuations in individual’s levels of loneliness (see also Hawkley & Kocherginsky, 2018; Yang, 2018). Such fluctuations as well as potential groups following different developmental trajectories might result in overall stability when considering the sample mean. Furthermore, most studies involving oldest old individuals are affected by a positive selection bias (Gerstorf, Ram, Lindenberger, & Smith, 2013). That is, as loneliness has been found to be related to an increased mortality risk (Holt-Lunstad et al., 2015; Luo & Waite, 2014; Patterson & Veenstra, 2010; Shiovitz-Ezra & Ayalon, 2010), individuals with higher or increasing loneliness might have deceased earlier in the course of the primary studies, leaving only individuals with lower levels of loneliness, so that the sample mean of loneliness remains unchanged over time. Future studies might benefit from inspecting loneliness not only concerning chronological age but also relative to the death of individuals (Gerstorf et al., 2013).
Moderators
In the present study, we found no evidence for generational differences in the mean-level development of loneliness. This finding implies that, although levels of loneliness might change between birth cohorts (Clark et al., 2015; Yan et al., 2014; but see Dahlberg et al., 2018; Eloranta et al., 2015; Hülür et al., 2016; Lempinen et al., 2018; Nyqvist et al., 2017; Victor et al., 2002), the age-specific development seems to be unaffected by such trends. The absence of cohort effects is in line with results of meta-analyses on the mean-level development of the Big Five personality traits and self-esteem (Orth et al., 2018; Roberts et al., 2006), as well as with findings on the development of subjective well-being (Sutin et al., 2013a).
The results of the present meta-analysis further indicated no cultural differences in the mean-level development of loneliness. This finding might be due to the universal nature of the challenge to establish close and intimate relationships (Axelrod & Hamilton, 1981; Baumeister & Leary, 1995; Cacioppo, Cacioppo, Cole, et al., 2015). It should be kept in mind, though, that similar patterns of mean-level development of loneliness in Europe, North America, Asia, and Australia do not preclude differences in the absolute levels of loneliness. That is, it is well possible that individuals from societies that more strongly emphasize cohesion might feel lonelier overall than individuals from more individualistic countries (Anderson, 1999; Hawkley, Gu, et al., 2012; Johnson & Mullins, 1987).
Mean-level development was significantly moderated by the percentage of females in the original samples in a way that samples with more females documented larger overall decreases in loneliness across intervals of 5 years. This effect, however, was very small and needs to be substantiated in future research. Nevertheless, it might well be possible that females increasingly succeed in organizing their social network in a way that feelings of loneliness are reduced. For instance, women have been shown to have a higher need for affiliation than men (Drescher & Schultheiss, 2016) and might be more versed in initiating reaffiliation (Qualter et al., 2015) when they experience a discrepancy between their intended and their currently experienced amount of intimacy.
With respect to methodological moderators, mean levels of loneliness tended to increase over time when indirect measures of loneliness were employed. This finding is in line with other studies showing higher prevalence of loneliness when indirect measures are used (Shiovitz-Ezra & Ayalon, 2012; Victor et al., 2005). This pattern of results suggests that indirect measures might indeed circumvent individuals’ tendencies to social desirable responding that might affect responses on direct measures of loneliness requiring self-labeling (Marangoni & Ickes, 1989). Furthermore, studies conducted online tended to be associated with increases in loneliness. As there were only few online-based primary studies; however, these results must remain preliminary and subject to future research.
Limitations and Future Directions
Longitudinal research on loneliness is centered around childhood, adolescence, and old age. In contrast, particularly young and middle adulthood are largely unconsidered by now. Future research needs to fill this gap to better understand the life span development of loneliness along with its conditions and consequences. Although this dearth of studies in these age periods is a major limitation of the present meta-analysis, it is also an urgent call for more longitudinal research. This is all the more important to provide policy makers and researchers with a solid ground on which to base interventions and political decisions (Cracknell, Wilson, Perks, & Bellis, 2017; Jo Cox Commission on Loneliness, 2017; Masi, Chen, Hawkley, & Cacioppo, 2011).
Furthermore, although it is widely accepted that loneliness is a multifaceted construct (Ernst & Cacioppo, 1999; Maes et al., 2015; Marangoni & Ickes, 1989; Marcoen & Brumagne, 1985; Weiss, 1973), 62% of the studies included in the present meta-analysis have assessed global loneliness and only three studies (Junttila & Vauras, 2009; Rius-Ottenheim et al., 2012; Wang, Frison, Eggermont, & Vandenbosch, 2018) have assessed multiple facets simultaneously. Given that the facets of loneliness have been reported to have both different sources and different consequences (e.g., DiTommaso & Spinner, 1997; Lasgaard, Goossens, Bramsen, et al., 2011; Maes et al., 2015; van Baarsen et al., 2001), it might be worthwhile for future research to more routinely implement multifaceted measures of loneliness whenever possible to better understand their developmental course across the life span (see also Marangoni & Ickes, 1989).
In addition to these two broader issues, the present study has several other limitations. First, meta-analyses provide broad and general overviews of a field of research. The effects found in the present study, however, were highly heterogeneous, which indicates substantial sampling variance. Presumably due to the topical breadth of the included studies and the sparse distribution of several of the coded moderators, this heterogeneity could not be explained substantially. As a consequence, the observed variance in effect sizes might be accounted for by other variables that we did not code or that were not reported in the primary studies. Future studies might still observe differential and mean-level development that differs from the aggregated effect sizes reported in the present work. Nevertheless, most of these results should fall within the reported CIs (Hedges & Vevea, 1998; Viechtbauer, 2010).
Second, our focus in the present work was on the stability of interindividual differences and mean-level development of loneliness across the life span. However, there are several more indices of stability and change that might be worthwhile to consider for future research such as individual or profile stability and change (Roberts et al., 2008). Third, both genetic and environmental influences contribute to phenotypic loneliness (Boomsma, Willemsen, Dolan, Hawkley, & Cacioppo, 2005; Bartels et al., 2008; Goossens et al., 2015; Spithoven et al., 2019). In explaining the observed patterns of rank-order and mean-level development, we often had to draw on findings of genetic and environmental contributions reported for other personality characteristics (Bleidorn et al., 2009; Briley & Tucker-Drob, 2014 ; Hopwood et al., 2011; Kandler, 2012). Future research might examine whether these results are similar for loneliness and ultimately disentangle genetic and environmental sources of the development of loneliness.
Conclusion
With the present study, we provide the first comprehensive overview of the stability and change of loneliness across the life span. We found interindividual differences in loneliness to be generally as stable as interindividual differences reported for other personality characteristics (Ferguson, 2010; Roberts & DelVecchio, 2000; Trzesniewski et al., 2003). Likewise, as other personality characteristics, the rank-order stability of loneliness was found to follow a bell-shaped pattern across the life span. Accordingly, the stability of interindividual differences in loneliness was found to increase from childhood through adulthood, peak in midlife, and to decrease during old and oldest old age.
With respect to mean-level development, we found loneliness to decrease in childhood, and to remain stable from adolescence to oldest old age. This pattern of overall mean-level stability seems to be a unique feature of loneliness and has not been found for other characteristics such as neuroticism, self-esteem, depression, and well-being. Thus, changes in loneliness do not seem to be a normative concomitant of age, but might rather be attributed to individual experiences.
Taken together, the results of the present meta-analysis suggest that loneliness is a characteristic with unique trait-like features. Loneliness seems to be situated right in between the poles of stability and change. A large proportion of the changes in loneliness appear to occur at the individual level, and it will be a major challenge for future research to uncover the conditions and consequences of these individual changes.
Footnotes
Declaration of Conflicting Interests
The author(s) declared no potential conflicts of interest with respect to the research, authorship, and/or publication of this article.
Funding
The author(s) received no financial support for the research, authorship, and/or publication of this article.