
Abstract
This article summarizes national data on completed homicides for eight countries in three time periods: around 1980, 1990, and 2000. The eight countries are England/Wales, the United States, Sweden, Australia, Scotland, Switzerland, the Netherlands, and Canada. In each year, the article presents the number of police-recorded crimes, the number of persons convicted, the number of offenders sent to custody, average sentence length, average time served, and all linking probabilities. It also shows changes in all these measures between 1980, 1990, and 2000 in different countries. It would be desirable to carry out longitudinal research, tracking offenders through the criminal justice system.
It is very important to specify and explain the flow of offenders from crimes committed to time served in prison. For example, what is the probability of an offender being convicted, and what factors influence this probability? What is the probability of a convicted offender being sent to custody, and what factors influence this probability? What is the average sentence length and average time served, and what factors influence these quantities?
It is also important to investigate the influence (if any) of criminal justice probabilities on crime rates. For example, to what extent does the probability of an offender being convicted influence crime rates, and how and why? To what extent does the probability of a convicted offender being sent to custody influence crime rates, and how and why? To what extent do average sentence length and average time served influence crime rates, and how and why? Of course, it is also possible that crime rates may influence these linking probabilities.
The study of changes over time can be helpful in answering these questions. For example, what is the effect on crime rates of increases or decreases in the probability of an offender being convicted or sent to custody? This research could tell us whether changes in the probabilities were followed by changes in crime rates, or vice versa. Similarly, the comparison of different countries can be helpful in answering these questions. For example, to what extent can national differences in crime rates be explained by national differences in the probability of an offender being convicted or sent to custody? This article aims to advance knowledge about these questions by specifying criminal justice flow diagrams and linking probabilities in different countries in different time periods. It focuses on homicide offenses and offenders, and challenges researchers to explain national and temporal variations in these linking probabilities.
In summary, the key questions addressed in this article are the following:
1. How do different countries vary in
(a) the homicide crime rate?
(b) the probability of a homicide offender being convicted?
(c) the probability of a convicted homicide offender being sentenced to custody?
(d) the average sentence length of homicide offenders?
(e) the average time served of homicide offenders?
2. How do these different measures vary over time in different countries?
This article summarizes national data on completed homicides for eight countries in three time periods: around 1980, 1990, and 2000. The eight countries are England/Wales, the United States, Sweden, Australia, Scotland, Switzerland, Netherlands, and Canada. It is important to estimate the flow diagram from crimes committed to punishment received to compare countries and to document changes over time. For example, estimating flow diagrams is the first step in addressing important policy questions about the relationship between crime and punishment over time and place (see, for example, Cook & Khmilevska, 2005).
Background
The British Crime Survey (BCS) was first carried out in 1982, to estimate national crime rates for the year 1981, according to victim reports (Hough & Mayhew, 1983). This made it possible for the first time to estimate, using national-level data for England (including Wales), crime-specific numbers of persons flowing through the criminal justice system at each stage, from crimes committed to crimes reported to the police, crimes recorded by the police, offenders convicted, offenders sentenced to custody, average sentence length, and average time served.
The BCS was then repeated for the years 1983 and 1987. After the results of the 1987 BCS were published by Mayhew et al. (1989), it became possible for the first time to assess trends in all these numbers in the flow diagram over a reasonable (6-year) time period. I presented these findings in my inaugural Presidential Address to the British Society of Criminology in January 1990.
However, I was then persuaded by Patrick Langan of the Bureau of Justice Statistics that it would be interesting to compare trends in England and the United States. We (Farrington & Langan, 1992) published an article comparing the flow through the criminal justice system in England (from 1981 to 1987) and the United States (from 1981 to 1986) for six crimes: residential burglary, vehicle theft, robbery, serious assault, rape, and homicide. We found that property crimes increased markedly during this short period in England, but violent crimes did not increase significantly. In the United States, both property and violent crimes decreased markedly. The probability of an offender being convicted and sentenced to custody in England decreased markedly for property crimes and increased slightly for violent crimes, whereas in the United States, this probability increased greatly for both types of crime.
Next, in collaboration with Per-Olof Wikström of the Swedish National Council for Crime Prevention, I compared the flow through the criminal justice system for these six crimes in England and Sweden between 1981 and 1987 (Farrington & Wikström, 1993). England and Sweden were quite similar in showing increases in property offenses, decreases in the probability of an offense leading to a conviction, decreases in the probability of an offense leading to a custodial sentence, and decreases in average time served per offense.
The next BCS was carried out for the year 1991 (Mayhew et al., 1993), making it possible to assess trends in the flow of persons through the criminal justice system over a 10-year period. We (Farrington et al., 1994) compared the flow diagrams for these six offenses in England and Sweden between 1981 and 1991, and in the United States between 1981 and 1990. We concluded that there was a high negative correlation between changes in the crime rate and changes in the probability of an offender being convicted. However, of course, it is not necessarily possible to draw conclusions about causal effects from these kinds of correlations.
One problem with these first three analyses is that they reported changes in flow diagrams between two widely separated time points rather than studying trends over time, making it difficult to know precisely when changes occurred and how they might be explained. The fourth publication (Langan & Farrington, 1998) calculated all numbers and probabilities for 7 years in the United States (from 1981 to 1994) and for 6 years in England (from 1981 to 1995). The American years were those in which the NJRP (National Judicial Reporting Program) survey was carried out, which provided information about convictions and custodial sentences, while the British years were the years of the BCS. All of the needed information was not available for other years. During this time period, crime rates generally increased in England and decreased in the United States, while the probability of conviction and incarceration generally decreased in England and increased in the United States.
After the fourth publication, Patrick Langan and I aimed to extend the flow diagram analyses to all countries with repeated large-scale national victim surveys, and we succeeded in studying the six serious crimes (residential burglary, vehicle theft, robbery, serious assault, rape, and homicide) in eight countries from 1980–1981 to 1999–2000. The only country with a national victim survey that we failed to include was Finland, because our Finland expert proved to be unable to collaborate in our research. The included countries and collaborators were England (myself and Darrick Jolliffe), the United States (Patrick Langan), Sweden (Per-Olof Wikström and Lars Dolmen), Australia (Carlos Carcach), Scotland (David Smith), Switzerland (Martin Killias, Phillippe Lamon, and Marcelo Aebi), Netherlands (Catrien Bijleveld and Paul Smit), and Canada (Brandon Welsh and Mark Irving). The researchers in each country were responsible for obtaining the needed data in each country. A grant from the Bureau of Justice Statistics to Castine Research Corporation (directed by Michael Tonry) enabled us all to meet twice in Cambridge, England, and to make huge efforts to collect information that was comparable between countries and over time. As far as possible, collaborators were asked to collect data from 1981 to 1999, to match the (then) available time period of the BCS. However, the needed data were not available in all years in all countries.
All authors were asked to present national data on the numbers of victim-reported crimes, crimes reported to the police, crimes recorded by the police, persons convicted, and persons sent to custody, as well as average sentence length and average time served, for each of the six offenses in each year. They were also asked to calculate linking probabilities in the flow diagram from crimes committed to time served in prison. They were also asked to try to explain these linking probabilities (e.g., why crimes were not reported, why reported crimes were not recorded, why recorded crimes were not followed by a conviction), and trends over time in all the numbers.
Our results were published in a Bureau of Justice Statistics publication (Farrington et al., 2004) and in a Crime and Justice volume (Tonry & Farrington, 2005). My aim in the present article is to summarize our conclusions about trends in homicide in eight countries over 20 years: the flow from crimes recorded to persons convicted, persons sent to custody, average sentence length, and average time served.
The comparative analyses presented in this article are all new, and sometimes required new calculations. In general, the previous publications presented flow diagrams for each country one by one, whereas the emphasis in this article is on comparing countries. There have been previous efforts to compare countries in crime or punishment (e.g., the International Crime Victimization Survey: see, for example, Van Kesteren et al., 2000), but there have been no previous efforts to compare countries on the complete flow diagram from crime to punishment.
Liem et al. (2020) have completed a systematic review of prior studies of the flow of homicide cases through stages of the criminal justice system. Most studies focused on only one stage. Only one study (an unpublished doctoral dissertation by Berz, 1994) provided information about four stages: deaths, clearance, prosecution, and sentencing. Most studies presented only U.S. data, and not necessarily national data; for example, Berz (1994) analyzed 257 homicide cases in Tennessee. In contrast, we have documented national numbers of police-recorded crimes, persons convicted, offenders sent to custody, average sentence length, average time served, and all linking probabilities.
Method
Our estimates are based on cross-sectional data, and the same persons were not followed up over time. This method has some limitations. For example, the persons convicted in any given year may have committed their crimes in the previous year, and the persons sentenced in any given year may not be the same persons released from custody in that year. Ideally, a longitudinal study is needed, beginning with offenses and tracking offenders through the different stages of the criminal justice system. However, a longitudinal study would require many years of follow-up to track homicide offenders through the criminal justice system. Our information is for each of the stages separately (e.g., crimes recorded, persons convicted, persons sent to custody) and it is used to estimate the flow of offenders from one stage to the next.
The definitions and methods used in this research are described in great detail in Farrington et al. (2004). For example, homicide included completed murder, manslaughter (in the United States, nonnegligent and voluntary manslaughter), and the rare offense of infanticide. Attempted homicide and causing death by dangerous driving were excluded.
One crime was defined according to one victim. Thus, if three offenders jointly killed two victims, there would be only two homicides. Unlike the other five crimes, whose numbers were based on victim reports, the number of homicides committed was defined only according to police records. One conviction was defined according to one offender being convicted of one offense. If an offender was convicted of three offenses in one court appearance, this was counted as three convictions. If three offenders were convicted of jointly killing two victims, this was counted as six convictions (i.e., six offender–offense combinations).
To link up offenses with offenders, and to estimate the probability of an offense leading to a conviction, it is essential to take account of co-offending (i.e., the average number of offenders committing each offense). For example, if 100 homicides were each committed by two offenders on average, this could in principle lead to 200 convictions (offender–offense combinations). If in fact there were 50 convictions, the probability of an offender being convicted would be 50/200 not 50/100. I became convinced of the importance of co-offending during my research with Albert Reiss (Reiss & Farrington, 1991) and insisted that everyone should take account of co-offending in estimating the linking probabilities. Generally, co-offending has not been considered in previous efforts to estimate linking probabilities in flow diagrams (e.g., Barclay, 1995).
Unfortunately, adequate national estimates of the average number of offenders per offense were rarely available, especially in the case of homicide. An estimate was available each year in Australia, based on the ratio of the number of offenders recorded by the police to the number of crimes cleared by arrest. In all other countries, the same estimate was used each year. For example, in Scotland, the estimate was based on the ratio of the number of accused persons to the number of victims over the 1980–1999 time period. In the Netherlands, it was based on 1998 data from Smit et al. (2001). It was not available at all in Canada, and so a figure of 1.0 was used.
The average time served was estimated in different ways in different countries. In Switzerland, it was available in a sophisticated correctional database that specified the length of time each prisoner had served after each conviction (see, for example, Ronez, 1997). In the Netherlands, offenders serve a fixed proportion of their sentences. In England, the estimate of average time served was based on release cohorts of prisoners. In the United States, the fraction of time served (based on release cohorts) was applied to currently sentenced offenders to estimate the time that they were expected to serve. In Scotland and Sweden, the expected time to be served was estimated from laws and parole regulations. In Australia, the average time served was estimated from the expected time to be served according to a prison census. In Canada, it was not possible to derive a satisfactory estimate of time served. Secure hospital orders were included as custodial sentences in all countries.
Special estimation procedures were used to estimate sentence length for homicide, because of indeterminate life sentences. For example, in England in 1999, the average time served by homicide offenders first released from life sentences was 13.3 years or 159.6 months. Hardly any offenders received a whole life order. The effective length of life sentences was estimated on the basis of the fraction of time served by homicide cases with nonlife sentences. For nonlife homicide offenders released in 1999, average sentence length was 46.9 months and average time served was 27.3 months, or 58.2% of the sentence. Assuming that life sentence cases were also serving 58.2% of their sentences, the effective length of a life sentence for homicide in 1999 was estimated to be 274.2 months (159.6/.582) or 22.9 years. Average sentence length and average time served were then weighted averages based on the numbers of life and nonlife sentences. Similar methods were used in other countries.
Results
Table 1 shows the available flow diagrams for homicide around 1980 in five countries. For example, for England in 1981, 559 recorded crimes multiplied by 1.1 offenders per offense produced an offender population of 615. Since 388 offenders were convicted, the probability of an offender being convicted was .631 (388/615). Since 328 offenders were sent to custody, the probability of an offender being sent to custody was .533 (328/615). Since 68.8 months were served on average, the number of months served per conviction was 58.2 (68.8 × 328/388), and the number of months served per offender was 36.7 (68.8 × 328/615). (The numbers were calculated exactly.)
Homicide in Five Countries Around 1980.
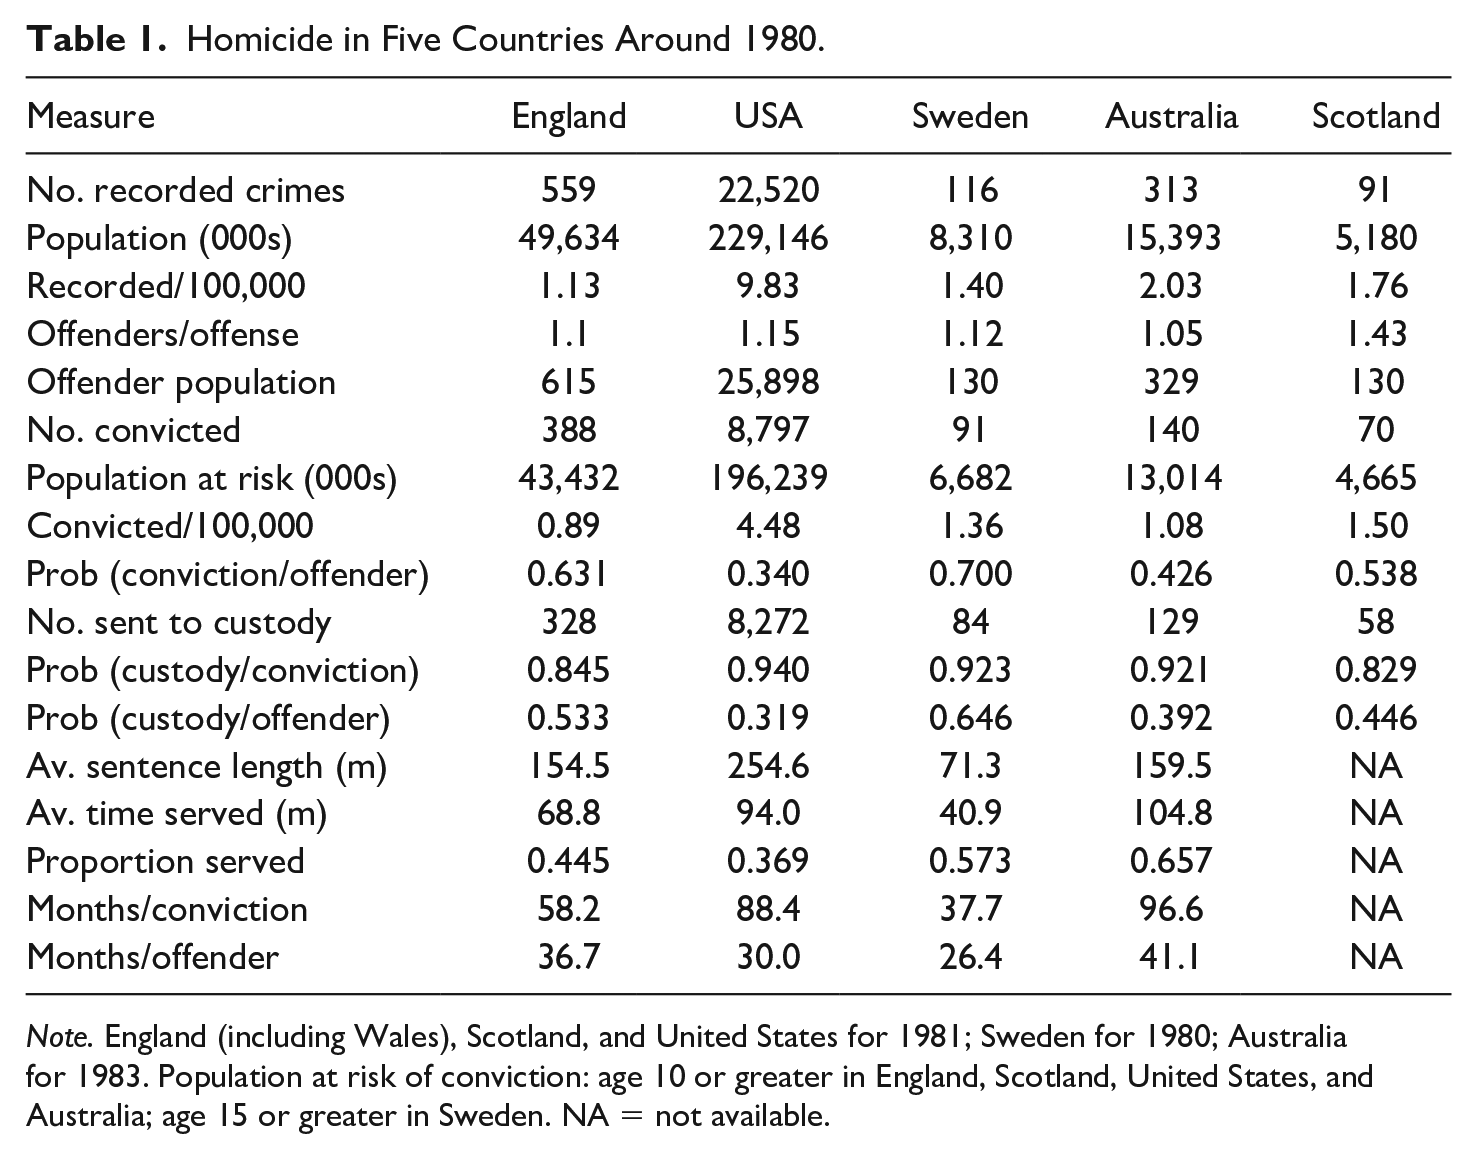
Note. England (including Wales), Scotland, and United States for 1981; Sweden for 1980; Australia for 1983. Population at risk of conviction: age 10 or greater in England, Scotland, United States, and Australia; age 15 or greater in Sweden. NA = not available.
It is clear that the homicide offense rate and the homicide conviction rate were much higher in the United States (9.83 and 4.48 per 100,000, respectively) than in the other four countries. However, the probability of an offender being convicted was lowest in the United States (.340) and highest in Sweden (.700). The probability of a convicted offender being sent to custody was high in all five countries, but highest in the United States (.940). However, the probability of an offender being sent to custody was lowest in the United States (.319) and highest in Sweden (.646). Average sentence length was longest in the United States (254.6 months) and shortest in Sweden (71.3 months), but average time served and average time served per offender were longest in Australia (104.8 and 41.1 months, respectively) and shortest in Sweden (40.9 and 26.4 months, respectively).
Table 2 shows the available flow diagrams for homicide around 1990 in seven countries. The homicide offense rate and homicide conviction rate were highest in the United States (9.42 and 5.79 per 100,000, respectively) and lowest in Switzerland (1.20 and 0.75, respectively). The probability of an offender being convicted was highest in Sweden (.946) and lowest in Australia (.426). The probability of a convicted offender being sent to custody was highest in Sweden (.967) and lowest in Switzerland (.795). The probability of an offender being sent to custody was highest in Sweden (.915) and lowest in Australia (.395). Average sentence length was again longest in the United States (245.2 months) and shortest in Sweden (76.8 months). Average time served was longest in the United States (112.8 months) and shortest in Switzerland (32.8 months). Average time served per offender was longest in Scotland (56.1 months) and shortest in Switzerland (14.8 months).
Homicide in Seven Countries around 1990.
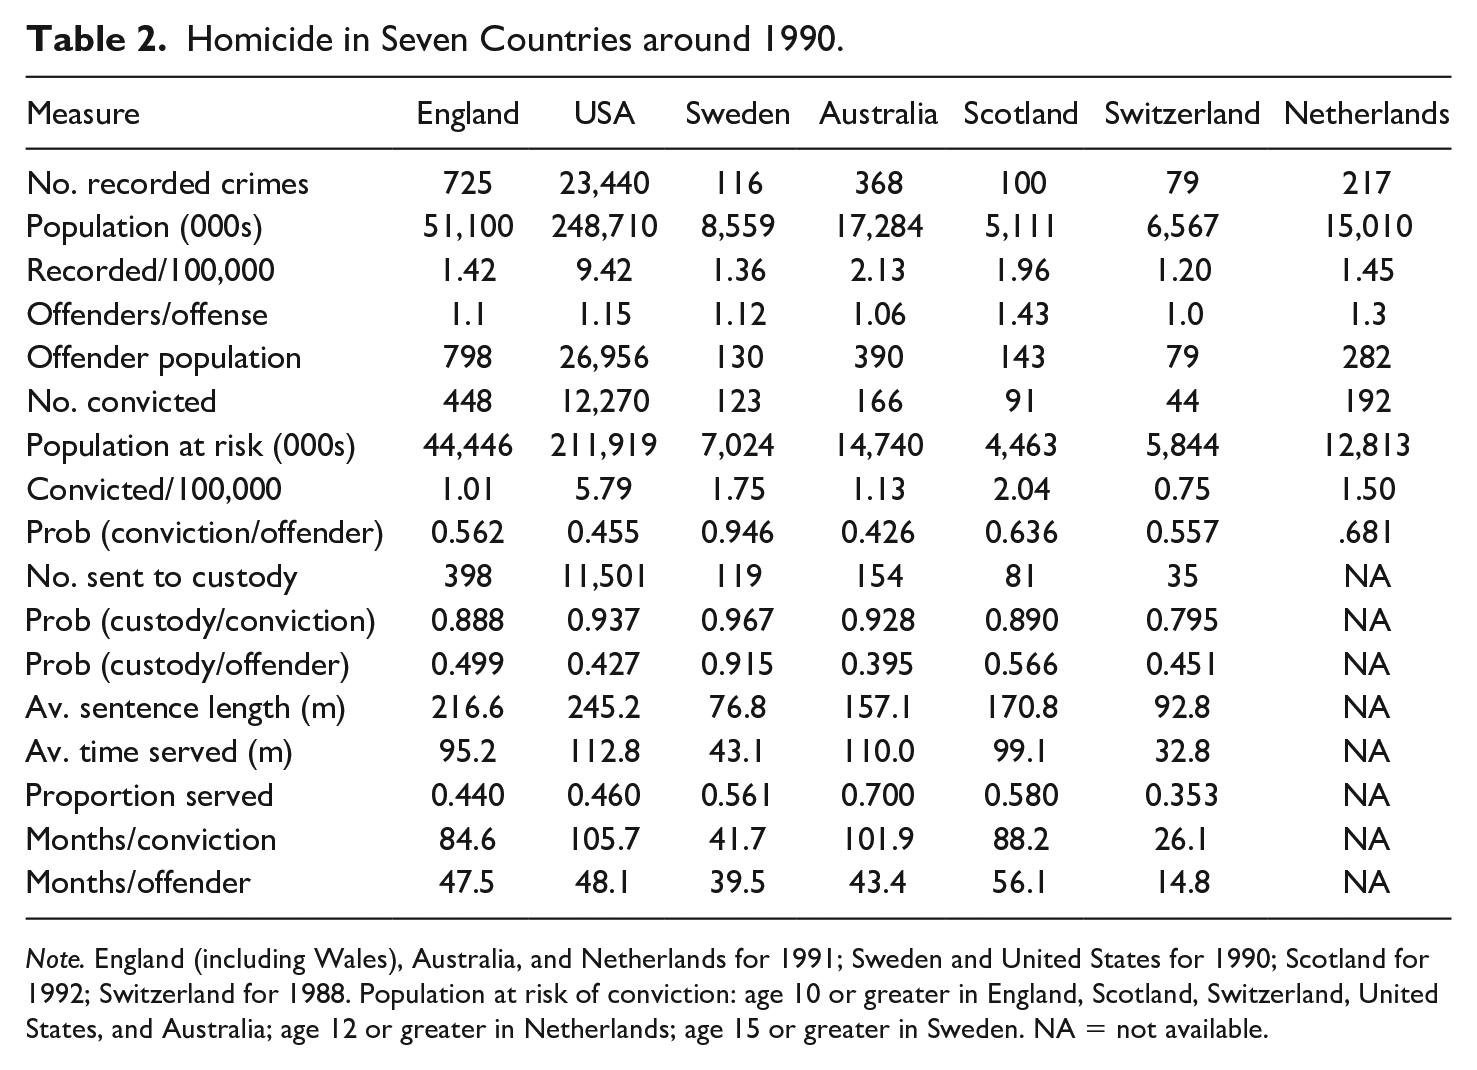
Note. England (including Wales), Australia, and Netherlands for 1991; Sweden and United States for 1990; Scotland for 1992; Switzerland for 1988. Population at risk of conviction: age 10 or greater in England, Scotland, Switzerland, United States, and Australia; age 12 or greater in Netherlands; age 15 or greater in Sweden. NA = not available.
Table 3 shows the flow diagrams for homicide around 2000 in all eight countries. The homicide offense rate was again highest in the United States (7.41 per 100,000) and lowest in Switzerland (1.22 per 100,000). The homicide conviction rate was highest in the United States (5.53 per 100,000) and lowest in Canada (0.52 per 100,000). The probability of an offender being convicted was highest in Switzerland (.966) and lowest in Canada (.250). The probability of a convicted offender being sent to custody was highest in Sweden (.952) and lowest in Switzerland (.798). The probability of an offender being sent to custody was highest in Switzerland (.770) and lowest in Canada (.205). Average sentence length was longest in the United States (250 months) and shortest in Switzerland (93.7 months). Average time served was longest in Australia (132.6 months) and shortest in Sweden (49.4 months). Average time served per offender was longest in the United States (66.1 months) and shortest in Sweden (26.3 months).
Homicide in Eight Countries Around 2000.
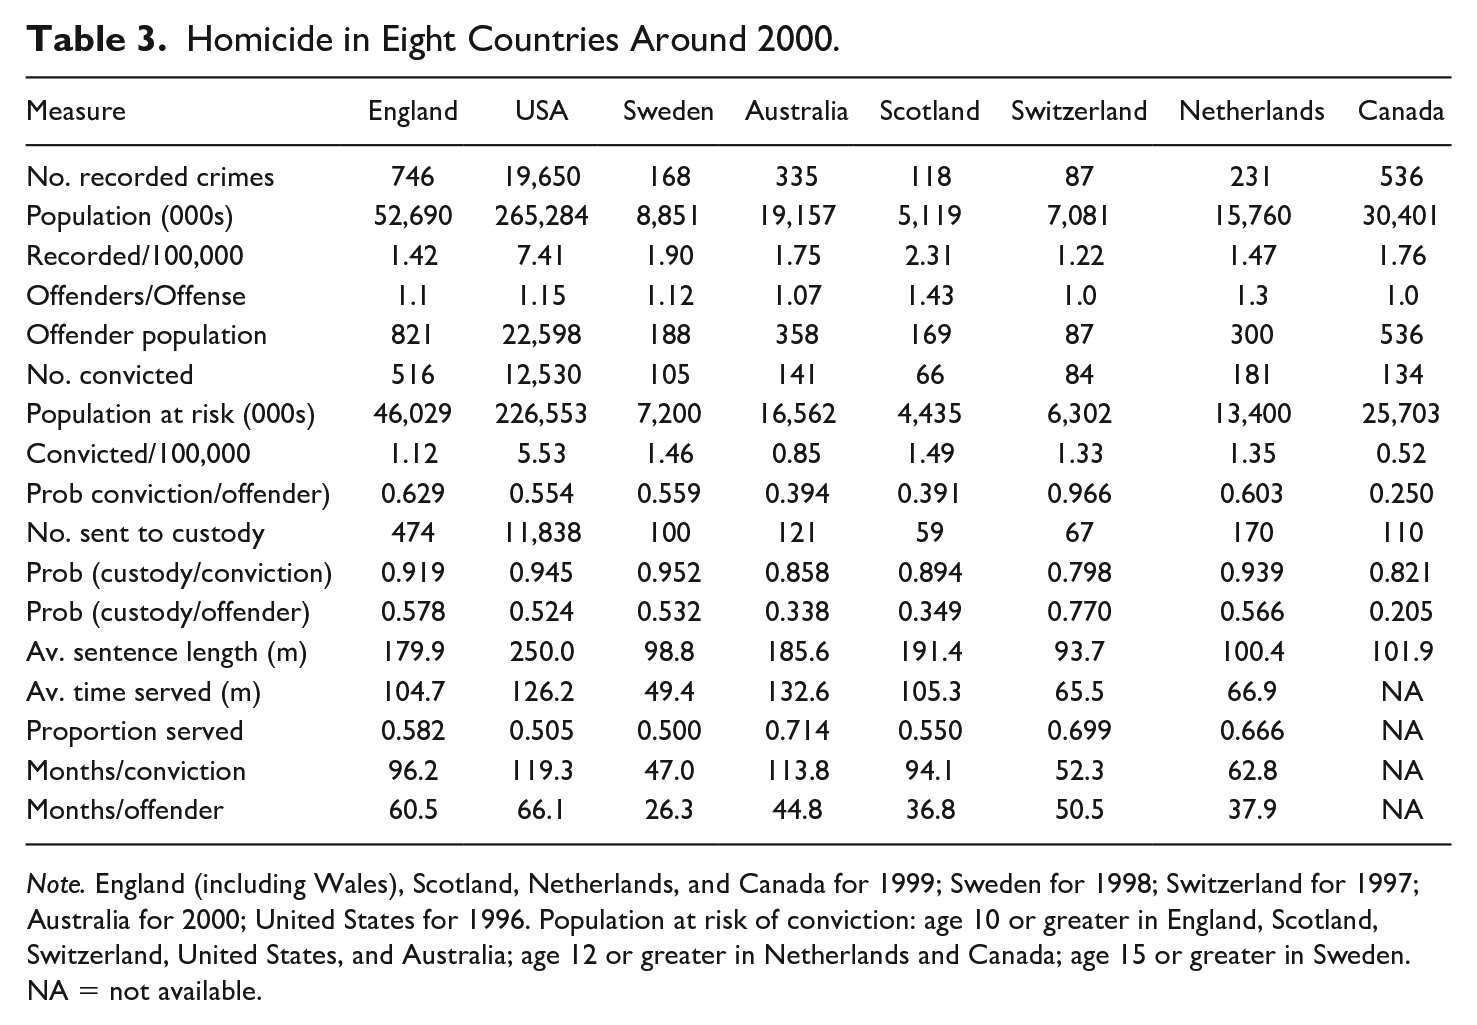
Note. England (including Wales), Scotland, Netherlands, and Canada for 1999; Sweden for 1998; Switzerland for 1997; Australia for 2000; United States for 1996. Population at risk of conviction: age 10 or greater in England, Scotland, Switzerland, United States, and Australia; age 12 or greater in Netherlands and Canada; age 15 or greater in Sweden. NA = not available.
Table 4 shows the percentage changes in the various measures between 1980 and 1990. The homicide rate increased the most in England (by 26%) and slightly decreased in the United States (by 4%) and Sweden (by 3%). The conviction rate increased markedly in the United States and in Sweden (both by 29%), and in Scotland (by 36%). The probability of an offender being convicted increased in the United States (by 34%) and Sweden (by 35%), but decreased in England (by 11%). The probability of custody following a conviction was high in all countries and did not change much. The probability of an offender being sent to custody increased considerably in the United States (by 34%), Sweden (by 42%), and Scotland (by 27%), but decreased slightly in England (by 6%). Average sentence length and average time served increased considerably in England (by 40% and 38%, respectively). In the United States, average sentence length decreased slightly (by 4%), but average time served increased considerably (by 20%), which meant that the proportion of the sentence that was served increased considerably (by 25%). The average time served per offender increased considerably in England (by 29%), the United States (by 60%), and Sweden (by 50%).
Percentage Changes Between 1980 and 1990.
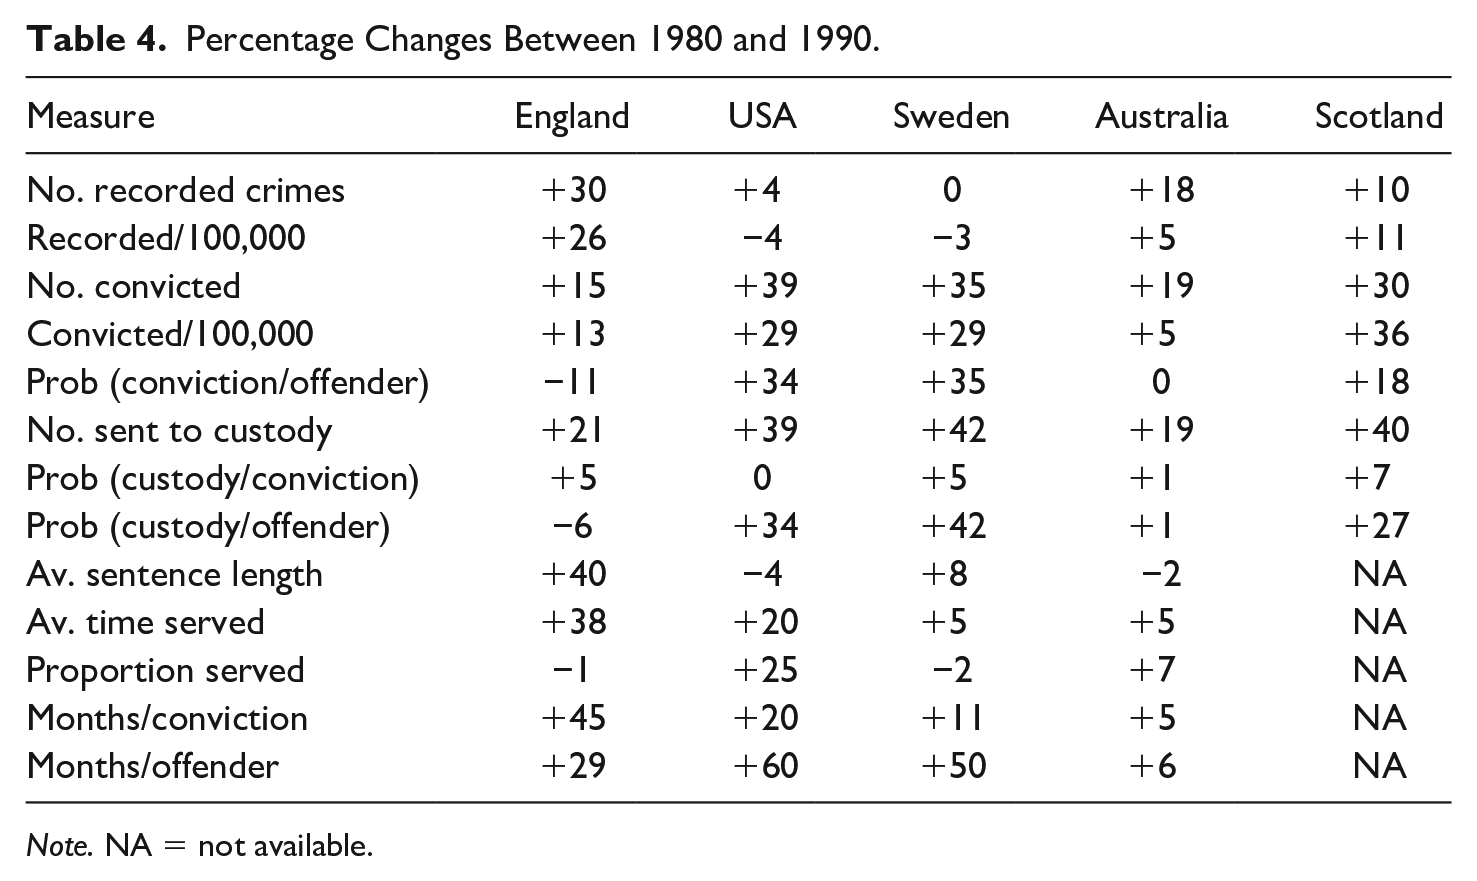
Note. NA = not available.
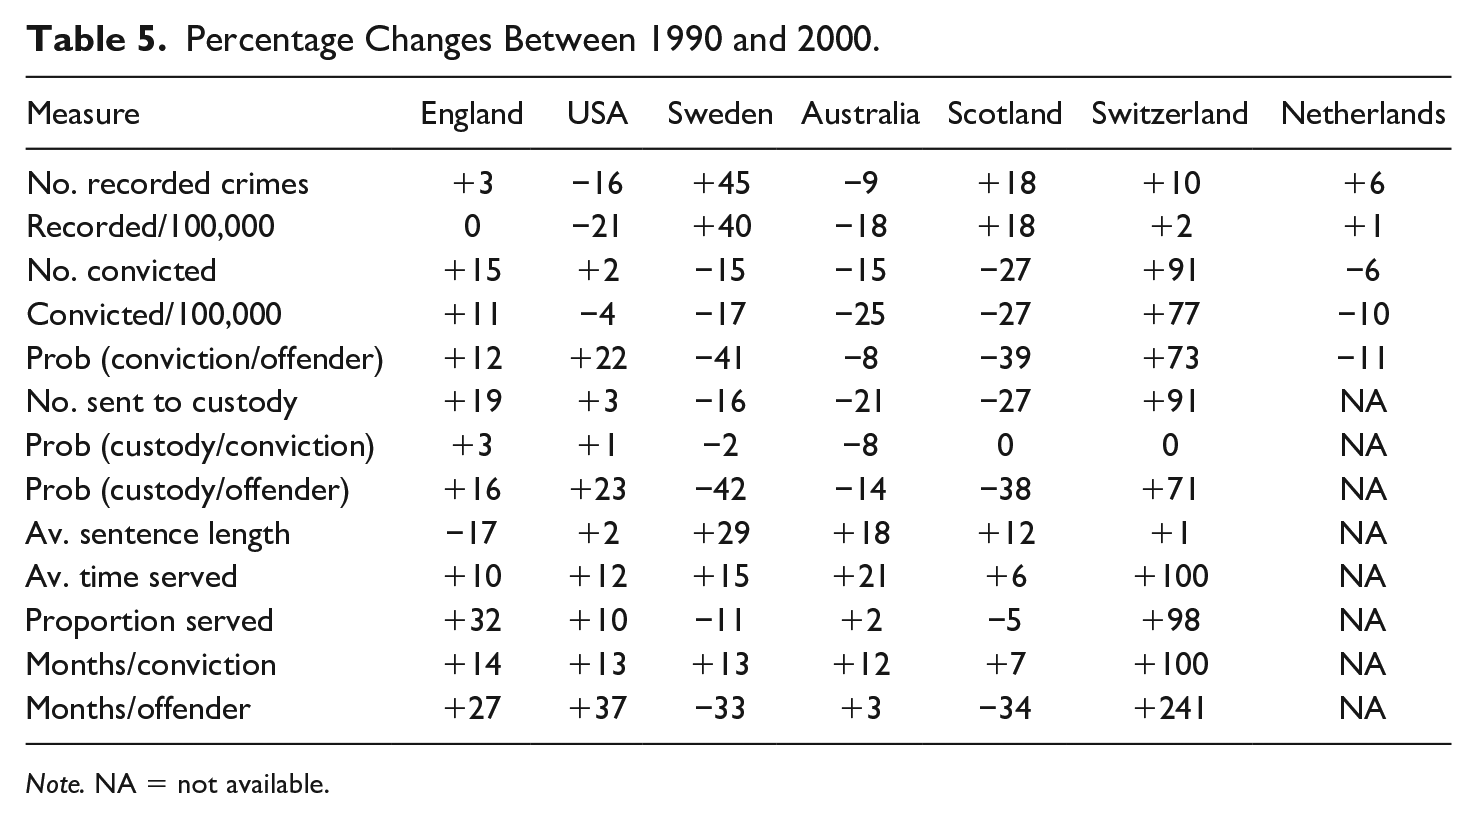
Table 5 shows the percentage changes in the various measures between 1990 and 2000. The homicide rate increased the most in Sweden (by 40%), followed by Scotland (by 18%), and decreased in the United States (by 21%) and Australia (by 18%). The conviction rate increased dramatically in Switzerland (by 91%), but this was because the numbers were very small. The number of convicted persons fluctuated considerably: it was 66 in 1985, 44 in 1988, 87 in 1995, and 84 in 1997. The conviction rate decreased considerably in Australia (by 25%) and Scotland (by 27%). The probability of an offender being sent to custody increased in England (by 16%), the United States (by 23%), and Switzerland (by 71%), but decreased in Sweden (by 42%), Australia (by 14%), and Scotland (by 38%). Average sentence length increased the most in Sweden (by 29%) and Australia (by 18%), and decreased in England (by 17%). The proportion of the sentence that was served doubled in Switzerland and also increased considerably in England (by 32%). The time served per offender increased dramatically in Switzerland (by 241%) and considerably in England (by 27%) and the United States (by 37%), but it decreased considerably in Sweden (by 33%) and Scotland (by 34%).
Percentage Changes Between 1990 and 2000.
Note. NA = not available.
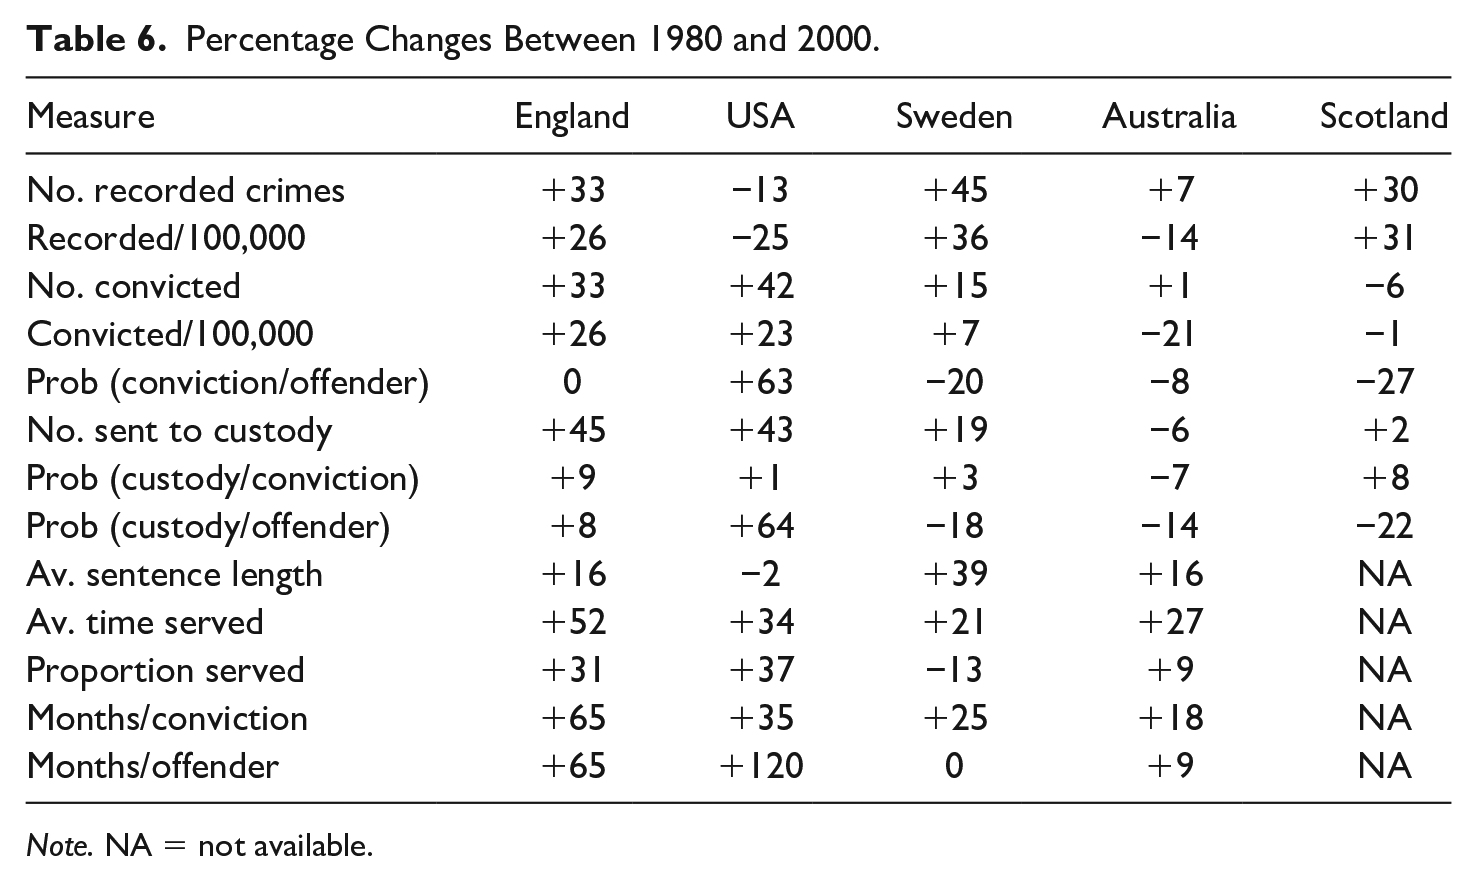
Finally, Table 6 shows the percentage changes in the various measures between 1980 and 2000. The homicide rate increased considerably in England (by 26%), Sweden (by 36%), and Scotland (by 31%), and decreased in the United States (by 25%) and Australia (by 14%). The probability of an offender being convicted increased dramatically in the United States (by 63%) and decreased in Sweden (by 20%) and Scotland (by 27%). The probability of an offender being sent to custody increased dramatically in the United States (by 64%), but decreased in Sweden (by 18%), Australia (by 14%), and Scotland (by 22%). Average time served increased in all four countries where this comparison was possible, and average time served per offender increased dramatically in England (by 65%) and the United States (by 120%).
Percentage Changes Between 1980 and 2000.
Note. NA = not available.
Discussion
This study is not without limitations. Some measures were not available in particular countries in particular years. The national estimates of the number of offenders per offense, and of the average time served, were not always ideal. The results are presented only for three time periods, not continuously over 20 years. In some countries, the number of homicides in a particular year was small, there were considerable year-to-year fluctuations in numbers, and it was not always clear whether changes over time were significant or reflected quasi-random fluctuations.
How could the quality of information about the flow of offenders through the criminal justice system be improved in different countries? As mentioned, it would be desirable to carry out longitudinal research in which offenders were tracked through the system, from arrest to custody and eventually release. Unfortunately, national-level data tracking individual offenders across the different stages of the criminal justice system are not available in England or in many other countries, partly because of concerns about privacy of information and data linkage. In England, it would be desirable for all offenders to have an identification number that stayed with them from arrest through all stages of the criminal justice system. All persons in some countries (e.g., Sweden) have a national identification number, but in other countries (e.g., England), different numbers are allocated at different stages of the criminal justice system, which makes it difficult to link up offenders longitudinally. The greatest need is for countries to collect good data on co-offending, which is needed to link up offenses and offenders.
More research is needed to explain the linking probabilities in different countries. For example, there are many possible reasons, in addition to failing to detect the offender, why cases initially recorded as homicide by the police may not be followed by homicide convictions; for example, some cases may not in fact be homicides, the perpetrator may have died, or forensic evidence may have been insufficient to allow prosecution. As mentioned, it would be better to track offenders longitudinally through the criminal justice system rather than to make estimates based on annual data. Nevertheless, I believe that our research was the most extensive ever carried out up to that time in generating national flow diagrams for different types of offenses in different countries.
The current results show that homicide rates were consistently highest in the United States. The probability of a homicide offender being convicted was not consistently high in any particular country. The probability of a convicted homicide offender being sent to custody was high in all countries but was lowest in Switzerland. Average sentence length was consistently highest in the United States, and average time served was highest in the United States and Australia. It is beyond the scope of this article to try to explain these differences between countries.
The current results show that homicide rates increased in England, but only from 1980–1990, not from 1990–2000. In contrast, homicide rates in the United States decreased, but mainly from 1990–2000 rather than from 1980–1990. Homicide rates in Sweden increased, but only from 1990–2000, not from 1980–1990. Homicide rates in Scotland increased in both time periods. Homicide rates in Australia decreased somewhat, but mainly in 1990–2000. However, Carcach (2004) concluded that “the incidence of homicide [in Australia] has remained stable over the 1983-1998 period” (p. 106). The homicide rate did not change in Switzerland or the Netherlands in 1990–2000.
The probability and severity of punishment for homicide offenders increased dramatically in the United States during this time period. The average homicide offender was incarcerated for 30 months in 1981 but for 66 months in 1996. In contrast, the probability of an offender being convicted and sent to custody decreased in Sweden, Scotland, and Australia. There was a tendency for decreases in punishment to be correlated with increases in offending (and vice versa) but, as mentioned earlier, we cannot necessarily draw any causal conclusions from these correlations.
How might these changes over time be explained? It is very likely that no single explanation can explain changes in national crime rates in any particular country in any particular time period, but many possible explanations are discussed in Farrington et al. (2004) and Tonry and Farrington (2005). A lot depends on the nature of homicide. To the extent that it is rationally motivated, it might be influenced by costs, benefits, and probabilities (e.g., the probability of being convicted). To the extent that it is emotionally motivated (e.g., by anger in the heat of the moment), this is less likely. Langan (2004, pp. 67–68) reviewed seven possible explanations for the decreases in crime rates in the United States and suggested that “falling rates of crime were most consistently related to the aging of the population and to falling unemployment rates and rising risk of punishment by the justice system” (p. 68). However, he was careful to point out that correlations do not prove causation and that other factors could have influenced the decreases in crime rates.
Many important questions remain to be investigated. For example, in influencing homicide rates, it is important to study the relative importance of (a) the probability of an offender being convicted, (b) the probability of a convicted offender being sent to custody, (c) the probability of an offender being sent to custody, (d) the average sentence length, (e) the average time served, (f) the average time served per conviction, and (g) the average time served per offender. Of course, research is needed on what potential offenders know or think they know about all these quantities, and on what proportion of homicide offenses may be influenced by this knowledge (because they are rationally motivated).
Farrington and Jolliffe (2004) investigated numerous correlations between English crime rates and demographic factors (e.g., the percentage of the population aged 15–24), economic factors (e.g., gross domestic product), beer consumption, police strength, and criminal justice factors (e.g., conviction rate, custody rate, sentence length, time served). The problem was that homicide rates tended to increase during this time period (1981–1999), which meant that any factor that also increased was positively correlated with them. For example, over time, gross domestic product correlated +.80 with the homicide rate. Conversely, any factor that decreased during this time period was negatively correlated with homicide rates. For example, beer consumption per population correlated −.68 with the homicide rate.
Changes in sentence length and time served are usually attributable to changes in laws and/or in parole policies. However, in England, a major factor in the increases in average sentence length and average time served was the changing balance of murder and manslaughter (including infanticide) convictions. For example, in 1981, 126 offenders were convicted for murder (which has a mandatory life sentence) and 262 were convicted for manslaughter, whereas in 1999, 252 offenders were convicted for murder and 264 for manslaughter. However, the average time served by life sentence prisoners also increased, from 126 months in 1981 to 160 months in 1999 (Farrington & Jolliffe, 2004).
Our research probably raises more questions that it answers. The challenge for future researchers is to update our flow diagrams in different countries to the present day. However, researchers should be warned that this would require huge efforts to collect all the needed data (probably requiring huge assistance from governmental agencies such as the Ministry of Justice) and to achieve comparability over time and place. Ideally, longitudinal research is needed, and much better national information on co-offending is essential. Future researchers would then be in a better position to try to explain differences between countries and changes over time, in homicide and in other offenses.
Footnotes
Acknowledgements
Many other persons from government agencies carried out special analyses or provided data that were not publicly available. For example, in England, we were helped by Margaret Ayres, Gordon Barclay, Tracey Budd, Billy Burns, Patrick Collier, LizAnne Dowds, Graham Kinshott, Duncan Lavin, Joanna Mattinson, Pat Mayhew, Catriona Mirrlees-Black, Chris Nuttall, Andrew Percy, Roger Stevens, and David Thomas of the Home Office. Of course, I am very grateful to all of our collaborators.
Declaration of Conflicting Interests
The author(s) declared no potential conflicts of interest with respect to the research, authorship, and/or publication of this article.
Funding
The author(s) received no financial support for the research, authorship, and/or publication of this article.