
Abstract
Consistent use of personal protective equipment (PPE) reduces exposure to industrial hazards, yet continuous compliance monitoring remains difficult in fast-moving workplaces. This study evaluates lightweight, real-time PPE detectors using two purpose-built datasets: PPEDS-1000 (1,000 manually annotated real-world images) and PPEDS-2600 (an augmented extension designed to reflect deployment variability). YOLOv13-nano and YOLOv13-small, implemented from the publicly available iMoonLab repository, were trained as untuned baselines, while optimization focused on YOLOv8 due to its mature tooling and scalable lightweight variants. Optuna-based hyperparameter optimization was restricted to YOLOv8-nano and YOLOv8-small to preserve deployment feasibility, tuning key training factors such as learning rate, batch size, and weight decay with validation mAP50 as the objective. Compared with pre-optimization baselines, the single-run best configurations achieved absolute gains of up to 2.5 percentage points in mAP50 and 3.2 percentage points in mAP50–95. However, an exploratory repeated-run analysis suggests that the stability of these gains is dataset-dependent. On the smaller PPEDS-1000 dataset, tuning benefits appeared seed-sensitive, whereas on the larger and augmented PPEDS-2600 dataset, tuning showed more consistent behavior together with lower variance across random initializations. Overall, the findings indicate that structured hyperparameter tuning is promising for deployment-oriented PPE monitoring, but its ability to yield stable gains appears to depend on adequate dataset scale and representative variability.
Keywords
Introduction
Personal protective equipment (PPE) remains one of the most direct barriers against workplace hazards, particularly in environments where exposure risks cannot be fully eliminated by engineering controls.1,2 In operational settings, however, verifying PPE compliance continuously is not straightforward. Workers move rapidly, equipment is often partially occluded by tools or other personnel, and camera viewpoints and lighting conditions vary throughout the day. As a result, even when rules and signage are in place, consistent verification of PPE use is difficult to maintain at scale.
In practice, compliance checks are still largely carried out through manual observation, patrols, and intermittent audits. Such approaches are labor-intensive and discontinuous, and their reliability can be affected by human factors, including fatigue and subjective judgment. 3 The challenge becomes more pronounced in fast-moving workplaces where personnel density, occlusions, and scene variability reduce the effectiveness of routine supervision.
Computer vision-based monitoring has therefore gained attention as a scalable alternative for continuous PPE inspection. Earlier studies have shown that deep learning models can detect missing safety equipment (e.g., hard hats) in surveillance video. 4 Related detection pipelines have also been used for compliance-oriented tasks such as face-mask monitoring. 5 Taken together, these works indicate that data-driven detectors can support objective, continuous monitoring, provided that their performance remains robust in deployment conditions.
Among object detection frameworks, the YOLO (You Only Look Once) family is widely adopted for its practical balance between detection accuracy and inference speed. 6 Although publicly available YOLO-based frameworks such as YOLOv13 have been introduced, 7 YOLOv8 remains widely used in many practical settings due to its stable architecture and scalable model variants ranging from nano to xlarge.8,9 For PPE monitoring, lightweight variants are particularly relevant because they better align with the resource limitations typical of edge-oriented deployments.
Despite this adoption, many PPE detection studies rely on default settings or manually chosen hyperparameters, which can limit achievable performance. In the broader object detection literature, automated hyperparameter optimization (HPO), especially Bayesian-based approaches, has been shown to improve results by systematically exploring influential training parameters such as learning rate, batch size, weight decay, optimizer type, and training schedule. 10
In this study, Optuna is integrated into the YOLOv8 training pipeline to enable structured HPO. 11 Optuna's Bayesian sampling strategy (TPE) enables efficient exploration of the search space under a fixed trial budget. With deployment constraints in mind, optimization is applied to the YOLOv8-nano and YOLOv8-small variants.
Experiments are conducted on two purpose-built datasets. PPEDS-1000 contains manually labeled images reflecting real-world PPE usage, whereas PPEDS-2600 extends PPEDS-1000 through targeted augmentations designed to approximate deployment variability (e.g., flipping, blurring, and noise injection).
Figure 1 presents the overall PPE compliance monitoring pipeline considered in this study. A fixed-camera stream is processed by an edge device running a YOLO-based detector, which assigns detections to four compliance classes: W (Worker only), WH (Worker with Helmet), WV (Worker with Vest), and WHV (Worker with Helmet and Vest).
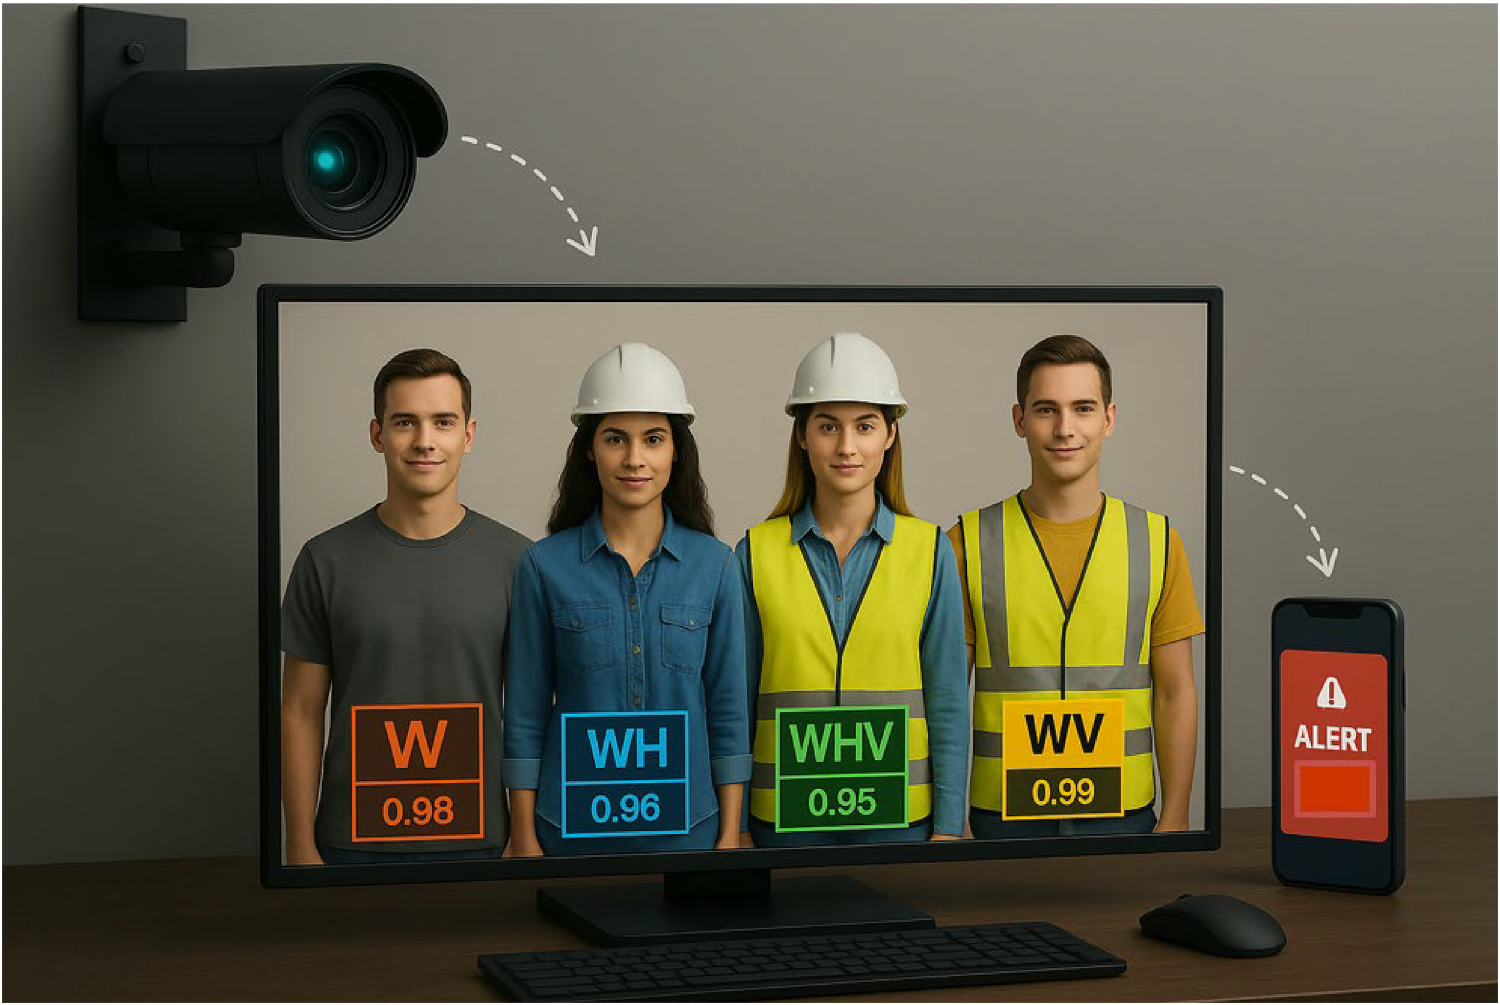
Schematic illustration of the AI-powered PPE compliance detection system (created with generative AI assistance for illustrative purposes only).
Training and optimization results of YOLOv8 and YOLOv13 nano models on PPE datasets.
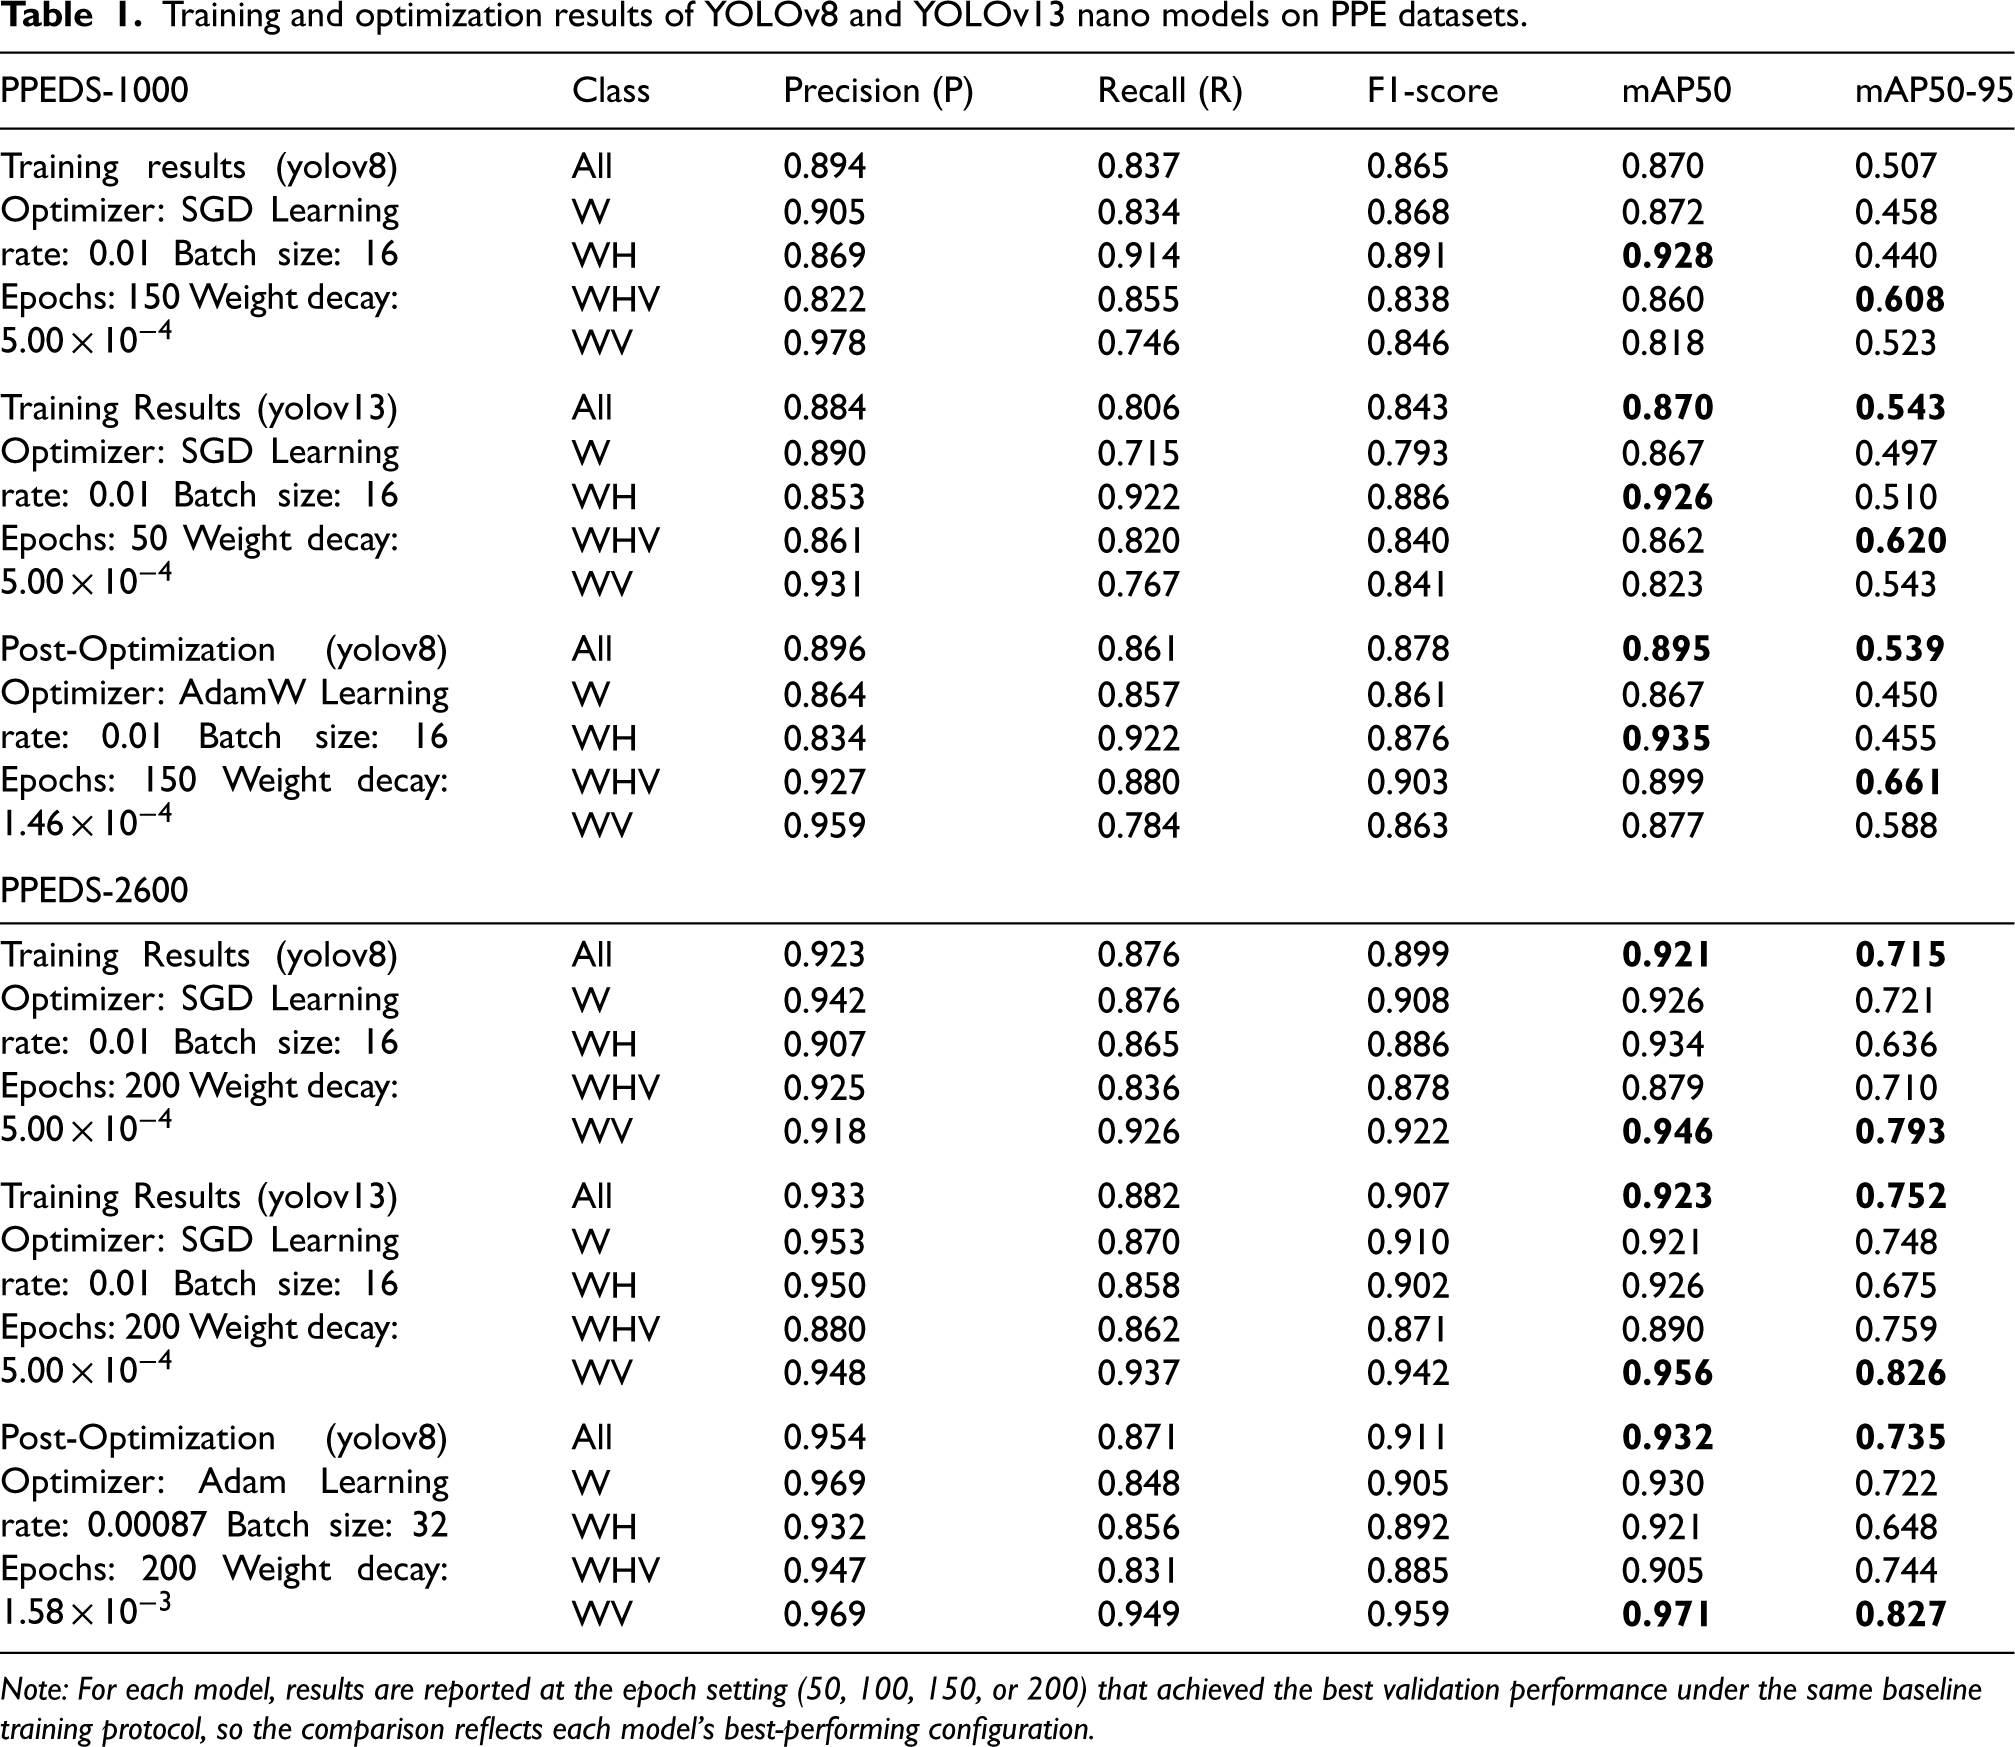
Note: For each model, results are reported at the epoch setting (50, 100, 150, or 200) that achieved the best validation performance under the same baseline training protocol, so the comparison reflects each model's best-performing configuration.
Training and Optimization Results of YOLOv8 and YOLOv13 Small Models on PPE Datasets.
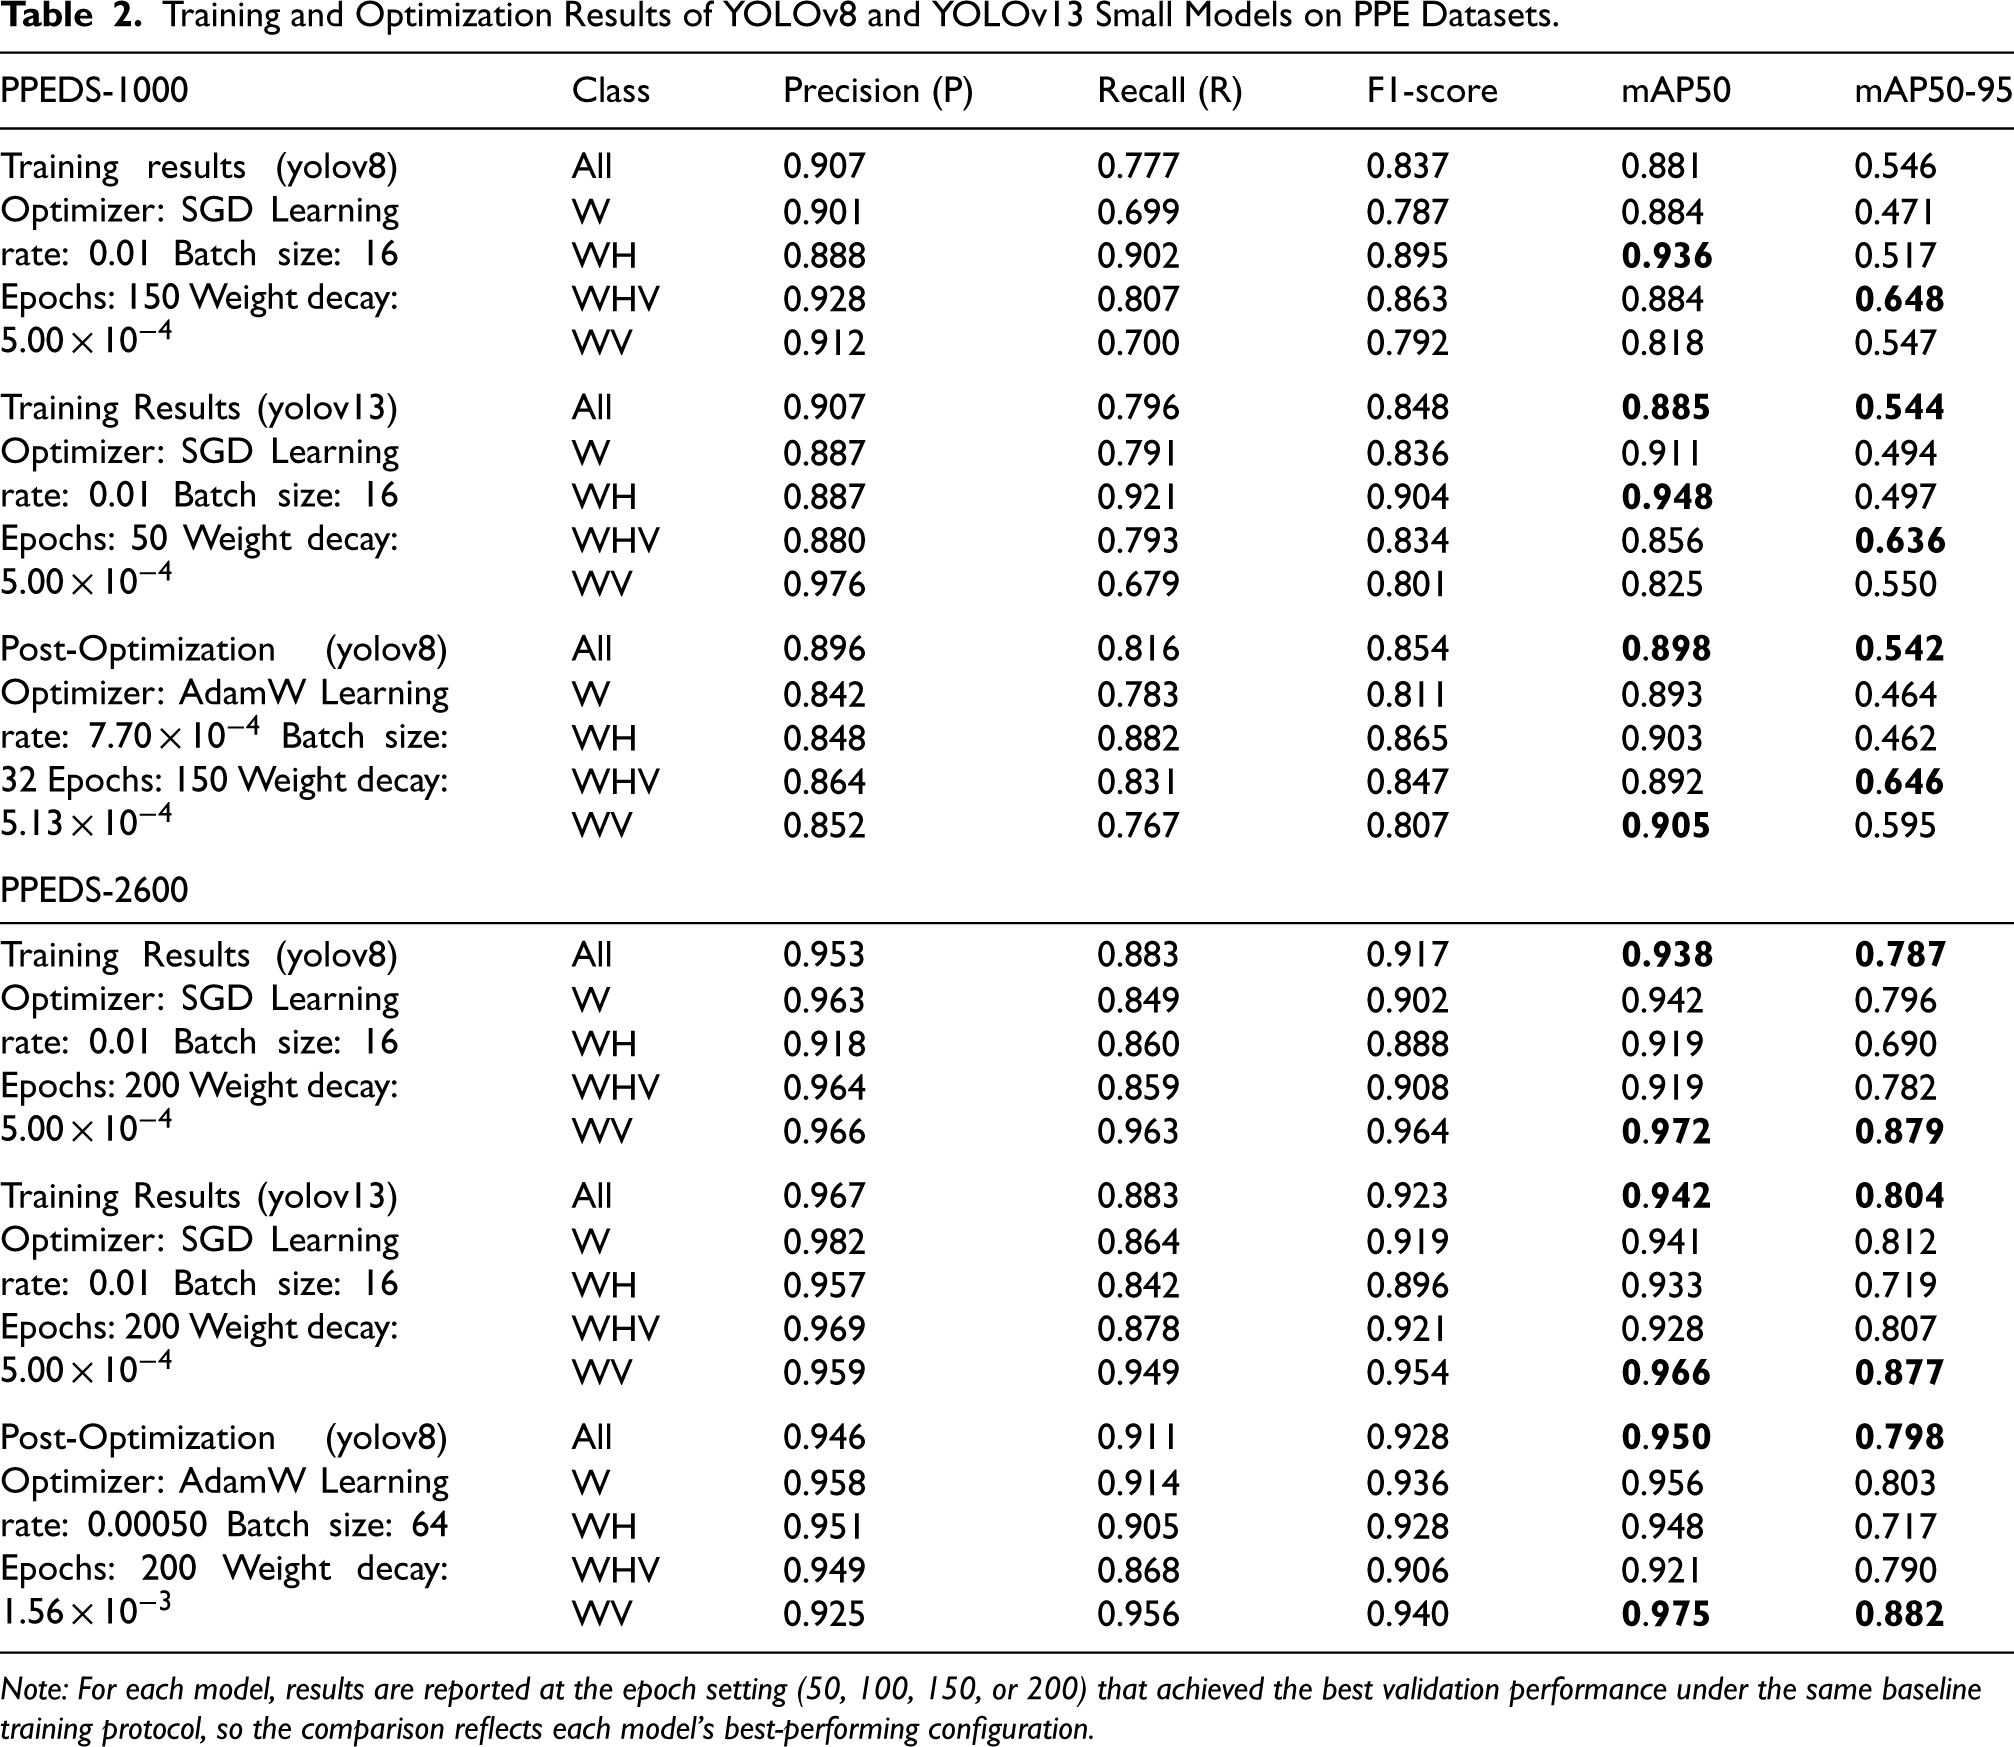
Note: For each model, results are reported at the epoch setting (50, 100, 150, or 200) that achieved the best validation performance under the same baseline training protocol, so the comparison reflects each model's best-performing configuration.

Qualitative comparison of PPE detection results for YOLOv8-small on PPEDS-2600 test images.
The main contributions of this work are as follows: A deployment-oriented HPO protocol integrating Optuna with lightweight YOLOv8 variants (nano and small) under a fixed trial budget, with transparent reporting of the search space, sampling seed, and resulting configurations. A class-specific optimization insight for OHS monitoring: Optuna tuning yields the clearest gains on visually challenging compliance categories (WV and WHV) that are most affected by overlap and partial occlusion, supported by class-wise results (Tables 1 and 2) and qualitative evidence (Figure 2). A controlled evaluation across dataset conditions, comparing PPEDS-1000 with its deployment-variability extension PPEDS-2600 to quantify how dataset expansion/augmentation interacts with optimization for lightweight detectors. Practical feasibility evidence, combining accuracy results with runtime benchmarking (latency/FPS) under a reported inference setting (Table 3) to connect model improvements to real-time monitoring constraints.
Transitioning from manual to vision-based PPE compliance monitoring in OHS systems
Consistent and correct use of PPE is fundamental in occupational health and safety (OHS). Yet, in many workplaces, compliance is still checked through manual supervision, self-reporting, or checklist-based audits. These practices are familiar, but they are also intermittent and heavily dependent on human attention. Coverage can be limited, judgment can vary, and fatigue becomes a factor. In dynamic or large-scale environments, these limitations often translate into missed non-compliance events between inspection intervals. 12
Computer vision-based monitoring has therefore attracted interest as a practical complement to manual checks. Vision-based systems can detect PPE items directly from images or live video, generate consistent records, and trigger alerts when non-compliance is observed. This can reduce operational burden, particularly when multiple cameras or large areas must be monitored continuously. 12 The main requirement is reliability under field conditions; occlusions, crowded scenes, motion blur, and changing illumination are the norm rather than the exception.
Deep learning models for PPE detection
Earlier deep learning approaches to PPE monitoring often used two-stage detectors, such as Faster R-CNN. These models can be accurate, especially for small or partially occluded objects, but they typically come with higher computational cost and lower inference speed. 13 For continuous video surveillance, that trade-off matters. As a result, one-stage detectors such as YOLO are widely used in real-time settings because they provide higher throughput while remaining competitive in accuracy.
YOLO's key idea is simple: predict bounding boxes and class probabilities in a single forward pass. 6 This design has made YOLO-style detectors practical for time-sensitive monitoring, and recent surveys continue to highlight their efficiency for applied scenarios. 9 Within this family, YOLOv8 (Ultralytics) is often chosen because it offers stable tooling and multiple scalable variants that can be matched to different compute budgets. 14 Its anchor-free formulation and related design choices are commonly used to support efficient inference and reliable localization, including for smaller objects. 14 On the training side, strategies such as mosaic augmentation are frequently adopted to improve generalization in visually diverse scenes. 15
PPE-focused studies also report encouraging results with YOLOv8. Gupta et al. (2025) presented a YOLOv8-based PPE detector that achieved practical performance on commodity hardware across multiple PPE categories. 16 Shi et al. (2023) similarly emphasized the usefulness of lightweight YOLOv8 variants in industrial surveillance, where compact models are often preferable due to resource constraints. 17 Taken together, the literature supports YOLOv8 as a reasonable backbone for PPE compliance monitoring when accuracy and inference speed must be balanced.
Hyperparameter optimization in deep learning and PPE detection
Hyperparameters strongly influence how a detector trains and how well it generalizes. Learning rate, batch size, optimizer type, and training schedule affect convergence stability and the final performance—an important point for safety-related systems where robustness is expected. Prior studies have noted that batch size can affect generalization behavior. 18 Others highlight that the learning rate–batch size interaction shapes stochastic gradient dynamics and can make training either stable or fragile. 19 Further work on large-batch training shows that update counts and training duration can reduce the generalization gap observed in certain settings. 20 In short, default hyperparameters are convenient, but they are rarely optimal across datasets and workplace conditions.
In applied pipelines, tuning is often done manually because a systematic search is expensive. Automated HPO offers a more structured alternative. Ultralytics documentation also frames YOLO tuning as an iterative process aimed at improving precision, recall, and mean Average Precision (mAP), especially under difficult visual conditions such as occlusions and background clutter. 21 Among practical HPO frameworks, Optuna is widely used for its Bayesian sampling strategy (e.g., TPE) and its pruning mechanism, which terminates unpromising trials early. 11 Across broader machine learning settings, Optuna has repeatedly been reported to improve search efficiency and to support performance gains when integrated into training workflows.11,22
Integration of hyperparameter optimization into YOLO-based PPE detection
YOLO-based detectors are widely applied for PPE recognition, but structured and reproducible HPO is reported less frequently in PPE-focused workflows. Mathew and Vijayalakshmi (2025) noted that many comparative PPE detection studies depend on default configurations or limited manual adjustments, which can make results harder to reproduce across datasets and workplaces. 23 Earlier studies illustrate a similar pattern. Fang et al. (2018) applied Faster R-CNN for non-hardhat detection without reporting a systematic tuning strategy. 4 Loey et al. (2021) evaluated a YOLOv2–ResNet50 hybrid for face mask detection using limited configuration comparisons rather than a comprehensive HPO framework. 24 Reviews of YOLO architectures up to YOLOv8 also tend to focus on model evolution and benchmark results, with less emphasis on how automated tuning changes PPE-specific outcomes under deployment-relevant conditions. 9
Overall, the literature suggests two points. First, vision-based PPE monitoring is feasible and increasingly mature, and YOLO-style detectors remain practical candidates for real-time OHS applications. Second, there is still limited reporting of structured, reproducible HPO within PPE-oriented YOLO pipelines, particularly for lightweight variants intended for deployment. This gap motivates clearer optimization protocols and more transparent reporting of tuning choices and outcomes.
Materials and methods
This study builds on prior work using YOLOv8 for PPE detection, with the emphasis shifted to automated HPO via the Optuna framework. Instead of relying on fixed training configurations, the experiments explore a defined hyperparameter space to improve detection accuracy and generalization under realistic operating conditions.
For baseline comparison, YOLOv13-nano and YOLOv13-small models were also trained on the same datasets using the same baseline protocol. These YOLOv13 variants were included solely for comparison and were not tuned using Optuna. All experiments were conducted in a GPU-accelerated environment using two datasets: PPEDS-1000 (manually annotated real-world images) and PPEDS-2600 (an augmented extension). All training and Optuna-based HPO runs were executed on a workstation equipped with an NVIDIA RTX A5000 GPU. Inference speed results (latency and FPS) were additionally measured on Google Colab using an NVIDIA Tesla T4 GPU and are reported in Section 4.4 (Table 3). For representative 100-trial runs, the optimization cost was approximately 19 GPU-hours for YOLOv8-nano on PPEDS-1000 and 118 GPU-hours for YOLOv8-small on PPEDS-2600. Although non-trivial, this cost was incurred offline during the hyperparameter search phase. The practical deployment relevance of the proposed approach is therefore primarily reflected in the lightweight model size and real-time inference performance rather than in the one-time optimization cost.
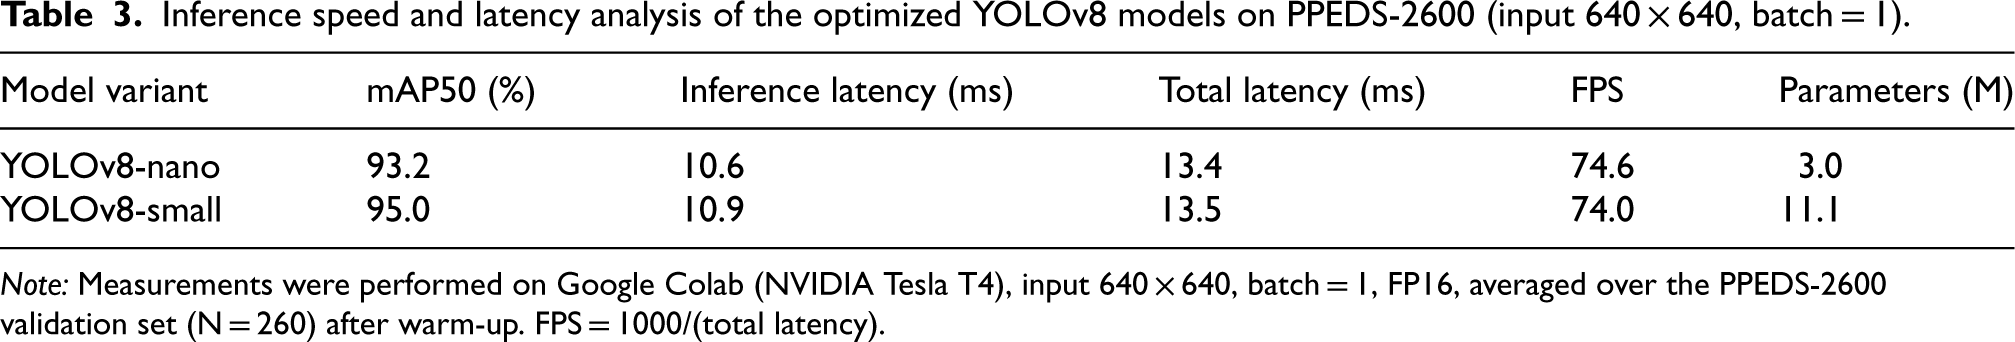
Inference speed and latency analysis of the optimized YOLOv8 models on PPEDS-2600 (input 640 × 640, batch = 1).
Inference speed and latency analysis of the optimized YOLOv8 models on PPEDS-2600 (input 640 × 640, batch = 1).
Note: Measurements were performed on Google Colab (NVIDIA Tesla T4), input 640 × 640, batch = 1, FP16, averaged over the PPEDS-2600 validation set (N = 260) after warm-up. FPS = 1000/(total latency).
All experiments were conducted using the same preprocessing, training, and evaluation pipeline across model variants. To improve the reproducibility of the hyperparameter search, Optuna's TPE sampler was initialized with a fixed random seed (seed = 42), ensuring a consistent trial-sampling sequence across runs. 11 Model training itself followed the default stochastic behavior of the underlying frameworks (no manual training seed was enforced). Results are reported for the best-performing configurations under the stated protocol. The YOLOv8 models were implemented using the official Ultralytics release (version 8.4.18), 14 while the YOLOv13 baselines were run from the official iMoonLab repository (commit 80e8223). 7 For comparability, YOLOv13 baselines were trained using the same datasets, data splits, input resolution, and baseline training schedule as YOLOv8.
Both PPEDS-1000 and PPEDS-2600 were curated and managed using the Roboflow platform. 25 PPEDS-1000 consists of 1,000 manually annotated real-world images representing realistic industrial PPE usage, whereas PPEDS-2600 contains 2,600 images and was created as an augmented extension of PPEDS-1000 to better reflect variability encountered in real-world deployment. Four detection classes were defined to support practical industrial safety monitoring: Worker (W), Worker with Helmet (WH), Worker with Vest (WV), and Worker with Helmet and Vest (WHV). Table 4 summarizes the distribution of images and labeled instances (bounding boxes) across the training, validation, and test subsets for both datasets.
Distribution of images and class-wise labeled instances across datasets and splits.
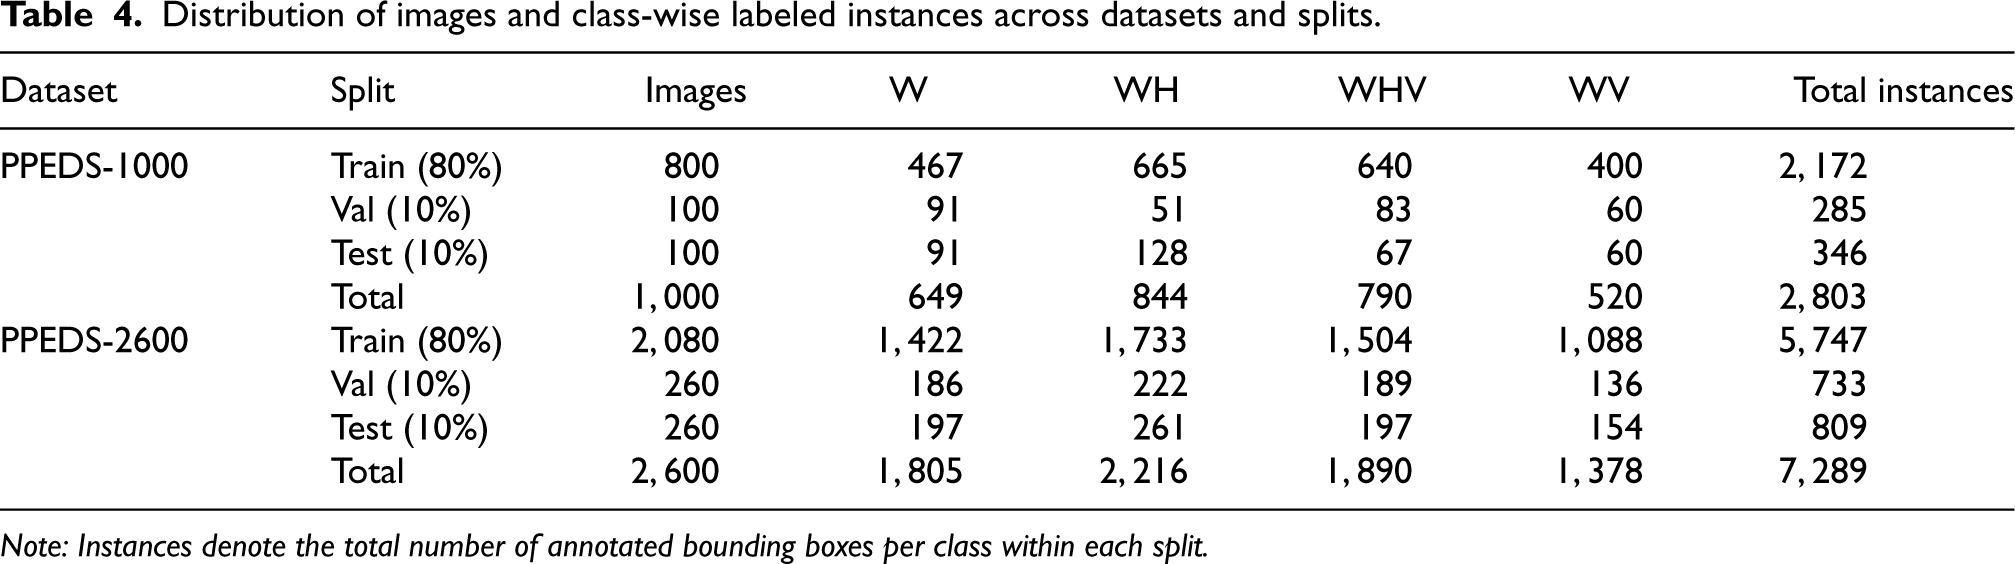
Distribution of images and class-wise labeled instances across datasets and splits.
Note: Instances denote the total number of annotated bounding boxes per class within each split.
PPEDS-1000 was constructed using a two-stage collection strategy to improve both domain relevance and visual diversity. In the first stage, approximately 3,000 candidate images were gathered from publicly accessible web sources using structured PPE-related keyword queries, such as “personal protective equipment,” “safety vest,” and “helmet with vest.” The initial pool was systematically screened to remove duplicate, heavily watermarked, and low-resolution images. Only images deemed suitable for non-commercial academic research use were retained. In the second stage, an on-site image collection process was conducted to better capture realistic workplace conditions. Workers were photographed under natural lighting with varying viewpoints, distances, and body postures representative of operational activities. From the combined image pool, a final set of 1,000 high-resolution images was selected, standardized in JPEG format, and manually annotated to establish PPEDS-1000.
For both datasets, the images were divided into training (80%), validation (10%), and test (10%) subsets. The split was designed to preserve the overall class distribution across subsets, thereby reducing sampling bias and supporting a more reliable evaluation. To avoid data leakage, augmentation for PPEDS-2600 was applied after the train/validation/test partitioning, and all augmented derivatives of a given source image were kept within the same subset. Cross-validation was not employed in this study. Instead, all experiments were conducted using a fixed 80%/10%/10% train/validation/test split for each dataset to ensure a consistent and reproducible evaluation setting while avoiding the substantial computational overhead associated with repeated YOLO training during HPO.
To increase visual variability and improve robustness under real deployment conditions, PPEDS-2600 was generated from PPEDS-1000 using a controlled augmentation pipeline consisting of horizontal flipping, blurring, and noise injection. Prior to model training, all images were standardized to 640 × 640 pixels, normalized, and exported in YOLO format.
The YOLO (You Only Look Once) family comprises single-stage object detectors widely used in real-time vision applications. In contrast to two-stage approaches such as Faster R-CNN, which separate region proposal from classification, YOLO predicts bounding boxes and class probabilities in a single forward pass. This unified design reduces computational overhead and supports high-throughput inference, which is important for time-critical monitoring tasks.6,26
YOLOv8, released by Ultralytics, introduced architectural and training updates that have contributed to its broad adoption in applied detection pipelines. It uses an anchor-free detection head with a decoupled structure, separating classification and localization objectives to improve learning stability and localization quality. YOLOv8 supports multiple task modes (e.g., detection, segmentation, and classification) and is available in scalable variants (nano to xlarge), allowing the model capacity to be matched to different deployment constraints. 14
In addition to the official Ultralytics YOLOv8 implementation, this study also includes a publicly available YOLO-based framework, referred to as YOLOv13, using the iMoonLab repository. 7 YOLOv13, as considered in this study, was included only as an untuned baseline for comparison. The repository describes components such as attention mechanisms, reparameterization modules, and feature-fusion refinements intended to improve detection under challenging conditions, such as small objects and partial occlusions, while keeping latency manageable. 7 In this study, YOLOv13-nano and YOLOv13-small were evaluated under the same training protocol to provide context for the optimized YOLOv8 results.
Overall, YOLOv8 and the YOLOv13 baseline considered in this study represent recent directions in single-stage object detection, offering practical options for safety-oriented applications where both accuracy and inference efficiency are important.7,9 Given the deployment motivation of this work, the experiments prioritize lightweight variants. In particular, the nano and small scales provide a practical balance between accuracy and computational cost for real-time monitoring pipelines. YOLOv13 was included as a recent baseline to contextualize the performance of these lightweight detectors under the same experimental protocol. In preliminary baseline runs, YOLOv13-nano/small and YOLOv8-nano/small exhibited broadly comparable performance on the studied datasets. Given this similarity and the more established ecosystem of YOLOv8 for deployment-oriented pipelines, Optuna-based optimization was intentionally restricted to YOLOv8-nano and YOLOv8-small. Extending the same HPO procedure to YOLOv13 is considered out of scope for the current work and is left for future investigation.
Hyperparameter optimization using Optuna
Optuna is a practical HPO framework designed to explore high-dimensional search spaces efficiently. This efficiency is particularly useful for deep learning settings where each training run is computationally expensive.11,27 This study integrates Optuna directly into the YOLOv8 training pipeline, using its Tree-structured Parzen Estimator (TPE)-based sampler to identify hyperparameter configurations that maximize validation mAP50 and improve both convergence behavior and generalization.
The pipeline adopts a define-by-run strategy. For each trial, Optuna samples a candidate hyperparameter set from a predefined search space (Section 3.3.1), trains the model, and evaluates its performance on the validation split. The objective function returns validation mAP50, which is maximized during optimization.11,28 Validation mAP50 was selected as the primary optimization objective rather than the stricter mAP50–95 metric for two practical reasons. First, in occupational safety monitoring, reliable detection of PPE presence is operationally more critical than highly stringent localization, and mAP50 provides a direct indicator of detection success under an IoU threshold commonly used in practice. Second, compared with mAP50–95, mAP50 typically yields a more stable optimization signal during hyperparameter search, which supports efficient exploration of the search space with TPE-based sampling. Nevertheless, mAP50–95 was recorded throughout and is reported as a stricter localization-focused metric to assess post-optimization improvements.
In this study, Optuna's TPE sampler was initialized with a fixed seed (seed = 42) to ensure a consistent trial sampling sequence across runs. 11 No early-stopping pruner was applied; each trial was executed under its sampled epoch budget. For each trial, the sampled hyperparameters were used to train the model on the training split, and validation mAP50 was computed as the optimization objective. This process was repeated until the predefined trial budget was completed, after which the best-performing configuration was selected based on validation mAP50. The final model was then retrained using the best configuration and evaluated on the held-out test set for an unbiased assessment.
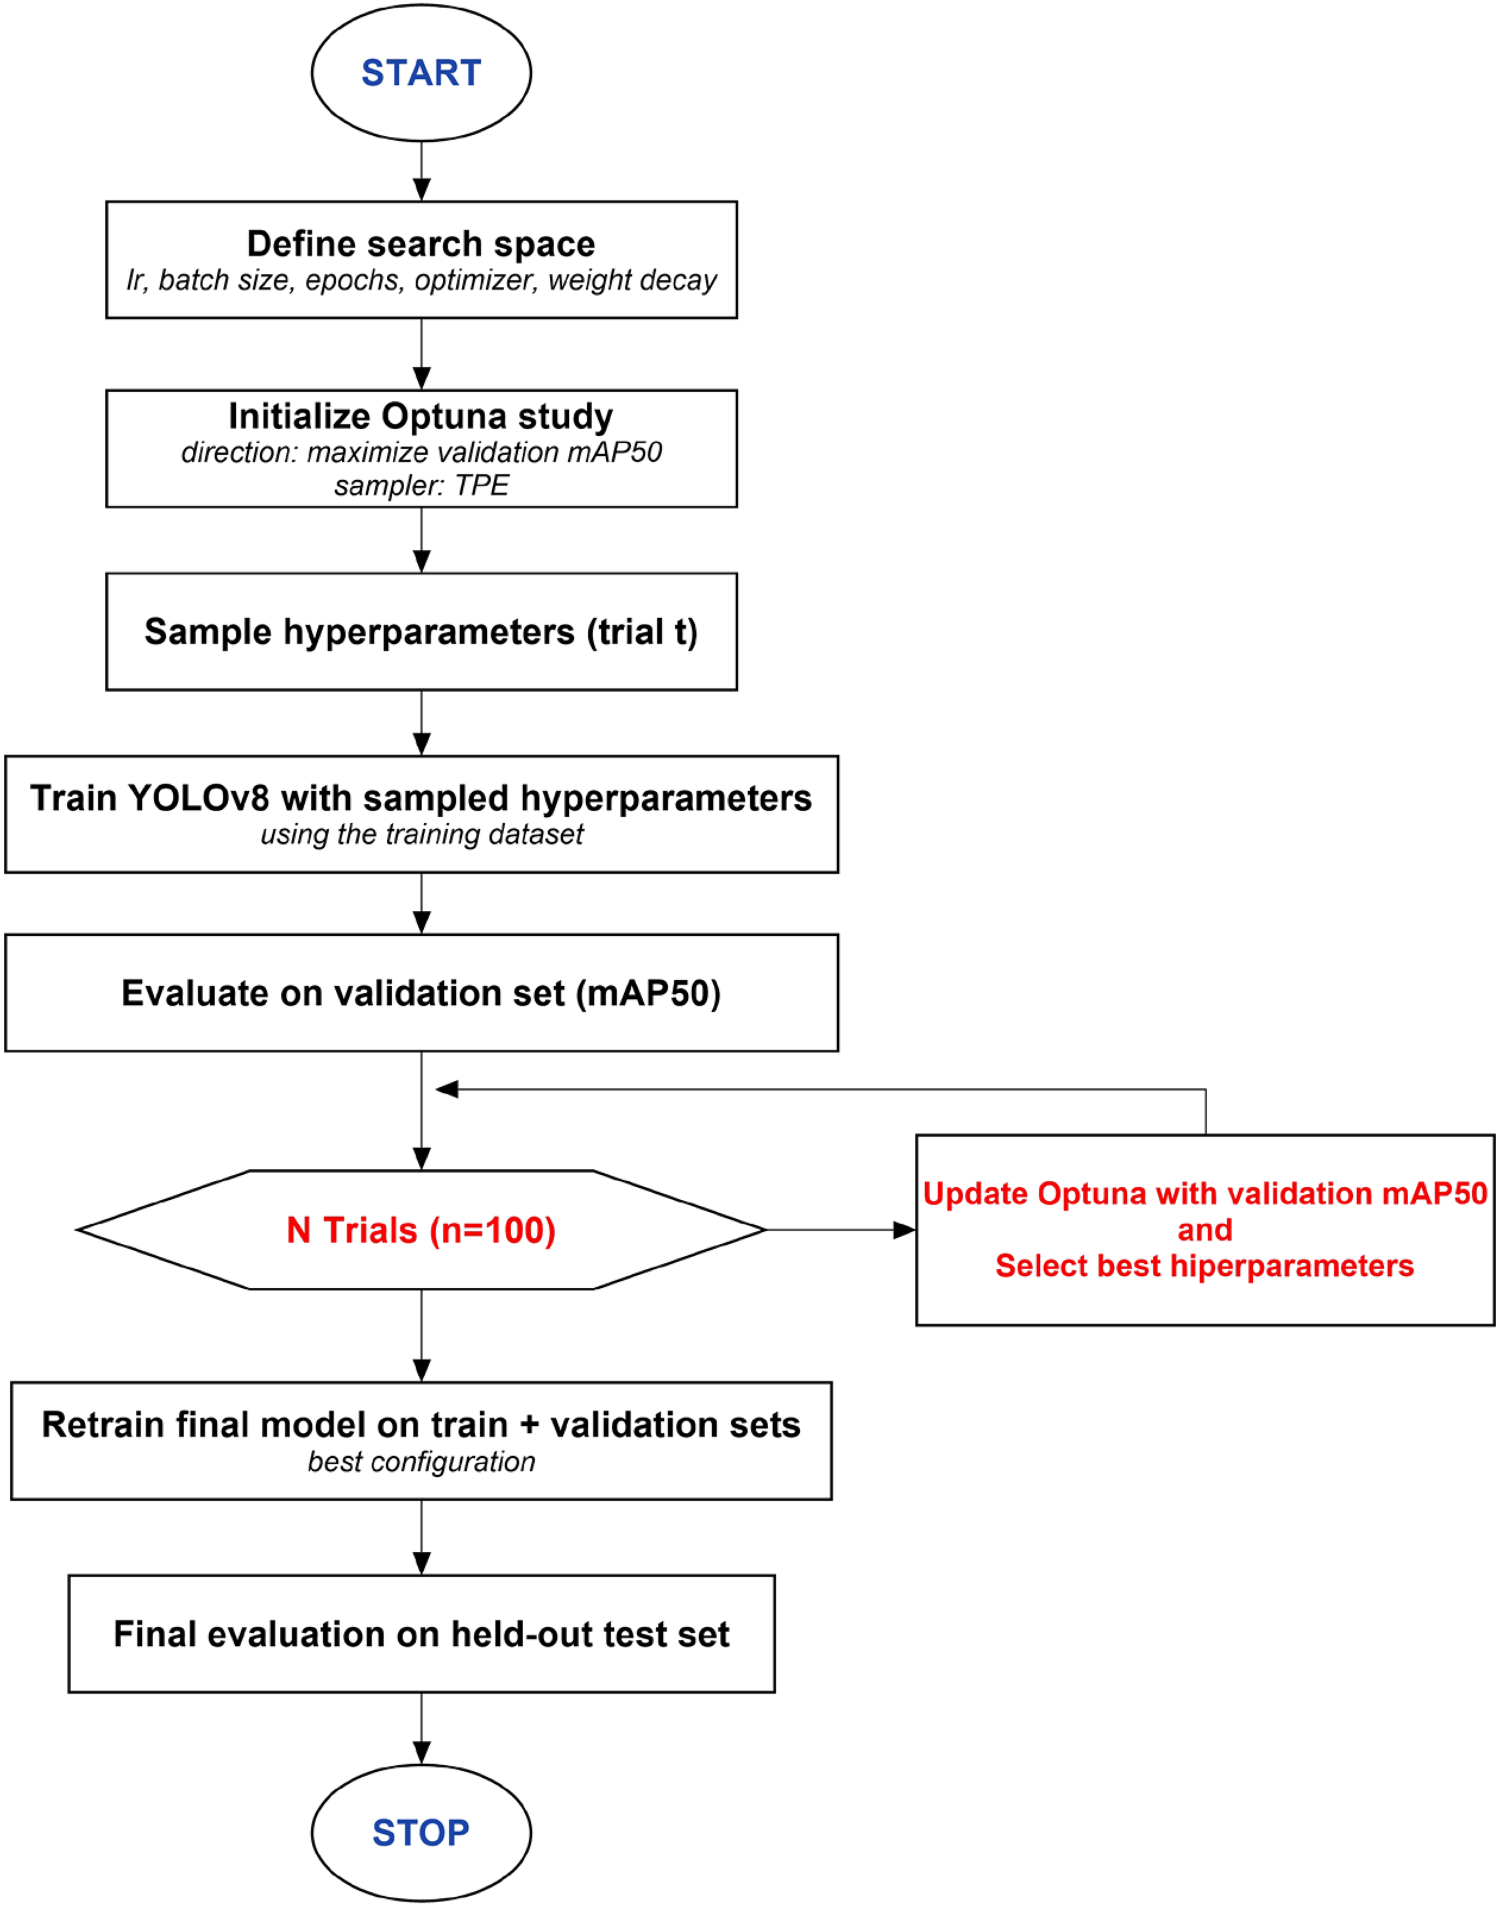
Optuna-based hyperparameter optimization (HPO) workflow for YOLOv8 training.
Considering deployment constraints and the study's focus on lightweight variants, the optimization process was limited to YOLOv8-nano and YOLOv8-small. Each variant was optimized independently to account for differences in model capacity and computational profile, rather than applying a single configuration across architectures. Figure 3 illustrates the overall optimization workflow, and Section 3.3.1 provides details of the search space and trial settings.
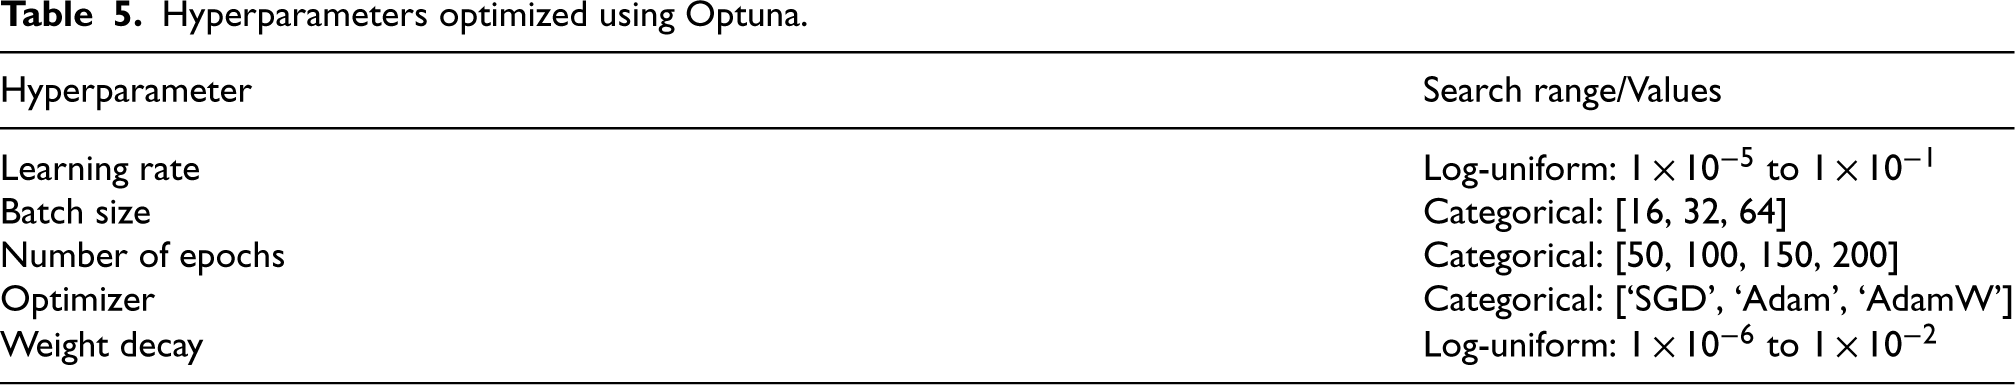
To explore training configurations systematically, the Optuna framework tunes a set of hyperparameters that strongly influence convergence and generalization in object detection. Table 5 summarizes the search space and sampling ranges.
Each Optuna trial instantiates a YOLOv8 training run using the define-by-run configuration and records key validation metrics (precision, recall, mAP50, and mAP50–95). The optimization objective is to maximize validation mAP50, and the best-performing configuration is selected based on this criterion.
The search is performed separately for YOLOv8-nano and YOLOv8-small to account for differences in model capacity and computational profile.
Evaluation metrics
To ensure a robust and reproducible evaluation, model performance was assessed on the held-out test set using standard object detection metrics.
28
The following metrics were used: Precision: the proportion of correct positive detections among all predicted positives. Recall: the proportion of correct positive detections among all ground-truth positives. F1-score: the harmonic mean of precision and recall, balancing false positives and false negatives. Mean Average Precision at IoU = 0.5 (mAP50): mean Average Precision computed at an Intersection-over-Union (IoU) threshold of 0.50. Mean Average Precision averaged over IoU thresholds from 0.5 to 0.95 (mAP50–95): mean Average Precision averaged over IoU thresholds from 0.50 to 0.95 in 0.05 increments, providing a stricter measure of performance under varying localization thresholds.
Together, these metrics provide a clear view of detection quality in terms of precision, sensitivity, and localization, enabling a direct assessment of how HPO affects performance across YOLOv8 variants.
Experimental results
This section reports PPE detection results on the PPEDS-1000 and PPEDS-2600 datasets using lightweight YOLO-based detectors. Optuna was used to tune YOLOv8-nano and YOLOv8-small to identify hyperparameter configurations that improve performance while keeping the models suitable for real-time use.
For reference, YOLOv13-nano and YOLOv13-small were trained under the same baseline protocol. Their results are included to contextualize the optimized YOLOv8 variants; however, automated tuning was applied only to YOLOv8-nano and YOLOv8-small.
Overall performance is evaluated using standard object detection metrics, including precision, recall, F1-score, mAP50, and mAP50–95. 28 The following subsections present baseline and post-optimization comparisons, together with dataset-wise and class-wise results. Because the dataset annotations were defined as compliance-state classes (W, WH, WV, and WHV) rather than isolated PPE-item labels, class-wise AP is reported at the level of these four detection classes instead of individual equipment items such as helmets or vests. Accordingly, Tables 1 and 2 provide class-specific mAP50 and mAP50–95 values to show which PPE-related compliance states benefit most from optimization.
Hyperparameter optimization process
Optuna-based tuning was conducted to improve PPE detection performance on PPEDS-1000 and PPEDS-2600. 11 The optimization objective was to maximize validation mAP50, while mAP50–95 and the remaining metrics were also recorded to provide a broader view of localization and overall detection quality. 28
To establish consistent baselines, the nano and small variants of YOLOv8 and YOLOv13 were first trained using the same fixed protocol. Baseline training used SGD with an initial learning rate of 0.01 and a batch size of 16. Models were trained for 50, 100, 150, and 200 epochs to examine performance trends over training duration. These runs serve as pre-optimization references for each dataset and model variant.
Automated tuning was applied only to YOLOv8-nano and YOLOv8-small. For each dataset–model combination, 100 Optuna trials were executed to explore the predefined search space described in Section 3.3.1. In each trial, Optuna sampled a candidate configuration, trained the model, monitored intermediate validation performance, and retained the configuration with the highest validation mAP50.
All experiments followed the same preprocessing pipeline. Dataset management and augmentations (horizontal flipping, blurring, and noise injection) were handled through Roboflow to keep the training setup consistent across both datasets and model variants. 25
To better interpret the contribution of the tuned hyperparameters for the YOLOv8-small model on PPEDS-2600, a Functional Analysis of Variance (fANOVA) was conducted on the completed Optuna trials. For reproducibility, the fANOVA evaluator was initialized with a fixed random seed (seed = 42). As shown in Figure 4, learning rate was identified as the dominant factor influencing the validation mAP50 objective, with a relative importance of 0.92. The remaining hyperparameters (optimizer, epochs, batch size, and weight decay) showed comparatively minor and closely similar contributions (0.02 each). These results suggest that, within the joint optimization process for this setting, performance improvements were driven primarily by learning rate selection, while the other tuned parameters played secondary roles.
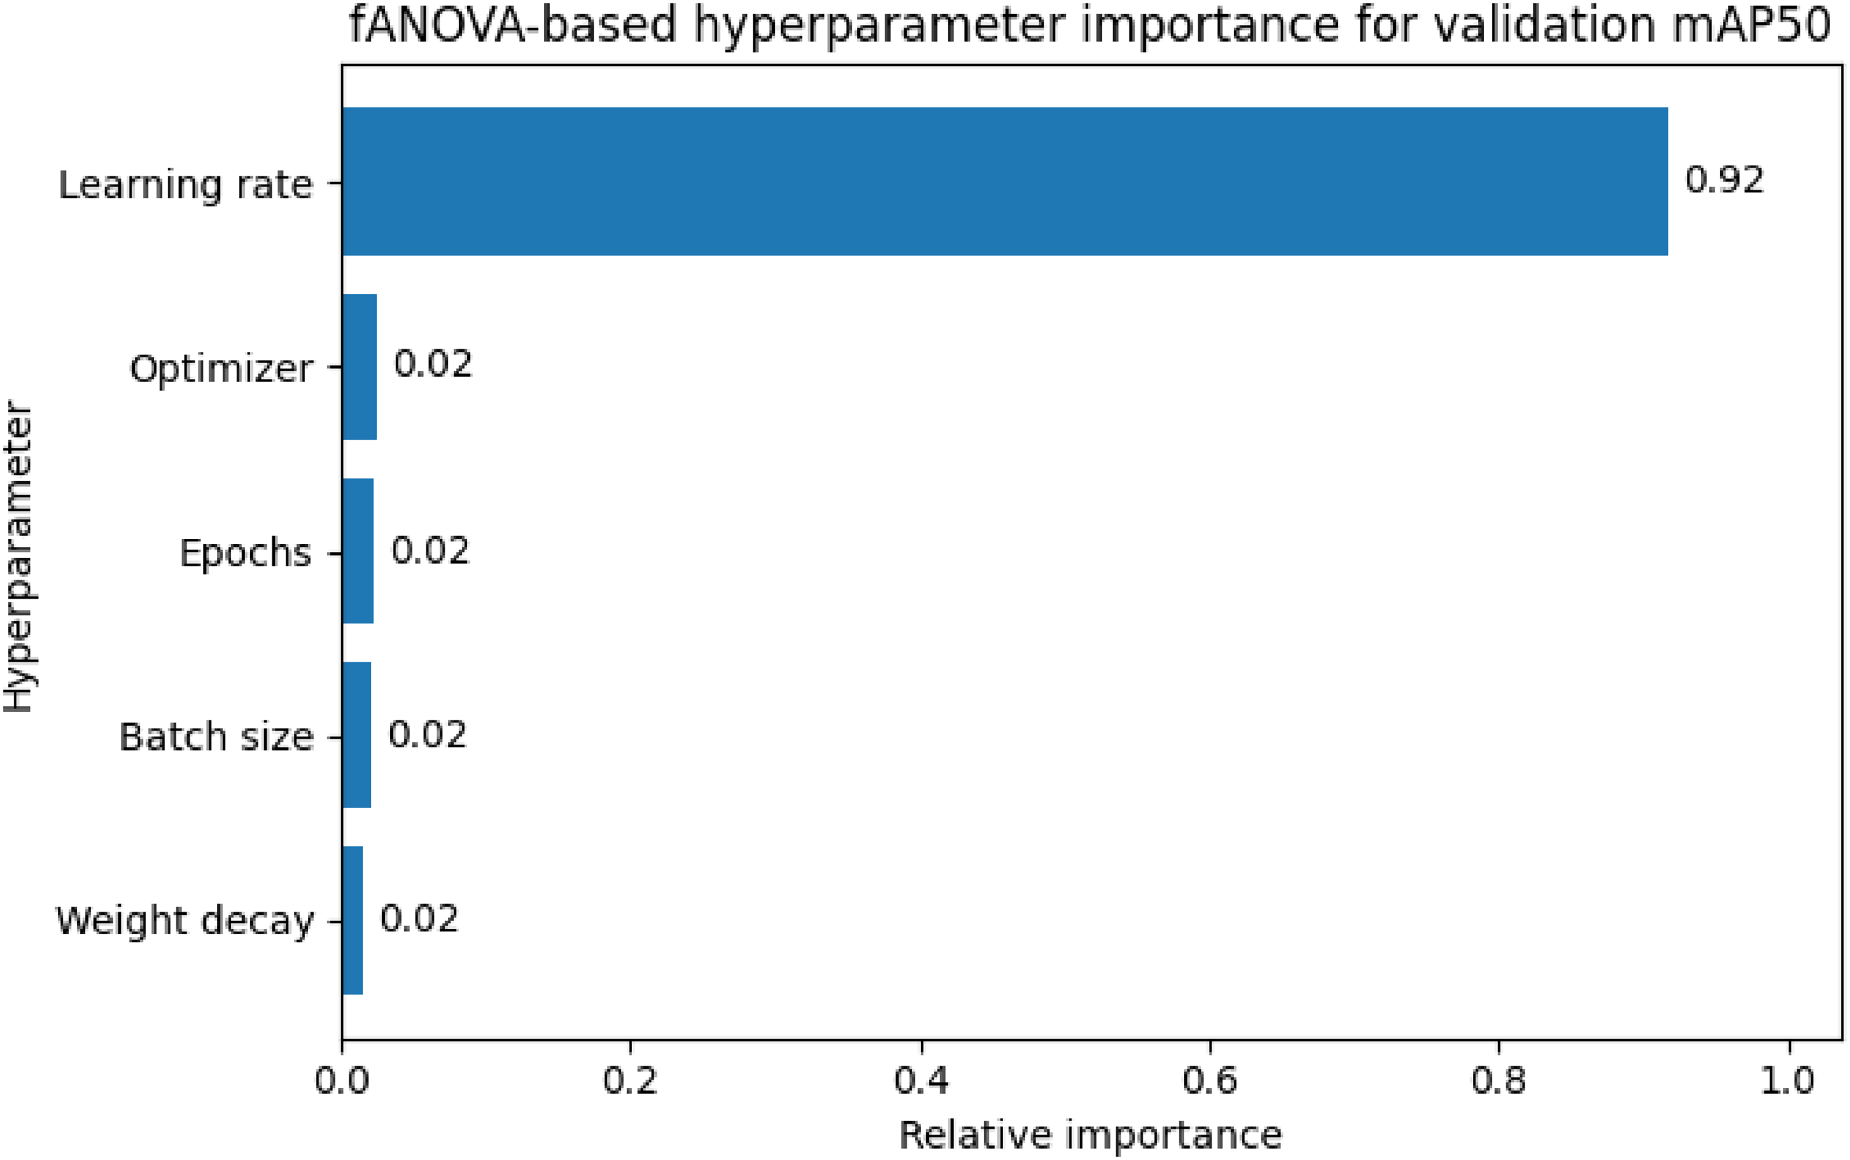
Relative importance of the tuned hyperparameters for the YOLOv8-small model on PPEDS-2600 with respect to the validation mAP50 objective, estimated from the Optuna trial history using fANOVA.
Hyperparameters optimized using Optuna.
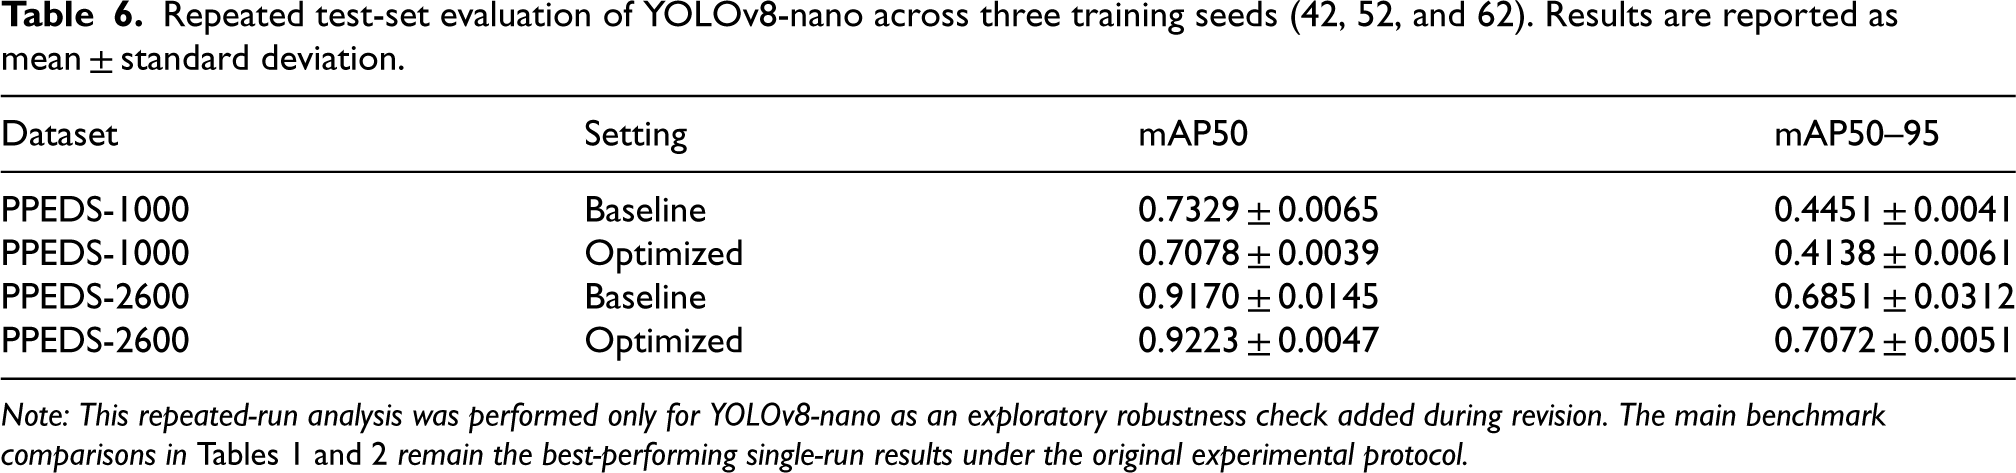
Repeated test-set evaluation of YOLOv8-nano across three training seeds (42, 52, and 62). Results are reported as mean ± standard deviation.
This section compares YOLOv8-nano and YOLOv13-nano on the PPEDS-1000 and PPEDS-2600 datasets. Both models were trained using the same baseline protocol across four epoch schedules, and the best-performing epoch setting was reported for each case. Optuna-based HPO targeted only YOLOv8. To avoid over-interpreting cross-version comparisons, YOLOv13 results are reported as untuned baselines under the same fixed protocol and are not intended to represent the best achievable YOLOv13 performance.
On PPEDS-1000, baseline YOLOv8-nano achieved mAP50 = 0.870 and mAP50–95 = 0.507 (Table 1). Class-wise mAP50–95 was highest for WHV (0.608), while W and WH were lower (0.458 and 0.440), suggesting that these classes were more challenging under the baseline setting. Under the same baseline protocol, YOLOv13-nano matched mAP50 (0.870) and achieved a higher mAP50–95 (0.543) at 50 epochs. At the class level, YOLOv13-nano reached mAP50–95 values of 0.620 for WHV and 0.543 for WV. After Optuna-based tuning, YOLOv8-nano improved to mAP50 = 0.895 and mAP50–95 = 0.539, with WHV (0.661) and WV (0.588) showing the clearest gains.
On PPEDS-2600, baseline YOLOv8-nano achieved mAP50 = 0.921 and mAP50–95 = 0.715, with WV reaching 0.793 (Table 1). Baseline YOLOv13-nano slightly exceeded these results (mAP50 = 0.923, mAP50–95 = 0.752) and produced high class-wise mAP50–95 for WHV (0.759) and WV (0.826). Optuna-based tuning further improved YOLOv8-nano to mAP50 = 0.932 and mAP50–95 = 0.735, with WV (0.827) again showing the largest increase. Table 1 summarizes the full baseline and post-optimization results.
Comparative evaluation of YOLOv8-small and YOLOv13-small models
This section presents a comparative analysis of YOLOv8-small and YOLOv13-small models on the PPEDS-1000 and PPEDS-2600 datasets, focusing on baseline and post-optimization performance. Both models were trained under the same baseline protocol across four epoch schedules, and the best-performing epoch setting was reported for each case. Optuna-based HPO targeted only YOLOv8-small.
On PPEDS-1000, baseline YOLOv8-small achieved mAP50 = 0.881 and mAP50–95 = 0.546 (Table 2). Class-wise mAP50–95 was highest for WHV (0.648) and WV (0.547), while W and WH were lower (0.471 and 0.517). Under the same baseline protocol, YOLOv13-small achieved comparable results at 50 epochs (mAP50 = 0.885, mAP50–95 = 0.544), with class-wise mAP50–95 values of 0.636 for WHV and 0.550 for WV. After Optuna-based tuning, YOLOv8-small reached mAP50 = 0.898 and mAP50–95 = 0.542. The WV class improved from 0.547 to 0.595, while WHV remained stable (0.646); W and WH showed small decreases (0.471 to 0.464 and 0.517 to 0.462, respectively).
On PPEDS-2600, baseline YOLOv8-small achieved mAP50 = 0.938 and mAP50–95 = 0.787, with WV reaching 0.879 and WHV reaching 0.782 (Table 2). Baseline YOLOv13-small slightly exceeded these results (mAP50 = 0.942, mAP50–95 = 0.804) and showed higher class-wise mAP50–95 for W (0.812) and WHV (0.807). Optuna-based tuning further improved YOLOv8-small to mAP50 = 0.950 and mAP50–95 = 0.798. Class-wise mAP50–95 increased for W (0.796 to 0.803), WH (0.690 to 0.717), WHV (0.782 to 0.790), and WV (0.879 to 0.882). Table 2 provides a detailed summary of the baseline and post-optimization results.
To further contextualize the numerical improvements reported in Table 2, Figure 2 presents qualitative examples of YOLOv8-small predictions on PPEDS-2600 test images before (baseline) and after Optuna-based tuning. In visually challenging scenes with partial occlusion and varied lighting (e.g., Figure 2(a) and (d)), the optimized model yields more consistent detections and higher confidence scores for PPE-related compliance classes. Furthermore, in environments with severe background clutter, such as dense rebar grids (e.g., Figure 2(c) and (f)), the baseline model already performs reasonably well, whereas the optimized model produces slightly higher confidence scores and more stable predictions under the same inference settings. These examples visually support the quantitative results and indicate that the most noticeable improvements are concentrated in visually challenging conditions, particularly those involving overlap, occlusion, and cluttered backgrounds.
Although these class-wise results and qualitative examples indicate that overlap-prone compliance categories such as WV and WHV are more sensitive to partial occlusion and visual ambiguity, the present study does not include a separately annotated failure-mode analysis for occlusion level or visually similar distractors (e.g., helmet-like headwear or vest-like clothing). Therefore, the current interpretation is based on class-wise performance patterns and qualitative inspection rather than on a dedicated statistical breakdown of failure frequency by visual difficulty type. A more structured failure analysis remains an important direction for future work.
Inference speed and deployment feasibility
In practical OHS monitoring, detection accuracy alone is not sufficient; real-time operation also requires low latency and adequate throughput (FPS).12,17 Runtime performance was evaluated for the Optuna-optimized YOLOv8-nano and YOLOv8-small models under a real-time setting. Table 3 reports inference latency, end-to-end (total) latency, and the corresponding FPS. All tests were executed with a batch size of 1 to reflect frame-by-frame video processing rather than batch inference.
As shown in Table 3, both variants operate at approximately 74 FPS on the T4 GPU, indicating real-time throughput under the evaluated configuration. These T4 measurements serve as a computational baseline; actual runtime on embedded edge devices (e.g., smart cameras) will depend on device-specific resources and deployment-level optimizations (e.g., TensorRT 29 ). Accordingly, comprehensive profiling directly on embedded hardware is reserved for future work. Nevertheless, the compact parameter footprint of YOLOv8-nano (3.0 M) remains favorable for compute and memory limited deployments where maintaining low latency is a practical requirement.
Robustness and repeatability analysis
The primary benchmark evaluations (Tables 1 and 2) report the best-performing configurations selected based on validation mAP50 under a fixed trial setting. However, deep learning models can exhibit sensitivity to random weight initializations, raising questions about whether HPO yields robust gains across stochastic training conditions or may be partially sensitive to specific training initializations.
To assess whether the observed gains from HPO were robust to stochastic training effects, we conducted an exploratory repeated-run analysis for YOLOv8-nano on both datasets using three different training seeds (42, 52, and 62). For each dataset, the baseline and Optuna-optimized configurations were retrained under the same protocol, and final performance was evaluated on the held-out test set. We report the mean and standard deviation of mAP50 and mAP50–95 across seeds to provide a preliminary estimate of repeatability (Table 6).
The repeated-run results indicate that the effect of tuning was dataset-dependent. On PPEDS-1000, the optimized YOLOv8-nano configuration did not maintain the single-run improvement pattern across seeds and instead showed lower mean test performance than the baseline, suggesting that the observed single-run gains may have been sensitive to specific initialization conditions. In contrast, on PPEDS-2600, the optimized configuration yielded slightly higher mean mAP50 and a modest improvement in mAP50–95, while also substantially reducing performance variance across runs in this exploratory analysis. These findings suggest that HPO may be more stable when the training data include greater scale and deployment-oriented variability.
Given that this analysis was limited to three seeds and to the YOLOv8-nano variant, the results should be interpreted as preliminary robustness evidence rather than as definitive statistical confirmation. Nevertheless, they provide useful additional context for interpreting the main single-run benchmark results reported in Tables 1 and 2.
Conclusion and future work
This study investigated Optuna-based HPO for lightweight YOLOv8 models in PPE compliance monitoring on the PPEDS-1000 and PPEDS-2600 datasets. The main single-run benchmark results showed that tuning can improve detection performance, particularly in localization-sensitive metrics (mAP50–95) and in visually challenging compliance categories. Compared with baseline training, the best-performing Optuna configurations achieved gains of up to 2.5 percentage points in mAP50 and 3.2 percentage points in mAP50–95 (Tables 1 and 2), while maintaining real-time throughput under the reported runtime setting (Table 3).
On PPEDS-1000, the single-run results showed that optimization improved YOLOv8-nano from mAP50–95 = 0.507 to 0.539, together with increases in precision, recall, and F1-score (Table 1). Class-wise improvements were especially visible for WHV and WV. For YOLOv8-small on PPEDS-1000, mAP50 increased and WV improved substantially, while overall mAP50–95 remained approximately stable (Table 2). These findings indicate that optimization can provide useful class-level benefits even when overall gains are modest.
On PPEDS-2600, the single-run results showed clearer benefits of optimization. YOLOv8-nano improved from mAP50–95 = 0.715 to 0.735 and achieved higher overall precision and F1-score (Table 1). For YOLOv8-small, mAP50–95 also increased, with class-wise improvements for WH and WV (Table 2). Baseline comparisons further showed that YOLOv13-nano and YOLOv13-small achieved performance broadly comparable to YOLOv8 under the same protocol, with slightly higher mAP50–95 in some settings (Tables 1 and 2). Given the stable tooling and integration of YOLOv8, optimization efforts were therefore focused on YOLOv8 variants.
Importantly, the additional repeated-run analysis for YOLOv8-nano indicated that the stability of HPO gains was dataset-dependent. On the smaller PPEDS-1000 dataset, the optimized configuration did not consistently maintain its single-run advantage across different random initializations, suggesting seed sensitivity under limited dataset scale and variability. In contrast, on the augmented PPEDS-2600 dataset, tuning showed more stable behavior across repeated runs, with slightly higher mean performance and lower variance than the baseline. This pattern suggests that the practical benefit of HPO becomes clearer when the training data better reflect deployment-oriented variability.
The observed benefits of HPO were particularly notable for overlap-prone compliance categories such as WV and WHV, suggesting that structured tuning may be especially valuable in deployment scenarios dominated by partial visibility, background clutter, and crowded scenes. Consistent with this pattern, the qualitative examples (Figure 2) illustrate more robust and consistent detections after tuning under occlusion and visually complex conditions. In addition to these accuracy-related findings, runtime measurements for the optimized models support real-time feasibility under the reported setting, with both YOLOv8-nano and YOLOv8-small operating at approximately 74 FPS and low total latency on a Tesla T4 GPU (Table 3). Together, these results suggest that lightweight YOLOv8 variants, coupled with systematic optimization, are promising candidates for deployment-oriented PPE compliance monitoring, provided that the training data possess sufficient scale and variability to support stable generalization.
While the scope of this deployment-oriented study restricted Optuna-based tuning to YOLOv8, applying the same optimization protocol to other publicly available YOLO-based frameworks, including the YOLOv13 baselines considered in this study, remains an important direction for future work. In addition, future work should include: (i) expanding the search space and/or trial budget to better address challenging classes such as W and WH, (ii) incorporating additional training schedules and augmentation-related settings into the tuning loop, (iii) extending repeated-run robustness analysis to other model variants, (iv) evaluating the optimized models on independent external PPE datasets or separately collected site-specific datasets to assess cross-dataset generalization, and (v) validating the optimized models on embedded hardware and under real deployment conditions with varying illumination, occlusion, and motion. Extending PPE monitoring toward broader safety scenarios, such as unsafe behavior recognition or hazardous-zone monitoring, is also a promising direction for more comprehensive OHS systems.
Footnotes
Acknowledgements
This study is derived from the first author's ongoing PhD thesis at the Graduate School of Natural and Applied Sciences, Dokuz Eylül University, on AI-based detection and classification of personal protective equipment for occupational safety monitoring.
Ethical approval
Ethical approval for the image collection was obtained from the Dokuz Eylül University Ethics Committee.
Funding
The authors received no financial support for the research, authorship, and/or publication of this article.
Declaration of conflicting interests
The authors declared no potential conflicts of interest with respect to the research, authorship, and/or publication of this article.
Data availability
The datasets (PPEDS-1000 and PPEDS-2600) supporting the findings of this study are available from the corresponding author upon reasonable request. Due to copyright constraints related to a portion of the web-sourced images and ethical/privacy requirements for the worker photographs, the raw image files cannot be publicly redistributed. However, the derived bounding box annotations (YOLO format) and a curated subset of cleared sample images can be shared strictly for non-commercial academic research.