
Abstract
Stimulus over-selectivity describes a phenomenon in which an individual responds only to a subset of the stimuli present in the environment and, thus, may restrict learning. This study aimed to develop understanding of the nature and role of over-selectivity in autism spectrum disorder (ASD) by analyzing the relationship of over-selectivity to core deficits of ASD: stereotyped responding and inflexibility. Over-selectivity was investigated in a visual discrimination task in 24 children, 12 diagnosed with ASD and 12 mental-age-matched typically developing children. In addition, the participants’ levels of intellectual functioning, stereotypy, and cognitive flexibility were assessed using established tools. Results showed that over-selectivity was associated with IQ and stereotyped behavior but was not related to levels of cognitive flexibility nor did cognitive flexibility significantly correlate with stereotyped behavior in individuals with ASD. The current findings require consideration when designing behavioral interventions for individuals with ASD.
Keywords
Stimulus over-selectivity describes a phenomenon in which an individual responds only to a subset of the stimuli present in the environment, and, thus, may restrict learning regarding the range, breadth, or number of features of a stimulus (Lovaas et al., 1971). Instances of over-selective responding are found in many clinical populations, notably including individuals with autism spectrum disorder (ASD; Kelly et al., 2015; Lovaas et al., 1979; Ploog, 2010). A failure to respond to all important cues in the environment may be a factor contributing to many problems seen in ASD, including deficits in communication skills (e.g., Chiang & Carter, 2008), social behavior skills (e.g., Schrandt et al., 2009), learning skills (e.g., Walpole et al., 2007), and the ability to generalize acquired material (e.g., Falcomata et al., 2007). Given that over-selectivity may have a general negative impact on overall quality of life in individuals with ASD (LeBlanc et al., 2005), and to understand the mechanisms and impacts of over-selectivity, it would be helpful to examine areas of cognitive functioning associated with the occurrence of over-selective responding. Such an exploration will help to develop a better theoretical and practical understanding of over-selective responding.
Research has shown that over-selectivity is related to empathizing (Reed, 2017), verbal intellectual functioning (Kelly et al., 2015), and chronological age (Kelly et al., 2016; McHugh & Reed, 2007), but is not strongly related to nonverbal intellectual functioning (Kelly et al., 2015), systematizing (Reed, 2017), IQ, and cognitive flexibility (Kelly et al., 2016). Results have been mixed regarding the association between mental age and over-selectivity; some researchers finding a negative relationship (Bailey, 1981; Schover & Newsom, 1976), but others not (Ploog et al., 2009; Ploog & Kim, 2007).
However, some of the factors noted above are not central to the definition of ASD (American Psychiatric Association [APA], 2013) and the precise relationship between over-selectivity and the cognitive correlates of ASD remains a gap in knowledge. In this regard, repetitive and restrictive patterns of behavior (RRBs; Raulston et al., 2019; Ravizza et al., 2013; Richler et al., 2007) comprise one of the functioning domains required for a diagnosis of ASD.
According to current Diagnostic and Statistical Manual of Mental Disorders (DSM) criteria, to obtain a diagnosis of ASD, an individual must exhibit all of the listed deficits in social communication and social interaction, which include deficits in social-emotional reciprocity; nonverbal communication; and in the development, maintenance, and understanding of relationships (Diagnostic and Statistical Manual of Mental Disorders [5th ed.; DSM-5; APA, 2013]). In addition, individuals must exhibit at least two of four symptoms of restricted, repetitive patterns of behavior. These symptoms include stereotyped or repetitive motor movements, use of objects, or speech; insistence on sameness and inflexible adherence to routines; highly restricted, fixated interests; and hyper- or hyperactivity to sensory input (APA, 2013). This study explored the relationship between over-selectivity and two of these variables in a clinical population with ASD that have not been widely examined in this context—inflexibility and stereotyped behavior.
In general, inflexibility is a pervasive and problematic feature of ASD. If a child fails to develop flexibility, this may interfere with learning opportunities and result in increased levels of challenging behavior (Dominick et al., 2007; Raulston et al., 2019). More specifically, deficits in cognitive flexibility may underpin the core symptoms of RRBs in ASD (Albein-Urios et al., 2018; Geurts et al., 2009). If this is the case, then it follows that an investigation to analyze associations between stimulus over-selectivity and cognitive flexibility is warranted. Cognitive flexibility is one of several components that fall within the executive function domain, and it enables individuals to disengage from one task or situation, and shift to adapt to new demands (Geurt et al., 2009). Deficits in cognitive flexibility can significantly affect the daily functioning and quality of life of individuals with ASD (Albein-Urios et al., 2018).
Many investigations of cognitive flexibility have used the Intra-dimensional/Extra-dimensional Set Shift Test (ID/ED; Owen et al., 1991). This neurocognitive task measures cognitive flexibility in a systematic fashion that allows for controlled increases in shifting demands (Vatansever et al., 2016; Yerys et al., 2009). Studies employing ID/ED have yielded mixed results. Some investigations report deficits in an ASD sample (Ozonoff et al., 2000, 2004), while others do not (Edgin & Pennington, 2005; Goldberg et al., 2005; Happé et al., 2006; Landa & Goldberg, 2005). However, such results are not universally noted, and Kelly et al. (2016) found that stimulus over-selectivity was not related to cognitive flexibility, as measured by the computerized version of the Wisconsin Card Sorting Task (WCST; Grant & Berg, 1948), in typically developing adults. Given this, the first aim of this study was to examine the association between cognitive flexibility, as measured by the ID/ED, and stimulus over-selectivity in a clinical population with ASD.
Stereotyped responding includes repetitive motor movements (e.g., hand-flapping), object use (e.g., lining up toys, flipping objects), as well as repetitive vocal responses (e.g., echolalia, scripting, idiosyncratic phrases) (APA, 2013; Raulston et al., 2019). The relationship between stereotypy and set shifting was investigated by Yerys et al. (2009). A positive correlation was revealed between the number of repetitive behaviors and extra-dimensional reversal errors in individuals with ASD. Specifically, as levels of stereotyped behavior increased, so too did the levels of cognitive inflexibility. Limited research has been conducted to analyze the association between stereotypy and over-selectivity. Koegel and Covert (1972) found that children with ASD did not acquire simple discriminations (involving auditory and visual stimuli) while engaging in stereotypy. However, an increase in correct responding and acquisition of the discrimination was found when stereotypy was suppressed using punishment procedures. In their interpretation of the data, Koegel and Covert (1972) suggested that the participants were selectively attending to their self-stimulatory behaviors. This may explain why individuals with ASD who engage in stereotypy, may struggle to attend to multiple stimulus cues in their learning environment (Cunningham & Schreibman, 2008). The second aim of this study was to further investigate the direct correlation between stereotyped behavior and over-selectivity.
In sum, the purpose of this study was to develop understanding of the nature and role of over-selectivity in ASD by providing new information about the relationship of over-selectivity to two core deficits of ASD. Specifically, the two research questions include the following:
If one, but not the other, of these variables is associated with over-selective responding, then it might help to illuminate the process responsible for over-selective responding and its relationship to ASD.
Method
Participants
A total of 24 children—12 diagnosed with ASD and 12 mental-age-matched typically developing children—participated in this study. All students with ASD who were enrolled in one specialist educational placement were invited to participate in the study. The center provided applied behavior analysis–based services to children with ASD. The typically developing participants were recruited from a mainstream primary school setting. Informed consent was obtained from the parent/guardian of each participant.
ASD group
This group consisted of 12 male children diagnosed with ASD independently by a qualified clinician (psychiatrist or clinical psychologist), using criteria from the fourth edition, text revision of the Diagnostic and Statistical Manual of Mental Disorders (DSM-IV-TR; APA, 2000). DSM-IV-TR criteria were used because this was the information available in the participants’ records at the time of data collection. Admission to the specialist educational placement from which the participants were recruited required a formal diagnosis of ASD. The severity of ASD was independently assessed, using the Gillian Autism Rating Scales (GARS-2; Gilliam, 2006), which gave a group mean ASD severity of 87.17 (SD ± 14.80; range = 66–111), meaning the probability of ASD is “very likely.” The mean chronological age was 8:11 (±2:6; range = 6:0–13.8) years:months. The Peabody Picture Vocabulary Test (4th ed.; PPVT-4; Dunn & Dunn, 2007) was administered to obtain the group’s verbal receptive language ability, providing a verbal mental age equivalent for each participant, thought of as key in predicting over-selectivity (Kelly et al., 2016), and this group scored a mean of 4:1 (±0:11; range = 3:0–5:10) years. Table 1 shows other group mean characteristics for this sample.
Correlations Between Stimulus Over-Selectivity and Predictors.
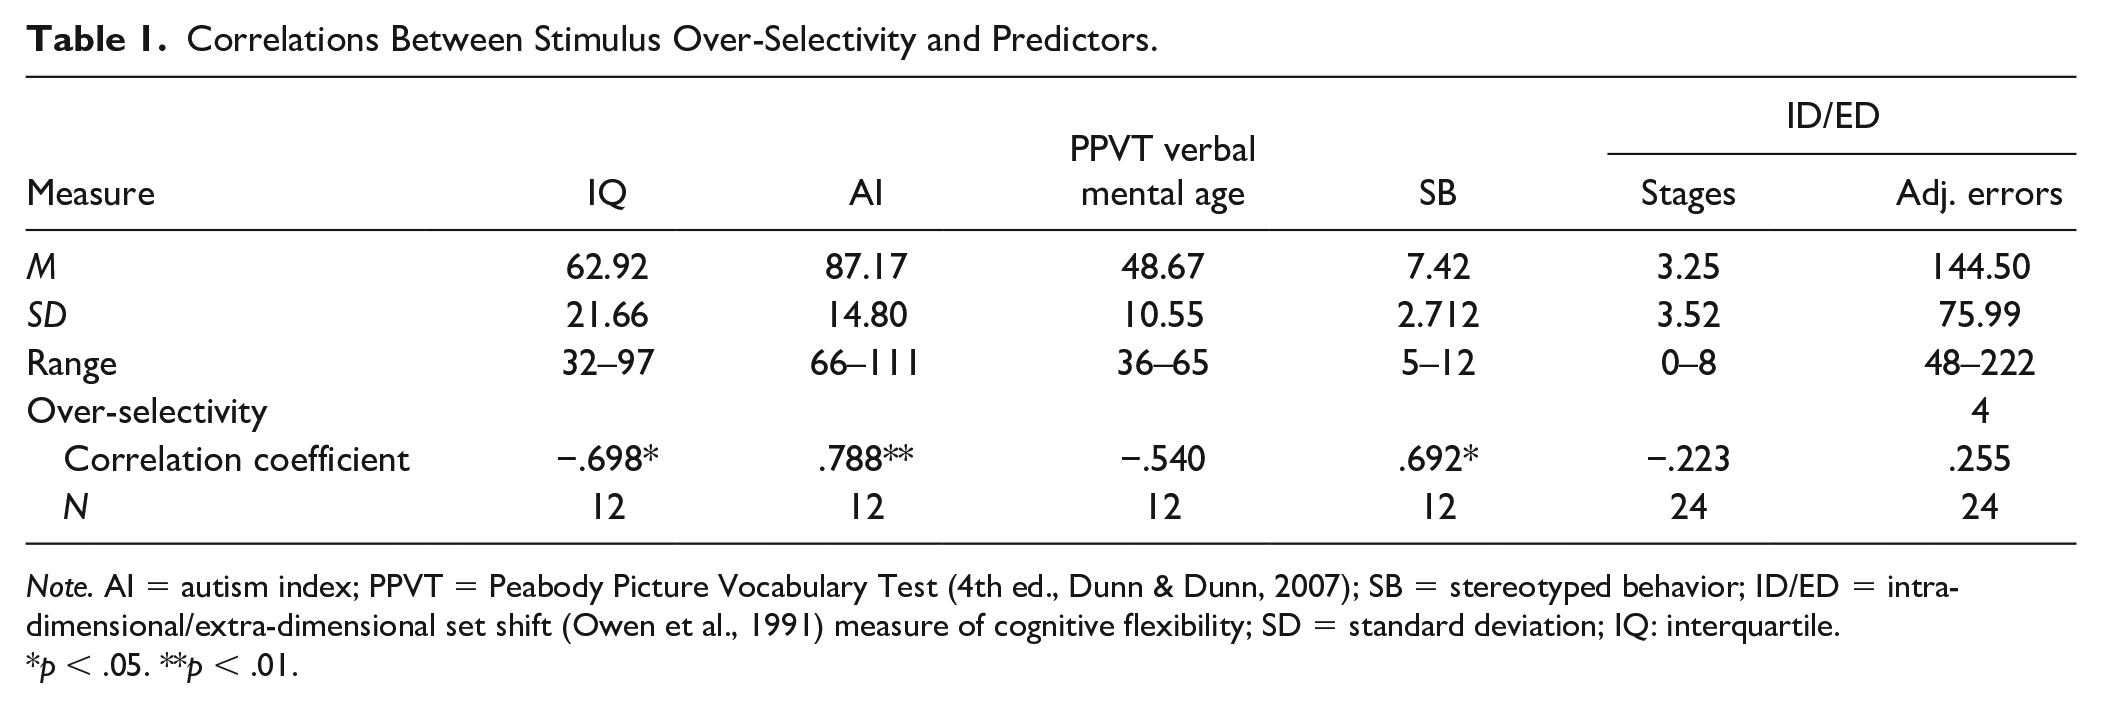
Note. AI = autism index; PPVT = Peabody Picture Vocabulary Test (4th ed., Dunn & Dunn, 2007); SB = stereotyped behavior; ID/ED = intra-dimensional/extra-dimensional set shift (Owen et al., 1991) measure of cognitive flexibility; SD = standard deviation; IQ: interquartile.
p < .05. **p < .01.
Comparison group
This group was composed of 12 typically developing children, five males and seven females. The mean chronological age was 4:1 (±0:6; range = 3:1–4:11) years, which was matched to the mean mental age of the ASD group. The comparison group were assumed to be of average intelligence, given that they all attended mainstream school and did not have a diagnosis of any intellectual, learning, or developmental disability. In addition, it was reported to the first author by the participants’ teachers that the children in this group were not receiving services to address any academic, adaptive, or social communication delays.
Materials
Gilliam Autism Rating Scale
Gilliam Autism Rating Scale–Second Edition (GARS-2) is a 42-item norm-referenced instrument describing the characteristic behaviors of individuals with ASD (Gilliam, 2006). There are three subscales, one of which is stereotyped behaviors, of particular interest in this study. Each subscale item is rated on a Likert-type scale: 0 (never observed), 1 (seldom observed), 2 (sometimes observed), or 3 (frequently observed). These produce standard scores (M = 10 ± 3), which, totaled, provide an Autism Index (M = 100 ± 15). An Autism Index of 85 or higher means that the probability of the individual having autism is “very likely”; 70 to 84 means that it is “possible” that the individual has ASD; and 69 or lower means it is unlikely that the individual has ASD. The internal consistency (Cronbach α) was .94 for the total test. In addition, the GARS-2 produces a measure of stereotyped behavior, with a standardized mean of 10 and standard deviation of 3. The internal consistency (Cronbach α) was .84 for the Stereotyped Behaviors subscale and .94 for the total test.
Leiter International Performance Scale
Leiter International Performance Scale–Revised (Leiter-R) is a measure of nonverbal intellectual functioning (Roid & Miller, 1997). Six subtests from the visualization and reasoning battery (figure ground, design analogies, form completion, sequential order, repeated patterns, and paper folding) were used to attain a full nonverbal IQ score (M = 100 ± 15). This instrument has a reliability ranging from .91 to .93.
Peabody Picture Vocabulary Test
Peabody Picture Vocabulary Test–Fourth Edition (PPVT-4) is a 228-item, norm-referenced instrument, that measures receptive vocabulary by requiring discrimination of one target from an array of four pictures (Dunn & Dunn, 2007). The following scores may be obtained when using the PPVT-4: age- and grade-based standard scores (M = 100, SD = 15), percentiles, normal curve equivalents (NCEs), stanines, age and grade equivalents, and growth scale value (GSV). The mean split-half reliability of the PPVT-4 is .94.
Stimulus over-selectivity testing materials
Laminated stimulus cards measuring 12 cm × 10 cm consisting of one black stimulus or two black stimuli on a white background were used. The same eight picture stimuli were used as in Kelly et al. (2015): clock, chicken, flower, hand, eye, pencil, mouse, and book. The compound stimuli (AB and CD) contained two of these stimuli (Figure 1A), while other cards presented the individual element stimuli and contained one of the pictures from the compound stimulus (Figure 1B).
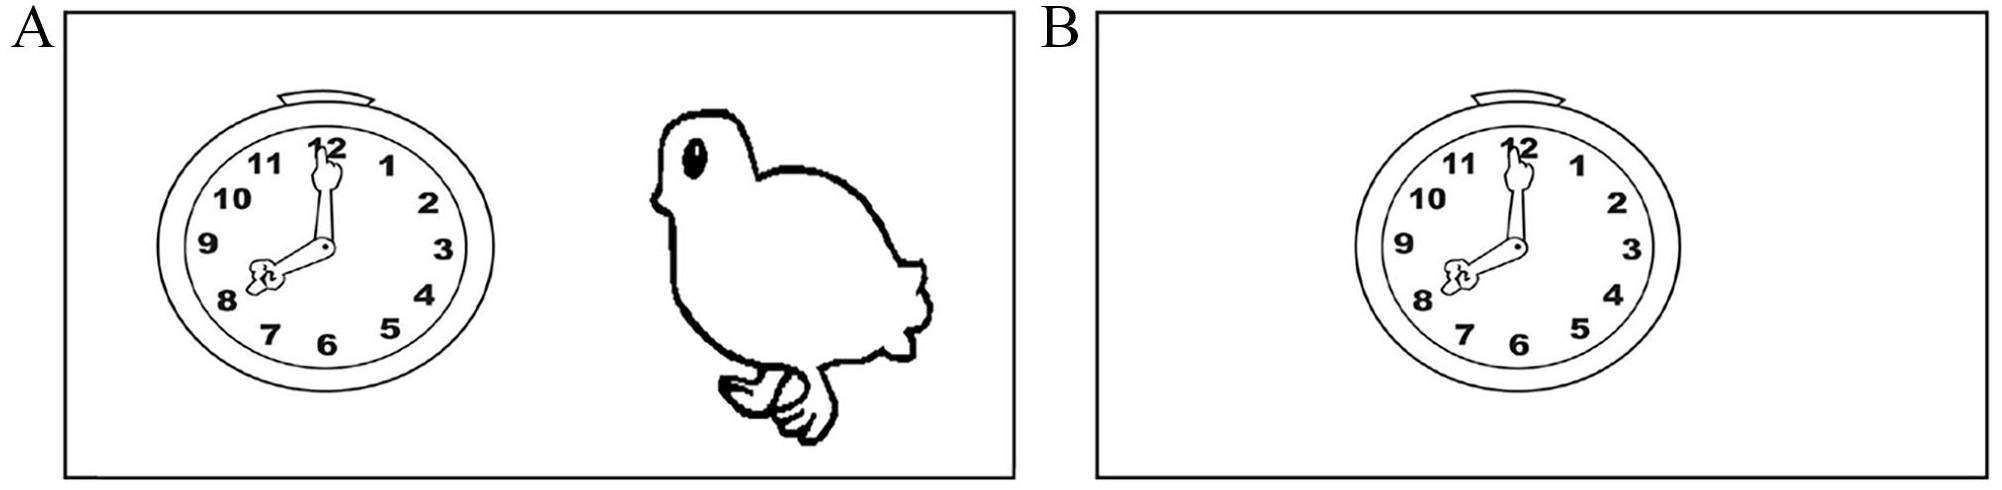
(A) Example of complex stimulus (AB). (B) Example of single element (B).
Intra-dimensional/Extra-dimensional Set Shifting Task
Intra-dimensional/Extra-dimensional set shifting task (ID/ED) is one of 22 neuropsychological tests in the Cambridge Neuropsychological Test Automated Battery (CANTAB) Eclipse (version 3.2) (Owen et al., 1991). The ID/ED set shifting task is a computer-based cognitive assessment that tests for rule acquisition and reversal. It features visual discrimination and attentional set formation and maintenance, and shifting and flexibility of attention. The two dependent variables utilized in this study were number of stages completed and number of adjusted errors.
Experimental Design
The current design involves both two-factor mixed-model quasi-experimental design, with group (ASD vs. control) as a between-subject factor and stimulus (most-selected vs. least-selected), as variables, along with age as a covariate. In addition, the ASD-only group will be subject to a cross-sectional study that investigates correlations between variables. Power analysis revealed that for a 2 × 2 mixed-model ANCOVA, a sample size of 24, testing at a rejection level of p < .05 and assuming a medium effect size, would give a power of around 70% (van Baardewijk, 2011), although for correlations involving the ASD only group, the power is around 40%.
Procedure
Parental and school consent was obtained for each participant. The study was conducted with the participant and experimenter (the first author) sitting at a table in a quiet classroom, free from distraction, in the participant’s own learning environment. The eight Leiter-R subtests, the PPVT-4, and the GARS-2 were all completed for the ASD group before any other testing. The Leiter-R and PPVT-4 were administered in the same session by the first author, and took approximately 1 hr, in total, to complete. The GARS-2 takes approximately 5 to 10 min to complete and was completed by the participants’ parents in a setting of their choosing. There were two experimental phases, measuring stimulus over-selectivity and flexibility, which were conducted within the same session, and took approximately 30 min in total to complete.
Stimulus over-selectivity
The participant and the experimenter (the first author) sat facing each other during the training and test phases, which were identical to those used by Kelly et al. (2015).
In the training phase, participants were presented with two white cards simultaneously, each containing two black stimulus elements (Figure 1A), with a vocal instruction to pick a card. Pointing at, for example, the card with the complex stimulus containing the components A and B (S±) was reinforced (“yes” with a smile), whereas pointing to the complex stimulus containing the components C and D (S−) was not reinforced (“no” with no smile). The combination of components on the S± (e.g., AB, AC, BC, or BD) was predetermined and randomized across participants. This was a control measure to avoid any potential confounding variables of some stimuli being intrinsically more salient than others. Participants reached criterion in the training phase once they chose the S ± 10 times consecutively within 200 discrimination trials.
In the test phase, participants were presented with two cards simultaneously, just as under training, but the stimuli consisted of only one stimulus element (Figure 1B). This yielded four combinations of S± and S− components: A versus C, A versus D, B versus C, and B versus D. Each combination was presented five times, thus yielding 20 test trials. No feedback (including reinforcement) was provided by the experimenter to the student during test trials.
Measure of cognitive flexibility
In the ID/ED set shifting task (Owen et al., 1991), four empty rectangles appear on the computer screen and each trial starts with two stimuli in separate opposing rectangles. The stimuli are novel abstract pink shapes or white line drawings. Individuals are instructed to select a stimulus, are given computer feedback (“correct” in green with high beep or “wrong” in red and lower beep) and must decipher the rule. This rule then changes after correctly selecting on six consecutive trials. To successfully complete the stage, individuals must make six consecutive correct selections in 50 trials. If an individual fails any stage, the task is ended (Yerys et al., 2009).
The task has nine stages. Stages 1 to 5 are discrimination stages where individuals must ignore distracting shapes and distinguish correctly between one of the two shapes throughout (Figure 2). Stages 6 and 7 introduce intra-dimensional shifting demands to apply the old rule to new stimuli. Stages 8 and 9 require extra-dimensional shifting because the individual must attend to a previously ignored feature of the stimulus (Yerys et al., 2009). The dependent variables measured in this study include the number of stages completed and number of the adjusted errors.
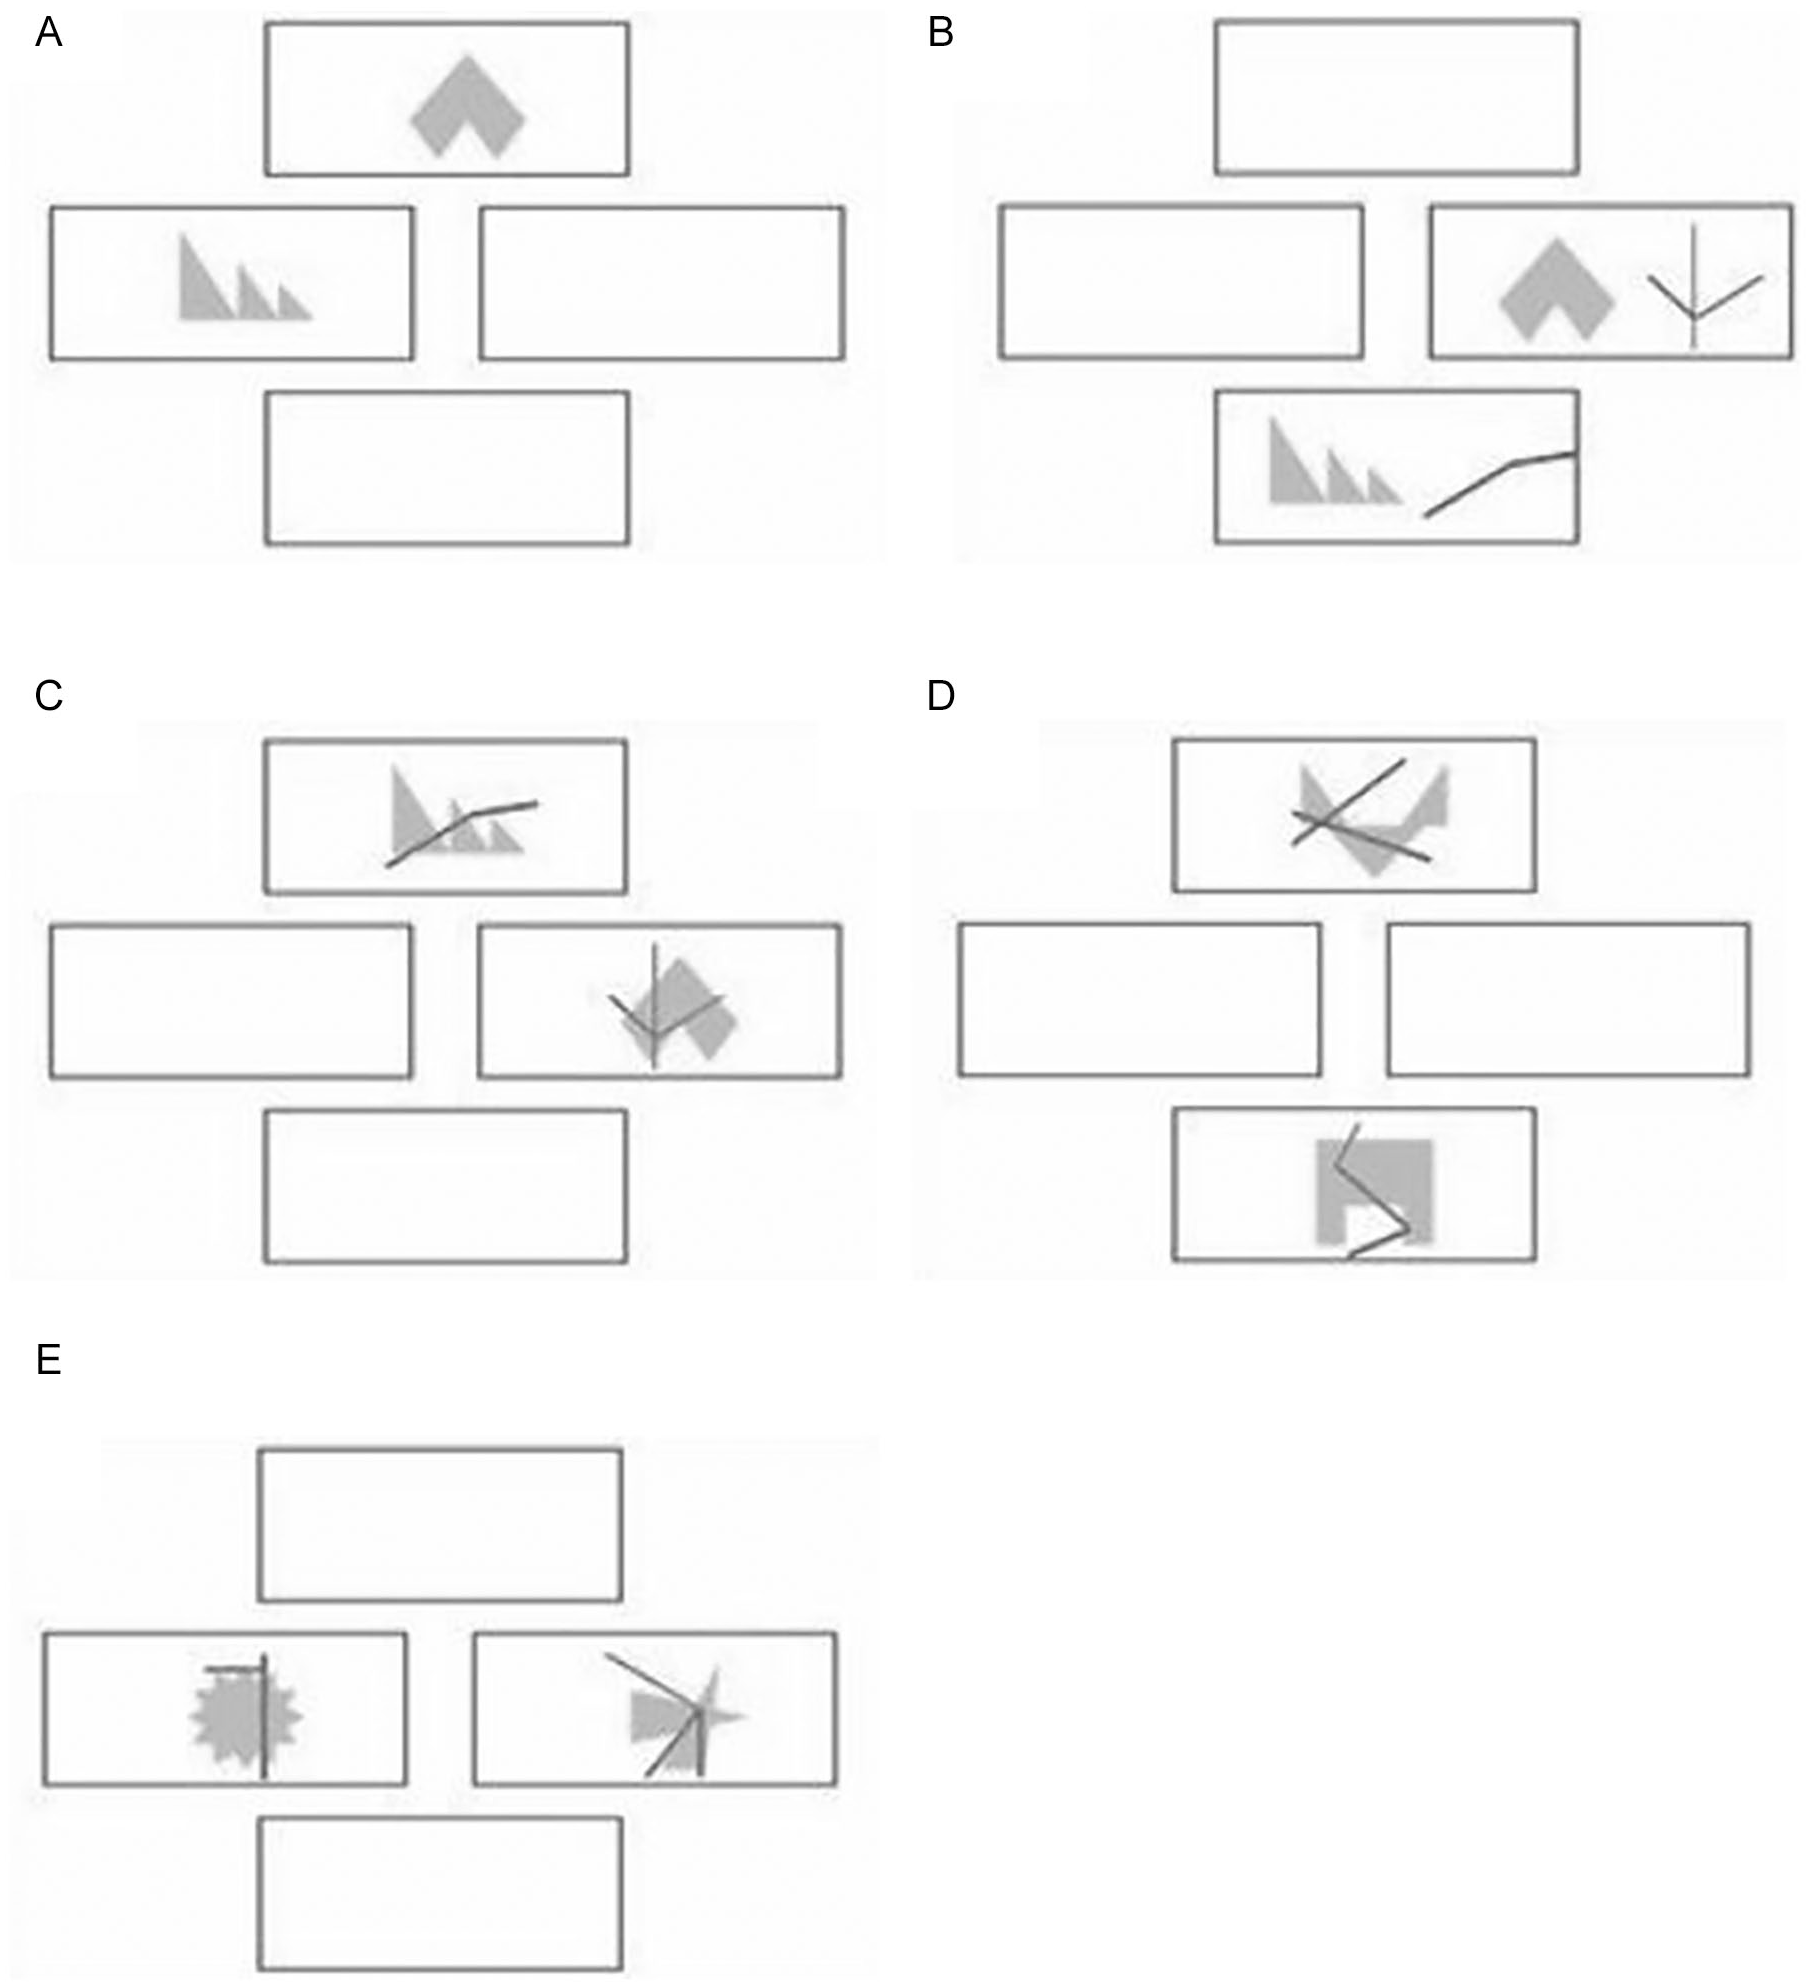
All nine stages of the intra-dimensional/extra-dimensional set shifting task. (A) Stimuli presented in Stages 1 and 2: simple discrimination. (B) Stimuli presented in Stage 3: Compound Discrimination 1. (C) Stimuli presented in Stages 4 and 5: Compound Discrimination 2 and compound reversal. (D) Stimuli presented in Stages 6 and 7: ID shift and reversal. (E) Stimuli presented in Stages 8 and 9: ED shift and reversal. (Yerys et al., 2009).
Results
Stimulus Over-Selectivity
All participants successfully completed the training phase. The ASD group took a mean 49.58 (±28.73) trials to choose the positive card 10 times consecutively. The comparison group took an average of 31.58 (±36.98) trials to reach criterion. A between-subject analysis of covariance (ANCOVA) was conducted on these data, with group as the between-subject factor, and chronological age a covariate (as this differed between the groups). The effect sizes, 95% confidence limits, and the relevant Bayes statistic for the significant or nonsignificant effect are also shown for this, and all subsequent, analyses. This analysis revealed that there was only a marginally significant statistical difference between the groups, F(1, 22) = 3.55, p = .073, = .018, 95% CI = [0.000, 0.069], p(H1/D) = .570.
Figure 3 shows the group mean results from the test phase of the experiment for both groups. The percentage times that each element from the previously reinforced compound (AB) was chosen at test were calculated and the percentage times that the most- and least-selected elements were chosen for each participant noted, irrespective of the actual physical nature of the stimulus (i.e., A or B). Inspection of these data shows that the difference between the most- and least-selected stimuli was greater for the ASD group, than for the comparison group.
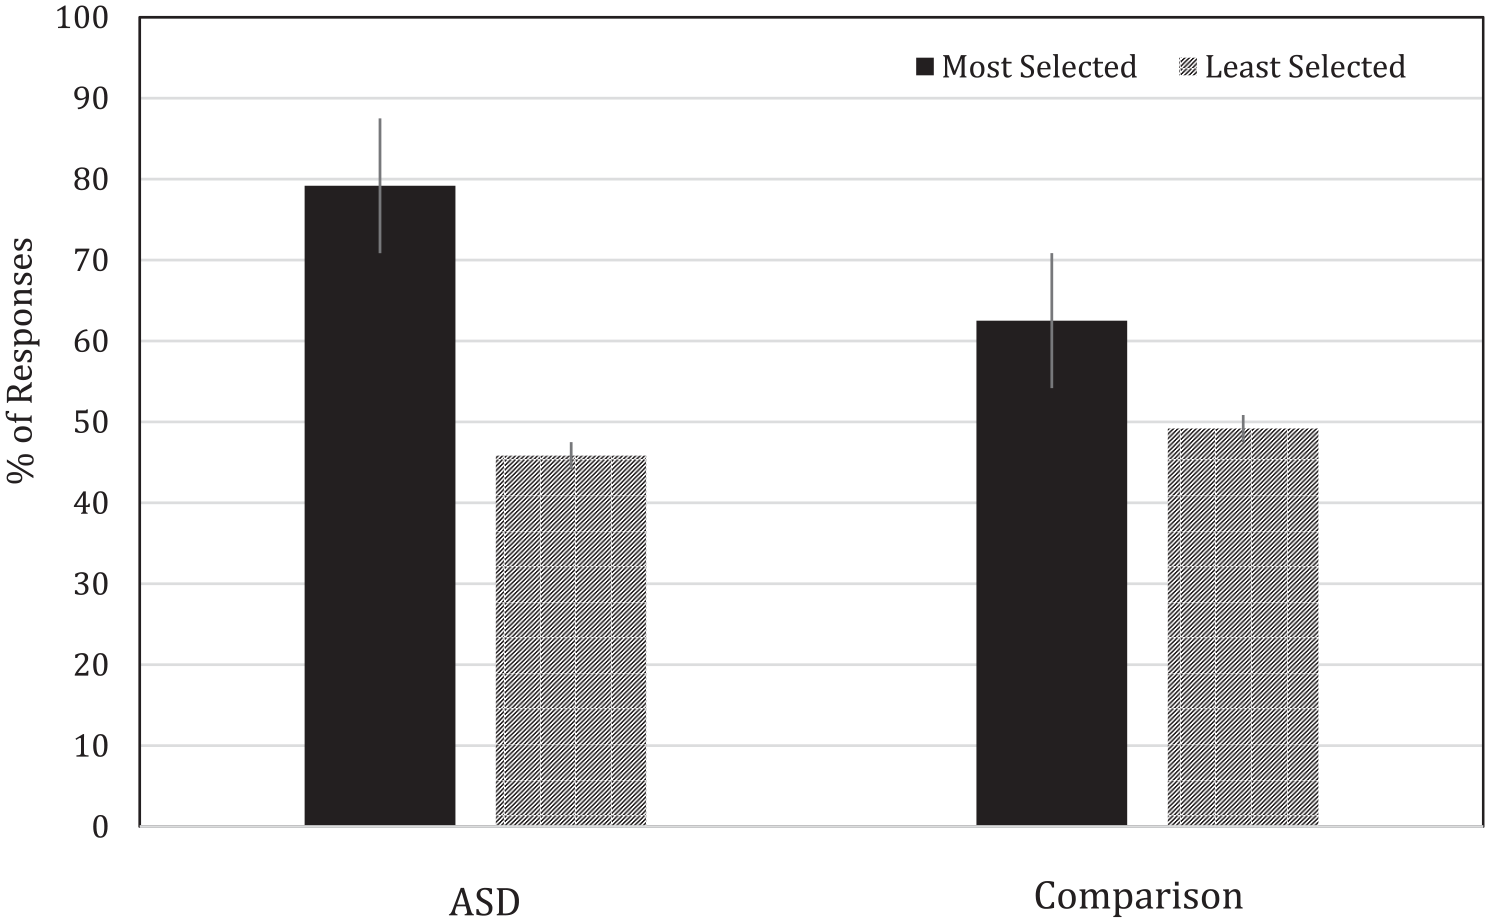
Mean percentage scores for the most and least selected elements for the ASD and comparison groups in the test phase.
A two-way, mixed-model ANCOVA, with stimulus type (most-selected vs. least-selected) as a within-subject factor, group (ASD vs. comparison) as a between-subject factor, and chronological age as a covariate, was employed. The ANCOVA revealed no significant main effect of group, F < 1, = .002, 95% CI = [0.000, 0.084], p(H0/D) = .819, but a significant main effect of stimulus type, F(1, 21) = 7.13, p < .05, = .254, 95% CI = [0.010, 0.496], p(H1/D) = .897, and a significant interaction between these two factors, F(1, 21) = 7.72, p < .05, = .269, 95% CI = [0.016, 0.509], p(H1/D) = .898. Simple effect analyses revealed a significant difference between the most- and least-selected stimuli for the ASD group, F(1, 21) = 7.26, p < .05, = .260, 95% CI = [0.016, 0.499], p(H1/D) = .904, but not for the comparison group, F(1, 21) = 2.59, p = .198, = .110, 95% CI = [0.000, 0.361], p(H0/D) = .557.
The mean percentage difference between the most- and least-selected stimuli was calculated for both groups. There was a large mean difference between the most- and least-selected stimulus for the ASD group (33.33 ± 9.85), but a smaller mean difference for the comparison group (13.33 ± 6.51). A between-subject ANCOVA, with group as the between-subject factor and chronical age as the covariate, revealed that this difference was statistically significant, F(1, 21) = 7.72, p < .05, = .269, 95% CI = [0.016, 0.509], p(H1/D) = .853.
Applying Reynold and Reed’s (2011) criteria of the required most-to-least difference for statistical significance based on binomial theory, 12 (100%) of the ASD group, but only five (42%) of the comparison group demonstrated over-selective responding, χ2(1) = 9.88, p < .01, ϕ = .642.
Cognitive Flexibility
There was little difference between the groups in terms of their cognitive flexibility performance on the ID/ED shift task. The ASD group completed an average of 3.83 (±3.52; range = 0–8) tasks, and the comparison group completed an average of 5.00 (±3.19; range = 0–8) tasks. An ANCOVA with group as a between-subject factor and chronological age as a covariate, revealed no significant difference, F(1, 21) = 1.35, p = .257, = .060, 95% CI = [0.000, 0.300], p(H0/D) = .707. One participant from each group successfully completed Stage 8 (extra-dimensional shift), χ2(1) = 0, p > .30, ϕ = 0; six participants from the ASD group and seven from the comparison group completed Stage 6 or 7 (intra-dimensional shift), χ2(1) = .168, p > .30, ϕ = .084; and three from the ASD group and two from the comparison group failed to pass Stage 1, χ2(1) = .253, p > .30, ϕ = .103.
The ASD group made an average of 144.50 (±75.99; range = 48–222) adjusted errors on the ID/ED task, the comparison group made an average of 117.25 (±73.93; range = 55–233) errors, and an ANCOVA (as above) revealed no significance difference, F(1, 21) = 1.21, p = .268, = .055, 95% CI = [0.000, 0.291], p(H0/D) = .710.
The stage reached was not significantly related (Pearson correlation) to the level of over-selectivity (determined by using the most- vs. least-difference for each participant) for the sample as a whole, r = −.223, p = .296. The adjusted errors were not significantly related (Pearson correlation) to the level of over-selectivity (most- vs. least-difference) for the sample as a whole, r = .255, p = .229.
Relationship of Predictors to Over-Selectivity for Participants With ASD
A correlation analysis was conducted to analyze the relationship between over-selectivity (difference between percentage most and least selected stimulus chosen) and IQ, ASD stereotyped behavior (GARS-2), ID/ED stages completed, and ID/ED adjusted errors, for those participants with ASD. Table 1 show that there were statistically significant correlations between stimulus over-selectivity and IQ, and stereotyped behaviors, but not with either of the measures of cognitive flexibility. When the influence of the other three predictor variables was accounted for using semi-partial correlations, only the relationship between stereotyped behavior and over-selective responding, rsp = .375, p < .05, remained significant; IQ: rsp = −.174, p = .348; total stages: rsp = .233, p = .220; and adjusted errors: rsp = .263, p = .173.
Discussion
The aims of this study were to understand further the processes responsible for over-selectivity by exploring its relationship with two potentially important variables for ASD, stereotyped behavior and cognitive flexibility. Over-selectivity was noted in a sample with ASD using the current simple visual discrimination task. This finding replicated those reported by Kelly et al. (2015), Leader et al. (2009), and Reed et al. (2009). Of the two variables of interest, stereotypy, but not cognitive flexibility, was associated with levels of over-selectivity.
This study revealed a statistically significant correlation with a large effect size between stereotyped behavior and over-selectivity, which was the only correlation to remain significant after controlling for the other potential predictors. Ploog (2010) offers an account, which may explain this relationship. According to Ploog (2010), a child might see a preferred toy only during a break time at school. If the child over-selects, and only attends to the toy, without attending to other stimuli that define the context (such as the time allowed to play with the toy), the contingencies may appear arbitrary to the child. Sometimes the child is encouraged to play with the toy and other times the child reprimanded for attempting to do so.
Under these circumstances, where there is unpredictable access to external reinforcers, internal reinforcers (accessed from stereotyped behavior, such as flapping hands or spinning objects), can be predictably produced by the individual and, thus, come to control the individual’s behavior. Specifically, stereotyped behavior, where internal reinforcers control behavior, and over-selectivity, where behavior is controlled by a limited subset of the cues available, are reliably associated in individuals with ASD. Although this result supports the hypothesis that over-selectivity is associated with stereotypy (Ploog, 2010), further research is required with alternative assessments of stereotyped behavior as well as autism severity such as the Autism Behavior Checklist (Krug et al., 1980) and the Autism Diagnostic Observation Schedule–Second Edition (ADOS-2; Lord et al., 2012). In addition, further research should recruit a larger sample to explore the suggestion that over-selectivity is associated with stereotypy given that such behavior can potentially complicate instruction to a very high degree.
In terms of cognitive flexibility, while the comparison group numerically completed more stages, and emitted fewer adjusted errors, than the ASD group, these differences were not reliable. This replicates the findings of Corbett et al. (2009). Furthermore, the correlation analysis revealed that neither of the ID/ED dependent variables were significantly associated with levels of over-selectivity in both the comparison and ASD groups. This result indicates that over-selective responding is not related to the level of cognitive flexibility, a finding that supports those of Kelly et al. (2016). Similarly, the failure to find a relationship to systematizing (Reed, 2017) is consistent with these findings, if systematizing reflects the same cognitive dimensions as cognitive flexibility—that is executive functioning.
Executive dysfunction has been posited to underlie many of the key characteristics of ASD (Hill, 2004). Research has demonstrated that individuals with ASD show significant deficits in the formulation of rules and perseverative tendencies (McEvoy et al., 1993; Ozonoff et al., 1991; Reed et al., 2013; Rumsey, 1985). Despite the potential link between cognitive flexibility and RRBs (Geurts et al., 2009), research has not yet shown a consistent relationship between these two variables (Albein-Urios et al., 2018).
One possibility for the lack of significant correlations between cognitive flexibility and over-selectivity in this study is the limited sample size. Only one test of cognitive flexibility was employed and therefore, it is also possible that the results of this study may be limited to only the ID/ED set shifing task and not to cognitive flexibility in general. Another issue may be the use of the laboratory-based neurocognitive task, the ID/ED and its inherent limitations including the broad range of cognitive abilities required to complete the actual task (Albein-Urios et al., 2018). The association between over-selectivity and alternative measures, such as mechanistic tasks (Geurts et al., 2009), or behavioral measures of executive function, such as the Behavior Rating Inventory of Executive Function (BRIEF), should be explored (Albein-Urios et al., 2018; Granader et al., 2014; White et al., 2017). Further investigation is necessary with a larger population of individuals with ASD using behavioral self-reports, as they have recently been found to be a better index than neurocognitive measures to capture deficits in cognitive flexibility in ASD. However, the current result from using the ID/ED offers experimental evidence contradicting the hypothesis that over-selectivity is associated with inflexible behavior (Ploog, 2010).
It is noteworthy that neither of the variables measuring cognitive flexibility were significantly correlated with stereotyped behavior in the ASD group. This is in contrast to the finding noted by Yerys et al. (2009), who found a positive correlation between the number of repetitive behaviors and extra-dimensional reversal errors in individuals with ASD. Extra-dimensional shifting is required in Stages 8 and 9 of the ID/ED. However, in this study, only one participant from each group completed Stage 8 and no participant successfully completed Stage 9. Therefore, this correlation analysis between stereotypy and set shifting warrants further examination with a larger and varied sample to ensure that a greater number of participants are able to complete the final two stages.
Additional issues limiting the interpretation of the current results, include the gender imbalance across the two groups, where 100% (n = 12) of the ASD group but only 42% (n = 5) of the comparison group were male. Furthermore, the ASD group had a mean chronological age of 8:11 (years: months), compared with a chronological age of 4:1 in the comparison group. In this study, the participants in the comparison group were matched according to the PPVT mean age equivalent of the ASD group (4:1), and an ANCOVA was employed also to partial out the effect of chronological age. In future studies, participants should be matched, ideally, according to both chronological and mental age equivalent, as well as IQ, to ensure equivalence across experimental groups. Furthermore, despite the use of Bayes statistics to address the power issues, future research should recruit a larger sample size.
In summary, this study offered further evidence of the robustness of the over-selectivity phenomenon by replicating the effect in the current sample of individuals with ASD. This study aimed to conduct an exploratory analysis of the correlations between stimulus over-selectivity and two variables: stereotyped behavior and cognitive flexibility. Significant correlations between over-selectivity and IQ, and over-selectivity and ASD severity emerged, as well as the novel finding that over-selectivity and stereotyped behavior also correlated significantly. Results showed that over-selectivity did not correlate with cognitive flexibility in individuals with ASD.
Implications
The current findings, which noted stimulus over-selectivity in a sample with ASD, requires consideration when designing behavioral interventions for this clinical population. Specifically, when working with individuals with ASD, practitioners should note that over-selective responding may impede performance on visual discrimination tasks and remediation may be required so that individuals can respond to all important cues in the environment. Remediation procedures may include the following: prompt fading (e.g., Schreibman, 1975), multiple-cue training (Koegel & Schreibman, 1977), pretraining (Meisel, 1981), overtraining (e.g., Schreibman et al., 1977), differential observing responses (e.g., Dube & McIlvane, 1999), schedules of reinforcement (e.g., Reynolds & Reed, 2011), mindfulness (e.g., Reed, 2019), and punishment (e.g., McHugh & Reed, 2007).
In addition, the finding that over-selectivity and stereotyped behavior correlated significantly may have implications for practice. Given that individuals with ASD who engage in high rates of stereotyped behavior may selectively attend to their self-stimulatory behaviors, practitioners may need to suppress stereotypy before they observe an increase in correct responding and acquisition of discrimination skills in individuals with ASD.
Footnotes
Acknowledgements
The authors thank each of the participants and their families.
Declaration of Conflicting Interests
The author(s) declared no potential conflicts of interest with respect to the research, authorship, and/or publication of this article.
Funding
The author(s) disclosed receipt of the following financial support for the research, authorship, and/or publication of this article: Funding was received for this research from the Galway Doctoral Research Fellowship Scheme of the College of Arts, Social Sciences, and Celtic Studies, National University of Ireland, Galway.