
Abstract
The COVID-19 pandemic occasioned significant financial distress and uncertainty for many U.S. transit operators. In the face of this crisis, the federal government provided substantial supplemental operating support. To understand how this fiscal turmoil and relief have affected U.S. transit systems, we conducted two nationwide surveys of transit agency staff in 2020 and 2021-2022. While pandemic-induced financial shortfalls affected service in 2020, with capital projects delayed too, these effects became much more muted by 2021/2022. Most systems reported moderate to substantial increases in federal funding during the pandemic, more so than other funding categories. However, nearly half foresee financial shortfalls once federal relief funding expires. Agencies with higher pre-pandemic ridership and farebox recovery are particularly affected by fare revenue losses and more likely to anticipate shortfalls. In the near term, difficulty hiring and retaining front-line workers was a pressing concern, while very few had plans to maintain pandemic fare suspensions.
Introduction
The Coronavirus Disease 2019 (COVID-19) pandemic upended the public transit industry globally. U.S. transit ridership fell precipitously early on and, as of 2022, had only partially and unevenly recovered, with commuter-oriented lines and systems struggling the most. Consequently, fare revenues fell sharply, which hit systems with previously high farebox recovery ratios (the share of operating expenses covered by fares) hardest (Parker et al., 2021; TransitCenter, 2020b).
While all forms of travel declined at the onset of the pandemic, transit use was depressed much more than other means of transportation; ridership plummeted more sharply at the onset of the pandemic, and recovered far more slowly since then. Public transit systems in the U.S. lost from 50 to better than 90 percent of their riders early on (FTA, 2022). Despite the relaxation of most health-related restrictions by 2022 and the reopening of schools, businesses, and economic activities, transit ridership, in general, remained depressed. To make financial matters worse, many agencies suspended fare collection for the first three to nine months of the pandemic to limit passenger/operator interactions and reduce the likelihood of infection (EBP U.S., 2020).
The precipitous declines in patronage early in the pandemic followed a half-decade of gradually falling ridership, amidst gradually rising service. Passengers per transit vehicle service hour declined by 12.1 percent in the U.S. between 2014 and 2019 (Dickens, 2021)—years during which, unlike many prior transit ridership downturns, the U.S. experienced sustained economic growth. Bus services tended to lose substantially more riders than rail, with losses dating back longer as well, though both modes generally lost passengers on most systems. While suggested culprits for these pre-pandemic declines, such as increasing passenger concerns with safety and eroding service reliability contributed, research generally found that increased car access—both in the form of rapid uptake of ridehail services like Lyft and Uber and increased personal vehicle ownership—was principally responsible (Erhardt et al., 2022; Manville et al., 2018, 2023). During this pre-pandemic period, falling ridership meant falling fare revenues, while revenues from other federal, state, and local sources were generally robust amidst the booming economy. But the COVID-19 pandemic, at least initially, affected almost all facets of society and government, including the other regular funding sources for transit.
Amidst stay-at-home orders and layoffs, the spring 2020 economic slowdown threatened most tax revenue sources whose losses, collectively, imperiled the ability of many systems to continue operating. On top of this, expenses increased, due to pandemic-related costs of heightened cleaning, retrofitting vehicles to improve air filtration, shielding vehicle operators from passengers (APTA Cleaning and Disinfecting Vehicles and Facilities Technical Advisory Group, 2020), and overtime pay to workers substituting for other staff out sick. Just weeks into the pandemic, the TransitCenter (TransitCenter, 2020b) estimated the annual financial shortfall across U.S. transit agencies would total between $26 and $40 billion. The American Public Transportation Association (APTA) similarly predicted in a May 2020 report that transit agencies would experience, absent government rescue funding, $48.8 billion in revenue losses from April 2020 through the end of 2021 (EBP U.S., 2020).
In response to these financial crises, the federal government committed unprecedented public resources to support transit operations in three separate bills in a little over a year. According to transit agency leaders, these bills kept systems afloat and allowed them to avoid severe service and workforce cuts (Wasserman et al., 2022). In addition, after initial dips, most state and local tax revenue sources quickly bounced back over the second half of 2020 as the economy churned back to life (King et al., 2021, 2023). Despite initially dire predictions, through government intervention and macroeconomic forces, transit survived the pandemic.
Yet even with massive federal aid and the recovery of many revenue sources, the fiscal effects of the pandemic on transit agencies have lingered. Projections from 2022 foresaw a funding gap of $519 million in Fiscal Year 2024 for the Washington Metropolitan Area Transit Authority in the District of Columbia and a $236 million deficit in the same year for the Massachusetts Bay Transportation Authority in Boston (Blumgart, 2022).
Against this backdrop of crisis and halting recovery, this paper examines the fiscal past, present, and future of public transit systems in the U.S., with a focus on how the turmoil brought about by the pandemic has affected transit systems in myriad ways. To inform this research, we conducted two nationwide surveys of transit agency staff, in August, September, and October of 2020 (about six months into the pandemic) and again in November 2021 to January 2022 (about 21 months into the pandemic), to understand the fiscal and operational challenges they have faced and are facing as the pandemic has evolved, the strategies they have adopted to cope with these challenges, and their fiscal and operational plans for the future.
Context
Transit in the Pandemic
At the onset of the pandemic, transit ridership collapsed across the U.S. (and, indeed, around much of the globe) because of stay-at-home orders and fear of virus transmission while riding transit. Transit agencies quickly adopted various health-related measures, such as regular, intensive vehicle cleaning; improved ventilation and air filtration; masking requirements; blocking off some seats to allow for distancing; eliminating fares, fare enforcement, and/or cash transactions for ticket sales; enforcing social distancing through vehicle capacity restrictions and rear-door only boarding and alighting (to minimize contact with vehicle operators); and physical barriers between operators and passengers (Speroni et al., 2023). Many of these measures were later relaxed with increased understanding of the virus and how it spreads, but the capital and operating costs of maintaining some pandemic-related improvements and services have persisted on many systems.
Those who continued to ride public transit during the early periods of the pandemic were disproportionately poorer, women, and essential workers and less likely white or Asian (Paul & Taylor, 2022; TransitCenter, 2020c; Transit App, 2020), a shift that garnered elevated public and media attention amidst the racial reckoning following the murder of George Floyd in the spring of 2020. While ridership rebounded somewhat as the pandemic evolved, patronage remained well below pre-pandemic numbers on most systems in 2022. Overall transit ridership across U.S. transit agencies in the first quarter of 2022 hovered at around 54 percent of ridership in the fourth quarter of 2019 (Dickens, 2022a). Metropolitan areas with higher median household incomes, more college-educated residents, higher employment rates, and greater shares of Asian residents were more likely to have deeper losses in ridership than other areas (Qi et al., 2021). Commuter-oriented lines and systems, in particular, had steeper and more sustained ridership declines than other transit systems, given the increasing trend of remote and hybrid work during the pandemic (especially among higher–income workers and commuters) (Calvert & Vielkind, 2022). These ridership declines, along with fare suspensions by many agencies early in the pandemic, combined to cause huge losses in fare revenues during the pandemic’s first two years.
As agencies struggled with ridership, they also faced workforce challenges. Early on, illness and leave to care for sick loved ones kept many bus and rail operators from behind the wheel. But after a brief period when many transit operators struggled to avoid worker layoffs in the face of ridership collapse and associated service cutbacks, most U.S. transit systems since then have struggled to recruit and retain bus operators, train operators, and mechanics as the economy roared back to life in the second half of 2020 and into 2022. This labor shortage was exacerbated by hiring or wage freezes implemented earlier in the pandemic and wages either remaining stagnant or increasing slower than inflation and cost of living. Enforcing fare requirements and mask mandates by passengers has further added stresses for vehicle operators and may have motivated some to shift to jobs, such as truck driving, that do not require policing customer behaviors (Perrero, 2022; Van Eyken, 2022). Per a March 2022 APTA survey, 92 percent of agencies nationally reported having difficulty hiring, two-thirds are having difficulty retaining employees, and 71 percent have had to cut service or delay service increases as a result of workforce issues (Dickens, 2022b).
As a result of falling patronage, labor shortages, and associated financial shortfalls, almost all U.S. transit agencies operated service in 2022 below pre-pandemic levels (Dickens, 2022a). These service cuts most affected those with limited or no access to cars, who rely on transit for their day-to-day mobility needs and who are disproportionately low-income, immigrants, and people of color (Begley et al., 2022; He et al., 2022).
While some of the pandemic-induced repercussions for transit are likely short-lived, recent surveys and data from transit agencies suggest that depressed ridership may well endure (Dickens, 2022a; Parker et al., 2021; Shamshiripour et al., 2020). To adapt to a “new normal” of diminished and shifted rider demand, many transit agencies have begun to pursue various strategies to lure riders back, such as reducing, capping, or even eliminating fares; redesigning routes to reflect shifting patterns of demand; adjusting schedules and extending service during off-peak hours and weekends as traditional peak-period demand has shrunk; selling new two- or three-day-per-week passes targeted at people working hybrid schedules; and offering riders various perks and rewards (Bergal, 2022). While pandemic-induced declines in patronage and responses to them have been generally well-covered in the scholarly literature to date, the financial condition of the U.S. transit industry has received far less attention from researchers, and in particular how these conditions have evolved over the course of the pandemic.
Government Crisis Responses and Transit’s Outlook
To avert the financial collapse of public transit systems nationwide, the federal government committed unprecedented public resources to support transit systems large and small. The Coronavirus Aid, Relief, and Economic Security (CARES) Act, passed in March 2020 only weeks into the pandemic in the U.S., provided $25 billion for public transit systems (FTA, 2021a). This influx of funding prevented draconian cuts in service and personnel at most systems, but given the depth of early pandemic losses in fare revenue and other state and local funding and the increased costs associated with equipping vehicles and personnel for pandemic operations, many transit agencies quickly burned through their CARES funds. New York’s transit system expected to be out of CARES funding by the end of July 2020, and an analysis by the TransitCenter found that funding for the 10 largest U.S. transit agencies would only last roughly three to six months (though smaller agencies, which typically received proportionally more funding, would be able to hold out for longer) (TransitCenter, 2020a).
In late December 2020, Congress passed the Coronavirus Response and Relief Supplemental Appropriations (CRRSA) Act, which earmarked another $14 billion for transit (FTA, 2021b). This bill, which again largely prevented severe service cuts and layoffs at transit agencies, was intended by its legislative authors as reprieve but not an ongoing rescue (Bliss, 2020). The two 2020 federal relief bills alone provided financial support to U.S. transit systems equal to roughly half of all U.S. transit operating expenditures in 2018 (Mallett & Goldman, 2020). Less than three months later, the new Biden administration pushed through the American Rescue Plan (ARP) Act, which included an additional $31 billion for transit (USDOT, 2021; Wanek-Libman, 2021). So, in one year, the U.S. government provided public transit systems with nearly $70 billion in additional funding to cover pandemic-related revenue losses. These bills represented a sea change for federal transit funding: while the federal government has long provided primarily capital support for transit infrastructure projects, this substantial operational support was both new (save for some prior operating support for small and rural agencies) and deemed necessary during the pandemic.
Meanwhile, state and local revenue sources proved more resilient than was feared early on. For instance, revenue from local option sales taxes for transportation in California, a major source of transit operating and capital funding in the state, recovered relatively quickly after an initial drop. Supported by federal assistance to households, a general recovery of spending, especially for goods, and the taxation of online sales, these tax revenues strengthened in 2021 and exceeded pre-pandemic monthly receipts in 2022 (King et al., 2021, 2023).
Despite federal assistance and other funding sources rebounding, many transit agencies still face or anticipate a “fiscal cliff.” With office work slow to return in many central business districts, formerly high farebox-recovery systems (often larger, commuter, and/or rail operators) face the most substantial ongoing rider and fare revenue losses. Service cuts and fare increases have not proven sufficient to avert projected future losses at such agencies (Blumgart, 2022). So, while the substantial three-time federal assistance helped transit agencies to weather the initial and most profound crises early in the pandemic, financial uncertainties lie ahead. The $1.2 trillion federal infrastructure bill signed into law by President Biden in November 2021 provides substantial new funding for U.S. transit systems, but unlike the three federal pandemic relief bills, this new funding is primarily limited to capital improvements and cannot be used for operating support (Bergal, 2022).
Against this broad backdrop of traumatic changes and profound fiscal uncertainties for the transit industry, we know less about how challenges vary across the nation’s myriad transit systems, how the agencies have responded to them, and what they think lies ahead. Further, while the fiscal state of transit received popular and some scholarly attention during the tumultuous early days of the pandemic, we know far less about how transit systems are faring financially later in the pandemic. To paint this more nuanced picture of pandemic transit finance in the U.S., we turn now to our surveys of transit systems.
Methods
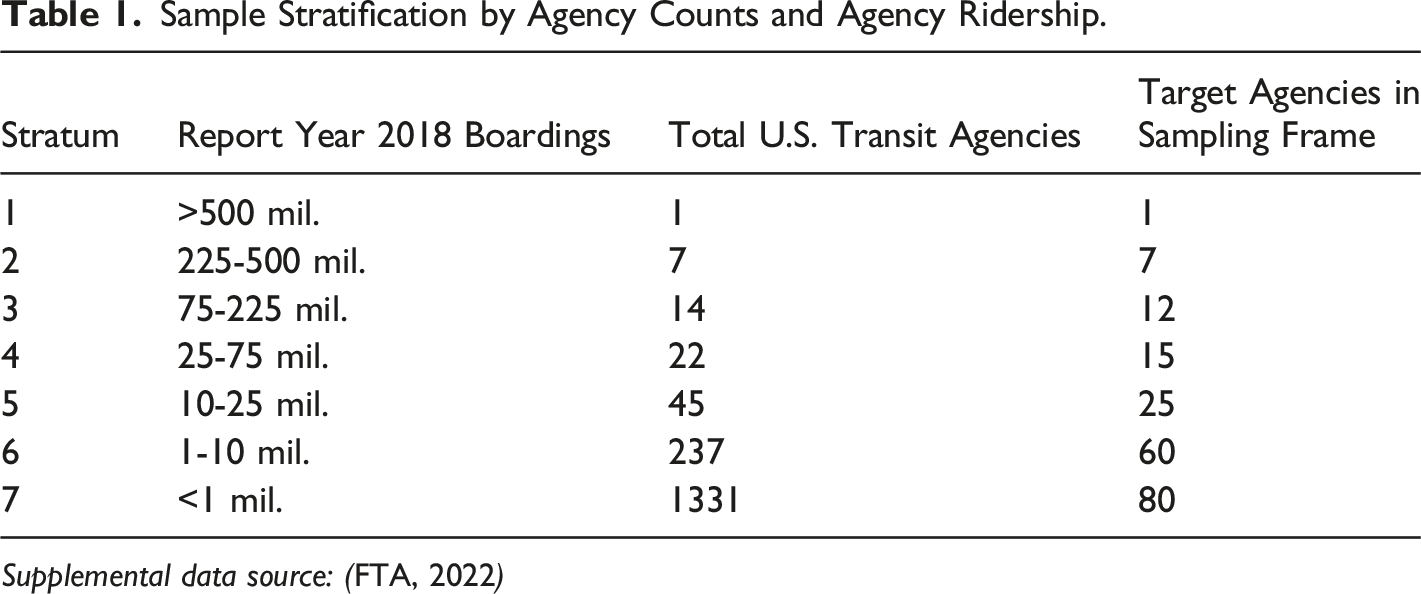
We conducted two national surveys of U.S. transit operators, the first in the late summer and early fall of 2020 and the second in the winter of 2021–2022 —representing, to our knowledge, the only multi-wave financial survey of transit operators during the pandemic. We created a stratified random sample of 200 transit agencies in the U.S., drawn from the Federal Transit Administration’s (FTA’s) National Transit Database (NTD). We selected these 200 agencies from the 1657 standard general public transit operators in the NTD (excluding private providers, tribes, universities, agencies on aging, and assets) in the then-most-recent year of data (Report Year 2018). From these, we delineated a sampling frame using a random number generator that fit both of the following criteria (subject to rounding): 1. We selected agencies to address the asymmetry between agency numbers and boardings. In the full NTD dataset, the smallest 80 percent of agencies accounted for just two percent of boardings, while the largest eight agencies accounted for nearly 60 percent of boardings. Thus, to ensure both small agencies (of which there are many) and their boardings (of which there are few) as well as large agencies (few) and their riders (many) were represented in the survey, we divided the agencies into seven strata by a combination of numbers of agencies and boardings (See Table 1). Our goal in stratifying our sampling frame in this way was to ensure agencies of all sizes were represented in the survey and to avoid the likelihood that the few large agencies might have been crowded out by the many small agencies. 2. The sampling frame was also stratified geographically by FTA region. But just as boardings are asymmetrically distributed across agencies, so too are agencies and boardings asymmetrically distributed across regions. To again achieve a balance, we created a score for each region, three-fourths of which was the region’s share of all U.S. agencies and one-fourth of which was the region’s share of U.S. transit boardings. We selected the sampling frame such that the number of selected agencies from each region was proportionate to that score. Sample Stratification by Agency Counts and Agency Ridership.
Supplemental data source: (
FTA, 2022
)
Given the huge asymmetry in ridership between the nation’s largest and smallest operators, as well as geographic differences, the aim of this procedure was to create a sample representative of both U.S. transit ridership and U.S. transit systems, to a fair degree each.
We identified staff contacts at each of these agencies from online searches of agency websites, employee directories, and documents; from APTA and other industry contact lists; and from communications with staff themselves. Where available, we sent the survey to planning, finance, and operations staff at each agency, as identified by job title; for smaller agencies or those with less information available online, we sent the survey to general management. We invited each of the identified staff to fill out the survey themselves or to collaborate with or send it to others in their agency with the best knowledge of the issues asked about in it, allowing only one response per agency. The first wave of this survey, which focused on the onset of the pandemic and transit agency responses to it, was open from August 2020 through early October of 2020. The second wave of the survey, which focused more explicitly on financial issues, was open from November 2021 to January 2022. Respondents were eligible to receive a gift card for completing the survey. In both surveys, we coincidentally received 56 responses out of 200 solicitations (See Figure 1), for a response rate of 28 percent. As not all submitted surveys contained responses to all of the questions posed, we note the total number of respondents for each question in the results section. Responding Agencies. Supplemental data source: (Hudson, 2017).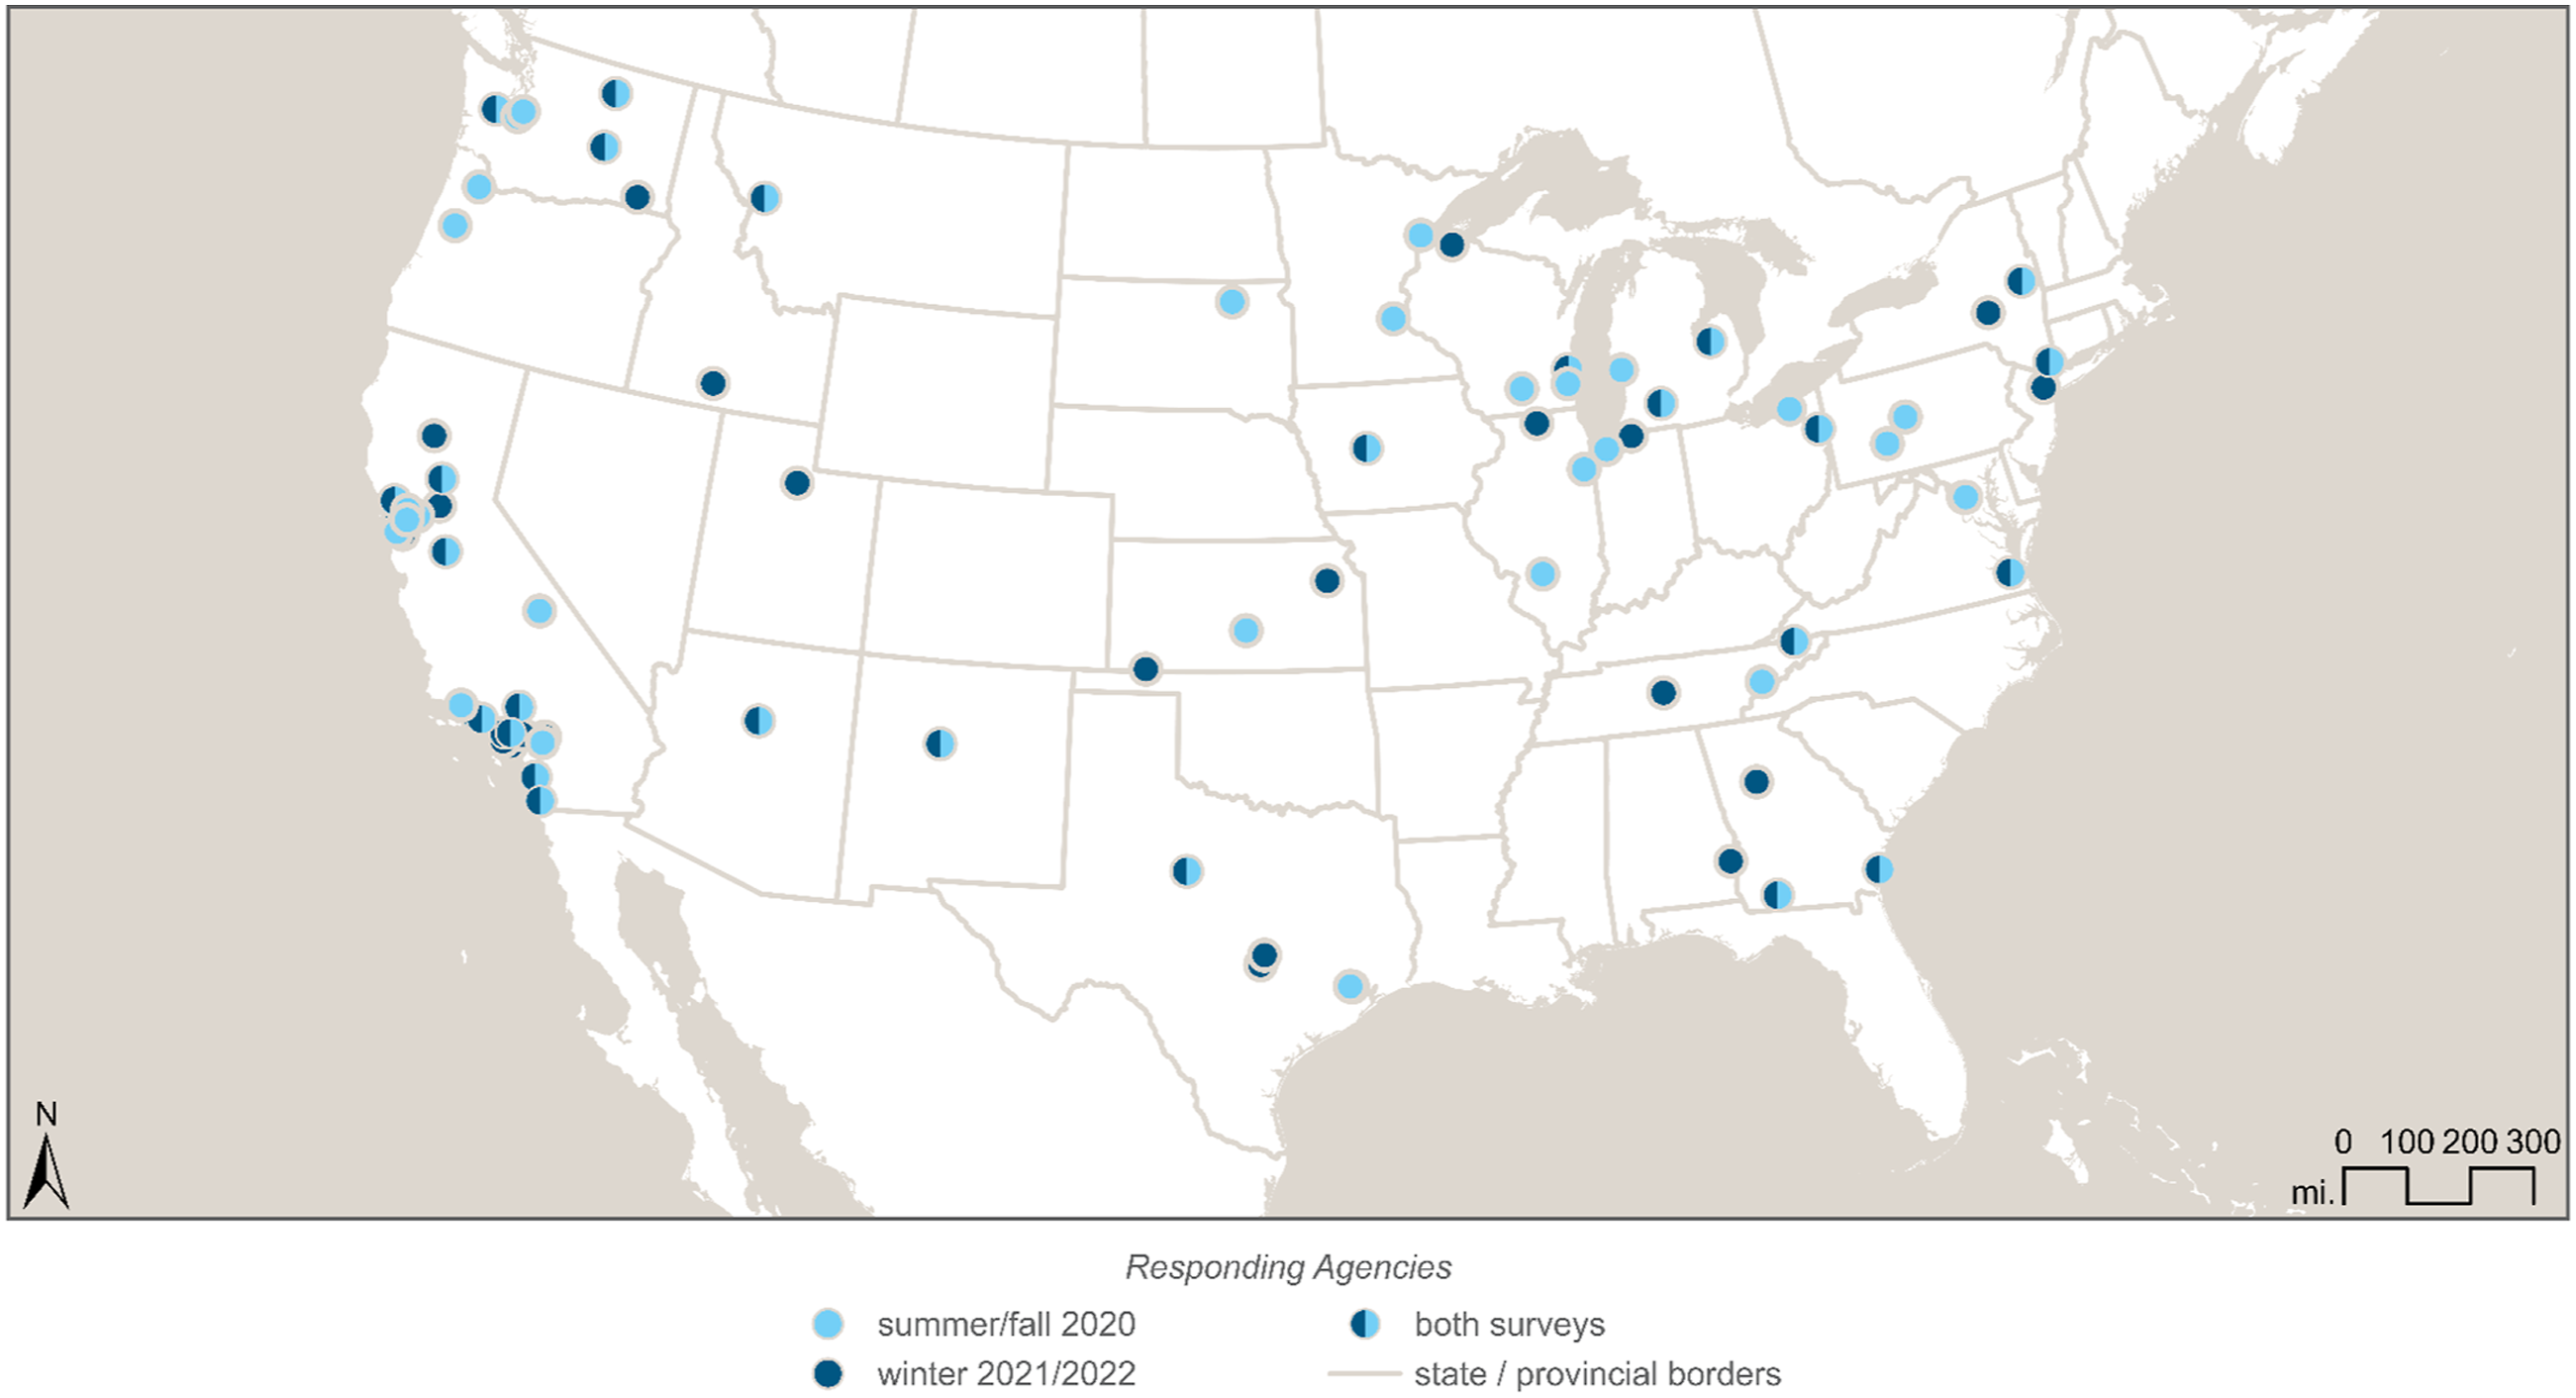
The first wave of the survey covered a wide array of topics, including service planning, operations, labor, public health, equity, performance measurements and crowding data, and communications (See Speroni et al. (2023) for more on the non-finance findings from this first wave). In the second wave, the questionnaire asked about ways the pandemic affected agency finances, fare revenues and policies, and longer-term planning, as well as changes to transit service and operations made because of the pandemic’s budgetary effects or with implications for agency budgets.
We compare the findings of the two waves of the survey through a repeated cross-sectional comparison—samples from the population of transit agencies at two periods of time—and a longitudinal comparison for the 29 agencies that responded to both iterations of the survey. In these two ways, we compare summer/fall 2020 to fall 2021/winter 2022, two very different points in the pandemic.
We examine how the repercussions of the pandemic varied across systems with respect to their pre-pandemic ridership, farebox recovery ratios, and the modes they operate. In order to do so, we complement our survey results with additional data from the NTD on boardings, fares, and operating expenses (FTA, 2022). We also use the data from our survey to analyze patterns by the modes of transit service operated by agencies. We only note our findings by mode, ridership, and farebox recovery for select survey questions where warranted. Across the two samples, a similar share of agencies operate each mode: 20 percent in 2020 and 18 percent in 2021/2022 operated rail, 96 percent in 2020 and in 2021/2022 operated buses, and 80 percent in 2020 and 86 percent in 2021/2022 operated paratransit.
Finally, while we sought a representative sample for our two survey waves, we cannot be certain that our results accurately reflect the experiences at all U.S. transit agencies. For example, it is possible that staff at agencies experiencing more pandemic-induced change might have been more likely to complete our surveys than those whose operations were affected less. On the other hand, it may be that staff at agencies struggling more with the effects of the pandemic might be less likely to respond, even if anonymously, out of a reluctance to dwell on their agency’s struggles or a lack of available time to respond. In addition, it could be that those who did respond were more likely to portray an overly positive situation and outlook for their agency. As the history of cost forecasting of transit projects by industry professionals shows, any attempt to predict the fiscal future of transit needs to tread carefully (Flyvbjerg et al., 2002). Nonetheless, those working with transit budgets daily have a particularly acute sense of their systems’ strengths, weaknesses, and needs, and surveying them about topics such as their plans for future operating expenditures, capital investments, fare policies, and the like can reveal coming trends in ways that budget documents cannot. Lastly, we received a greater share of surveys answered in California than elsewhere, potentially due to the existing connections between our California-based research team and the state’s transit agencies or to those agencies’ staffs’ greater propensity to respond to a survey from an in-state university.
Results
Financial Effects of the Pandemic on Service and Capital Projects
Service Responses
As press reports and literature discussed above would suggest, the pandemic had a substantial effect on the service provided by many of the agencies in our survey sample. In our later 2021/2022 survey, about half (49%) of responding agencies reported that their service in November 2021, well over a year and a half into the pandemic, was still somewhat or significantly lower than prior to the pandemic (n = 45).
Faced with numerous pandemic challenges, transit operators reported adjusting their service patterns more often and more substantially than before the pandemic. Thirty-six percent of agencies in our 2021/2022 survey modified their service much more frequently since the onset of the pandemic, and another 36 percent reported adjusting service somewhat more frequently (n = 45). In terms of the magnitude of those service changes, 31 percent of agencies responded that the pandemic made those adjustments substantially larger in scale; 40 percent reported that the pandemic affected the scale of their service changes to some extent (n = 45).
To adapt to changing rider demand, labor shortages, and financial shortfalls, transit operators adopted various strategies, such as adjusting off-peak weekday service hours both up and down, adding capacity through new contracted services, expanding or contracting geographic service area coverage, increasing or decreasing service headways, eliminating and/or consolidating lines/routes, changing peak-hour weekday service hours, and moving to traditional Saturday or Sunday service on all days. Among these, changing service headways/frequency, peak-hour weekday service hours, and off-peak weekday service hours were the most common strategies adopted by the agencies, with 59 percent, 57 percent, and 52 percent of agencies doing each, respectively, at some point during the pandemic (n = 44) (See Figure 2). Pandemic Service Responses, Either Current or Rescinded, Fall 2021/Winter 2022. Note: Respondents that skipped the question are excluded.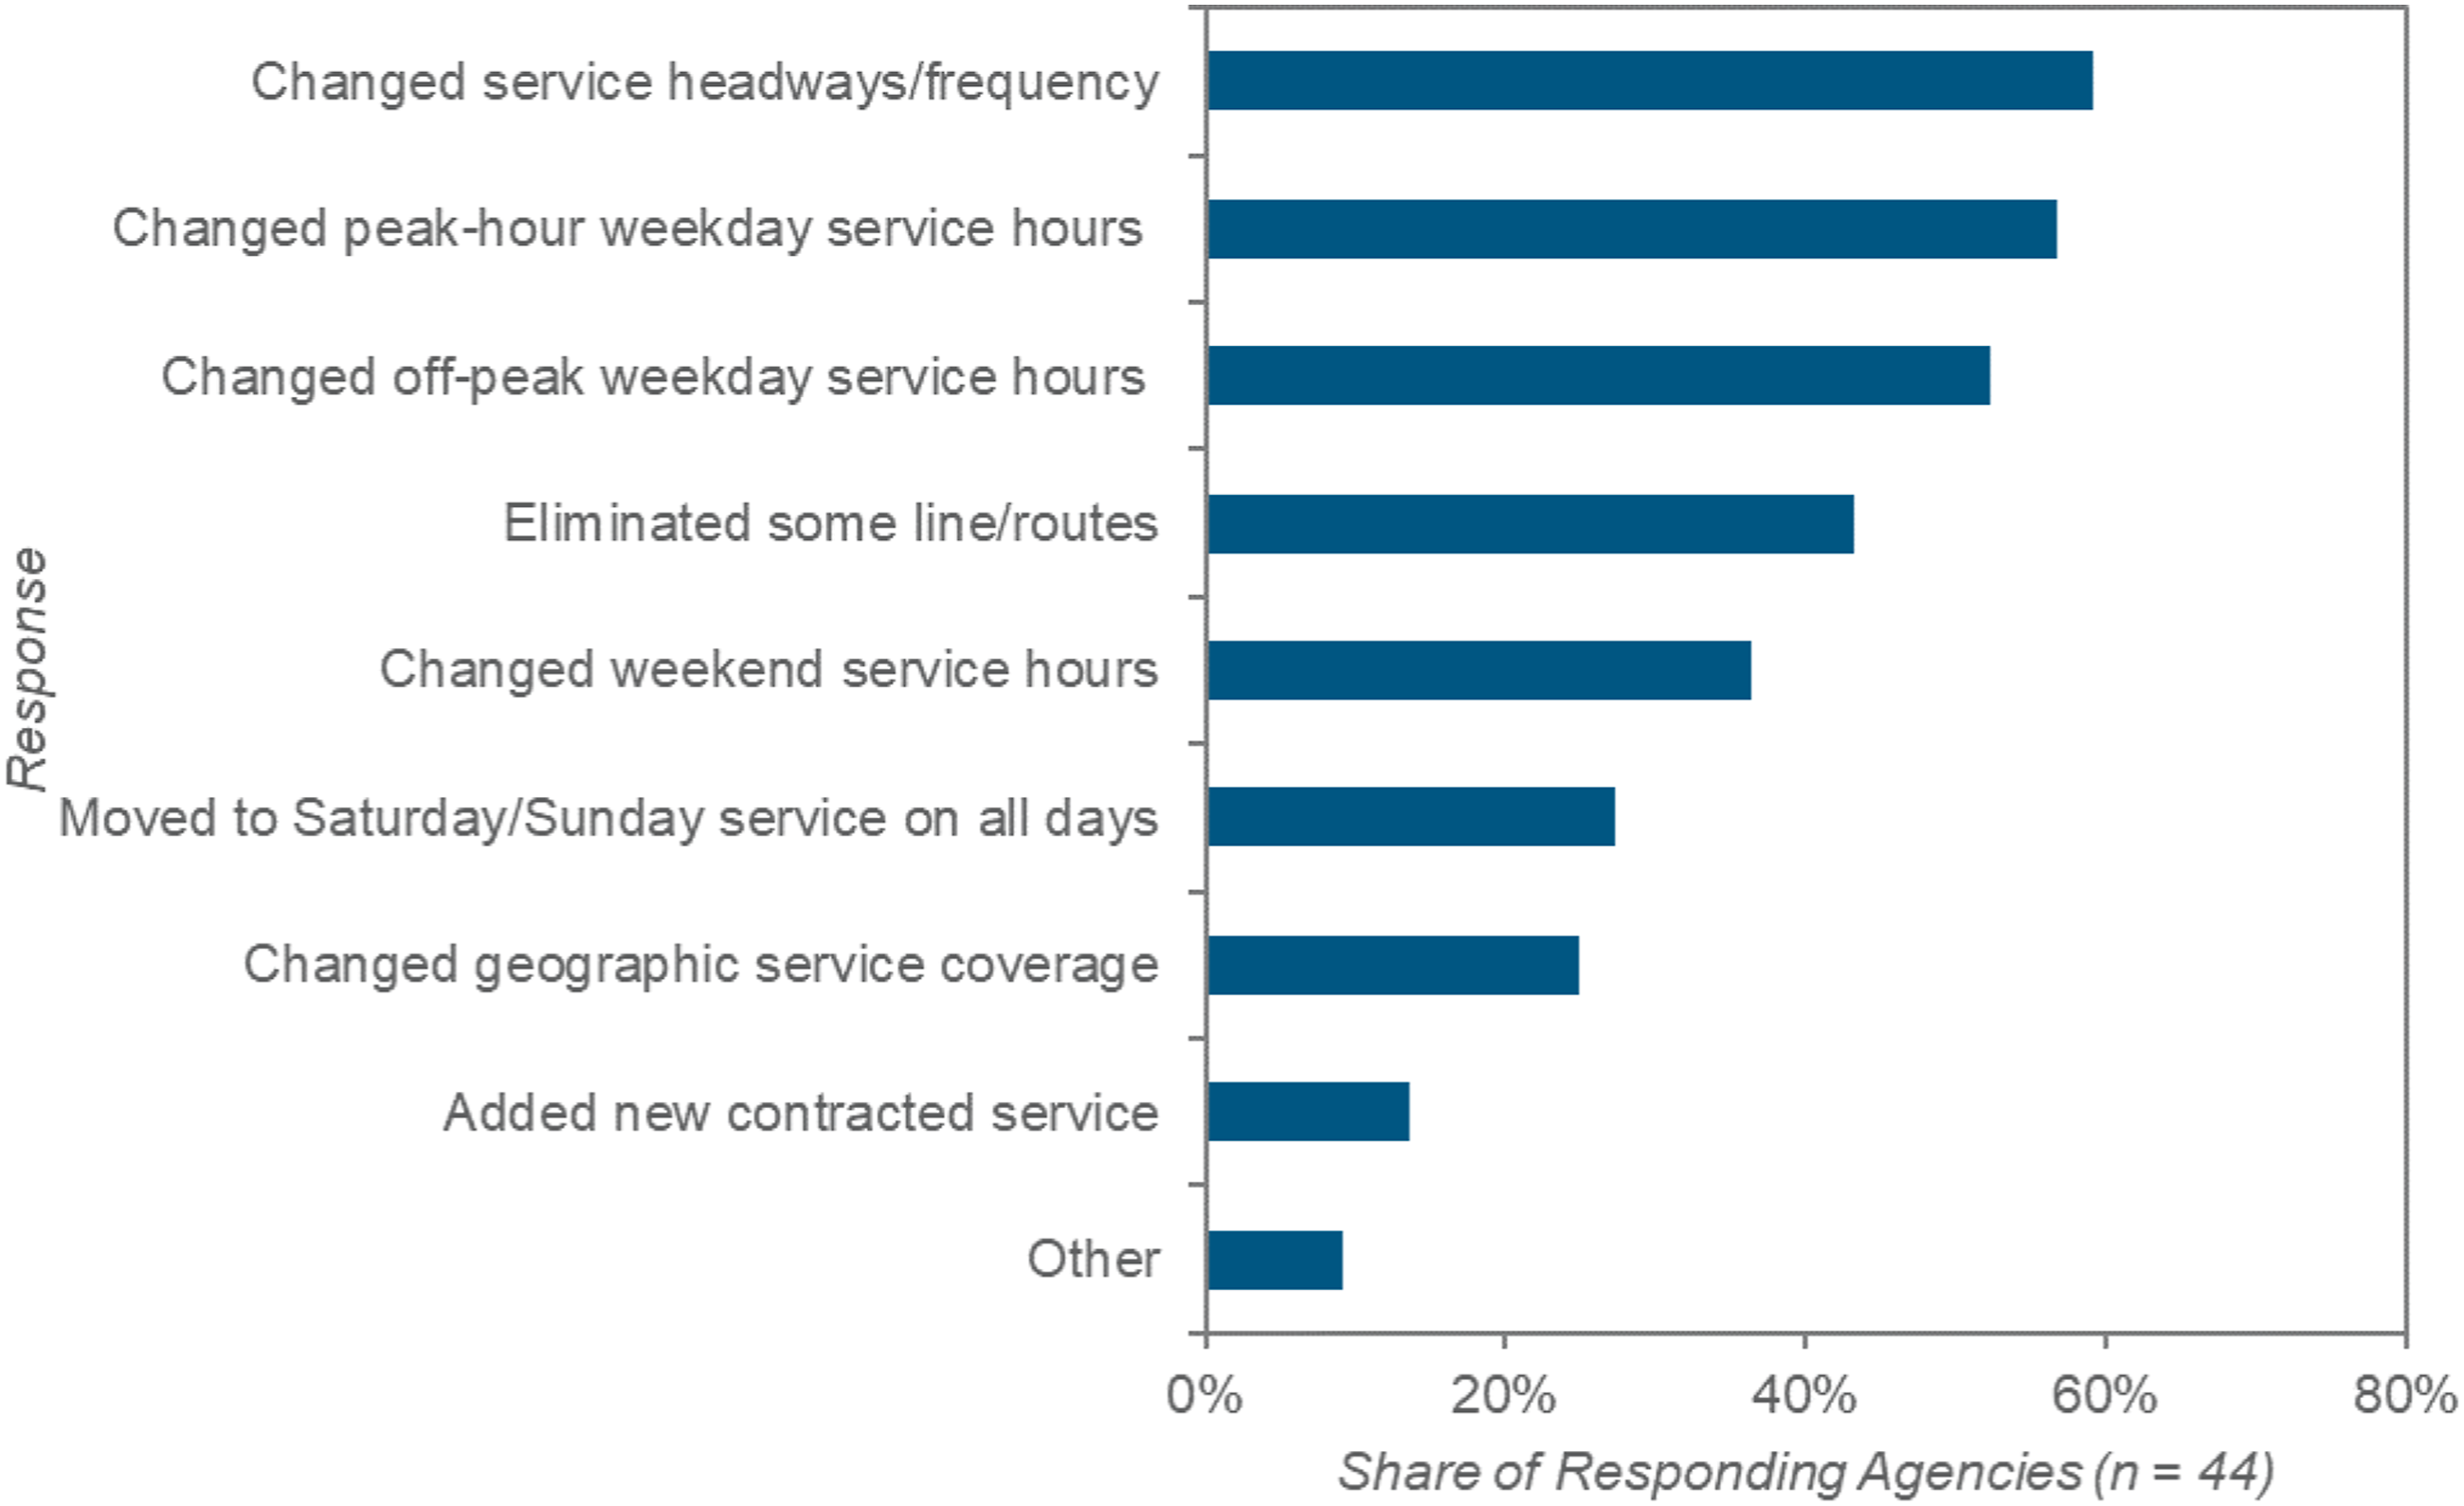
However, most respondents (58%) told us that they did not anticipate that many of these various service changes would be permanent (n = 45). Those that did enact permanent service changes reported doing so mostly in response to longer-lasting shifts in passenger demand.
Service Changes No Longer Driven by Finances
To what degree were all these service changes driven by financial exigencies? Of course, completely untangling related issues like labor and public health from finance is impossible, but we found a marked shift in the degree to which budgets steered transit service decisions as the pandemic wore on. In our earlier 2020 survey, nearly half of the responding agencies told us that financial shortfalls were affecting their service, with 21 percent reporting that service was affected more than a moderate amount (n = 56). With ridership still near nadirs due to business closures, fear of infection, and public health orders, agencies were still grappling with sharp declines in fare revenue at the time of the first survey. At that moment, only one of the three federal stimulus bills had passed, and the degree to which subsidies from other levels of government would recover was not yet clear.
Enduring changes in service, though, were decreasingly a result of agency finances by late 2021/early 2022. By the time of our second survey, only one in five respondents reported that their services were being affected by financial shortfalls (n = 47). A longitudinal comparison of responses from agencies that completed both surveys offers similar insights: 41 percent saw their service affected by financial shortfalls in 2020, compared to just 10 percent in 2021/2022. Though labor issues (discussed below), continued illnesses, supply chain problems, and more caused transit policymakers to cut or adjust service in 2022 (Wasserman et al., 2022), severe budgetary constraints were no longer a primary factor.
The effects of financial shortfalls on agencies’ services varied based on agency characteristics. Systems with higher pre-pandemic farebox recovery ratios reported service being particularly affected by agency finances. The agencies that responded that financial shortfalls were affecting their current services “a great deal” in our fall 2021/winter 2022 survey had an average pre-pandemic farebox recovery ratio of 32 percent, while agencies whose services were not affected by financial shortfalls had average pre-pandemic farebox ratios of just 12 percent.
Capital Projects
As with operations, transit capital projects likewise bore the financial and logistical effects of the pandemic early on but saw these lessen over time. In our 2020 survey, about half of respondents had capital projects delayed due to the pandemic (n = 49), while by fall 2021/winter 2022, that figure had dropped to three in ten (n = 45). A much larger share of agencies in the fall 2021/winter 2022 survey told us that their capital projects have either been unaffected (49%) or were even accelerated (18%) (See Figure 3). This pattern did not vary by the modes the agencies operate. Forty-seven percent of agencies that operate buses (n = 43), 43 percent of agencies that operate rail (n = 7), and 54 percent of agencies that operate paratransit (n = 39) in our 2021/2022 sample reported their capital projects to be unaffected. Has the Pandemic Affected Longer-term Capital Planning? Repeated Cross-sectional Comparison. Note: Respondents each year that skipped the question are excluded.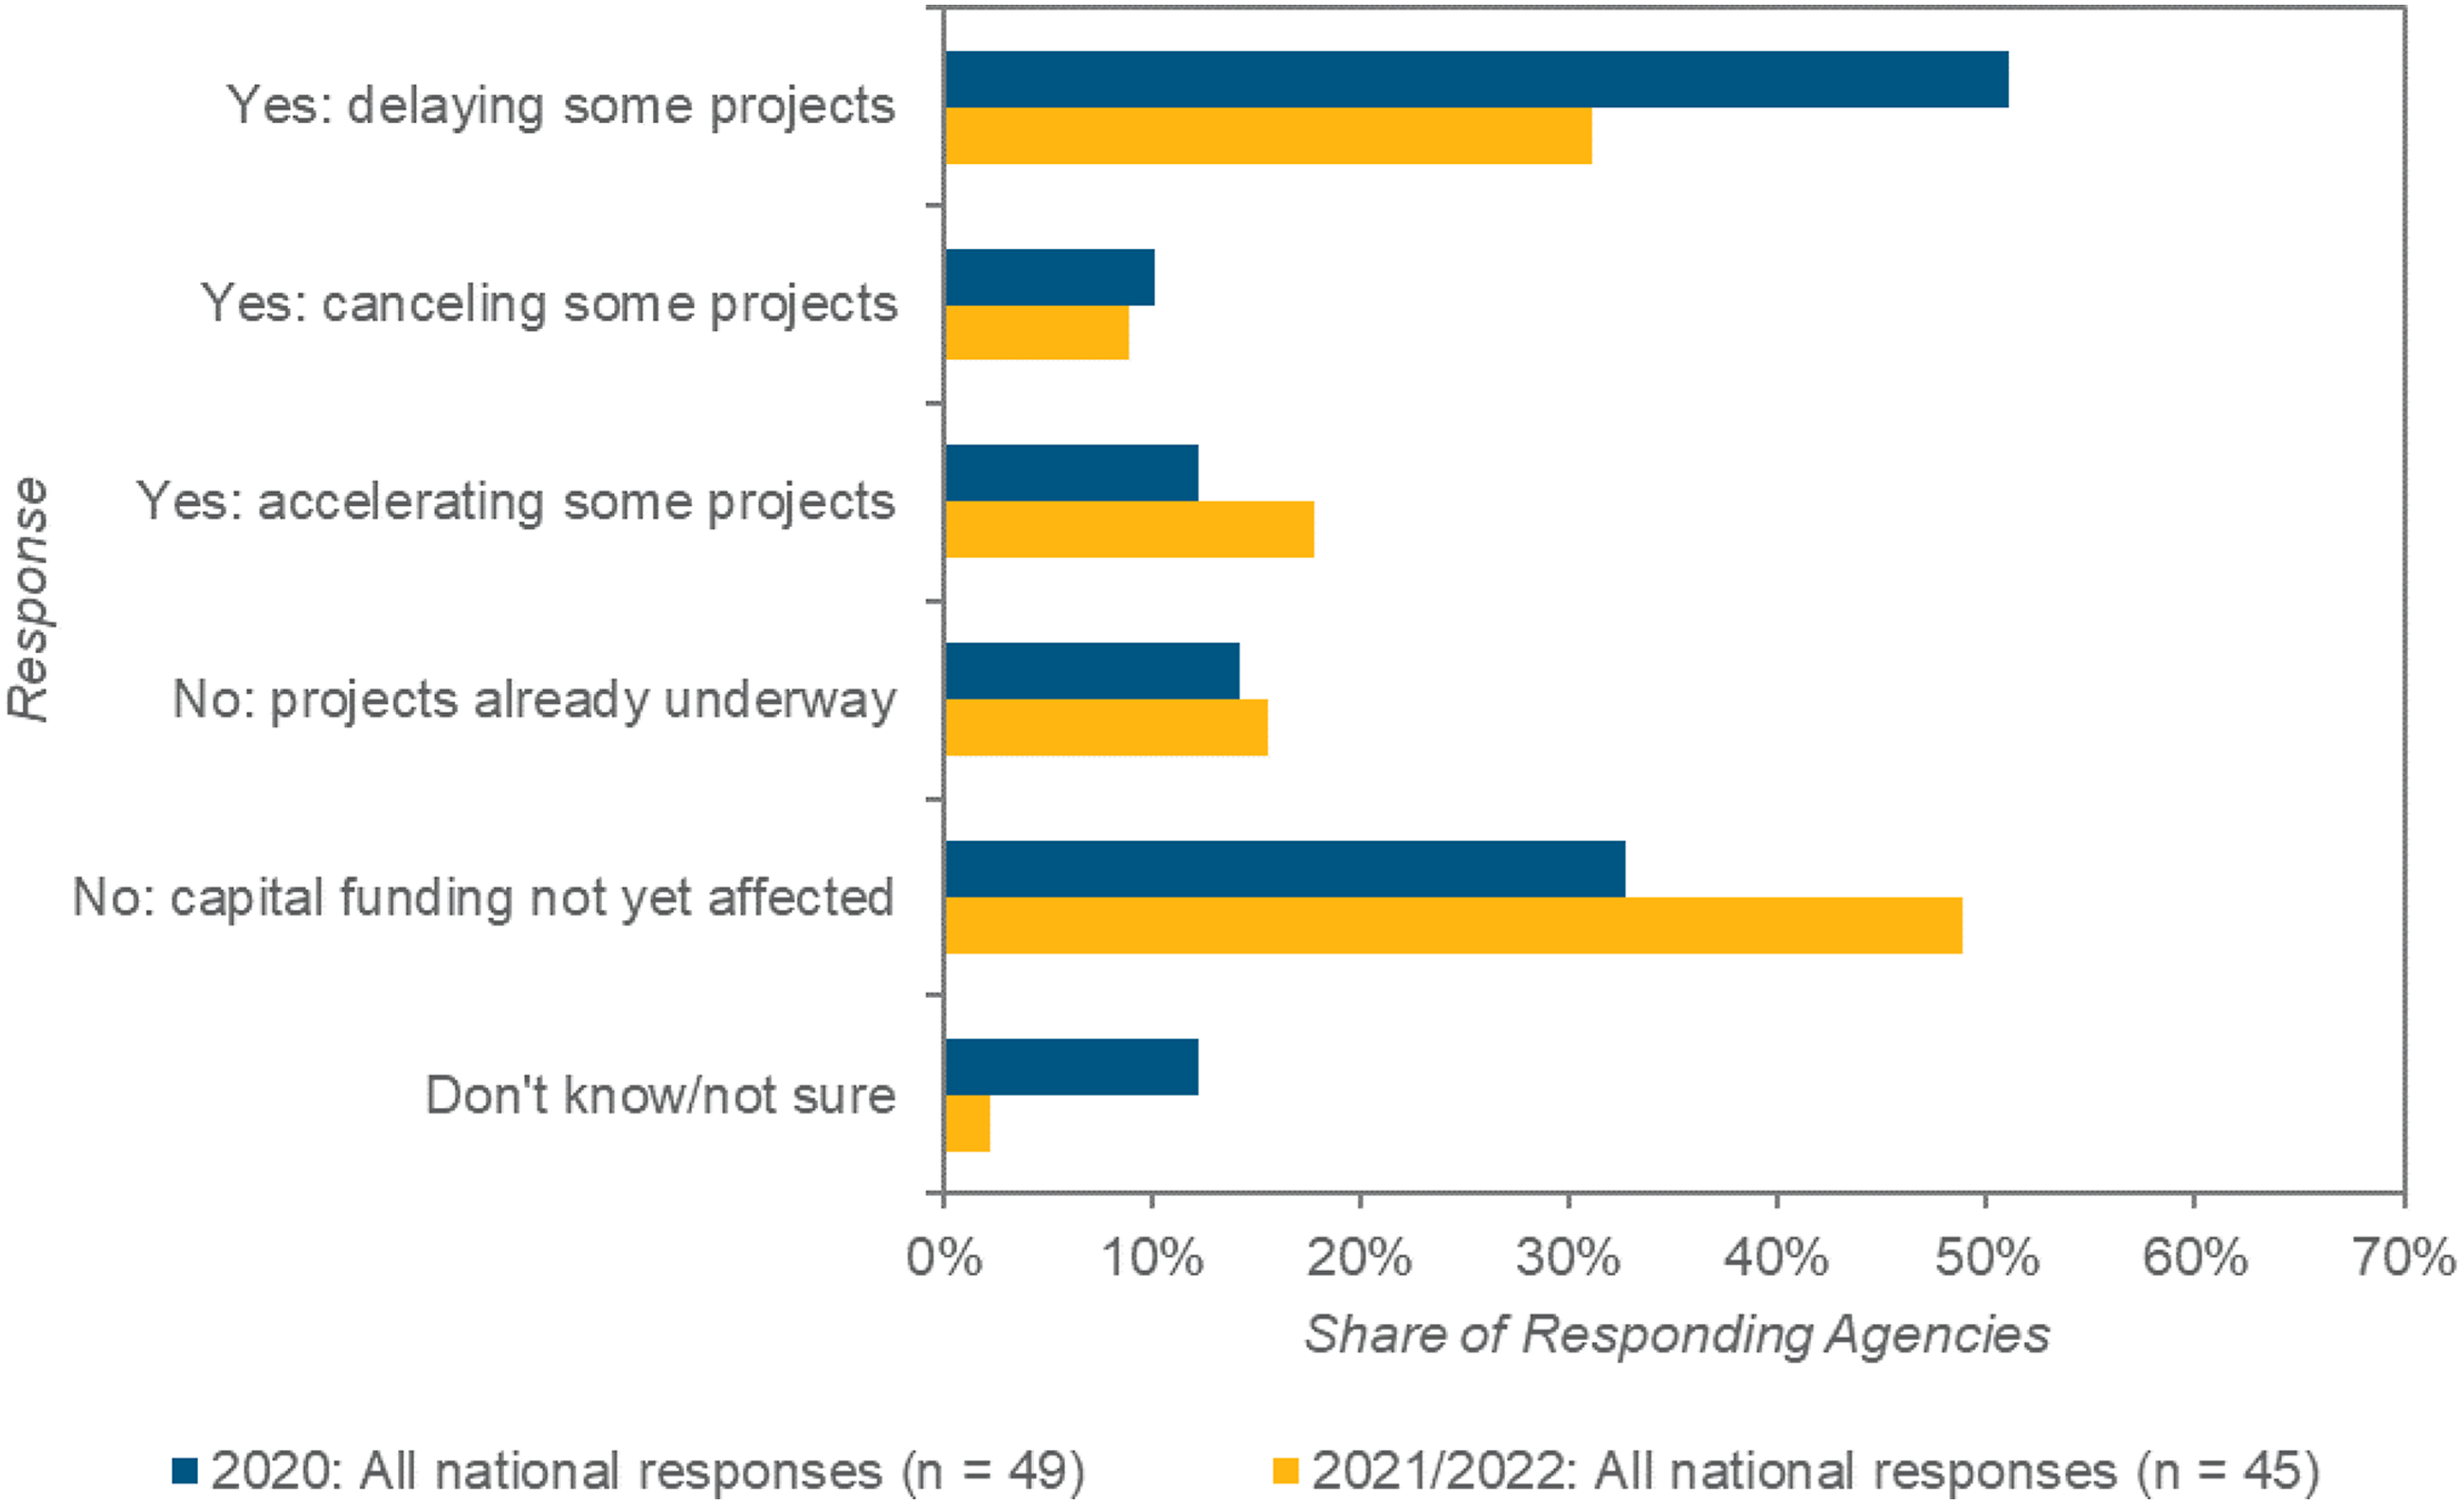
Among agencies that responded to both survey waves, about 20 percent shifted from being uncertain about the effects of the pandemic on their capital projects or having projects delayed during 2020 to having their projects underway or accelerated by fall 2021/winter 2022 (n = 29) (See Figure 4). Has the Pandemic Affected Longer-term Capital Planning? Longitudinal Comparison of Changes over Time at 29 Agencies.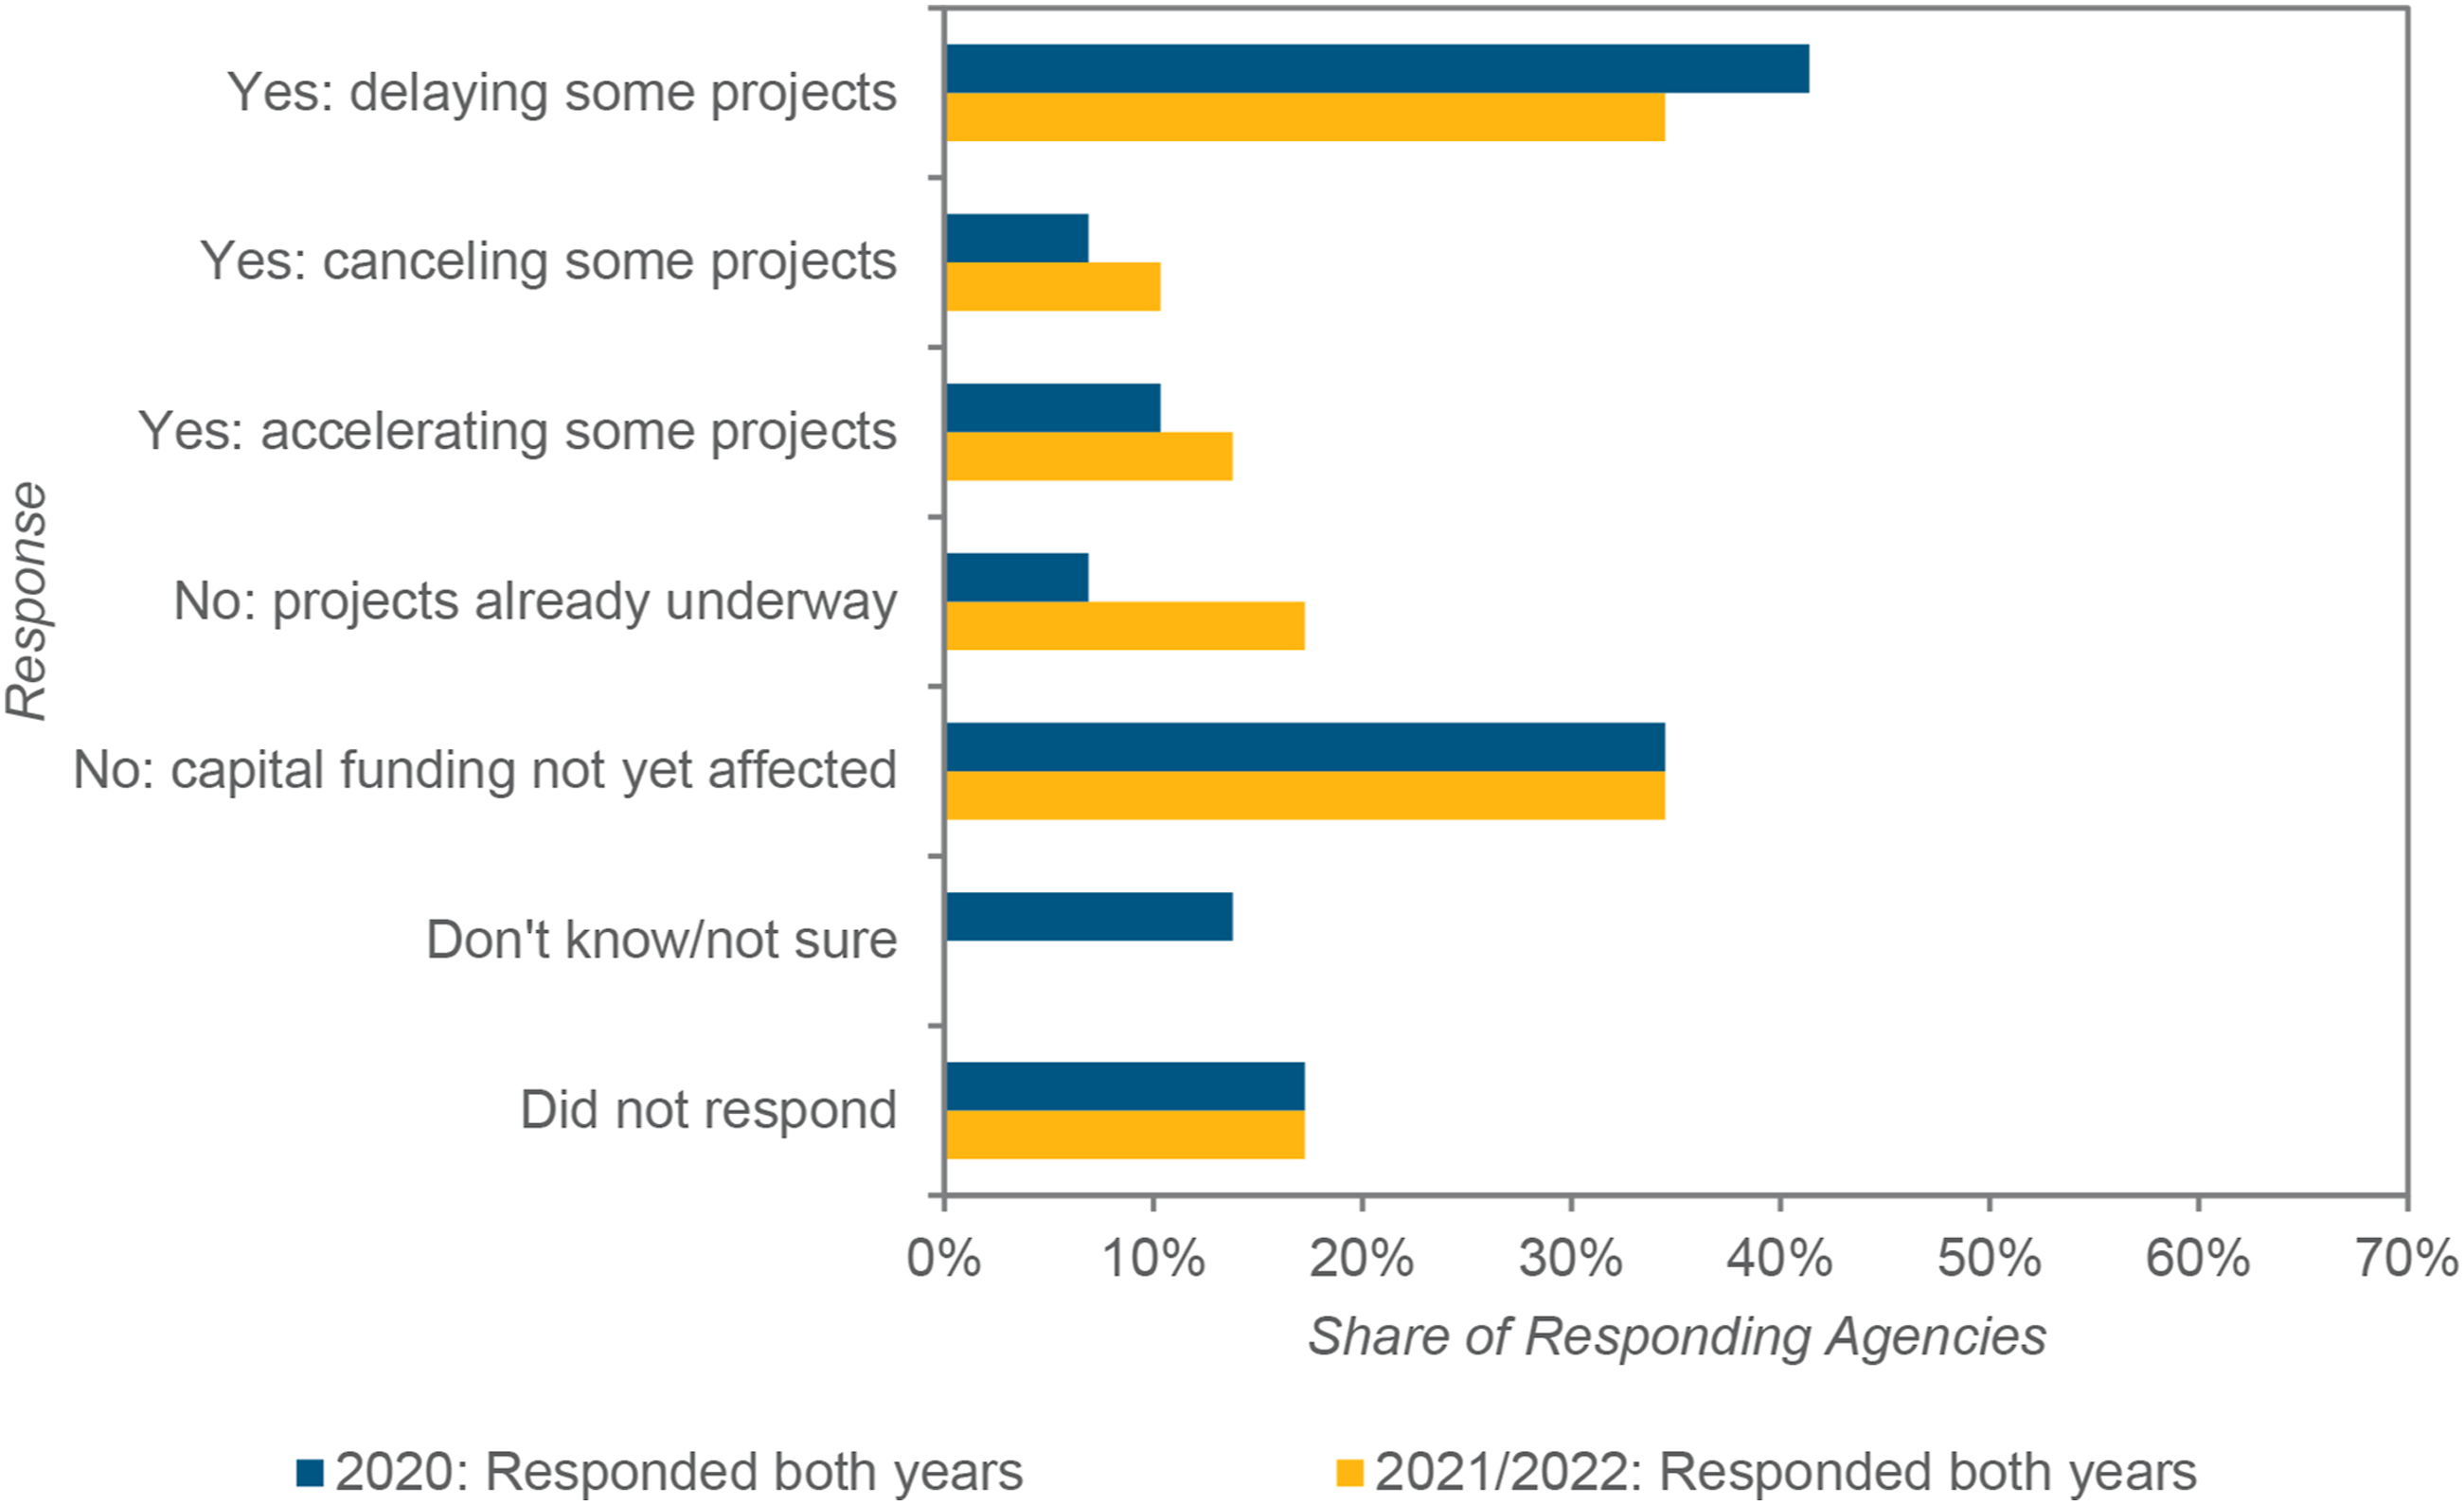
In contrast to our findings that large, high farebox-recovery systems were more likely to have faced operating shortfalls affecting service, longer-term capital planning at larger agencies was less likely to have been disrupted by the pandemic. The 16 percent of respondents whose capital planning remained “relatively unaffected” in 2021/2022 because projects were already underway were larger, on average, with an average annual pre-pandemic ridership of 57 million and with a modest average farebox recovery ratio of 14 percent. Meanwhile, the 31 percent of systems with delayed projects in 2021/2022 had an average annual pre-pandemic patronage of 11 million and a farebox recovery ratio of 10 percent, and agencies that had projects canceled (9%) averaged fewer than one million annual boardings and a farebox recovery ratio of five percent (though the few agencies with accelerated projects during the pandemic—due to less traffic on roads for a period, more down time for maintenance of vehicles, etc.—were generally small and medium-sized).
Effects of the Pandemic on Transit Funding
Fares
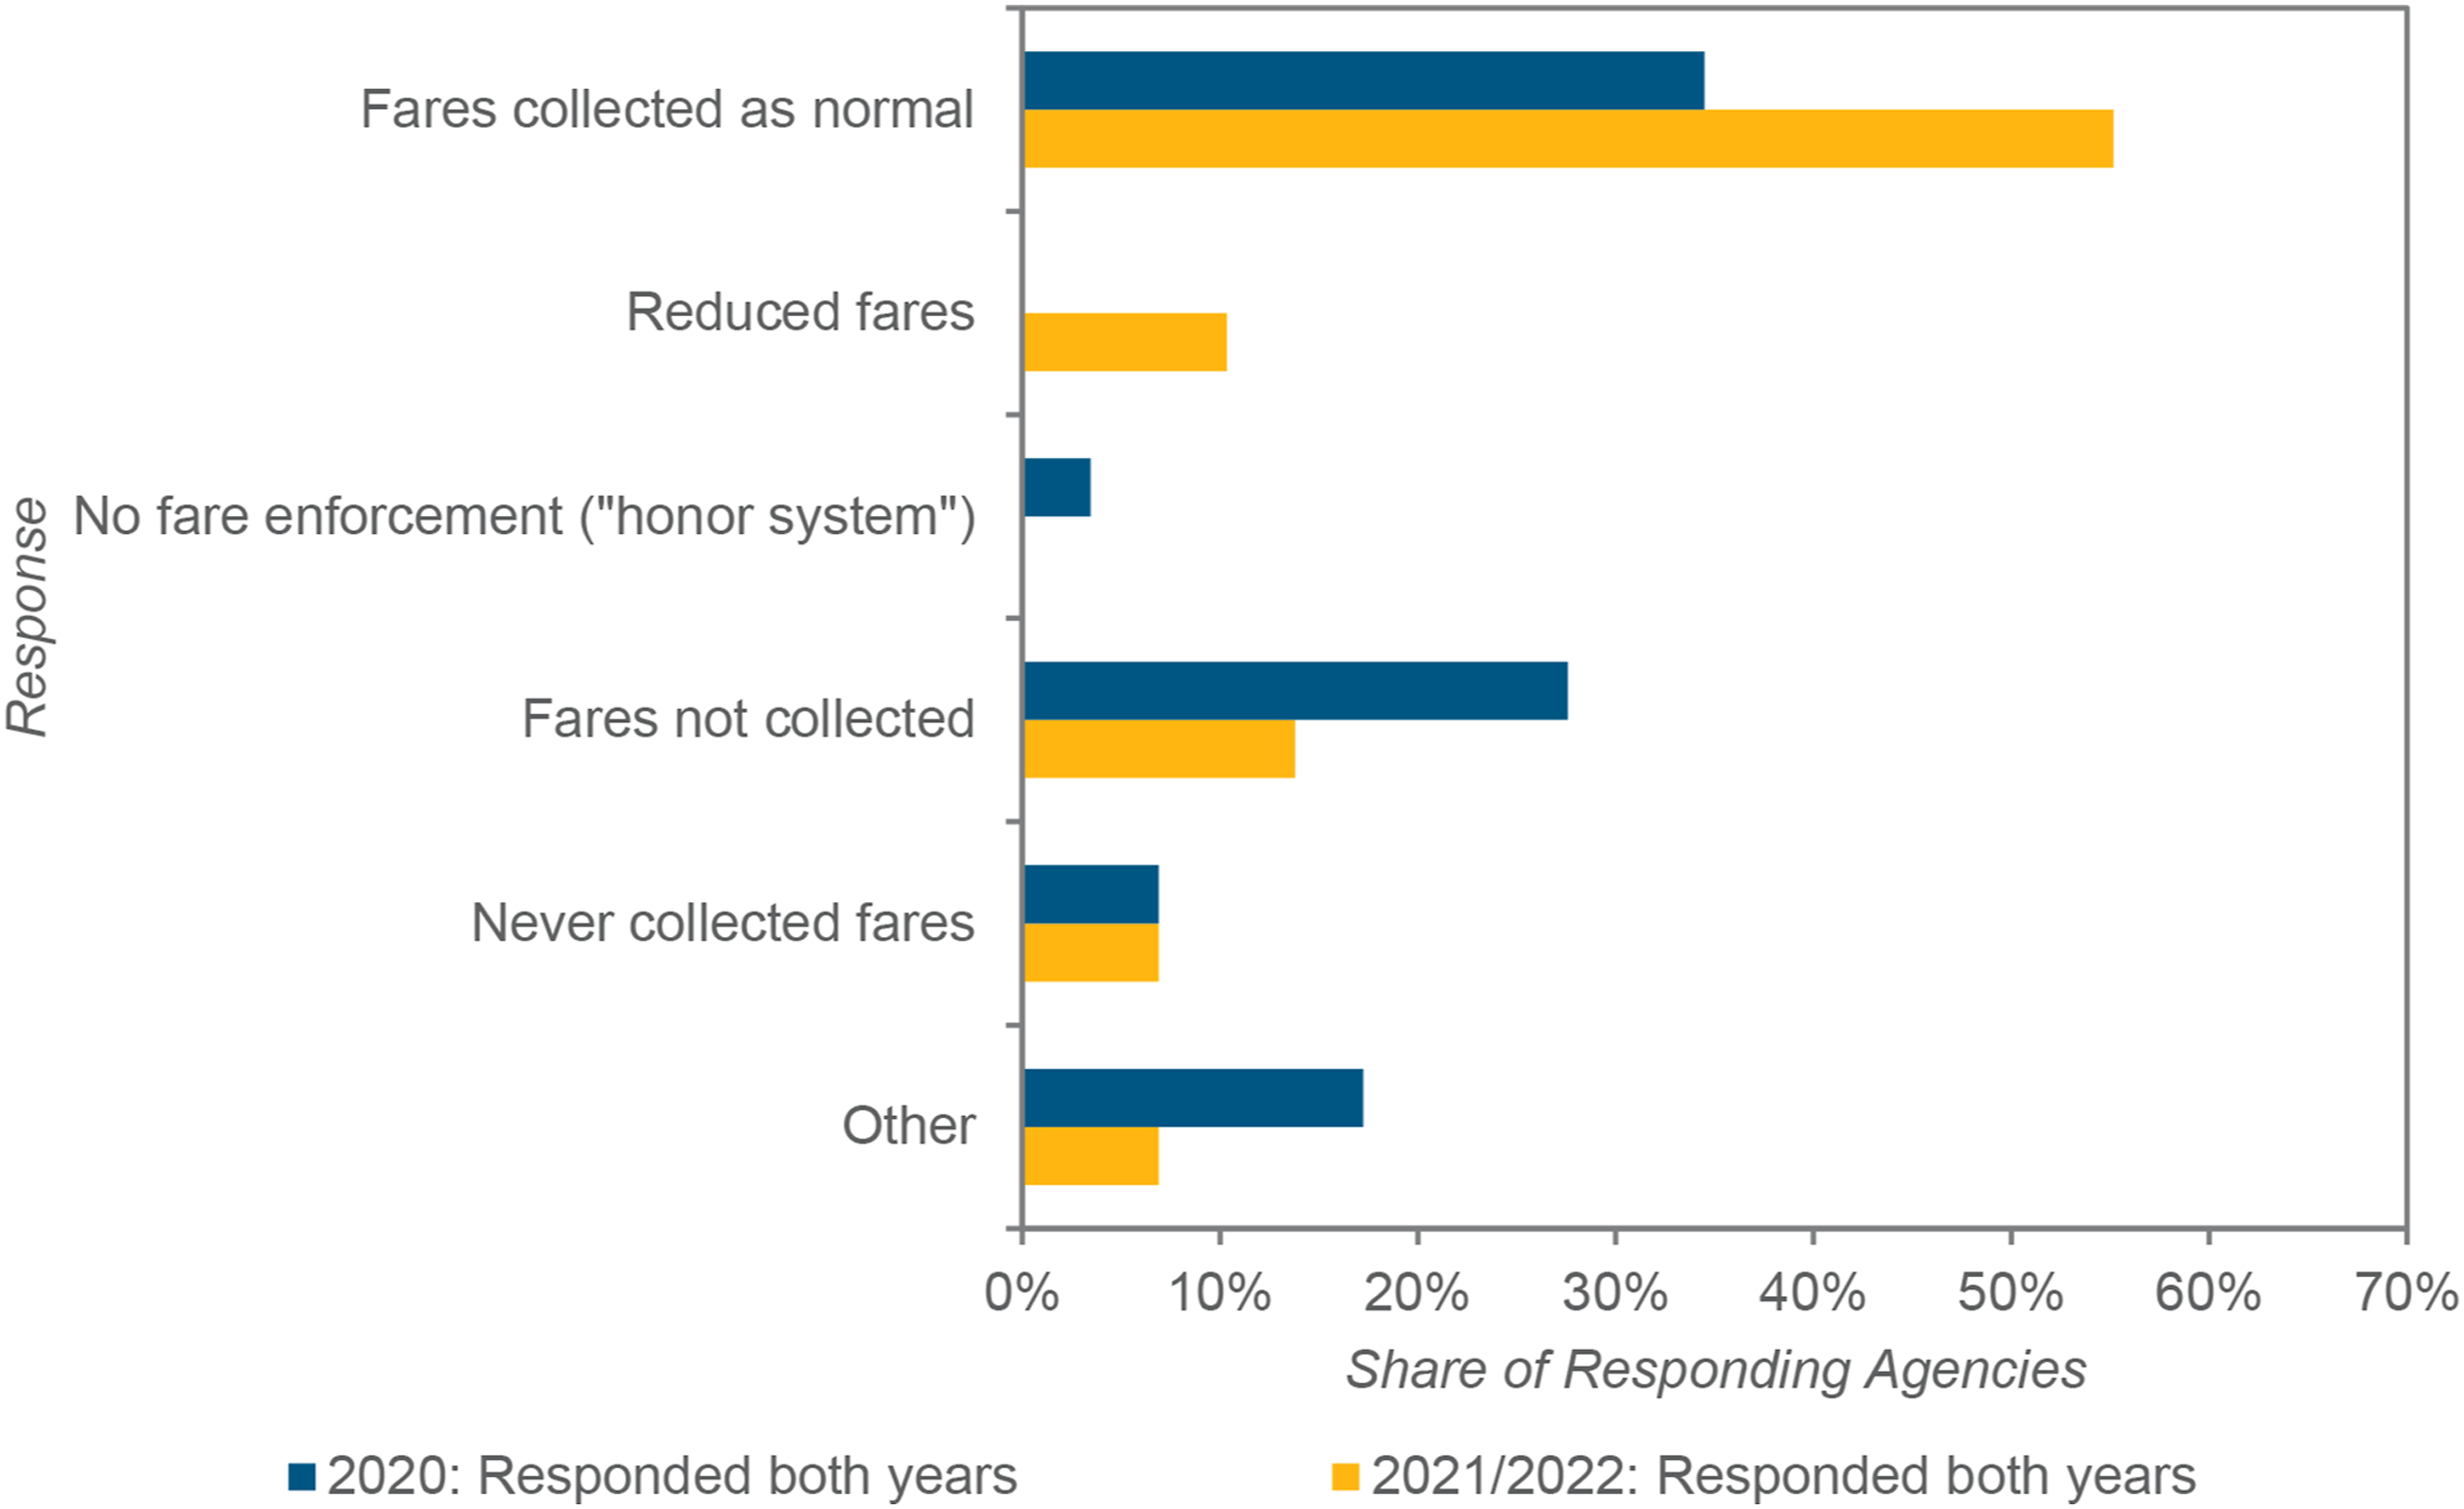
The pandemic affected not just transit agencies’ service outputs, but their various financial inputs as well. Across all funding categories, fare revenues suffered the starkest and most direct negative effects of the pandemic. On top of ridership (and thus fare payments) falling dramatically during the pandemic, 65 percent of surveyed agencies suspended fare collection and 18 percent stopped fare enforcement for at least some period. However, most of these fare suspensions had ended by the time of our second survey. Fully two-thirds (66%) of responding agencies in fall 2021/winter 2022 reported collecting fares as they had before the pandemic (n = 50), compared to just over a third (37%) in summer/fall 2020 (n = 51) (See Figure 5). This varied little by mode: 80 percent of bus-operating agencies (n = 46), 90 percent of rail-operating agencies (n = 10), and 83 percent of paratransit-operating agencies (n = 42) reported a return to full fare collection by fall 2021/winter 2022. We found the same pattern of returning to pre-pandemic fare collection policies among the 29 agencies that responded to both of our surveys, which allowed us to track these agencies’ changes in fare policy over the course of the pandemic (See Figure 6). Changes to General Fare Policy: Repeated Cross-sectional Comparison. Note: Respondents each year that skipped the question are excluded. Changes to General Fare Policy: Longitudinal Comparison of Changes over Time at 29 Agencies.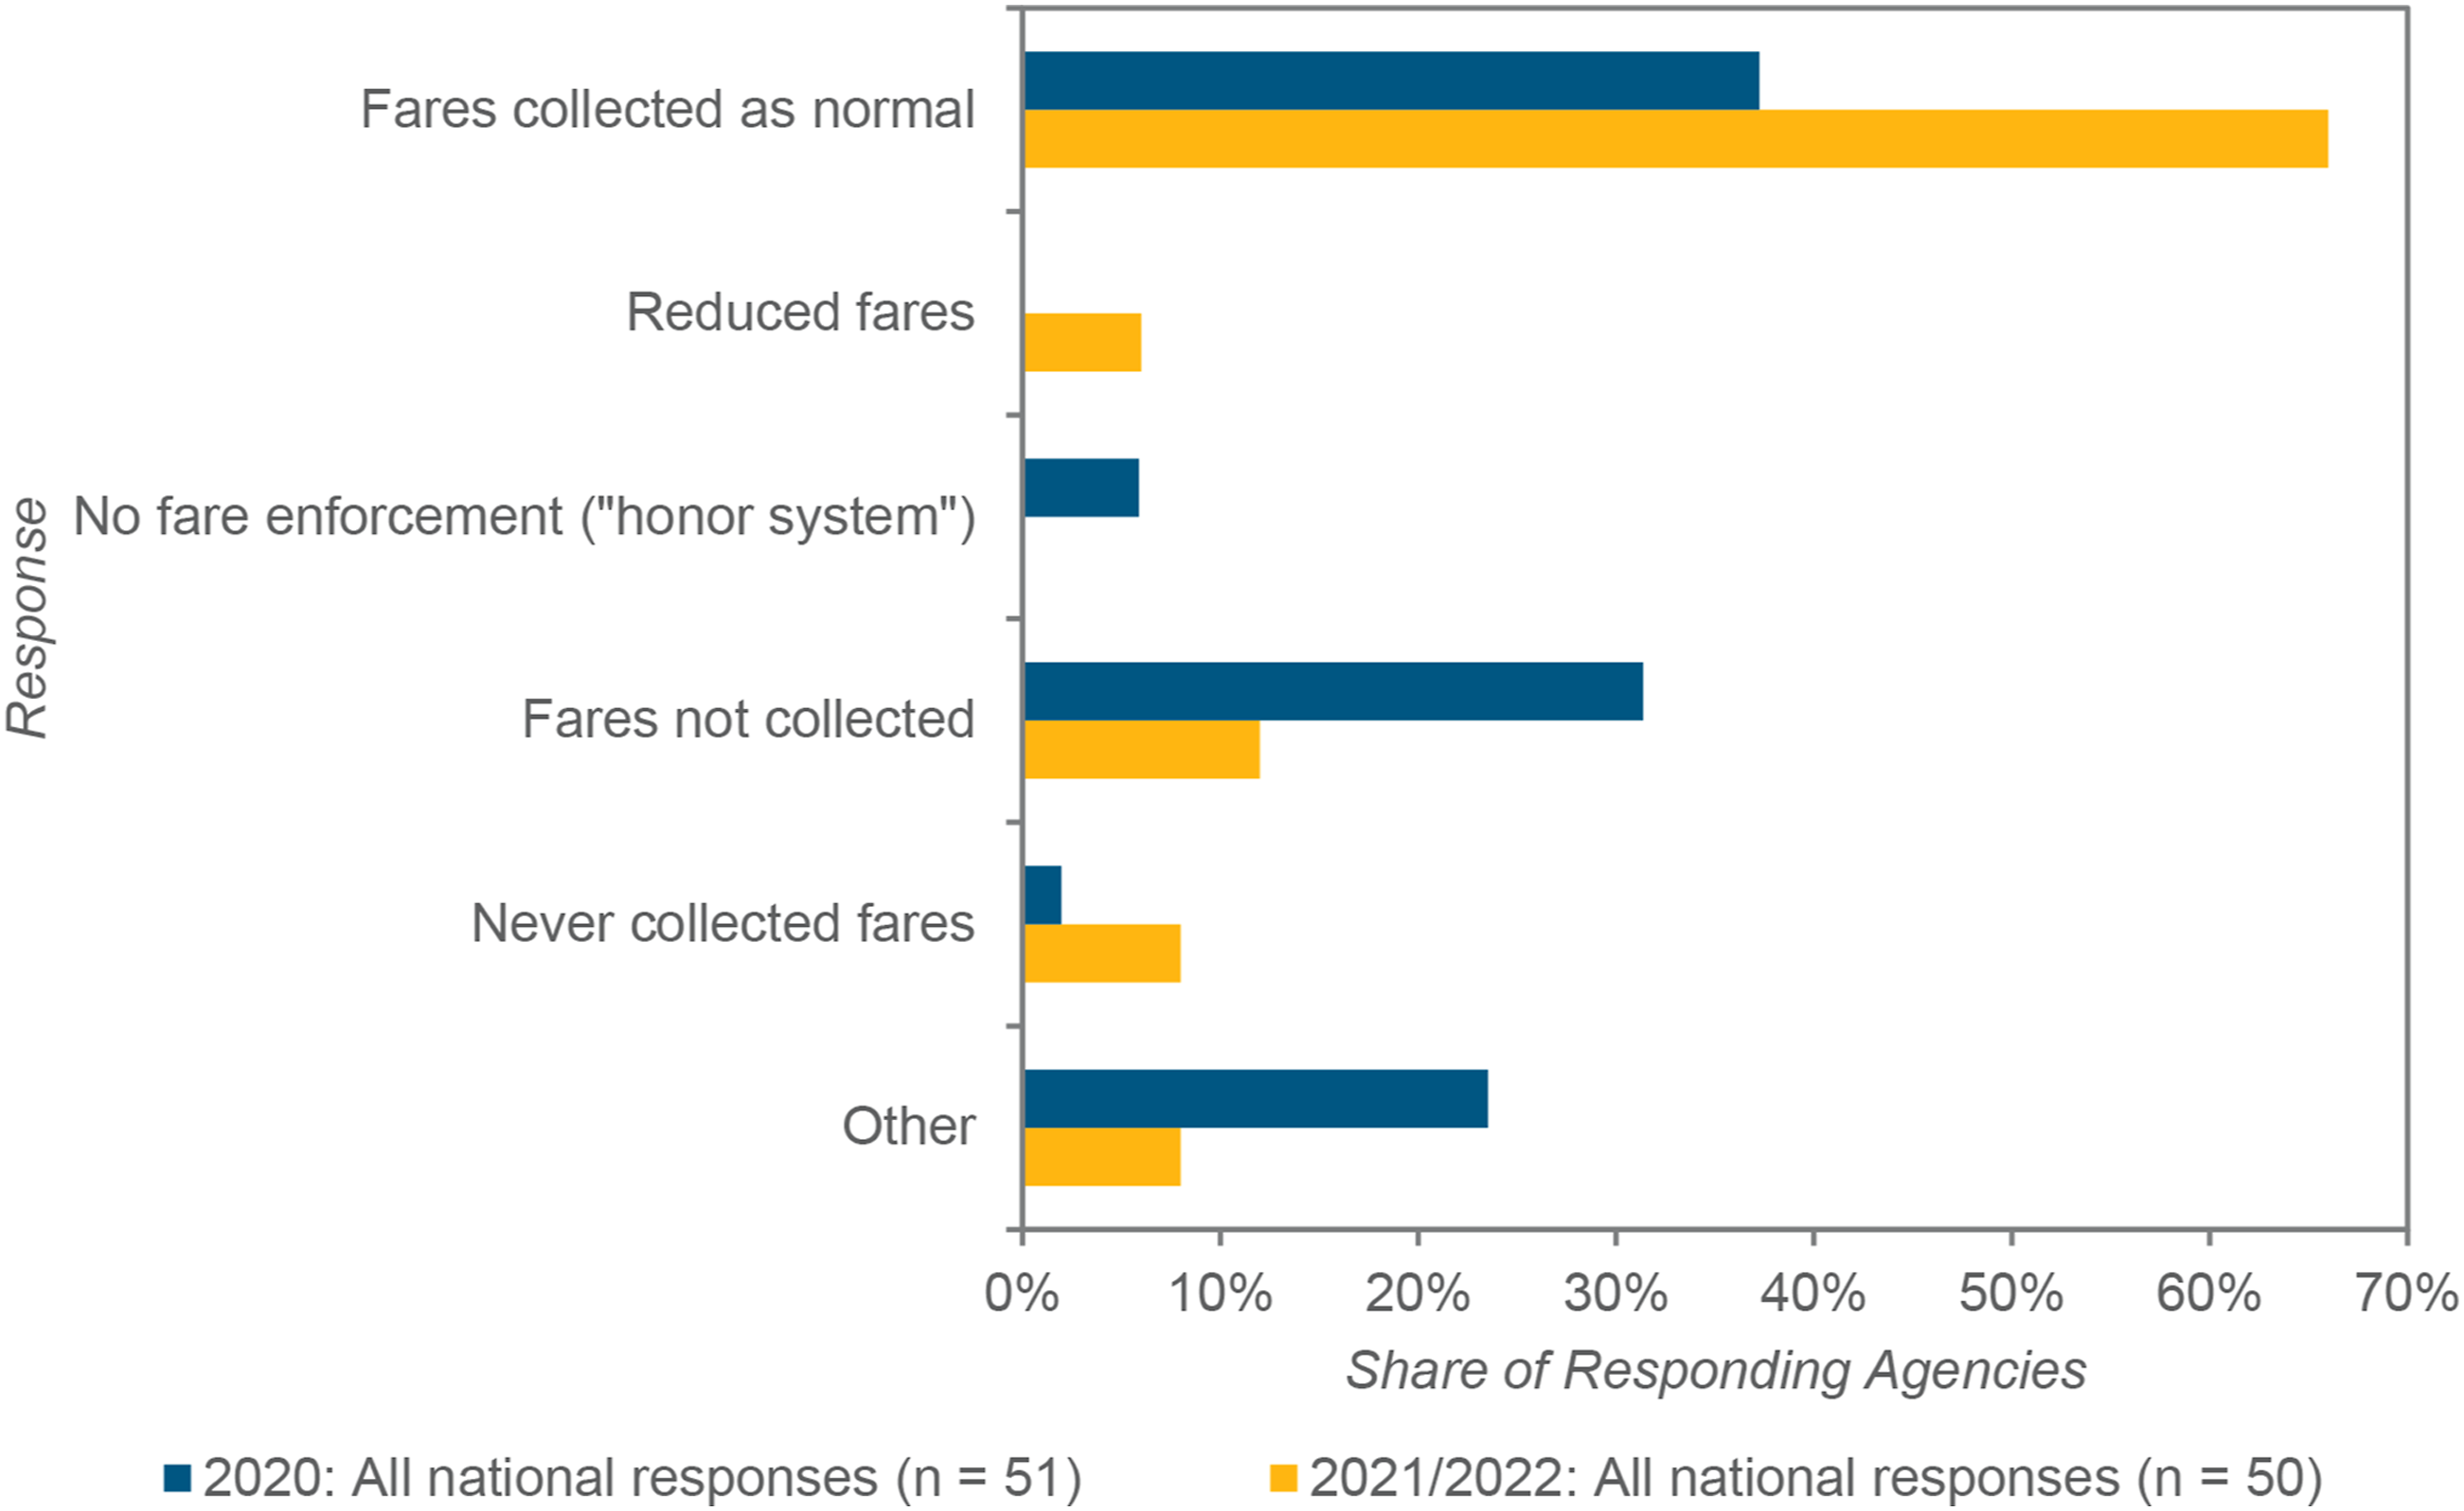
Fare Policies and Associated Agency Ridership and Farebox Recovery Ratio.
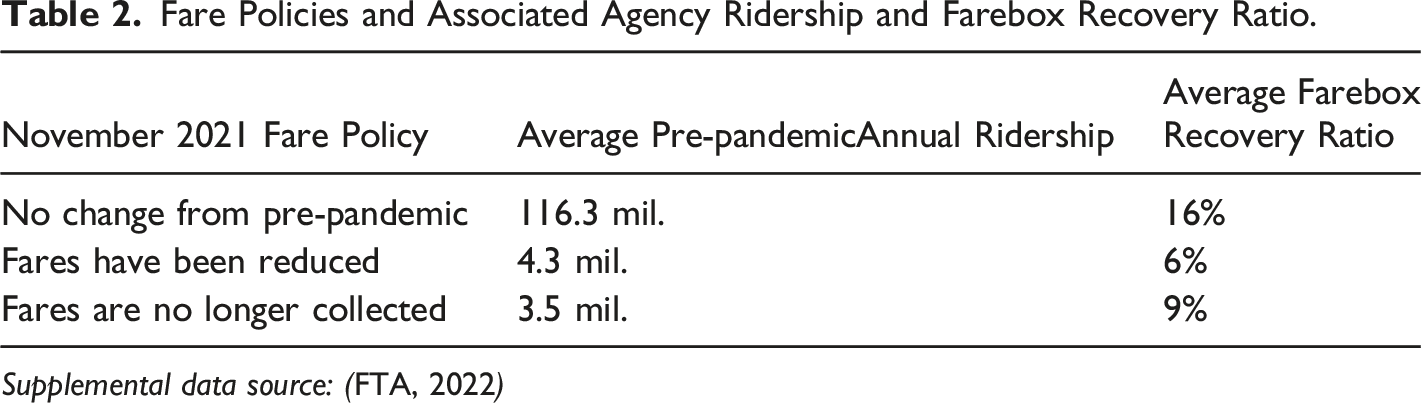
Supplemental data source: ( FTA, 2022 )
Despite most agencies’ return to their pre-pandemic fare policies, depressed fare revenues remained common across the industry due to lagging ridership. All of the responding agencies that collected fares prior to the pandemic reported a decline in fare revenue and farebox recovery ratio in the fall of 2021 compared to before the pandemic.
Our survey respondents reported adopting various strategies to cope with lost fare revenues. Four out of five in fall 2021/winter 2022 sought and/or used additional federal, state, regional/local tax revenue sources to backfill for fare revenue losses (n = 30). Over a third (37%) cut service, and another 13 percent of agencies cut administrative or other costs, to help make up for lost fares.
Stimulus Successes
For all the doom and gloom of fare losses, the survey responses revealed the critical importance of federal operating funds for U.S. transit agencies during the pandemic. Federal stimulus dollars provided significant support to agencies to stave off dire financial situations. A remarkable 83 percent of responding agencies reported receiving more federal subsidies during the pandemic than the year before the pandemic—64 percent “much more” (n = 53). State, regional, or local subsidies, by contrast, either remained roughly the same or were lower in November 2021 than the year before the pandemic, for most agencies (See Figure 7). Subsidies during the Pandemic, as Compared to before the Pandemic, Fall 2021/Winter 2022. Note: Respondents that skipped the question are excluded.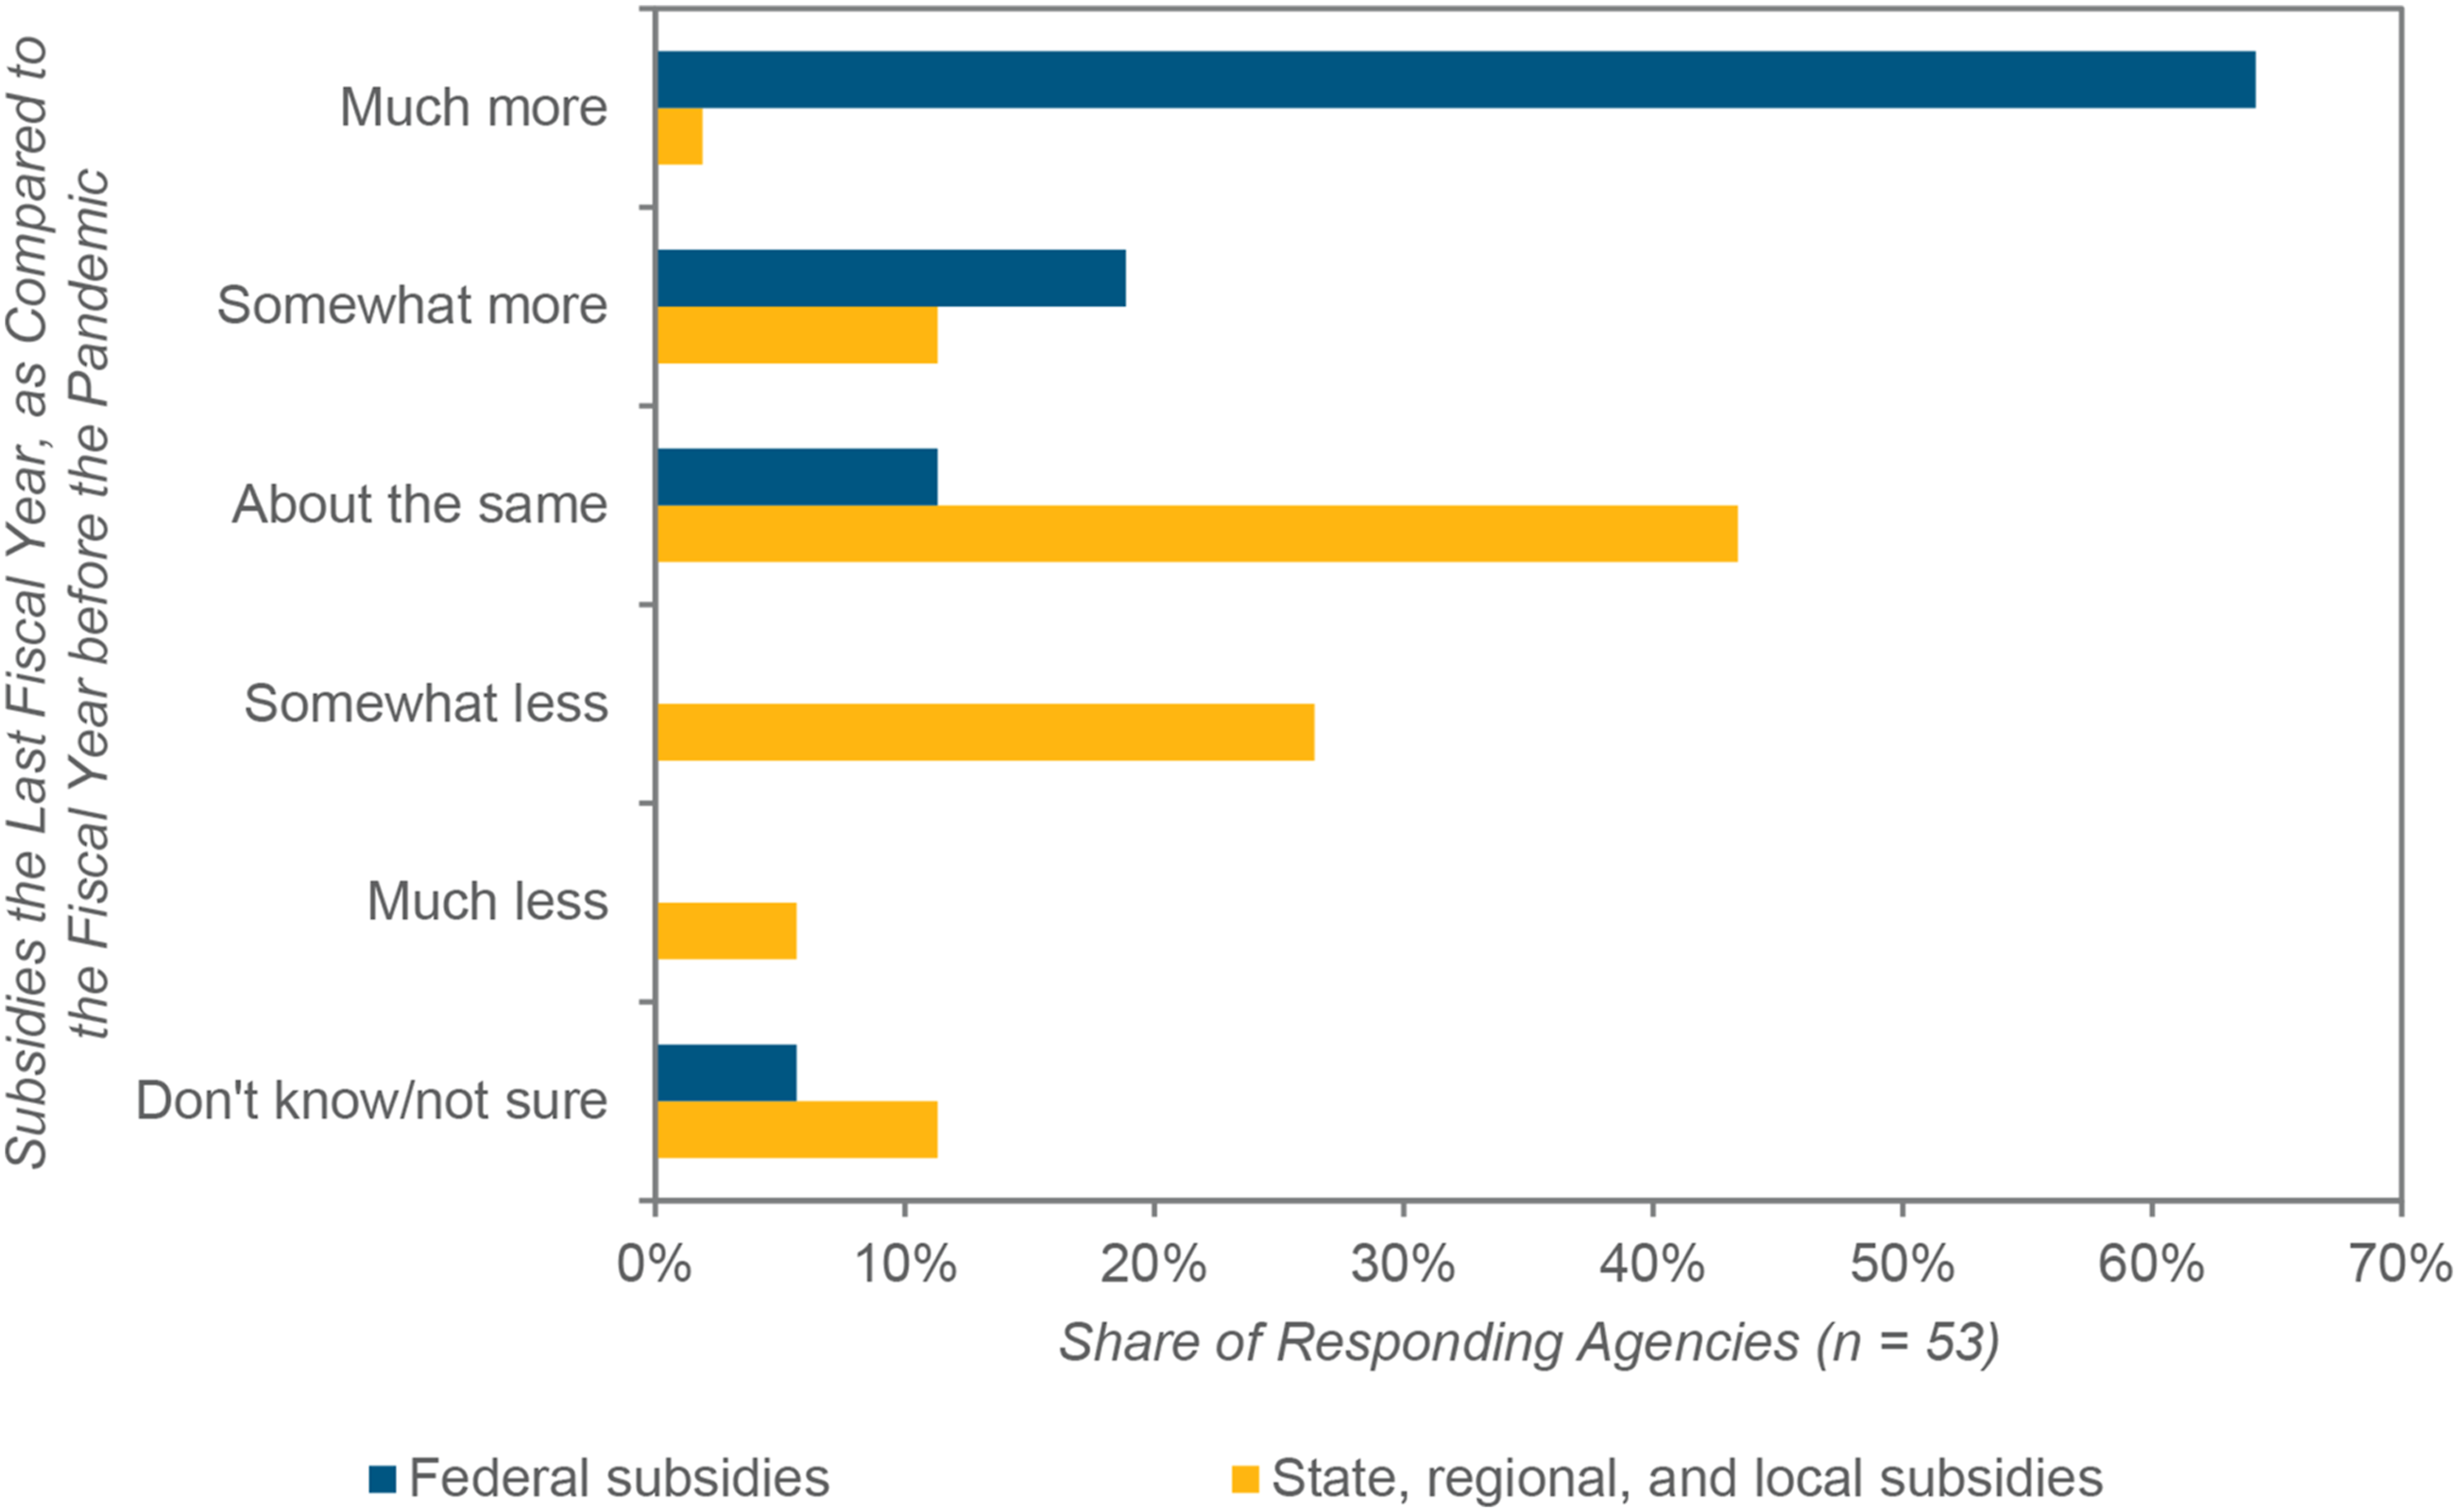
Larger agencies by pre-pandemic ridership, in particular, reported receiving “much more” federal subsidies during the pandemic than prior: the agencies that received “much more” in federal subsidies in 2021 than before the pandemic had an average annual ridership of 119 million, those that received “somewhat more” carried 4.2 million, and those that received “about the same” had an average of just 1.5 million. However, growth in federal subsidies occurred across all modes: 61 percent of responding agencies that operate bus services (n = 51), 70 percent of agencies operating rail services (n = 10), and 65 percent of agencies operating paratransit services (n = 46) reported receiving “much more” in federal subsidies in 2021.
Among its other flexible provisions, the stimulus funding has relatively few restrictions on when it can be spent. As of the fall 2021/winter 2022, only six percent of respondents reported that their agency had already spent down all of their federal pandemic stimulus funds, while the rest said that their funds were still being spent down or held in reserve (n = 53). Nearly a quarter of responding agencies indicated that their federal rescue funding would be fully expended during the (then-) current fiscal year ending in 2022, and another 40 percent foresaw it running out sometime during the 2022-2023 fiscal year. Around one in five planned for it to last beyond then. The pandemic federal stimulus funds thus not only helped keep transit budgets aloft during the first year of the pandemic but will end up supporting transit for several years after.
Uncertain Outlooks
The relatively rosy fiscal picture painted by responses to our questions on the stimulus faded when many respondents were asked about their agency’s future. The respondents in our sample were divided in their prospects for their agency’s financial future once the federal pandemic relief funding expires. Neatly divided, 47 percent anticipated no financial shortfalls once federal relief funding expires, while another 47 percent foresaw either minor or major financial shortfalls thereafter (n = 51). Again, systems anticipating major deficits tended to be larger (on average, 270 million passengers per year pre-pandemic) and to have had a higher farebox recovery ratio (on average, 24%). In contrast, respondents who told us that financial shortfalls “probably” or “definitely” will not occur had an average annual pre-pandemic ridership of just eight million and farebox recovery ratio of nine percent. The majority of agencies that operate buses and/or paratransit anticipated no shortfalls once federal relief funding expires, while rail-operating agencies were more divided: 50 percent anticipated financial shortfalls and 40 percent did not (n = 10).
Whatever the reality or degree of coming budgetary shortfalls, most respondents did not see it affecting service in the near term. Forty-six percent of respondents in fall 2021/winter 2022 told us that their agency’s financial condition would not affect service provision in the 2022-2023 fiscal year, and another 28 percent expected minor increases in services (n = 46).
Meanwhile, after an unplanned experiment in fareless transit for many transit agencies, most surveyed systems are not considering continuing fare-free policies. Fourteen percent, though, told us in the second survey that they had decided to go fare-free on an ongoing basis (n = 43) (although online searches since then reveal that, as of writing, all of these agencies either continue to publicly characterize fare suspensions as temporary or have reinstated fares), with one agency keeping its pandemic-adopted “honor system” for fare payment, five percent reducing fares from pre-pandemic levels, and seven percent increasing fares from pre-pandemic levels (n = 41).
Labor Issues
Our findings above show that by 2022, while finances were generally not hampering service, operations, or capital projects, labor issues were. While the medium-term financial future for transit may be murky, a clear, overarching concern among transit agencies across the U.S. in our second survey was not necessarily financial shortfalls but labor shortages. Better than nine in ten (91%) agencies surveyed expressed concerns about filling in open positions, particularly for bus/train operators and mechanics (n = 45). Over 70 percent indicated that they are having “great difficulty” in filling openings. This difficulty was common in our sample among both unionized and non-unionized workforces and among agencies that directly employ their front-line workers and those that contract with private operators (which in turn employ workers) for service, though a slightly lower share, 55 percent, of the 11 agencies with a directly employed, non-unionized workforce reported “great difficulty” in filling positions. As we discuss below, labor issues in the transit sector are not new, but they have thus become particularly salient as agencies try to recover from the pandemic.
Discussion and Conclusion
U.S. public transit systems stood, for the most part, on relatively solid fiscal ground in 2022, but the future is far from secure, especially for formerly high-ridership, high-farebox-recovery systems. Patronage on most systems remains depressed, those still riding are more likely low-income, people of color, and to have few or no household vehicles (Paul & Taylor, 2022), fare revenues are down, and workers are hard to find.
As we expected, the effects of COVID-19 and its repercussions on transit systems varied between (about) six and 21 months into the pandemic. Early on, service shifted and contracted in response to falling demand and revenues. Our survey results show that by early 2022, service provision below pre-pandemic levels was much more likely due to chronic labor shortages among operators and mechanics than to funding shortfalls. While the fate of capital projects was more uncertain early on, by the time of our fall 2021/winter 2022 survey, capital projects were more likely to have been accelerated than delayed or abandoned.
Overall, federal stimulus funds proved a godsend for transit operators, filling holes in other revenue sources and providing stability in an extraordinarily difficult time for the industry. Indeed, many of our respondents were able to bank and gradually spend federal pandemic operating funds three or more years after their initial allocation to help cover for lagging fare revenues. The federal response to the transit fiscal crisis early in the pandemic is a notable example of successful public policy intervention, as the potential financial collapse of many U.S. transit systems was averted. But the relatively sanguine financial picture in 2022 does not necessarily hold for the future, at least not for all operators. Our survey respondents were evenly divided about their agency’s financial prospects once the federal pandemic funds are eventually exhausted. In general, managers at larger transit systems with higher pre-pandemic farebox recovery rates are more likely to see troubled fiscal waters on the horizon, while those at smaller, lower farebox-recovery systems are more optimistic about the future.
The finding that formerly “high-performing,” high-farebox-recovery systems that long drew substantial shares of their operating revenues from fares now find themselves in more financially precarious positions than “lower-performing” systems that never relied heavily on fare income poses a dilemma for policymakers. Should state, regional, and local operating subsidies be tied to transit systems’ abilities to attract paying customers, or should transit’s social service role of providing mobility for many of the most disadvantaged travelers (Taylor & Morris, 2015) irrespective of fare revenue be emphasized? Analyses prior to the pandemic suggest that a suite of efficiency and effectiveness metrics and peer-group comparisons, beyond farebox recovery ratio, would better align transit funding to the goals policymakers typically set for transit (Gahbauer et al., 2019). Given that so many systems suspended fare collection during the pandemic, some advocates have called for systems to go “fare-free” on an ongoing basis to both attract riders back to transit and to relieve financial burdens on disadvantaged riders. While some systems reported being or going fare-free during the pandemic, a substantial majority returned to collecting fares.
Meanwhile, labor issues loom large over transit’s recovery. Yet, though the pandemic surely worsened this situation, an industry-wide labor shortage has hampered the smooth delivery of transit service for years. Vehicle operators in particular have proven hard to keep and even harder to recruit. The arduous nature of the job requires operating a large vehicle safely and efficiently; keeping customers of all stripes moving, protected, and happy; and defusing confrontations—all during long, non-standard, and/or strictly scheduled shifts. Despite some agencies increasing wages and bonuses, our survey confirms recent reports of agencies not being able to attract sufficient operators to fill open positions, perhaps due as well to inflation and competition from other industries (George, 2021; Kamisher, 2021; Van Eyken, 2022). While labor conditions and availability proximately represent an operational concern, they often stem ultimately from budgetary decisions and agency finances.
All of these near-term financial concerns, in our view, are prompted by longer-term existential ones. Will rider demand and fare revenues remain depressed well into the future? Will increased federal, state, or local support step in to fill the gap? Will traditionally commuter-oriented systems, the hardest-hit by the pandemic, be able to adjust to a future where fewer people work in offices (but perhaps more live) in downtowns and other major city centers? Will transit riders remain predominantly disadvantaged travelers? Is the era where farebox revenues constitute a substantial share of operating revenues drawing to a close? Will workers continue to leave or shy away from front-line transit jobs? The answers to these questions will collectively determine the financial future of public transit in the U.S. Unfortunately high levels of uncertainty as we write mean that these answers are likely to remain elusive for some time to come.
Footnotes
Acknowledgments
This research was made possible through funding received by the University of California Institute of Transportation Studies from the State of California through the Public Transportation Account and the Road Repair and Accountability Act of 2017 (Senate Bill 1) and by the Resilient and Innovative Mobility Initiative from the State of California through a one-time General Fund allocation included in the 2021 State Budget Act. The authors are grateful for this support and are responsible for any errors or omissions. The authors would also like to thank all of the transit operator staff who took the time to answer our survey questions.
Declaration of Conflicting Interests
The author(s) declared no potential conflicts of interest with respect to the research, authorship, and/or publication of this article.
Funding
The author(s) disclosed receipt of the following financial support for the research, authorship, and/or publication of this article: We would like to acknowledge the University of California Institute of Transportation Studies (UC-ITS-2022-15 and UC-ITS-RIMI-4B) for supporting this research.
Author Biographies
![]() . Her research interests lie in transportation equity, travel behavior, transportation finance, land use transportation interaction, and innovative mobility.
. Her research interests lie in transportation equity, travel behavior, transportation finance, land use transportation interaction, and innovative mobility.
Jacob L. Wasserman
is a Research Project Manager at the ![]() . With a background in transportation equity, finance, and demand management, Wasserman coordinates research into public transit and other mobility issues. Prior, he worked for the Cities of Los Angeles, San Francisco, and New Haven.
. With a background in transportation equity, finance, and demand management, Wasserman coordinates research into public transit and other mobility issues. Prior, he worked for the Cities of Los Angeles, San Francisco, and New Haven.
Brian D. Taylor
is Professor of Urban Planning and Public Policy in the UCLA Luskin School of Public Affairs and Director of the ![]() . He studies travel behavior, transportation equity, finance, history, and politics, and most recently, public transit use and finance during the COVID-19 pandemic.
. He studies travel behavior, transportation equity, finance, history, and politics, and most recently, public transit use and finance during the COVID-19 pandemic.
Samuel Speroni
is a doctoral student in the UCLA Department of Urban Planning and researcher at the ![]() . He studies travel behavior, transportation finance, and school transportation, especially the equity implications within each of those areas. Recently, he has researched the effects of COVID-19 on travel.
. He studies travel behavior, transportation finance, and school transportation, especially the equity implications within each of those areas. Recently, he has researched the effects of COVID-19 on travel.