
Abstract
Researchers and practitioners who are interested in whether low parking costs may play a role in skewing travel toward the private automobile and away from transit have been hampered by the lack of systematic data on parking costs. This exploratory study reports on downtown public parking costs using a 2009 survey of public parking agencies in 107 U.S. cities. On average, on-street meters allowed parking for up to 2 hr and charged $1.00 per hour while off-street “commuter” lots charged $11 per day. Median fees for violating regulations ranged from $25 (meter violations) up to $200 (handicapped parking violations). Exploratory multivariable regression results found higher parking cost was associated with an increase in public transit miles in larger cities (adjusted for economic features of the city). This preliminary, exploratory study provides baseline data with which to compare future parking data that could inform parking policy’s influence on mode choice.
Introduction
Parking supply and cost may contribute to promoting or deterring use of public transit. A few case studies have examined relationships between free or reduced cost work-site parking and travel mode, finding that free work-site parking was associated with lower probability that workers would use transit and higher probability that workers would drive alone (conditional on access to a transit stop; Badland, Garrett, & Schofield, 2010; Hess, 2001). Other case studies have examined relationships between a designated parking space at the residence and travel behaviors and found higher likelihood of using an automobile for journey to work even when transit was fairly convenient (Weinberger, 2012; Weinberger, Seaman, & Johnson, 2009).
Marsden’s (2006) review of parking policies noted the delicate balance between revenue-raising activity for local authorities, the desire to avoid deterring visitors and therefore damaging urban vitality, and the need to manage transport demand (Marsden, 2006). That review concluded that there is no strong evidence that parking restraint discourages economic development. However, the review noted that there is little systematic research on the influence of public parking/curbside meter and violation costs to travel mode. Studying these relationships has been hampered by the lack of large-scale systematic data on public parking fees and fines and public planning that relates to parking. Larger cities have performed public parking needs assessments (Columbus, 2010; Portland, 2010), a few commercial parking entities have conducted surveys of fees levied at private parking lots in central business districts (Colliers International, 2009; National Parking Association [NPA], 2009), and urban planners and economists have summarized fees at a local level (Shoup, 1997, 2004). Yet no data have been available for a large number of cities that cover a diverse range of public parking cost variables.
This article reports on data collected from a new survey of public parking agencies in 107 U.S. cities. The information reported here can be used by policymakers, industry, and nonprofit agencies to begin to monitor parking policies in a systematic way and use the data to develop innovative parking policies. In addition, our study briefly explores whether higher parking costs are associated with higher public transit passenger miles.
Method
Parking Data
Between February 2010 and mid-November 2010, The Drexel University Central Business District Public Parking Survey contacted personnel in 125 cities across the United States to request that they complete an online or paper questionnaire. Contact names for city personnel were obtained from the cities’ websites and industry directories (IPI), web searches, and telephone calls to the cities’ offices. A number of strategies were employed to ensure an adequate response rate: Numerous emails (M = 10 emails, SD = 7, minimum = 1, maximum = 22), phone calls to a subsample that was nonresponsive to emails (M = 3 phone calls), and $10 gift cards were offered (only 20% of respondents accepted a gift card).
A total of 113 cities responded to the survey (82% of 125), but 5 cities that responded had to be excluded due to providing insufficient information. Ten cities that did not respond to the survey were able to be included after we obtained relevant data for 2009 from the cities’ websites and other secondary data sources. This left 107 cities for the analytic sample. (See list of cities in Supplementary Table 1 available at http://pwm.sagepub.com/supplemental. In addition, readers can obtain a limited-variable public parking dataset by contacting the corresponding author.)
The survey consisted of 26 questions based on existing surveys (Colliers International, 2009; Urban Transportation Monitor, 2005) and parking concerns raised in the transportation literature (Ison & Rye, 2006; Shoup, 2005, 2006; Victoria Transport Policy Institute, 2009). Participants were asked to report on parking conditions as of July 2009. Survey questions included fines for parking violations, fees for on-street metered parking and off-street parking, and maximum time period for on-street parking. Respondents had an average of 8 years in their job and the majority were parking managers so had substantive knowledge of the topic. Additional questions were also asked but these data are not reported here because parking managers did not know enough about these topics to reliably report on them (minimum or maximum parking requirements for new central business district developments, parking revenues, city or state mandates that employers who subsidize parking have to offer a cash allowance in lieu of a parking space).
In our survey, off-street parking prices were underreported by public entities due to off-street lots being owned or managed by external entities. Thus, 15% of the off-street day and midday hour rates came from the Drexel University Central Business District Public Parking Survey, and the remainder of the data came from two commercial parking surveys: Colliers International 2009 North America Parking Rate Survey (Colliers International) and the National Parking Association 2009 Review of Parking Rates in North America (NPA, 2009). Colliers and NPA reported on 52 and 57 cities, respectively, from our target sample. There was no indication that one dataset was preferable to another; thus when both sources were available, the average of two rates was used. Correlation between our data and the secondary data sources was high (r = .64–.73).
Due to a high proportion of item nonresponse from the parking survey (see “percent of cities reporting” in Table 1), a binary indicator, “high cost,” was created from multiple data fields to identify cities that had higher relative fees. A city was classified as “high cost” if it was in the highest quartile for any of the following parking cost variables: highest hourly fee for on-street metered parking; day rate for off-street commuter parking; hourly fee for off-street midday parking; and a computed scale variable for the cost of parking violations that was based on prohibited parking (no stopping or standing, yellow curb, etc.), expired meter, or overtime meter (feeding the meter).
Public Parking Fees and Public Planning Related to Parking, 2009; Drexel University Central Business District Public Parking Study, Total Number of Cities 107.
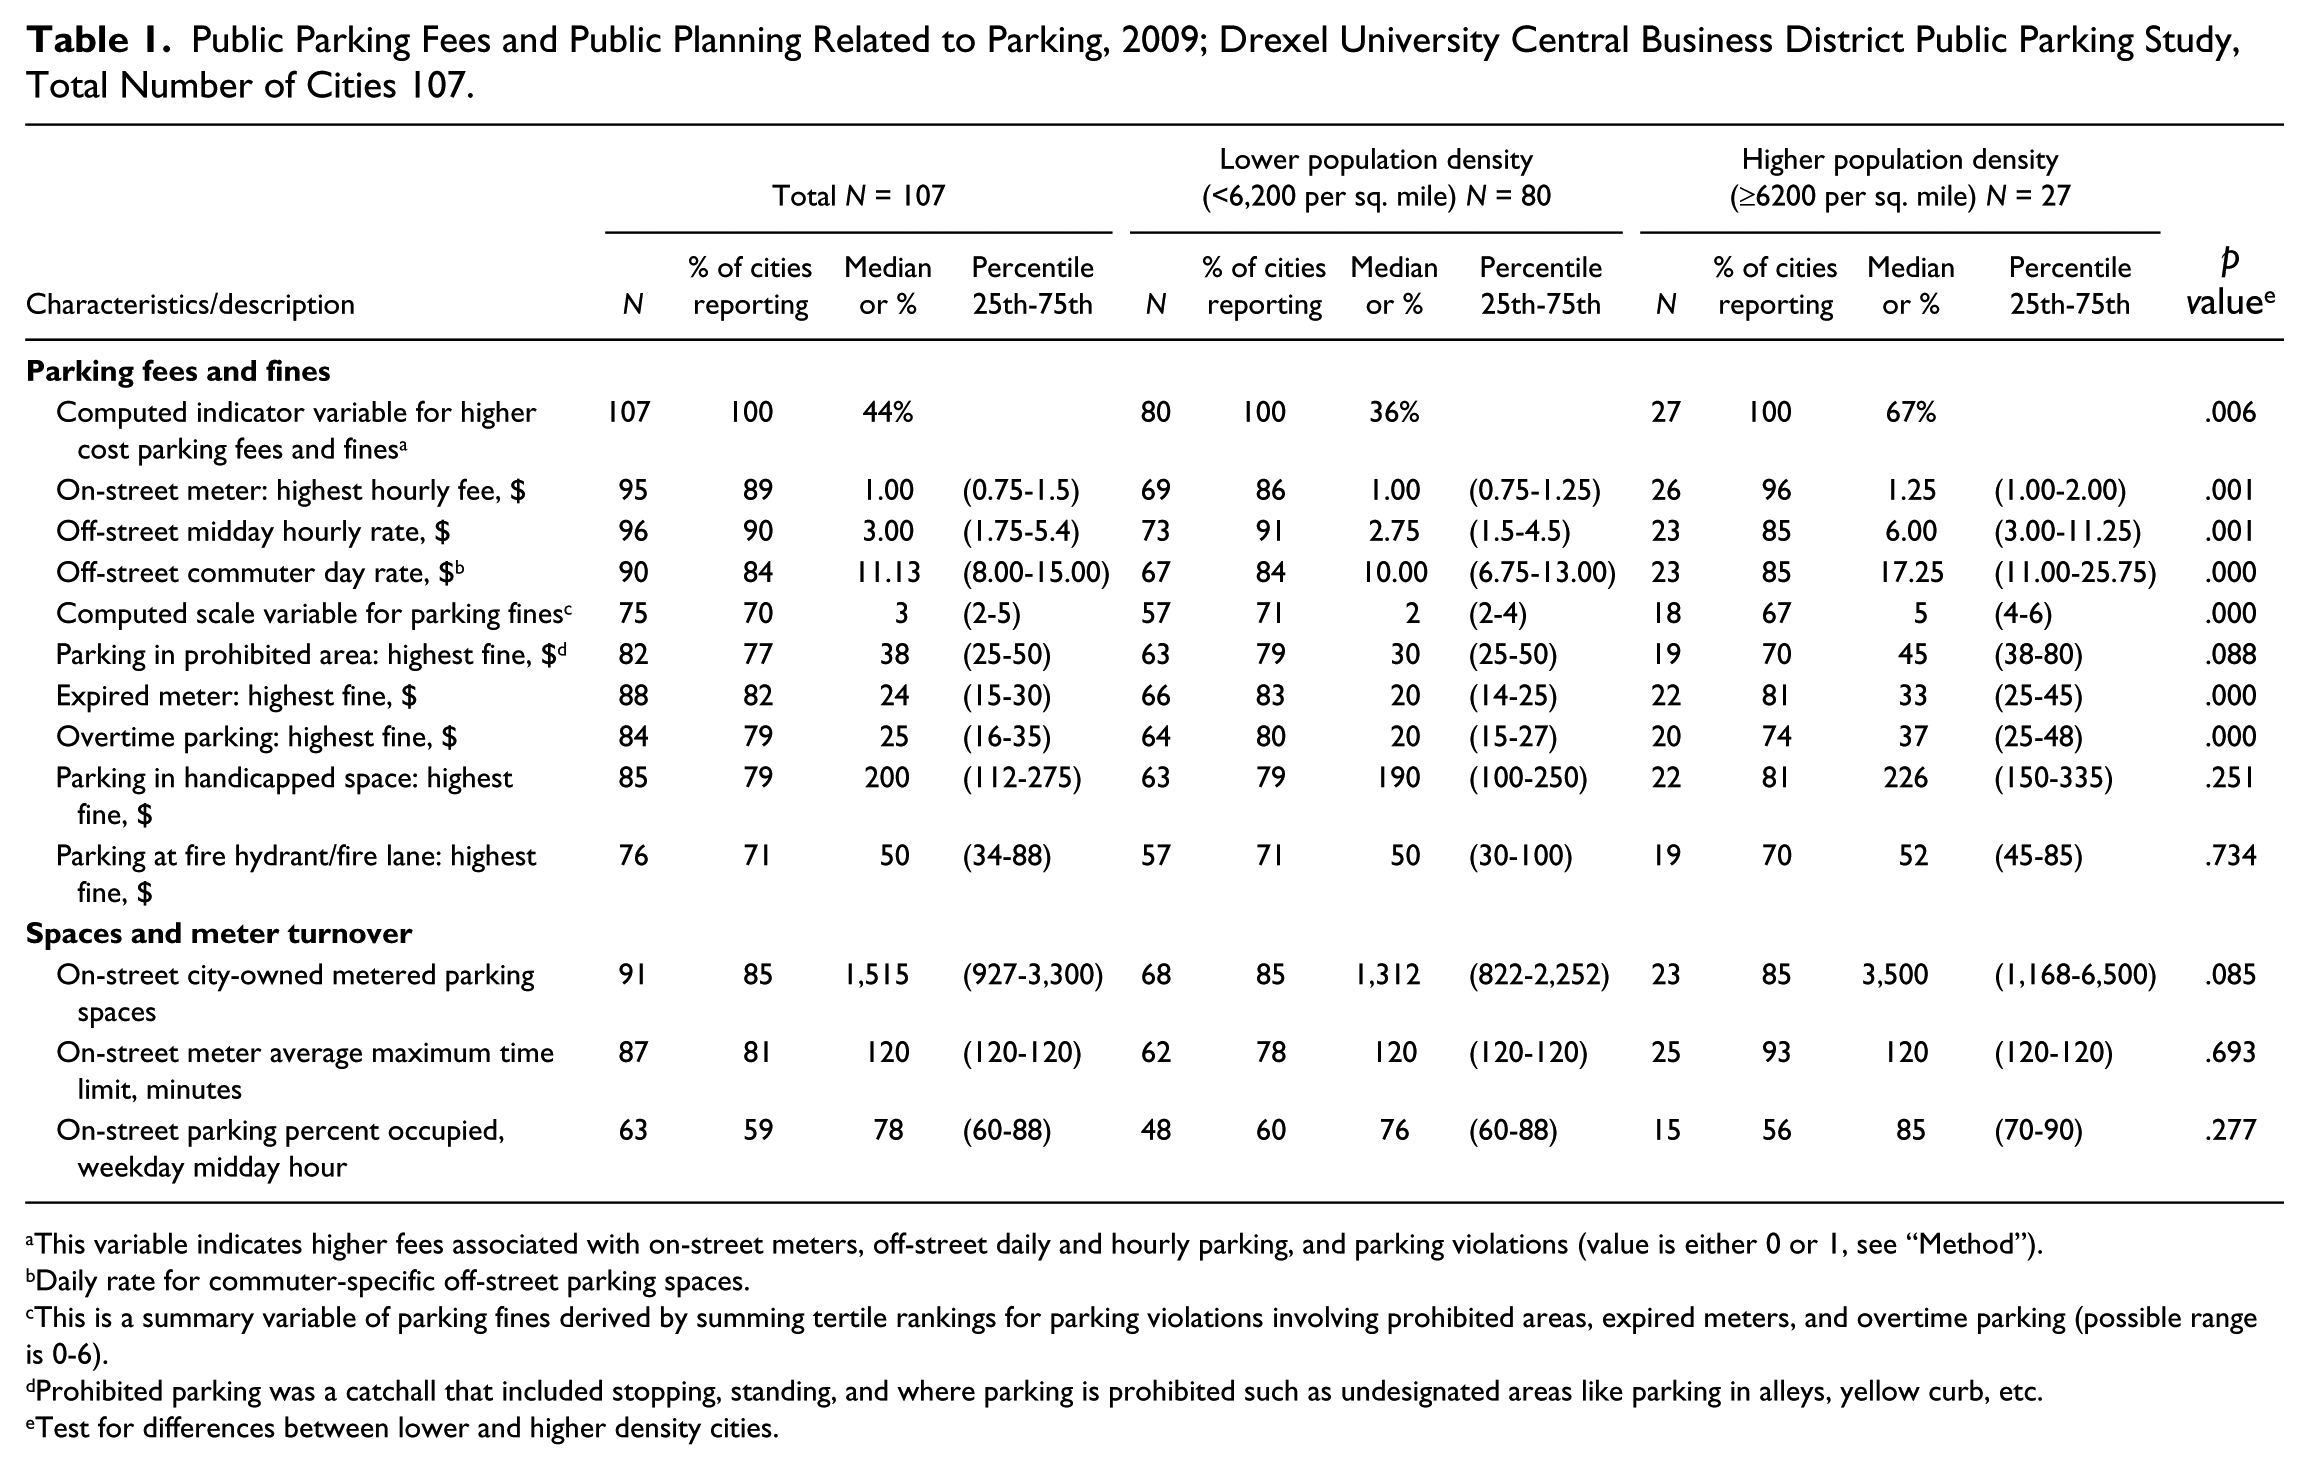
This variable indicates higher fees associated with on-street meters, off-street daily and hourly parking, and parking violations (value is either 0 or 1, see “Method”).
Daily rate for commuter-specific off-street parking spaces.
This is a summary variable of parking fines derived by summing tertile rankings for parking violations involving prohibited areas, expired meters, and overtime parking (possible range is 0-6).
Prohibited parking was a catchall that included stopping, standing, and where parking is prohibited such as undesignated areas like parking in alleys, yellow curb, etc.
Test for differences between lower and higher density cities.
Public Transit Passenger-Miles and Census Data
Public transit passenger-miles traveled in 2009 was obtained from “The Urban Mobility Report,” published by the Texas Transportation Institute (TTI; Schrank, & Lomax, 2010) based on data from the National Transit Database (NTD, 2009). Because TTI data summarized transit miles for urban areas and parking data were collected for cities, a web-based geographical correspondence engine was used to allocate urban area transit miles to city transit miles using population size as the allocation factor (MABLE/GEOCORR Version 1.3.3, August 2010, Office of Social and Economic Data Analysis [OSEDA], 2011). This allocation is defensible due to core central cities having the greatest amount of transit infrastructure (Newman & Kenworthy, 2006).
Census data for incorporated or unincorporated “places” were used for city population density (population per square mile of land), percentage of the population in poverty, retail sales per capita, and number of firms (Census, 2000). A city-level indicator for lower and higher population density (Census, 2010) was created because population density is known to influence walk trips, prevalence of transit, and intensity of parking and transit demand (Ewing & Cervero, 2001). In the literature, approximately 6,000 persons per square mile has been identified as being the density at which there starts to be a significant negative impact on vehicle miles traveled (Federal Highway Administration [FHWA], 2004) and the density at which public transit becomes more feasible to sustain at higher frequency of service (Institute of Transportation Engineers [ITE], 1989). In our dataset, 6,200 persons per square mile was used to differentiate lower and higher density cities (hereafter referred to as “smaller” and “larger” cities) because it approximated the relevant cut point based on the literature (FHWA, 2004; ITE, 1989) and represented the uppermost quartile of the distribution in our sample. This cut point was able to clearly differentiate fees and fines for parking for most cities (see Results section). In preliminary analyses, alternate cut points were examined but parking fees and fines were less differentiated and other cut points were not substantively motivated.
Results
Parking characteristics are reported in Table 1. Among the 107 cities in the sample, 45% (48 cities) had relatively high-cost parking. Parking fees and fines differentiated strongly by population density; almost all of the parking fees and fines differed at probabilities <.000 and for a number of variables, the differentiation was so strong that the 25th to 75th percentiles barely overlapped (see “off-street commuter day rate,” “computed scale variable for parking fines,” and “expired meter highest fine”). Only 36% of smaller cities had higher fees/fines for parking while 67% of larger cities did (Table 1, p = .006). Mean hourly fees at on-street parking meters were low: $1.17 (SD = $0.67) and only about 25% of the largest cities had fees that were $2/hr or more. Off-street parking fees were low for small cities: Median midday hourly and commuter day rates were <$3/hr and $10/day; fees in larger cities were approximately double: $6/hr and >$17/day, respectively.
The average maximum meter time limit for the central business district was 2 hours. Midday peak meter occupancy rates were 85% in larger cities and 76% in smaller cities (but only 60% of cities reported meter occupancy). Larger cities had more meters per capita than smaller cities (11 per 1,000 people vs. 5 per 1,000 people, respectively).
Parking in a handicapped space incurred the highest fines: approximately $200, with fines in five cities ≥$440. Fines for fire hydrant/fire lane parking were approximately $50 (exceeding $115 in five cities). Fines for handicapped and fire hydrant violations were not differential by city size (p > .3) and were not correlated with other violations. The highest fines for prohibited parking, expired meter, and overtime parking violations averaged approximately $35 in larger cities and $25 in smaller cities (prohibited parking had the highest fines: five cities had ≥ $80 fines).
Transit miles were moderately to strongly positively correlated with off-street daily parking rates (pooled sample Spearman rank rho [ρ] ≥.47, Table 2 and Figure 1). Exploratory linear regression models stratified by smaller versus larger city because city size was an effect modifier of the association between parking cost and transit miles (test for interaction p = .0001, see details in Supplement). In larger cities, an indicator variable for higher parking costs was associated with a 2.3-fold adjusted increase in per capita public transit passenger miles, adjusted for state gas price and city economic variables (prevalence of poverty, retail sales per capita, and number of firms): relative difference 2.27, 95% CI [1.18, 4.36]. No statistically significant association with transit miles was observed in smaller cities: relative difference 0.17, 95% confidence interval [0.85, 1.81] (see Supplement text and Supplementary Table 2 available at http://pwm.sagepub.com/supplemental).
Spearman Rank Correlations for Parking Fees, Fines, and Spaces and Meter Turnover. a
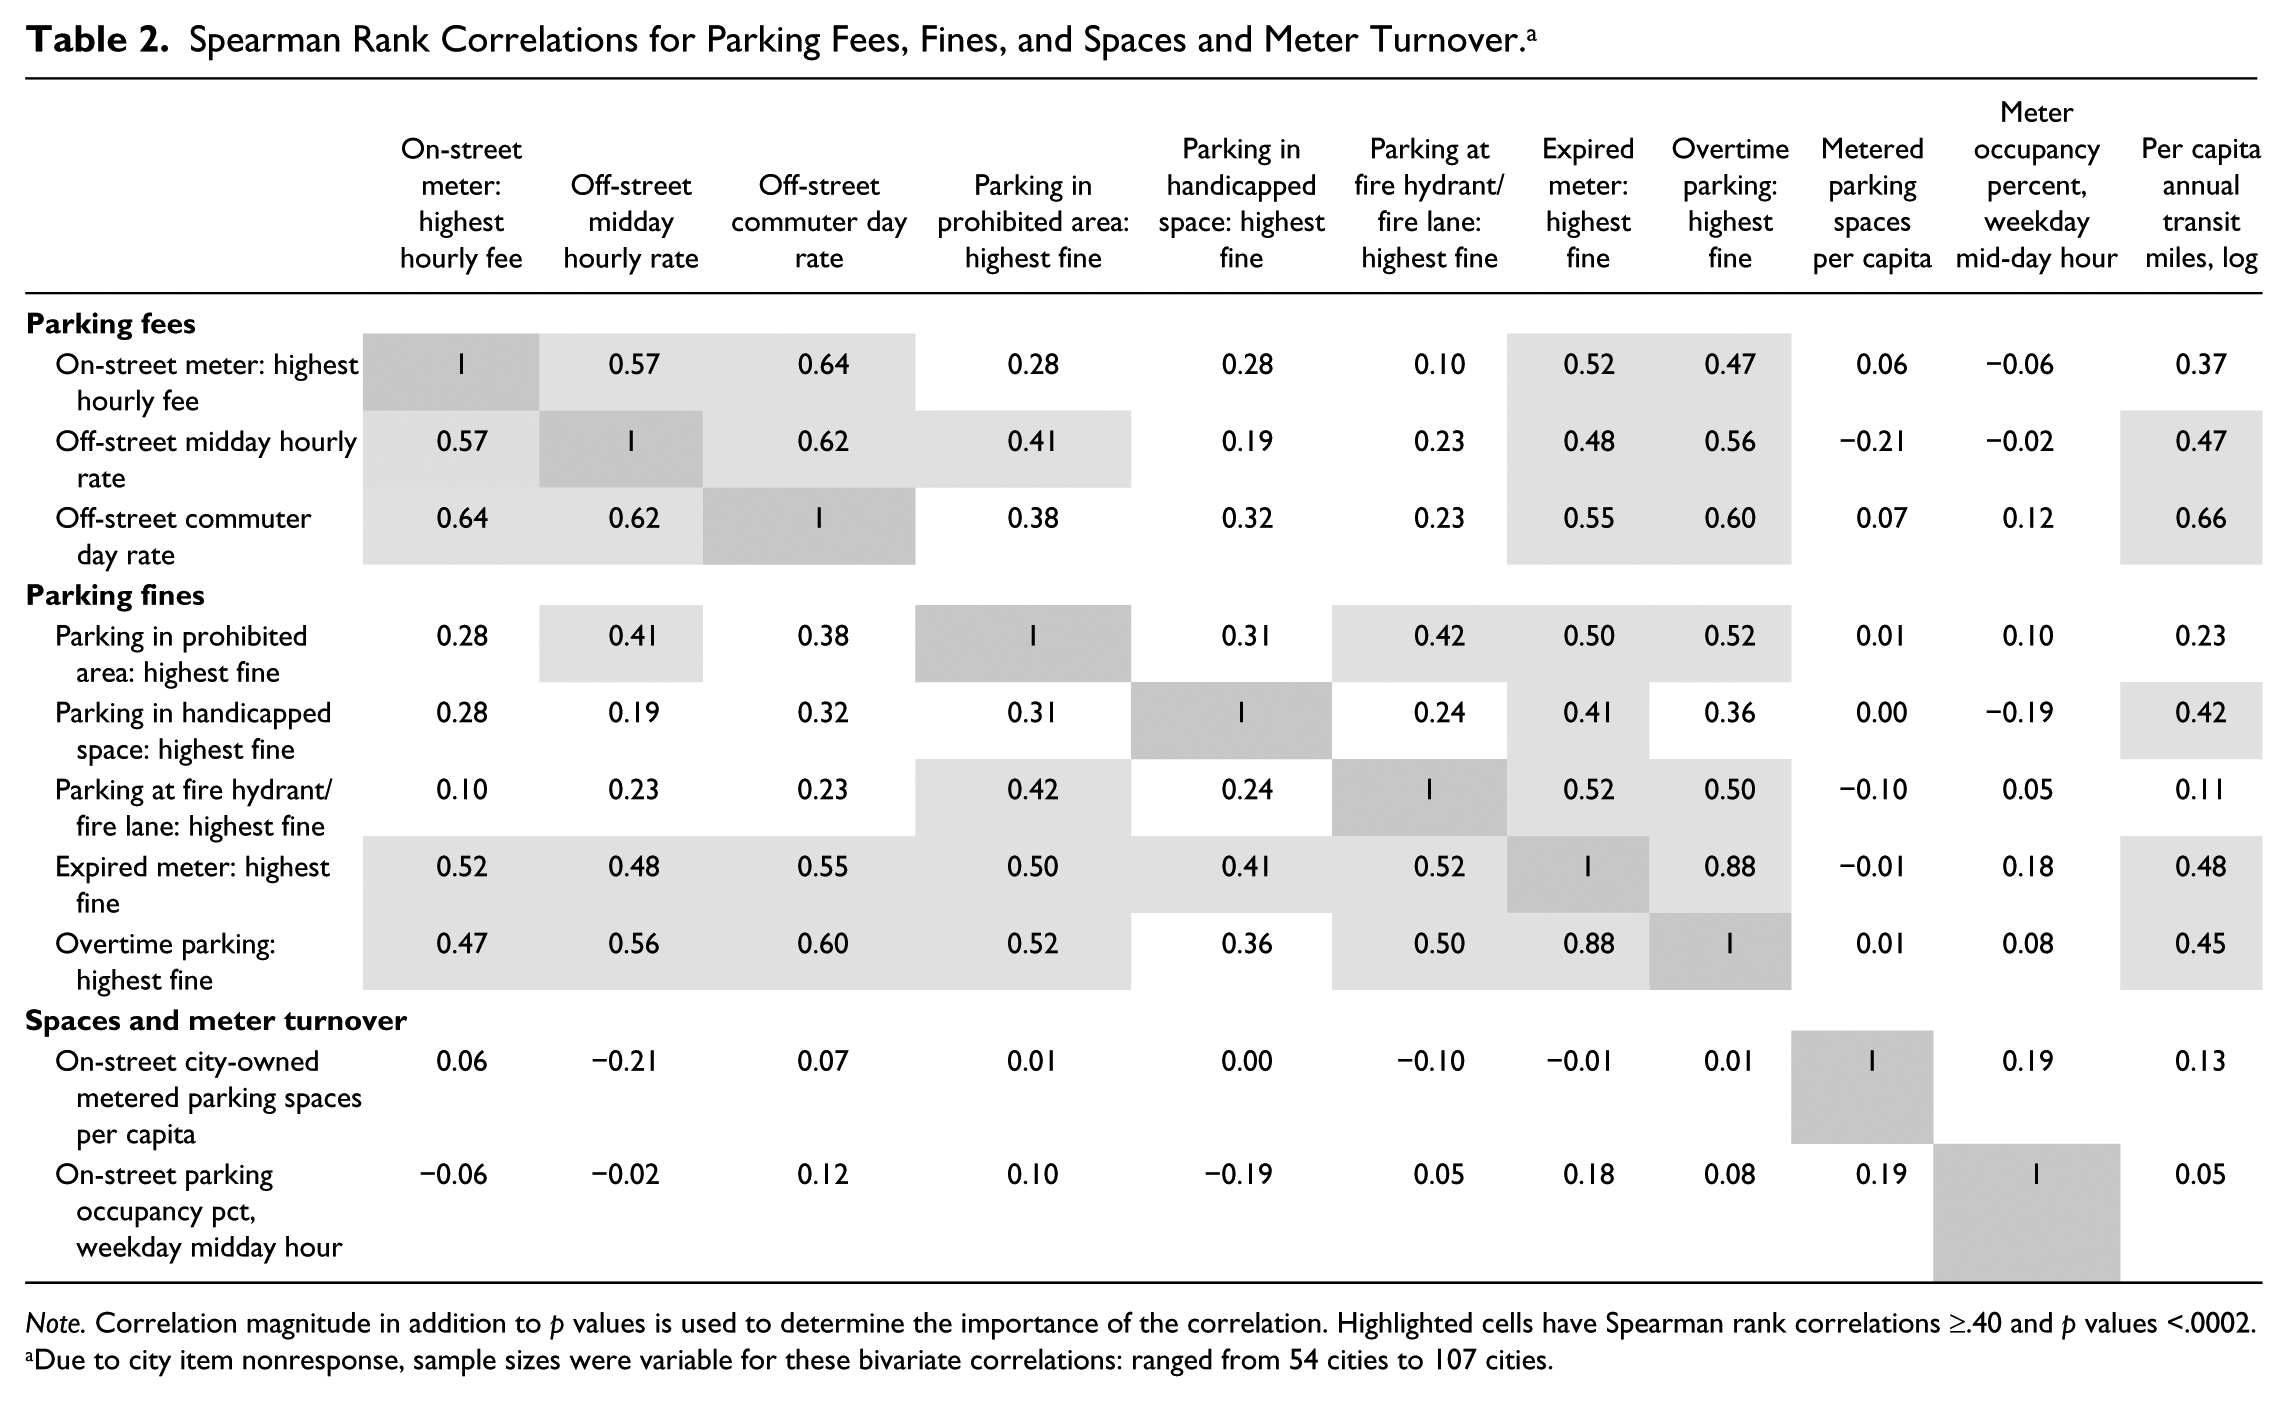
Note. Correlation magnitude in addition to p values is used to determine the importance of the correlation. Highlighted cells have Spearman rank correlations ≥.40 and p values <.0002.
Due to city item nonresponse, sample sizes were variable for these bivariate correlations: ranged from 54 cities to 107 cities.
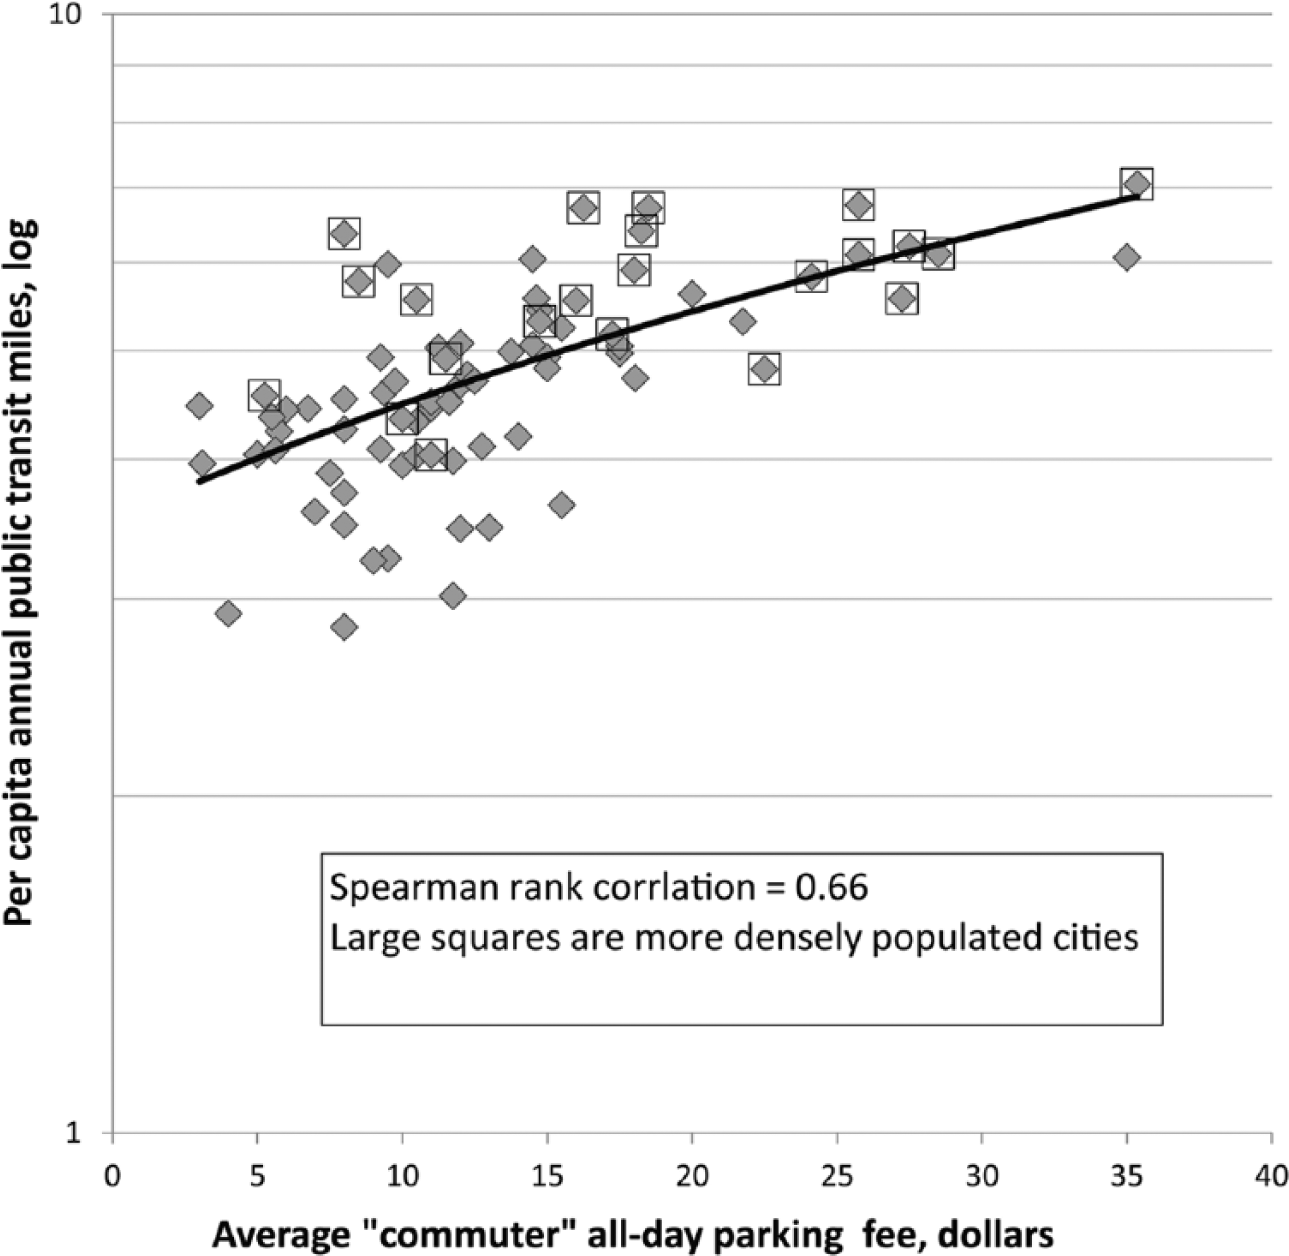
Average all-day parking fee (“commuter rate”) by per capita annual public transit passenger miles, number of cities = 77.
Discussion
Approximately one half of cities had higher cost parking fees/fines, and fees/fines varied by city size particularly for off-street parking where larger cities charged approximately $3 more per hour and $7 more per day. Most on-street meters allowed parking for up to 2 hours and had fairly low fees. Fines for violating parking regulations varied widely; handicapped parking violations far exceeded fire hydrant/lane and other fines for parking violations. Transit miles were moderately to strongly positively correlated with off-street daily parking rates, and an indicator variable for high parking cost was statistically significantly associated with an increase in public transit miles in larger cities.
Results from exploratory analyses suggest that raising the cost of curbside and off-street CBD parking and parking violations may play a role in increasing public transit use in larger cities. Little work has been done with which to compare our results. Recent studies have linked free/reduced cost work-site parking and/or residential parking availability to higher driving probabilities and lower transit use (Badland et al., 2010; Hess, 2001; Weinberger, 2012; Weinberger et al., 2009); however, curbside meter and violation costs have not systematically been linked to travel mode. In the current study, results were adjusted for state-level gas prices and city-level economic features; however, there are myriad interrelated factors not included in these analyses that could contribute to high private vehicle use in the United States and relatively low use of public transportation. Population density was a crude proxy for many features that we lacked data for. Factors not included that could confound the observed relationships were state-level land use policies (Berke et al., 1997) and urban growth boundaries and connectivity (Carruthers, 2002; Nelson, 1999). Other factors not included such as access to transit and transit costs may account for the lack of an association in smaller cities (Basso & Jara-Díaz, 2012; Henk & Hubbard, 1996). In addition, this is a cross-sectional study; thus, it lacks the ability to assess temporality of associations and causality.
While it is logical to think that parking policies could play a stronger role in skewing travel away from the private automobile and toward transit (FHWA, 2009; Litman, 2011; Petiot, 2004), numerous challenges exist to implementing innovative policies. Some parking policies are too costly to enforce (an example is overtime meter violations that require frequent inspection (Adiv & Wang, 1987; Petiot, 2004) and community reliance on automobiles has fostered fierce opposition to increasing the costs and reducing the convenience of parking (Shoup, 2005). In many cities and regions, there is high fragmentation of parking and transportation decision-making (Mitchell-Weaver, Miller, & Deal, 2000; Shoup, 2005). The difficulties this study experienced during data collection serve as a small-scale exemplar of city-level fragmentation: There were multiple agencies (and in some cases private entities) that were involved with data related to public parking and most parking and public works officers knew very little about land use development/zoning for parking or employer cash-out policies or even revenues generated from parking.
Conclusion and Suggestions for Further Research
This exploratory study provides data that can be used by practitioners/planners in public works departments when considering local parking policies. Parking fees/fines varied by city size particularly for off-street parking where larger cities charged much higher prices and where transit use was positively correlated with parking fees/fines. The baseline data reported here can be used to compare future parking data and potentially assess impacts of parking and/or transportation policy on changes in transportation behaviors. This preliminary work sets the stage for future studies that could examine synergies between incentives and disincentives related to supporting nonautomobile transportation.
Footnotes
Acknowledgements
The authors sincerely thank all the city personnel that provided data for this study. Thanks to Jessica Leitzsch, Julia Kuder, Victoria Pham, and Rachel Myers for their assistance with gathering and compiling data for this study and to Robert B. Noland and David Jost for providing guidance.
Declaration of Conflicting Interests
The author(s) declared no potential conflicts of interest with respect to the research, authorship, and/or publication of this article.
Funding
The author(s) disclosed receipt of the following financial support for the research, authorship, and/or publication of this article: Amy Auchincloss received internal support for this study from Drexel University.
Author Biographies
References
Supplementary Material
Please find the following supplemental material available below.
For Open Access articles published under a Creative Commons License, all supplemental material carries the same license as the article it is associated with.
For non-Open Access articles published, all supplemental material carries a non-exclusive license, and permission requests for re-use of supplemental material or any part of supplemental material shall be sent directly to the copyright owner as specified in the copyright notice associated with the article.