
Abstract
Cytochrome P450 1B1 (CYP1B1) is an anticancer therapeutic target due to its overexpression in a number of steroid hormone–related cancers. One anticancer drug discovery strategy is to develop prodrugs specifically activated by CYP1B1 in malignant tissues to cytotoxic metabolites. Here, we aimed to develop an in vitro screening model for CYP1B1-targeted anticancer prodrugs using the KLE human endometrial carcinoma cell line. KLE cells demonstrated superior stability of CYP1B1 expression relative to transiently transfected cells and did not express any appreciable amount of cognate CYP1A1 or CYP1A2, which would have compromised the specificity of the screening assay. The effect of two CYP1B1-targeted probe prodrugs on KLE cells was evaluated in the absence and presence of a CYP1B1 inhibitor to chemically “knock out” CYP1B1 activity (CYP1B1 inhibited). Both probe prodrugs were more toxic to KLE cells than to CYP1B1-inhibited KLE cells and significantly induced G0/G1 arrest and decreased the S phase in KLE cells. They also exhibited pro-apoptotic effects in KLE cells, which were attenuated in CYP1B1-inhibited KLE cells. In summary, a KLE cell–based model has been characterized to be suitable for identifying CYP1B1-targeted anticancer prodrugs and should be further developed and employed for screening chemical libraries.
Introduction
Cytochrome P450 1B1 (CYP1B1) belongs to a superfamily of heme-containing enzymes, cytochrome P450s, which play a central role in the oxidative metabolism of xenobiotics and endogenous compounds. 1 In particular, this enzyme catalyzes the metabolic activation of procarcinogens, such as the polycyclic aromatic hydrocarbons 2 benzo[a]pyrene and 7,12-dimethylbenz[a]anthracene and the estrogenic 17β-estradiol (E2). 3 CYP1B1 is overexpressed in multiple human cancers, including breast, 4 colon, 5 prostate, 6 endometrium, 7 and ovary. 8 Recently, multiple molecular epidemiological studies have corroborated an association between CYP1B1 genetic polymorphisms and cancer risk, especially for steroid hormone–related cancers (i.e., prostate, breast, ovarian, and uterine/endometrial cancers),9-11 where particularly high CYP1B1 expression levels have been observed. 12 Importantly, the enzyme is either absent or expressed at low levels in corresponding normal tissues, making it an attractive target for anticancer therapeutics and chemoprevention.13,14
CYP1B1 and two other enzymes, CYP1A1 and CYP1A2, constitute the CYP1 family. Nearly 40% amino acid sequence identity is shared between them. CYP1B1 and CYP1A1 are predominantly expressed in extrahepatic tissues, whereas CYP1A2 mainly is found in the liver. These CYP1 enzymes have distinct substrate specificities, but do overlap in some cases. 1 For example, both CYP1B1 and CYP1A1 catalyze the hydroxylation of E2. However, CYP1B1 preferentially hydroxylates the C-4 position to form 4E2, 3 whereas CYP1A1 mainly hydroxylates the C-2 position to form 2E2. 15 Since 4E2 has been shown to be carcinogenic in animal models 16 and in human breast 17 and myometrium, 18 CYP1B1 is believed to play an important role in carcinogenesis by activating E2 to 4E2. Furthermore, CYP1B1 also has been shown to contribute to carcinogenesis by activating polycyclic aromatic hydrocarbons to mutagens2,14 and to play a significant role in promoting cancer cell proliferation, progression, and migration in head and neck and endometrial cancers.7,19 However, the development of selective inhibitors for CYP1B1 has been hampered by overlap with CYP1A1 and/or CYP1A2.
An alternative, perhaps more ideal approach for CYP1B1-targeted anticancer strategies is to develop prodrugs specifically activated by CYP1B1 in malignant tissues to cytotoxic metabolites. DMU-135 represents the first such prodrug, designed to be activated by CYP1B1 within tumors to a tyrosine kinase inhibitor. 20 In addition, resveratrol, a natural product found in red wine, is hydroxylated by CYP1B1 to form piceatannol, which has known anticancer properties. 21 Recently, rationally designed prodrugs have also been shown to be bioactivated by CYP1B1, although cytotoxic metabolites were also generated by CYP1A1 and CYP3A4. 22 The discovery of new CYP1B1-activated prodrugs has been hindered by the lack of a relevant drug discovery model to enable screening of large chemical libraries. The human uterus adenocarcinoma cell line KLE, derived from a poorly differentiated endometrial cancer with a defective estrogen receptor, possesses tumorigenic activity in nude mice. 23 Relative CYP1B1 expression in several human endometrial cancer cell lines, including KLE, Ishikawa, HEC-1-B, and RL95-2, has been investigated using real-time PCR; KLE cells had the highest expression. 7 Hence, the human KLE endometrial cancer cell line was selected, in this study, to develop a screening model for CYP1B1-targeted anticancer prodrugs.
To demonstrate the validity of the KLE cell–based screening model, two antiparasitic prodrugs, DB289 and DB844, were employed (
Materials and Methods
Chemicals and Reagents
DB289 (2,5-bis[4-amidinophenyl]furan-bis-O-methylamidoxime) and DB844 (N-methoxy-6-{5-[4-(N-methoxyamidino)phenyl]-furan-2-yl}-nicotinamidine) were kindly provided by the Consortium for Parasitic Drug Development (CPDD; University of North Carolina at Chapel Hill, Chapel Hill, NC). Resazurin sodium salt, α-naphthoflavone (α-NF), 7-ethyl-resorufin (7-ER), resorufin, Triton X-100, DMSO, ammonium bicarbonate, dithiothreitol, iodoacetamide, and D-glucose were purchased from Sigma-Aldrich Co. (St. Louis, MO). Methyl tert-butyl ether (MTBE; high-pressure liquid chromatography [HPLC] grade) was purchased from Fisher Scientific (Pittsburgh, PA). E2, 2E2, and 4E2 standards were purchased from Steraloids, Inc. (Newport, RI). Dulbecco’s modified Eagle’s medium (DMEM), DMEM/F-12 (1:1), Williams’ E medium (WME), TrypLE Express, fetal bovine serum (FBS), GlutaMax, Lipofectamine 2000, and TRIzol reagent were purchased from Life Technologies (Carlsbad, CA). High Capacity cDNA Reverse Transcription kits were purchased from Applied Biosystems (Foster City, CA). Human CYP1B1 plasmid DNA (CYP1B1-pCMV6-Entry) and pCMV10 empty vector were purchased from OriGene Technologies, Inc. (Rockville, MD). A Light Cycler 480 SYBR Green I master kit was purchased from Roche Applied Science (Foster City, CA). MVP human liver total RNA (cat. no. 540017; A260/A280 ≥ 1.8; pool of three donors, male and female, ages 30, 44, and 55) was purchased from Agilent Technologies (Santa Clara, CA). A BCA protein assay kit was purchased from Pierce Biotechnology (Rockford, IL). A BioRad protein estimation kit was purchased from BioRad (Hercules, CA). BD Pharmingen PI/RNase staining buffer and Annexin V-FITC Apoptosis Detection Kit I were purchased from BD Biosciences (San Jose, CA).
Cell Culture
KLE and HEK293T (human embryonic kidney cell line) cells were purchased from American Type Culture Collection (Manassas, VA). HepaRG (human hepatoma cell line) cells and additives for HepaRG Growth and Differentiation mediums were purchased from Biopredic International (Overland Park, KS). KLE and HEK293T cells were cultured in DMEM/F-12 (1:1) medium and DMEM, respectively, supplemented with 10% (v/v) FBS. HepaRG cells were cultured in Growth medium (WME supplemented with GlutaMax and HepaRG Growth Medium Supplement) for 2 weeks, followed by another 2 weeks in Differentiation medium (WME supplemented with GlutaMax and HepaRG Differentiation Medium Supplement). All cell lines were maintained at 37 °C in 5% CO2 and 95% humidity. Medium was refreshed twice a week for KLE cells and once every other day for HEK293T and HepaRG cells. Cells were harvested and passaged at 70%−80% confluence using TrypLE Express. α-NF, a potent CYP1B1 inhibitor, was added to culture medium to “knock out” CYP1B1 catalytic activity in KLE cells, creating CYP1B1-inhibited KLE cells.
Transient Transfection in HEK293T Cells
The transfection of HEK293T cells was performed with Lipofectamine 2000. Briefly, 10 µg of CYP1B1 plasmid DNA (or pCMV10 empty vector) and 25 µL of Lipofectamine 2000 were added to separate tubes, each containing 500 µL of serum-, antibiotic-, and phenol red–free DMEM and incubated at room temperature for 5 min. The DNA and lipofectamine-containing DMEM then were mixed into one tube and incubated for an additional 20 min. The mixture (1 mL) was added to a 10 cm dish of HEK293T cells at 70%−80% confluence to initiate transfection (time zero posttransfection). After a 6 h incubation at 37 °C/5% CO2, the medium was replaced with fresh culture medium and changed every other day thereafter.
Reverse Transcription and Real-Time PCR
Total RNA was isolated from KLE, differentiated HepaRG, and HEK293T cells in 12-well tissue culture plates using TRIzol reagent according to the manufacturer’s protocol. The concentration and purity of RNA were determined using a Nanodrop ND1000 spectrophotometer (Nanodrop Technologies, Wilmington, DE). One microgram of RNA was then reverse transcribed to cDNA using a High Capacity cDNA Reverse Transcription kit. After the first-strand cDNA synthesis, 50 ng of cDNA was amplified by real-time PCR using the LightCycler 480 SYBR Green I Master mix on an Applied Biosystems 7500 Fast real-time PCR system to evaluate CYP1B1, CYP1A1, and CYP1A2 expression. The primer sequences used in this study were 5′-CTGTCTTGGGCTACCACATT-3′ (forward) and 5′-GGATCAAAGTTCTCCGGGTTAG-3′ (reverse) for CYP1B1, 5′-GTTCTACAGCTTCATGCAGAAGATG-3′ (forward) and 5′-TTGGCGTTCTCATCCAGCT-3′ (reverse) for CYP1A1, and 5′-CTGTGGTTCCTGCAGAAAACAG-3′ (forward) and 5′-CCCTTCTTGCTGTGCTTGAAC-3′ (reverse) for CYP1A2. The mixture was amplified using the following conditions: 95 °C for 10 min, then 40 cycles of 95 °C for 10 s and 60 °C for 35 s. Target gene expression was normalized to β-actin expression in each sample. The comparative threshold method was used to calculate the relative amount of mRNA in comparison with other samples.
Ethoxyresorufin-O-Deethylase Activity Assay
Cells were incubated with DMEM/F12 culture medium (FBS- and phenol red–free) containing 0.8 µM 7-ER at 37 °C and 5% CO2 for 1 h. After the incubation, culture plates were read on an Infinite 200 PRO multimode reader (TECAN US, Inc., Morrisville, NC) to determine fluorescence intensity at 565 nm (excitation) and 595 nm (emission). The total cellular protein amount was used to normalize ethoxyresorufin-O-deethylase (EROD) activity.
E2 Hydroxylation Assay
KLE cells (day 11 postseeding; grown in phenol red–free DMEM/F12 culture medium containing 10% FBS on a 10 cm cell culture dish) were incubated with E2 (10 μM in the complete culture medium; 2.0 mL) at 37°C and 5% CO2 for 0, 20, and 60 min. At the end of incubation, cells and medium were mixed with MTBE (10 mL) to extract E2 hydroxylation metabolites and samples were reconstituted with isopropanol–water (1:1 v/v; 200 μL) prior to HPLC–tandem mass spectrometry (MS/MS) analysis as described previously with modifications. 26 E2, 2E2, and 4E2 were separated on an Agilent Zorbax Bonus-RP column (2.1 × 150 mm, 5 μm). HPLC mobile phases consist of (A) water containing 0.1% formic acid and (B) acetonitrile containing 0.1% formic acid. After 1.0 min initial hold at 50% B, HPLC gradient increased to 70% B in 1 min and 95% in 0.05 min and remained at 95% B for 1.5 min before reequilibration at 50% B. Flow rate was constant at 0.5 mL/min. The characteristic multiple reaction monitoring (MRM) transitions were 255.17→144.08 (positive ions for E2) and 287.24→161.23 (negative ions for 2E2 and 4E2). E2, 2E2, and 4E2 eluted at 2.7, 2.0, and 2.2 min, respectively. Metabolite identities were confirmed by comparing retention times to those of synthetic standards.
Targeted Quantitative Proteomic Method for Protein Quantification
KLE cells (10 cm cell culture dish) were resuspended in a fractionation buffer (300 µL) containing 250 mM sucrose, 10 mM HEPES, 10 mM KCl, 1 mM EDTA, 1.5 mM MgCl2, 1 mM dithiothreitol, and protease inhibitor cocktail (cOmplete, EDTA-free; Roche, Mannheim, Germany). Total cell lysates were obtained by passing the cell suspension 10 times through a 27-gauge needle, resting 10 min on ice, followed by another 10 passes. The resulting cell lysates were subjected to stepwise differential centrifugation to prepare microsomes: 10 min at 9000g and 60 min at 150,000g, prior to resuspension of the final pellet in the fractionation buffer without the protease inhibitor cocktail. Microsomal protein content was determined using a BCA Protein Assay kit (Pierce).
Targeted proteomic quantification of CYP1B1, CYP1A1, and CYP1A2 protein levels in microsomal fractions was performed as described previously for other CYP enzymes with minor modifications.27,28 Briefly, protein samples (30 μg) were reduced in an ammonium bicarbonate buffer (pH 8.0; 50 mM final concentration) containing dithiothreitol (4 mM final concentration) and heated at 60 °C for 60 min to denature the proteins. After cooling to room temperature, the samples (90 μL total volume) were alkylated with iodoacetamide (10 mM final concentration) for 20 min in the dark and then digested with 1 µg of trypsin at 37 °C for 4 h. Recombinant human CYP1A1, CYP1A2, and CYP1B1 Supersomes of known concentrations (Corning Gentest, Woburn, MA) were used to create calibration standards (ranging from 0.002 to 5 pmol/digestion). All reactions were carried out in Protein LoBind microcentrifuge tubes (Eppendorf, Hamburg, Germany) to minimize protein or peptide loss due to binding. Reactions were quenched with storage at −80 °C. The signature peptide sequences used were ELVALLVR for CYP1B1, GFYIPK for CYP1A1, and YLPNPALQR for CYP1A2. A mixture of stable isotope–labeled signature peptides (1 µL; Thermo Scientific, Ulm, Germany) were spiked into thawed samples as internal standards prior to loading onto an autosampler (6 °C) for ultra-high-pressure liquid chromatography (UPLC)–MS/MS analysis as described previously.27,28 MRM transitions during UPLC-MS/MS analysis were m/z 456.8→571.4 for ELVALLVR, m/z 362.7→357.3 for GFYIPK, and m/z 536.6→584.4 for YLPNPALQR. The lower limit of quantification was 0.07 pmol CYP1B1, CYP1A1, or CYP1A2 per milligram of microsomal protein.
Cytotoxicity Assay
Cytotoxicity was measured with a resazurin assay. Briefly, cells were seeded at 5000 cells per well in a 96-well plate and maintained in a 5% CO2 incubator at 37 °C for 7 days for KLE and 24 h for HEK293T cells. Transfected HEK293T cells were treated with a probe prodrug at 48 h posttransfection. Drug treatment was initiated by adding prodrug-containing culture medium (0–100 µM; 100 µL/well) in the absence or presence of α-NF (10 µM). Treatment medium was changed every day. After a 69 h incubation with drug, cytotoxicity was determined by adding 20 µL of resazurin reagent (0.01% [w/v] resazurin sodium salt in phenol red–free DMEM) per well for an additional 3 h incubation (a total of 72 h incubation with drug). Fluorescence intensity was measured at 565 nm (excitation) and 595 nm (emission) using an Infinite 200 PRO multimode reader. IC50 values (drug concentration resulting in 50% cell death) were determined using the variable slope inhibitory dose–response curve (Prism 5.0; GraphPad Software, San Diego, CA). Vehicle (0.1% [v/v] DMSO) and Triton X-100 (2% [v/v]) were used as negative and positive controls, respectively.
Cell Cycle Analysis
The effect of probe prodrugs on KLE cell cycle was analyzed using a propidium iodide (PI) staining assay according to the manufacturer’s protocol. Briefly, on day 7 postseeding into six-well tissue culture plates, KLE cells were treated with 10 or 100 µM prodrug in the absence or presence of α-NF (10 µM) for 72 h. Untreated cells were incubated without prodrug. Cells were harvested and fixed with 70% (v/v) ethanol and kept at −20 °C overnight. PI staining was done at room temperature for 30 min before flow cytometry analysis (MoFlo XDP FACS; Beckman Coulter, Brea, CA). Data were analyzed using FlowJo software (version X.0.7; FLOWJO, LLC, Ashland, OR).
Apoptosis Assay
The induction of apoptosis in KLE cells by probe prodrugs was analyzed using an Annexin V-FITC Apoptosis Detection kit according to the manufacturer’s protocol. In all experiments, KLE cells were seeded in six-well tissue culture plates and used on day 7 postseeding. In the first experiment, cells were treated with 50 µM DB289 or DB844 in the absence of α-NF for 24, 48, and 72 h. In the second experiment, cells were treated with 10, 50, and 100 µM DB289 or DB844 in the absence of α-NF for 72 h. Lastly, cells were treated with 50 µM DB289 or DB844 in the presence of α-NF (10 µM) for 24, 48, and 72 h. Untreated cells were incubated without prodrug. After the incubation, cells were collected and double stained with Annexin V and PI before flow cytometry analysis. Data were analyzed to determine viable, early apoptotic, and late apoptotic/necrotic cell populations.
Statistical Analysis
All experiments were conducted in triplicate or quadruplicate, unless noted otherwise. Student t tests (two-tailed, unpaired) were used to compare pairs of measurements (e.g., effect of phenol red, effect of prodrugs on KLE and KLE-null cells, and effect of α-NF on pro-apoptotic effect of prodrugs in KLE cells). One-way analysis of variance (ANOVA) was used to compare multiple groups of measurements (e.g., pro-apoptotic effect of prodrugs at various conditions and effect of prodrugs on KLE cell cycle). All statistical analyses were performed using Prism 5.0, and p < 0.05 was considered significant.
Results
Effect of Culture Conditions on CYP1B1, CYP1A1, and CYP1A2 Expression in KLE Cells
Since phenol red can have weak estrogenic activity 29 and CYP1B1 and CYP1A1 are regulated in part by the estrogen receptor,30,31 it is necessary to determine the effect of phenol red on CYP1 expression in KLE cells. Hence, CYP1B1, CYP1A1, and CYP1A2 expression in KLE cells were evaluated at different days postseeding in the absence and presence of phenol red ( Fig. 1 ). Phenol red had little effect on CYP1B1 expression ( Fig. 1A ). In contrast, it markedly induced CYP1A1 expression ( Fig. 1B ) and had variable effects on CYP1A2 expression ( Fig. 1C ). Despite the marked induction of CYP1A1 mRNA expression, EROD activity in KLE cells remained largely unchanged or slightly decreased due to the presence of phenol red ( Fig. 1D ). Since CYP1A1 is known to catalyze the EROD reaction, this suggests that induced CYP1A1 mRNA expression was either not translated to protein expression or not translated to a level significant enough to alter the overall EROD activity in KLE cells. In addition, CYP1B1 expression steadily increased from day 5 to day 9 postseeding and remained relatively high through day 13 postseeding ( Fig. 1A ). EROD activity generally tracked with CYP1B1 expression with a 1- to 2-day lag time, likely due to a delay in protein production relative to gene transcription. Based on these findings, KLE cells were cultured in phenol red–free medium in subsequent experiments to avoid CYP1A1 induction and EROD inhibition. In addition, KLE cells from day 7 postseeding were used in subsequent experiments when higher CYP1B1 expression and function were desired.
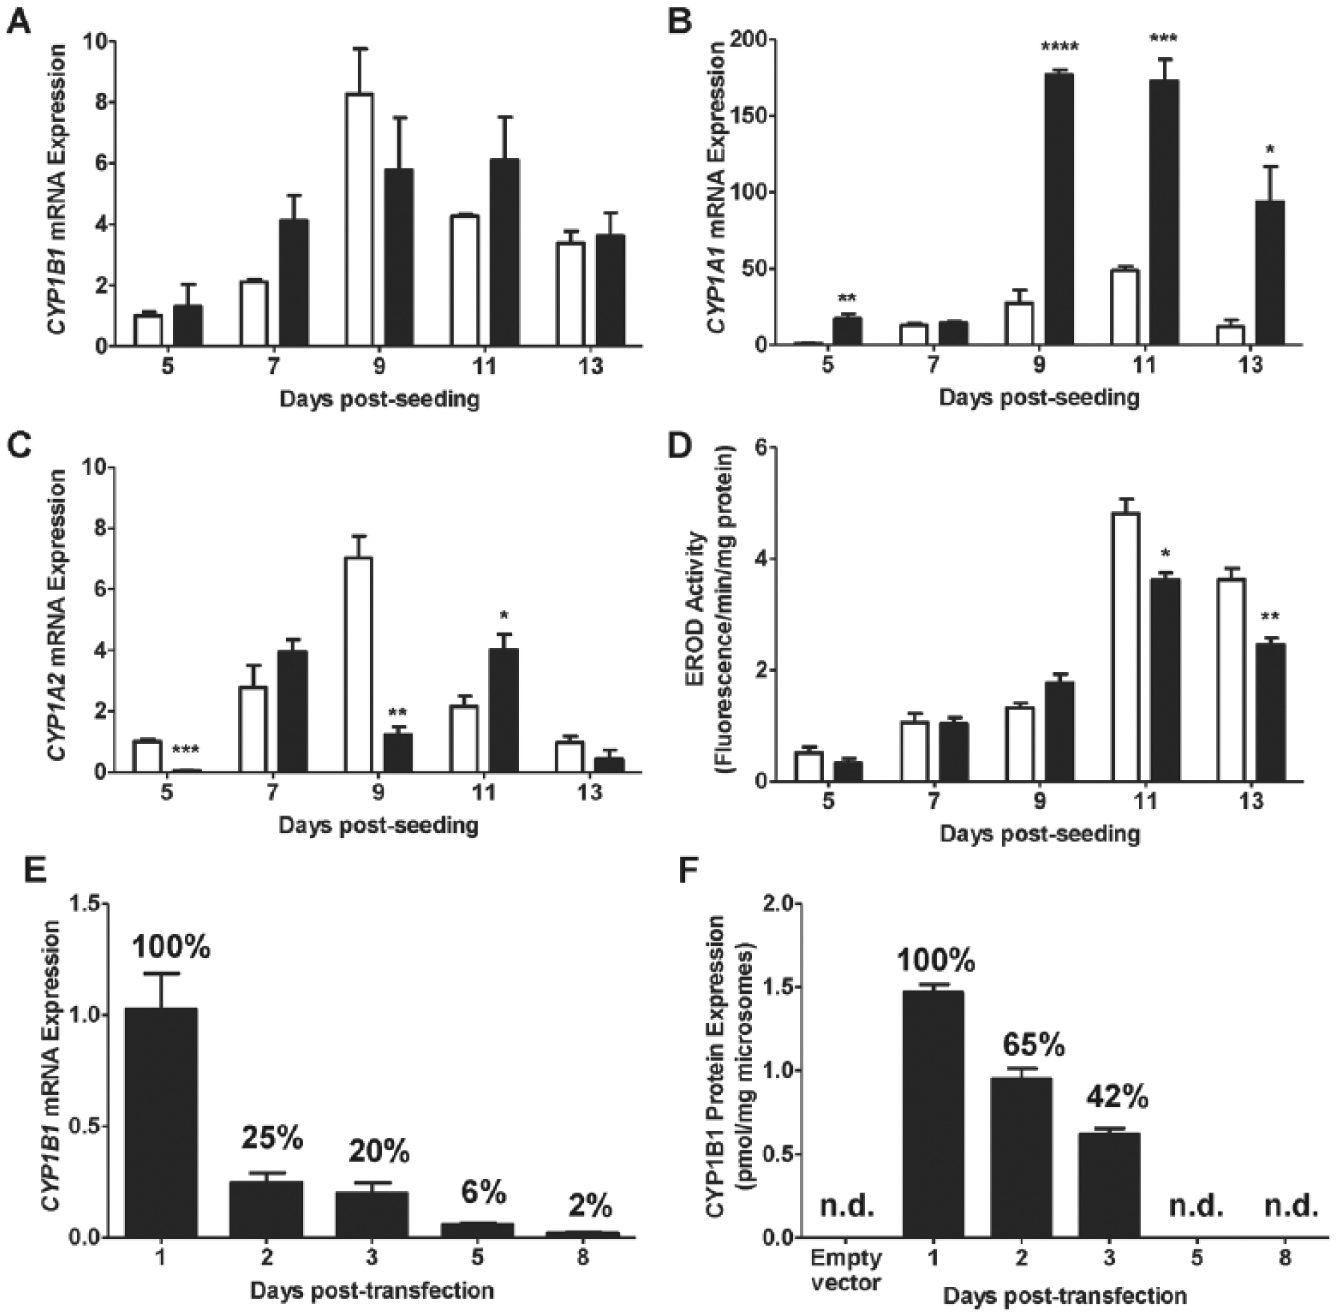
Effect of phenol red and culture time on gene expression of (
CYP1B1 Gene and Protein Expression in Transiently Transfected HEK293T Cells
CYP1B1 gene expression reached the highest level at 24 h posttransfection in transiently transfected HEK293T cells ( Fig. 1E ). However, it diminished quickly afterwards to 25% on day 2, 6% on day 5, and 2% on day 8. CYP1B1 protein also was highest at 24 h posttransfection (1.5 pmol/mg microsomes) and decreased to 65% on day 2 and 42% on day 3 ( Fig. 1F ). It was below the limit of detection (0.07 pmol/mg microsomes) in samples from empty vector controls and day 5 and day 8 posttransfection.
Comparison of CYP1B1, CYP1A1, and CYP1A2 Expression in Human Liver, Differentiated HepaRG, KLE, and Transfected HEK293T Cells
CYP1B1 expression was highest in transiently transfected HEK293T cells 24 h posttransfection, followed by KLE cells at day 9 postseeding ( Fig. 2A ). Substantially lower levels of CYP1B1 were found in differentiated HepaRG cells and human liver. In contrast, CYP1A1 and CYP1A2 expressions were lowest in KLE cells, but highest in differentiated HepaRG cells and human liver, respectively.
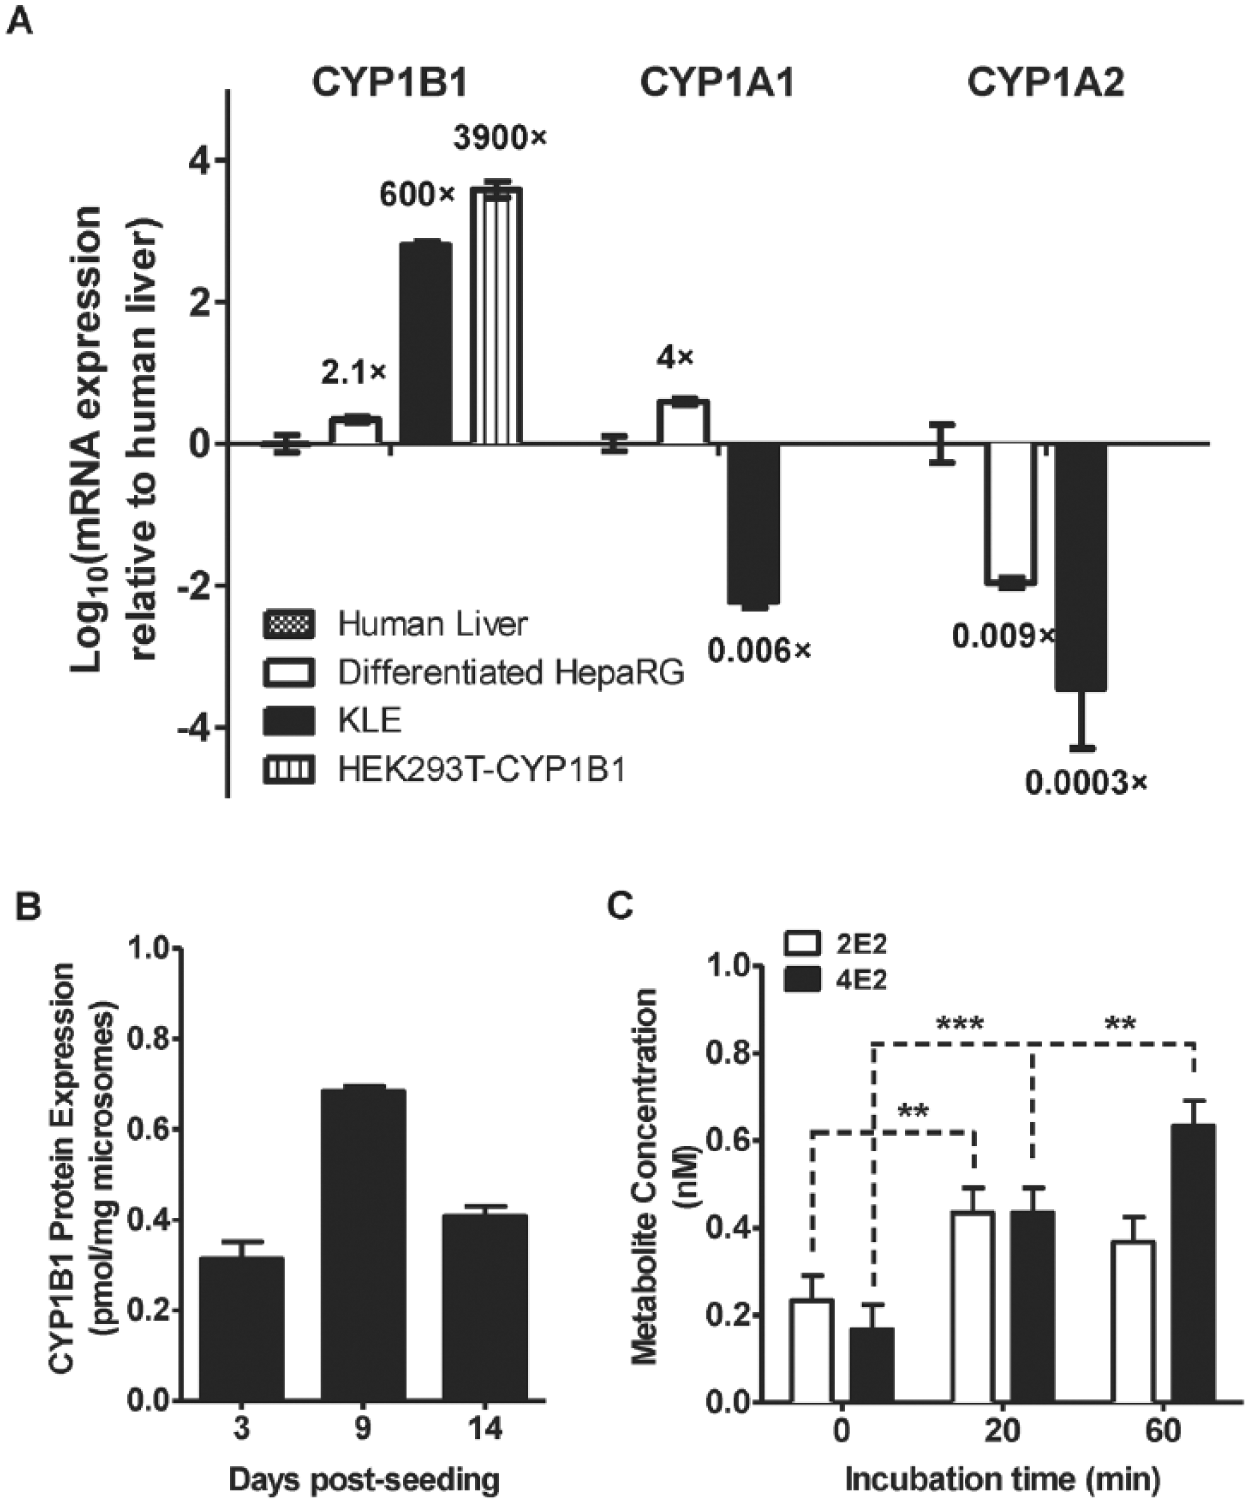
Relative gene expression (
CYP1B1 Protein Expression and Activity in KLE Cells
CYP1B1 protein expression increased from day 3 to day 9 postseeding (0.31 vs. 0.68 pmol/mg microsomes) and remained high on day 14 postseeding (0.41 pmol/mg microsomes) ( Fig. 2B ). In contrast, CYP1A1 and CYP1A2 were not detected at the protein level in all KLE cell samples. Furthermore, CYP1B1-specific 4E2 formation was detected in KLE cells ( Fig. 2C ).
Inhibition of CYP1B1 Activity in KLE Cells by α-NF
α-NF is a potent noncompetitive inhibitor (Ki = 2.8 nM) of CYP1B1 catalytic activity, 32 but also potently inhibits CYP1A1 and CYP1A2. Here, we used it to inhibit the CYP1B1 activity of KLE cells in order to create CYP1B1-inhibited KLE cells. α-NF (1 µM) inhibited the EROD activity of KLE cells by 81% over a 24 h incubation as measured by the area under the EROD fluorescence–incubation time curves ( Fig. 3A ). In addition, α-NF, up to 15 µM, did not show any cytotoxic effect on KLE cells ( Fig. 3B ).
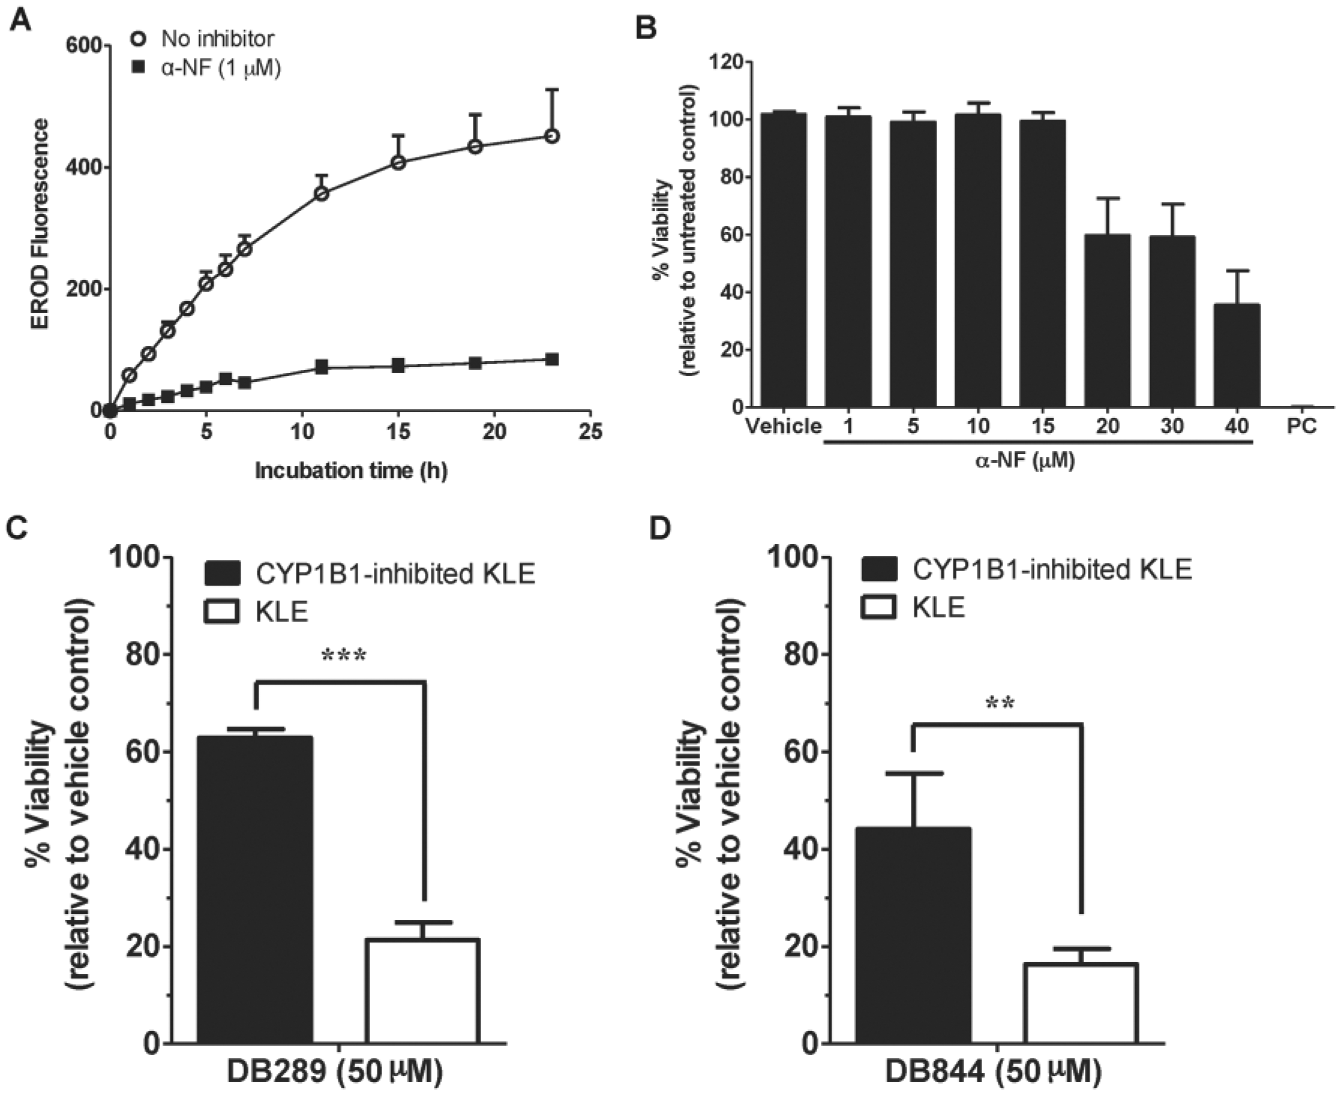
Inhibitory (
Differential Cytotoxicity of CYP1B1-Targeted Probe Prodrugs in KLE Cells and CYP1B1-Inhibited KLE Cells
Two probe prodrugs, DB289 and DB844, were used in this study to validate the KLE cell–based model for screening CYP1B1-targeted anticancer prodrugs. Both probe prodrugs (50 μM) were more toxic to KLE cells than to CYP1B1-inhibited KLE cells (21% vs. 62% viability for DB289 and 16% vs. 44% viability for DB844) ( Fig. 3C , D ). Furthermore, cytotoxicities (IC50 values) of DB289 and DB844 were determined for KLE cells, CYP1B1-transfected HEK293T cells, wild-type HEK293T cells, and HepaRG cells in the absence or presence of 10 μM α-NF ( Table 1 ). Results showed that only KLE cells demonstrated a moderate difference (1.2- to 1.5-fold) in IC50 values in response to CYP1B1 inhibition by α-NF.
Differential Cytotoxicity (IC50) of Probe Prodrugs DB289 and DB844.
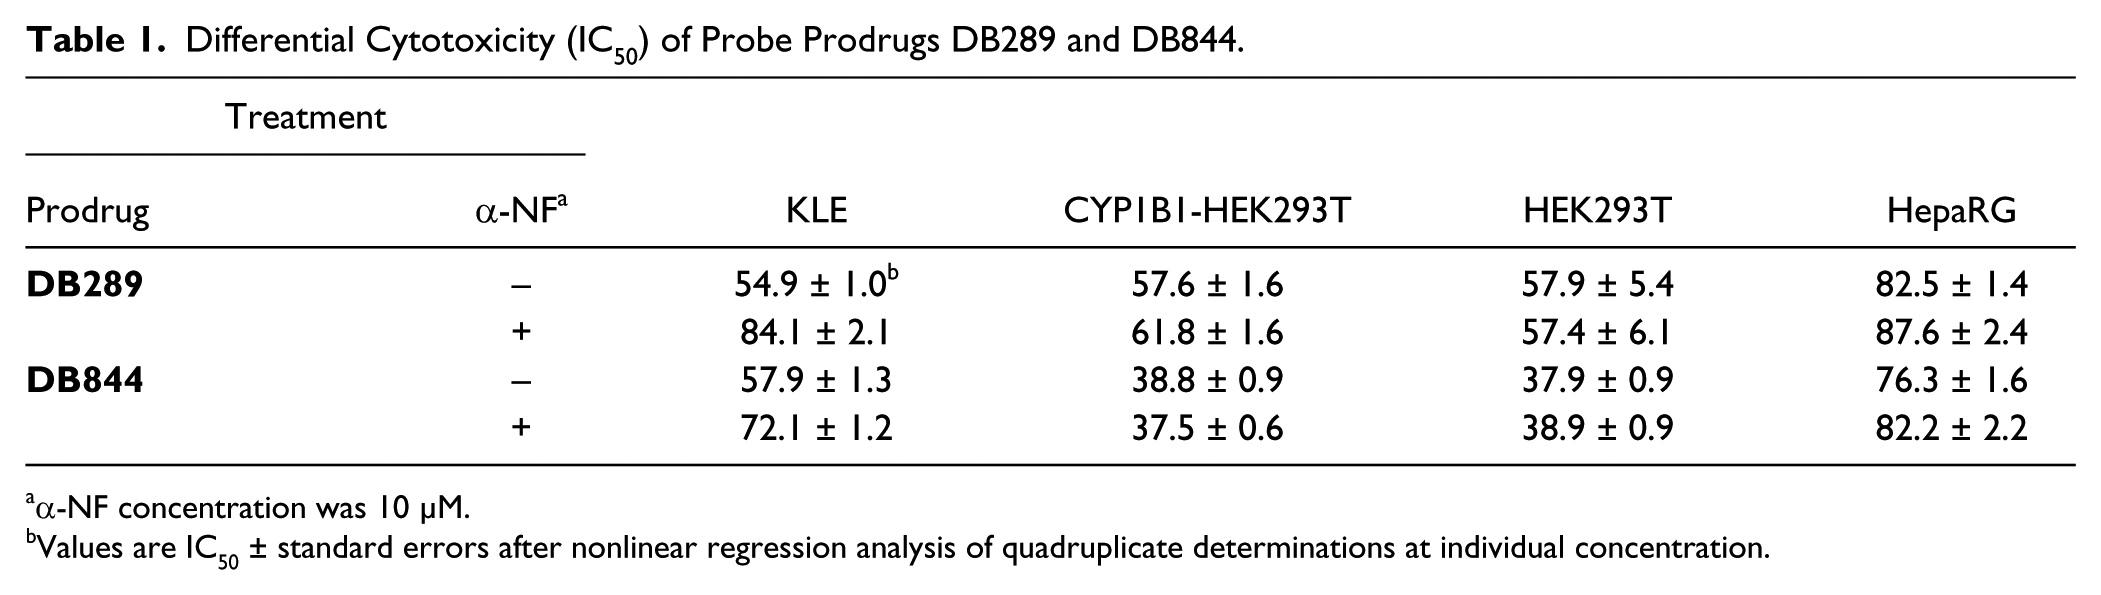
α-NF concentration was 10 µM.
Values are IC50 ± standard errors after nonlinear regression analysis of quadruplicate determinations at individual concentration.
Effect of Probe Prodrugs on Cell Cycle in KLE Cells and CYP1B1-Inhibited KLE Cells
To determine if alterations in the cell cycle contributed to the differential cytotoxicities of the probe prodrugs toward KLE cells and CYP1B1-inhibited KLE cells, cell cycle analysis was performed on cells treated with DB289 or DB844 (10 and 100 μM) for 72 h. Percent cell populations in various stages of the cell cycle are summarized in Table 2 . Both DB289 and DB844 induced a concentration-dependent G0/G1 cell cycle arrest in KLE cells, as well as a reduction in the S phase population, compared with untreated cells. However, these cell cycle effects were absent in CYP1B1-inhibited KLE cells, suggesting a requirement for CYP1B1 activity.
Cell Cycle Analysis of KLE Cells Treated with Probe Prodrugs DB289 and DB844.
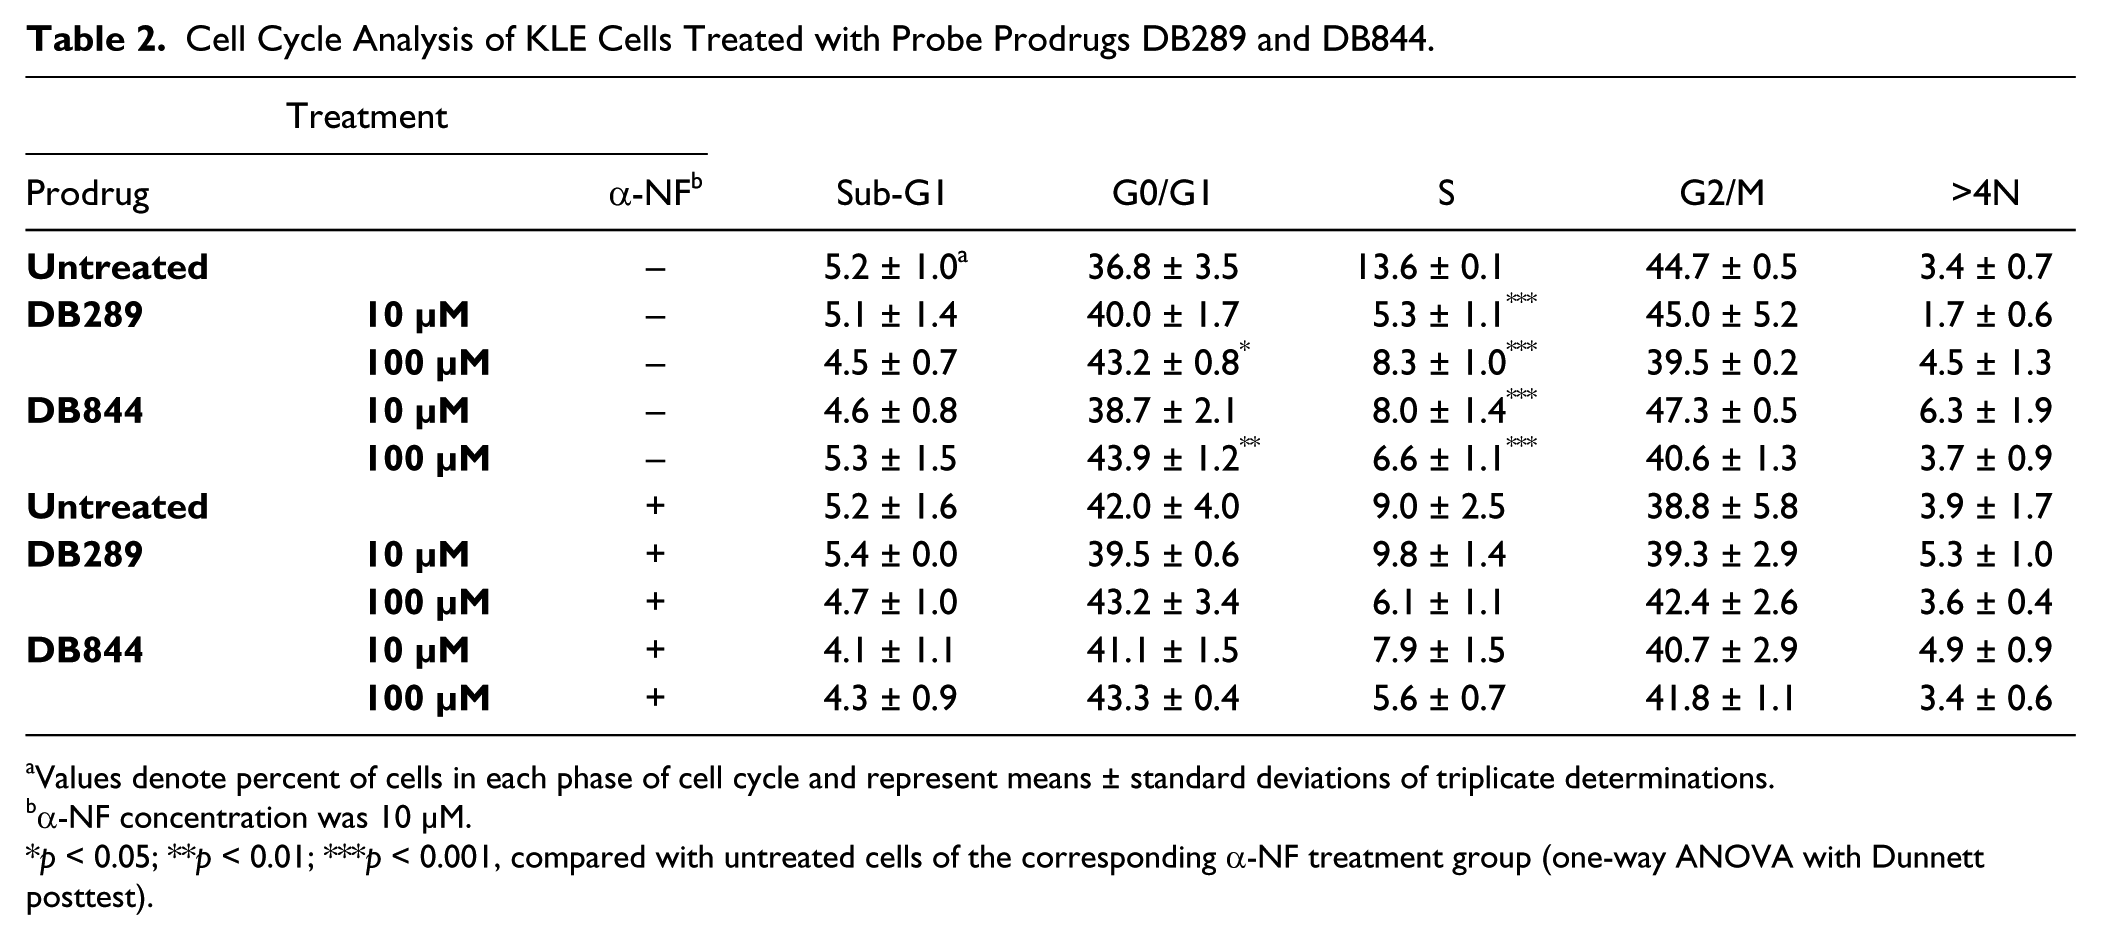
Values denote percent of cells in each phase of cell cycle and represent means ± standard deviations of triplicate determinations.
α-NF concentration was 10 µM.
p < 0.05; **p < 0.01; ***p < 0.001, compared with untreated cells of the corresponding α-NF treatment group (one-way ANOVA with Dunnett posttest).
Pro-Apoptotic Effect of Probe Prodrugs in KLE Cells and CYP1B1-Inhibited KLE Cells
Both DB289 and DB844 exhibited a similar pro-apoptotic effect on KLE cells at different treatment times as determined by a significant increase in the early apoptotic cell population relative to untreated cells ( Fig. 4A ). In addition, both probe prodrugs exhibited concentration-dependent pro-apoptotic effects in KLE cells ( Fig. 4B ). Furthermore, these pro-apoptotic effects were compared between KLE cells and CYP1B1-inhibited KLE cells. Results showed that addition of α-NF (10 µM) attenuated the pro-apoptotic effect of both probe prodrugs, as evidenced by a significant reduction of the early apoptotic cell population between KLE cells and CYP1B1-inhibited KLE cells, although the effect was more evident with DB844 than DB289 ( Fig. 4C , D ).
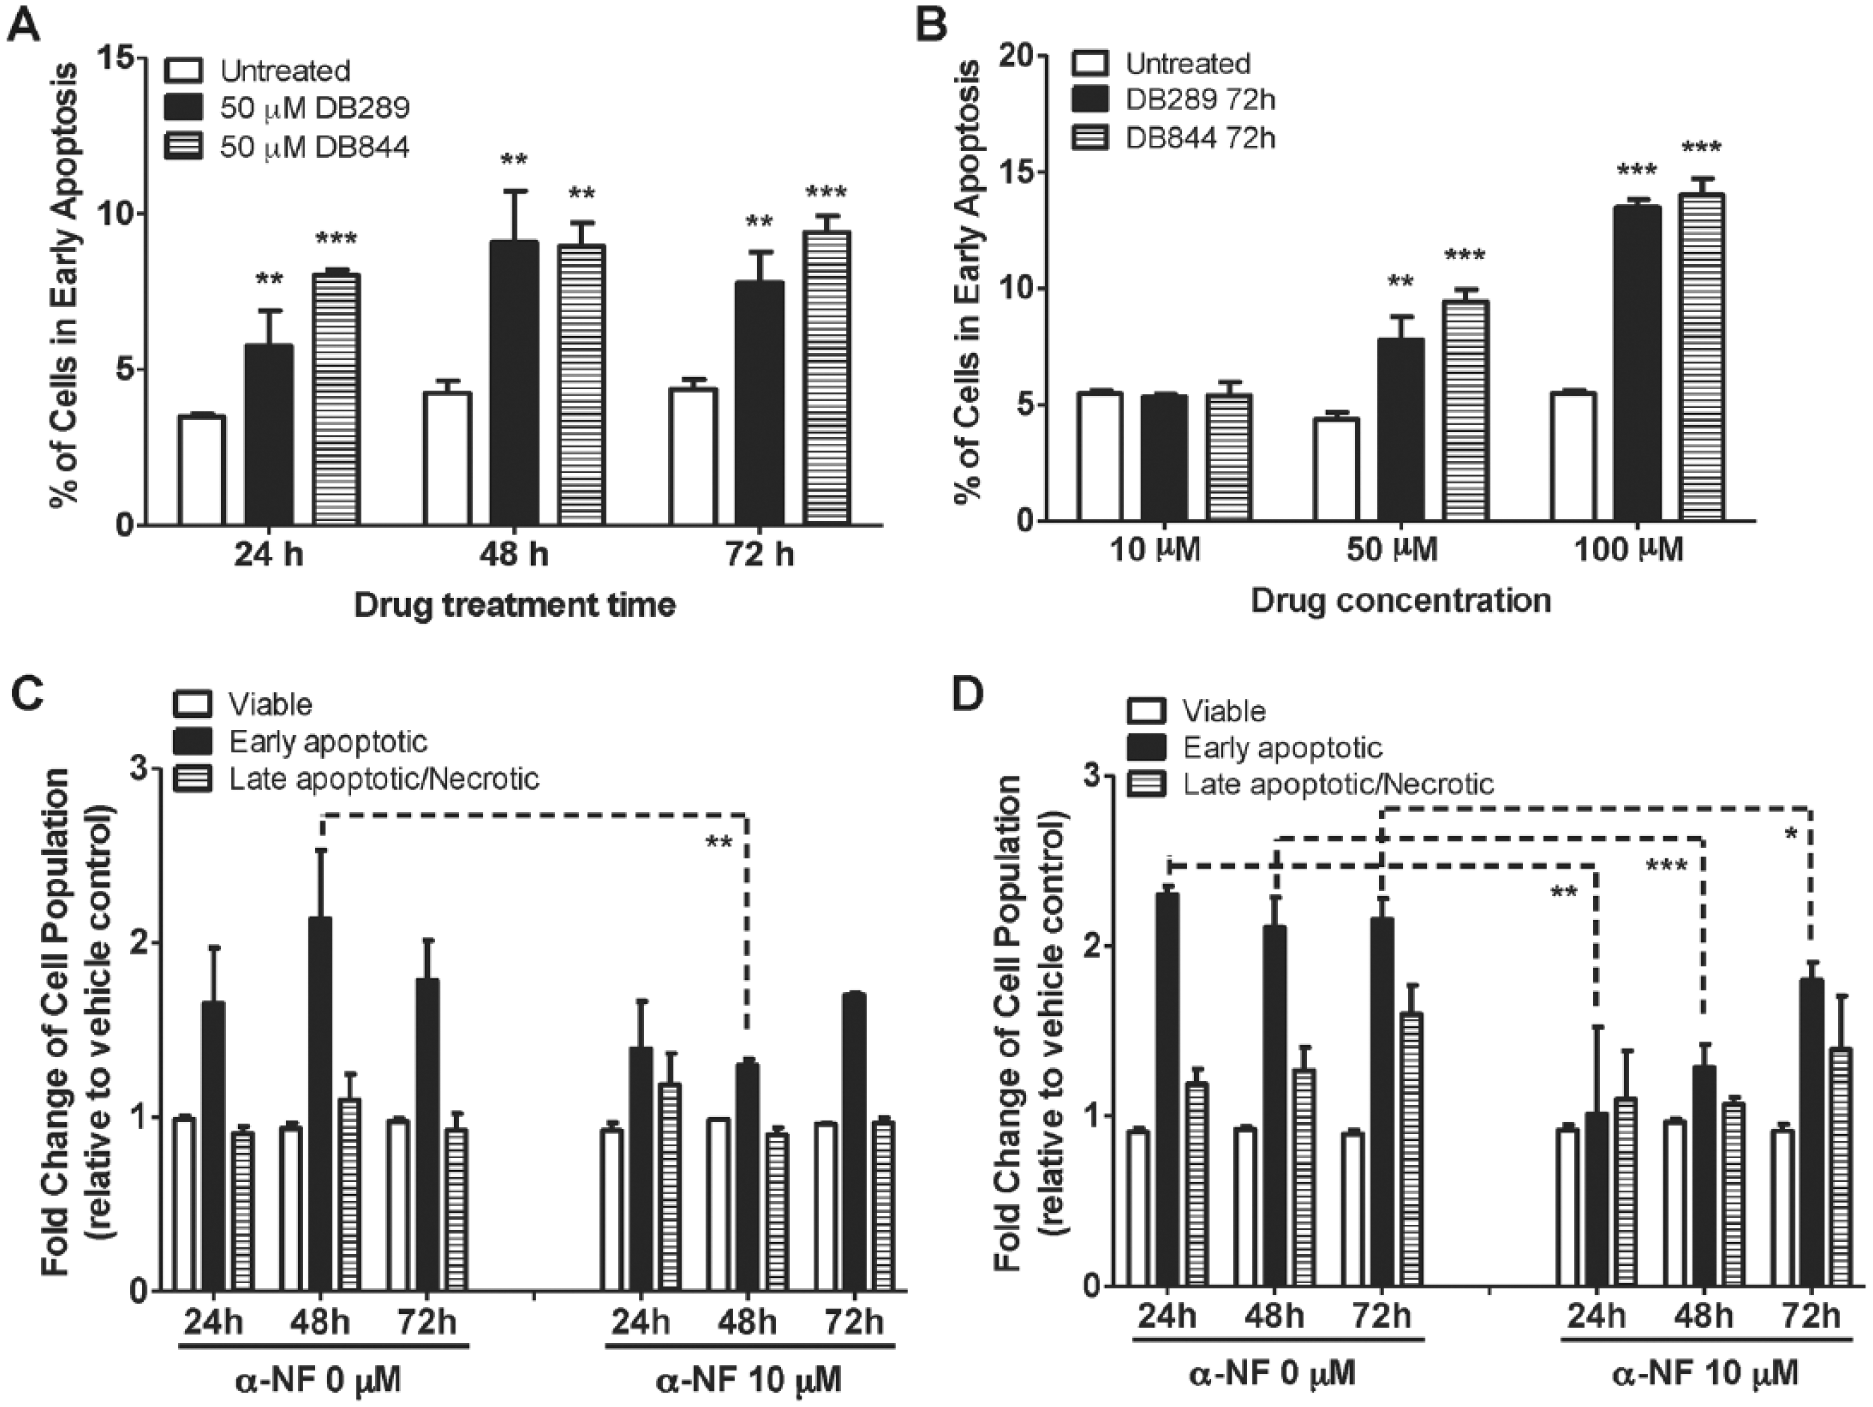
Pro-apoptotic effects of probe prodrugs DB289 and DB844 on KLE cells in the absence and presence of a CYP1B1 inhibitor α-NF. In the absence of α-NF, the percentage of cells in early apoptosis was compared (
Discussion
The primary objective of the current study was to develop the KLE cell line as a relevant drug discovery model for screening CYP1B1-targeted anticancer prodrugs. Several lines of evidence supported the use of a KLE cell–based screening model for this purpose. First, KLE cells alone expressed appreciable levels of CYP1B1, which remained relatively stable to at least 2 weeks of postseeding ( Fig. 1 ). Formation of 4E2 from E2 was detected in KLE cells ( Fig. 2C ), which was a reaction specifically catalyzed by CYP1B1. 3 KLE cells also were superior to transiently transfected HEK293T cells as CYP1B1 expression quickly diminished in the transfected cells. This quickly diminished expression likely contributed to the lack of difference in prodrug cytotoxicity in the absence or presence of α-NF in CYP1B1-HEK293T cells ( Table 1 ). Second, two probe prodrugs, DB289 and DB844, showed differential cytotoxicities toward KLE cells and CYP1B1-inhibited KLE cells ( Fig. 3C , D and Table 1 ). Cell cycle and apoptosis analyses confirmed that CYP1B1 played an important role in mediating these effects in KLE cells ( Table 2 and Fig. 4C , D ). Third, the KLE cell line was derived from a poorly differentiated endometrial carcinoma and possesses tumorigenic activity in nude mice. 23 This would make it possible to use the same cell line for generating a xenograft tumor model in mice in order to evaluate the in vivo efficacy of potential CYP1B1-targeted anticancer prodrugs. As such, we propose a new screening model that consists of KLE cells and CYP1B1-inhibited KLE cells, achieved with α-NF treatment, to identify molecules that exhibit preferential cytotoxicity in KLE cells and not CYP1B1-inhibited KLE cells.
Although the two probe prodrugs DB289 and DB844 exhibited preferential cytotoxicity to KLE cells, they lack anticancer potency due to weak cytotoxicity (low to mid-micromolar IC50 values) and a small, albeit significant, difference in relative cytotoxicity (1.2- to 1.5-fold; Table 1 ). Since the maximal plasma concentration of DB289 was below 1 µM after a single oral dose of 100 mg in healthy human volunteers (maximally tolerated dose for a twice daily regimen), 33 it is impossible to further develop DB289 as a CYP1B1-targeted anticancer prodrug. The same is true for DB844, as it only reached an average maximal plasma concentration of 0.43 µM after the 14th daily oral administration of the maximally tolerated dose (6 mg/kg) in vervet monkeys. 34
To discover new CYP1B1-targeted anticancer prodrugs, screening of large chemical libraries using the proposed screening model should be further developed and conducted. However, it is still unclear what selection criteria should be set for screening. DB289 and DB844 only achieved a minimal difference in cytotoxicity (i.e., IC50 ratio) against KLE cells and CYP1B1-inhibited KLE cells. In theory, a much greater IC50 ratio would be preferred in order to enhance prodrug targeting against CYP1B1-expressing tumor tissues, while protecting normal tissues from the harmful effect of active metabolites. Moreover, in addition to using KLE cells and CYP1B1-inhibited KLE cells for primary screening, counterscreens should be implemented to eliminate candidate prodrugs that also are activated by other P450 enzymes (e.g., CYP1A2 and CYP3A4). Such counterscreens could be established using primary human hepatocytes, transfected cell lines, or a panel of recombinant CYP enzymes.22,35
In summary, KLE cells have been shown to exclusively express appreciable levels of CYP1B1. Additionally, a KLE cell–based screening model has been characterized using two probe prodrugs and thus proposed as a relevant drug discovery model that can be potentially developed to screen chemical libraries to discover novel CYP1B1-targeted anticancer prodrugs.
Footnotes
Declaration of Conflicting Interests
The authors declared no potential conflicts of interest with respect to the research, authorship, and/or publication of this article.
Funding
The authors disclosed receipt of the following financial support for the research, authorship, and/or publication of this article: This work was supported in part by the U.S. National Institutes of Health (R01GM089994).
References
Supplementary Material
Please find the following supplemental material available below.
For Open Access articles published under a Creative Commons License, all supplemental material carries the same license as the article it is associated with.
For non-Open Access articles published, all supplemental material carries a non-exclusive license, and permission requests for re-use of supplemental material or any part of supplemental material shall be sent directly to the copyright owner as specified in the copyright notice associated with the article.