
Abstract
Ligand binding plays a fundamental role in stimulating the downstream signaling of membrane receptors. Here, ligand-binding kinetics of the full-length human adenosine A2A receptor (A2AR) reconstituted in detergent micelles were measured using a fluorescently labeled ligand via fluorescence anisotropy. Importantly, to optimize the signal-to-noise ratio, these experiments were conducted in the ligand depletion regime. In the ligand depletion regime, the assumptions used to determine analytical solutions for one-site binding models for either one or two ligands in competition are no longer valid. We therefore implemented a numerical solution approach to analyze kinetic binding data as experimental conditions approach the ligand depletion regime. By comparing the results from the numerical and the analytical solutions, we highlight the ligand-receptor ratios at which the analytical solution begins to lose predictive accuracy. Using the numerical solution approach, we determined the kinetic rate constants of the fluorescent ligand, FITC-APEC, and those for three unlabeled ligands using competitive association experiments. The association and dissociation rate constants of the unlabeled ligands determined from the competitive association experiments were then independently validated using competitive dissociation data. Based on this study, a numerical solution is recommended to determine kinetic ligand-binding parameters for experiments conducted in the ligand-depletion regime.
Introduction
Historically, drug efficacy determination in whole cells, tissues, or animals has guided drug discovery efforts. 1 More recently, advances in cloning, cell-based assays, and purification of the target receptors, combined with improved knowledge of the molecular basis of diseases, have allowed a more direct measure of ligand-binding affinity, leading to the widely accepted practice of binding affinity optimization to guide early-stage drug discovery efforts.1,2 The success of this approach is predicated on the assumption that ligand-binding affinity is a suitable surrogate for in vivo efficacy, 1 yet both off-rates for ligands and the resulting downstream signaling are critical for eliciting drug effects. Further, binding kinetics and drug efficacy are rarely measured during the early stages of drug discovery efforts,3,4 as they tend to be harder to measure experimentally.
Many efficacious drugs have been identified based on ligand affinity determination alone; however, recent evidence suggests that in some cases, ascertaining ligand-binding kinetics, in particular residence time (directly related to the kinetic off rate, koff) may improve predictions of a drug’s potential efficacy and safety.1,2,4 Awareness and experimental evidence of the importance of binding kinetics are increasing, and there is great interest in developing assays to measure ligand-binding kinetics, based on radioligand binding, fluorescent ligand binding, and surface plasmon resonance of unlabeled ligands to surface-tethered receptors.3,5–8
Traditional radioligand binding experiments directly measure bound receptor-ligand complexes formed after free ligand is removed (by pipetting or filtering). This separation step adds a delay that may affect the binding kinetics rate determination. In contrast to traditional radioligand-binding assays, in fluorescence anisotropy (FA; also referred to as fluorescence polarization) assays, the unbound ligand does not need to be removed, thus speeding measurement. However, the presence of free ligand contributes to the observed fluorescence signal. 9 To optimize the signal-to-noise ratio, FA experiments are usually conducted at low concentrations of ligand, the “ligand depletion regime.” Reviews of FA applied to G protein–coupled receptor (GPCR) ligand binding are available,9–11 and this approach has been applied to characterize various GPCRs, including MC5 receptor, 9 A2A adenosine receptor, 12 β1 adrenergic receptor, 13 and M1 muscarinic receptor. 14 These FA assays have been validated for the determination of KD, Bmax, and KI values, as they are in agreement with values obtained from radioligand-binding experiments.9,12 To date, few studies have used FA to measure ligand-binding kinetics for GPCRs. Further, a thorough analysis of approaches to determine ligand-binding kinetics in the ligand depletion regime and their impact on kinetic rate constants has not been conducted, to our knowledge.
Taking advantage of the successful expression of full-length human A2AR in yeast and the purification of functional receptor in micelles,15–18 we describe the use of an FA-based in vitro method to measure the ligand-binding affinity and kinetics of unlabeled ligands. This approach is particularly valuable for determining binding rates for drug discovery efforts. To maximize the signal-to-noise ratio, the ligand-binding data were taken in the ligand depletion regime 13 (i.e., at least ~20% of the fluorescent ligand bound to the receptor). Here we implement a numerical solution approach to determine kinetic binding parameters using FA ligand-binding data, and we compare the accuracy of this approach to that of the analytical solution to a one-site ligand-binding model19,20 in the ligand depletion regime.
Materials and Methods
Expression and Purification of A2AR from Yeast Membrane Preparations
Full-length human A2AR was expressed in Saccharomyces cerevisiae BJ5464 cells using the integrating plasmid pITy-A2AR-His10, as previously described.16,21 Solubilization of A2AR in detergent micelles composed of 0.1% w/v dodecyl maltopyranoside (DDM), 0.1% w/v 3-(3-cholamidopropyl) dimethylammoniopropane sulfonate (CHAPS), and 0.02% cholesteryl hemisuccinate (CHS) was conducted as previously described. 21
A2AR-DCC (DDM/CHAPS/CHS) samples were stored at 4 °C and used within 1 wk of purification. Protein concentration was determined using ultraviolet absorbance at 280 nm as previously described. 16 All A2AR samples used in these studies had a purity of 90% or higher. 21
Using FA to Measure Ligand Binding Affinity and Kinetics
Ligand binding affinity and kinetics were measured using the agonist FITC-APEC (NIMH synthesis program, http://nimh-repository.rti.org, NIMH code D-906). 22 Measurements were conducted in Corning Costar 96-well half-area black polystyrene plates (catalog No. 3875; Corning Incorporated, Acton, MA) using a Synergy H1 plate reader (BioTek, Winooski, VT) at an excitation wavelength of 480 to 485 nm and emission wavelength of 520 to 528 nm. All measurements were taken at a constant gain (75); for assays at low fluorescent ligand concentration (0.5–1 nM), readings were also taken at a higher gain (100). All unlabeled ligands were purchased from Tocris Bioscience (Ellisville, MO).
In addition to measuring changes in anisotropy signal upon ligand binding to the receptor, scattering measurements prior to the addition of fluorescent ligand were taken for all samples and subtracted as described in the supplementary information. Nonspecific interactions were accounted for by using excess unlabeled ligand, added to micelles lacking receptor.
For equilibrium measurements, solubilized A2AR was incubated with FITC-APEC for approximately 3 h at room temperature, protected from light. Empty micelles were also incubated with FITC-APEC as a negative control; nonspecific binding was measured using 10 µM 5′-(N-ethylcarboxamido)adenosine (NECA).
For competition binding equilibrium experiments A2AR-DCC samples, diluted to 800 nM, were incubated with 30 nM FITC-APEC and increasing concentrations of competitor for 4 h (~3.5/koff
20
) at room temperature and protected from light. At this receptor concentration, both controls (empty micelles and A2AR-DCC incubated with 10 µM NECA and 30 nM FITC-APEC) had similar anisotropy values (
For FITC-APEC kinetic binding experiments, A2AR-DCC (625–800 nM) and DCC micelles lacking receptor were incubated with 30 nM FITC-APEC with and without competitor (NECA, adenosine, and ZM 241,385). Kinetic dissociation measurements were performed by preincubating A2AR with 30 nM FITC-APEC for 4 h, followed by addition of 1.0 µM unlabeled competitor. Measurements were taken every 8 s at room temperature until equilibrium was reached. Receptor-ligand complexes (C) were calculated from the experimentally measured anisotropy signal, as described in the supplemental information.
Analyzing One Ligand and Two Ligand Binding Kinetics
The system of ordinary differential equations (ODEs) describing the mass-action kinetics of one-site receptor-ligand binding have been described extensively (for example, see refs. 19 and 20) and are included in the supplemental information. We applied this simple one-site binding model to analyze our system, for which the analytical solutions with one ligand or two ligands in competition have been reported.19,20 Analysis of the receptor-ligand binding kinetics was performed without further modification to either the system of equations or the analytical solutions as originally reported. Comparison of the numerical solution and analytical solution was performed using simulated data, with initial ligand and receptor concentrations ranging between 2.5 and 10,000 nM and 10 and 1000 nM, respectively. The numerical solution, analytical solutions, and parameter optimization were all performed using MATLAB 8.6; additional details are available in the supplemental information.
Results and Discussion
Characterizing Equilibrium Ligand-Binding Properties of the Receptor Binding Population (Bmax)
To determine the equilibrium dissociation constant (KD), we incubated purified full-length human A2AR solubilized in micelles with increasing amounts of FITC-APEC, as described in the Materials and Methods section. The total receptor concentration (RT) was measured by absorbance at 280 nm (A280). In contrast to traditional radioligand-binding assays, in FA assays the unbound ligand does not need to be removed, but its fluorescence contributes to the signal.
9
This characteristic of FA assays introduces some advantages and disadvantages that need to be considered during assay development. In FA experiments, excess ligand conditions are unattainable, as increasing the fluorescent ligand concentration increases the amount of free ligand, resulting in a reduction in the measured anisotropy signal (
The measured anisotropy signal (A) is a weighted average of the fraction of unbound and bound ligand and their corresponding anisotropy signals (Amin and Amax). 9 Details for determining Amin and Amax and the subsequent calculation of receptor-ligand complexes (C) are included in the supplemental information. It is important to account for background scattering by measuring the fluorescence contribution of the sample prior to addition of the fluorescent ligand (see supplemental information). Figure 1A shows ligand-binding equilibrium data for various receptor concentrations (160–1600 nM). As can be seen from these data, saturation was achieved only at low receptor concentrations (160 and 480 nM), indicating that the labeled ligand FITC-APEC had limited binding to the receptor at equilibrium, with the formation of only 9 nM and 25 nM receptor-ligand complexes, respectively, or ~5.6% of the receptor population in the sample. This result is illustrated clearly via Scatchard analysis ( Fig. 1B ), where the x-intercept represents the Bmax of the system (i.e., the total receptor bound to ligand at equilibrium) and the slope is the equilibrium affinity constant, KD. Interestingly, the value of the KD determined here (22 ± 2.2 nM) is similar to that previously reported for this ligand (57 nM 22 ), even though here A2AR was reconstituted in detergent micelles, compared with A2AR in striatal tissue membrane preparations of bovine brain from the previous study.
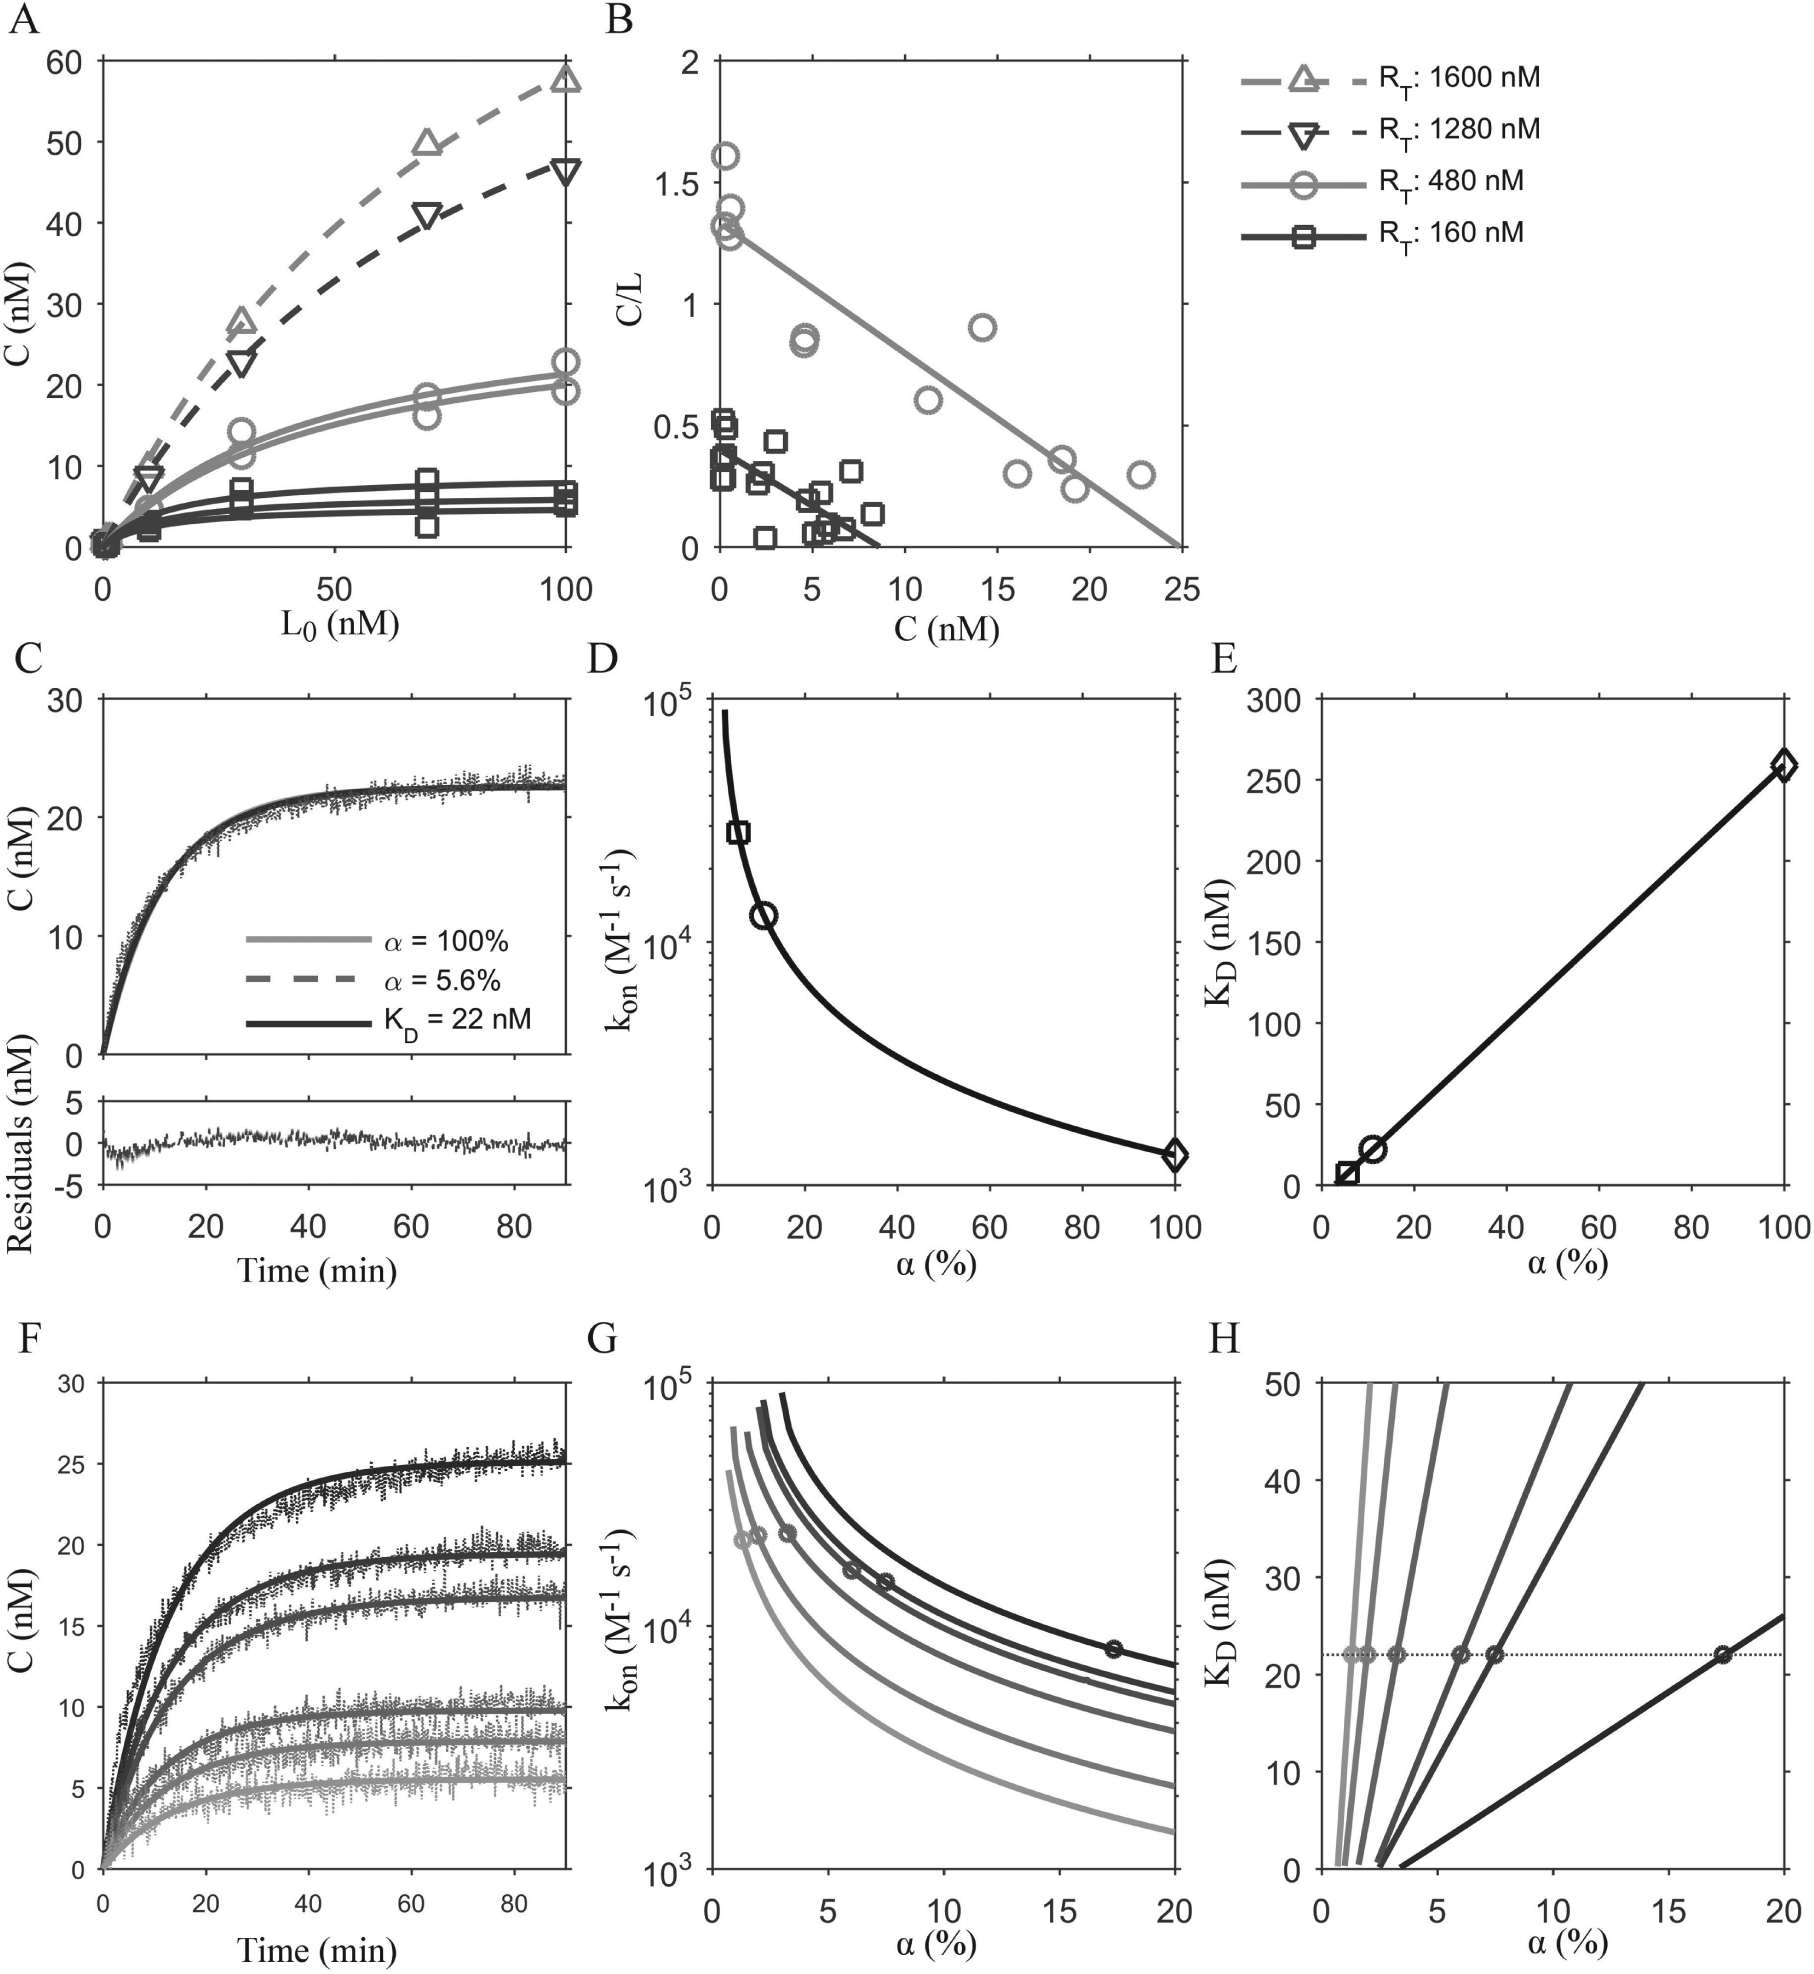
Equilibrium and kinetic binding data for FITC-APEC to A2AR with model fits. (
The low percentage of total receptor population capable of binding FITC-APEC was somewhat surprising but is consistent with other studies. For example, from our previous studies, 16 we know that all the purified receptor binds to an antagonist (xanthine amine congener) affinity column, suggesting it is fully capable of ligand binding. In contrast, we found that ~17% of the total receptors present bound to the agonist [3H]-CGS 21680. 16 Our data are also consistent with values of G protein–coupling-competent receptor (0%–40%) reported for recombinant A2AR expression in HEK and Sf9 cells. 24 It has been speculated that GPCRs exist in equilibrium between inactive (R) and active (R*) states, 25 where inverse agonists preferentially bind the inactive state of the receptor (R), agonists preferentially bind the active state (R*), and neutral antagonists recognize both R and R* states.4,25–27 Furthermore, experimental data suggest the existence of multiple active states (R*), where different agonists can stabilize distinct conformational states. 28 For example, using the C-terminally truncated A2AR (Δ316) purified from Escherichia coli, ~10% of the binding sites were identified when using the agonist [3H]-NECA compared with the antagonist [3H]-ZM 241,385. 29 Thus, it is plausible that the agonist analog FITC-APEC is binding to only a small percentage of the purified receptor (R*).
Determination of Kinetic-Binding Parameters
Calculation of ligand-binding rates of FITC-APEC to A2AR solubilized in micelles would provide a means to determine parameters for competition experiments with unlabeled ligands. Here, ligand-binding association experiments were performed using 800 nM receptor and 30 nM FITC-APEC. Kinetic-binding parameters were determined using a one-site ligand-binding model (see the supplementary information for model details and experimental setup). Two approaches were used to identify parameters that best fit the data, using a fixed value of KD = 22 nM or α = 5.6% (i.e., α = Bmax/RT*100) based on our equilibrium ligand-binding experiments ( Fig. 1A , B ).
When using whole cells or membrane preparations to study GPCR ligand-binding activity, the number of active binding sites (Bmax) in a sample is often used as a proxy for the total receptor present (RT). Here, we tested the effect of varying assumptions for Bmax on the kinetic parameters obtained using one set of experimental kinetic binding data. Implementing the numerical solution using either α values of 5.6% or 100% results in a similar apparent fit to a representative association experiment ( Fig. 1C ), where the residuals are similar for each fit, although divergent kinetic parameter values were obtained ( Table 1 ). Changing the α value from 5.6% to 100% affects the value obtained for the kinetic rate constants ( Table 1 ). In particular, the impact of different Bmax values on the apparent residence time (i.e., residence time = 1/koff) of the ligand was determined, as residence time is an important pharmacological attribute for drug development. Symbols in Figure 1D and E indicate solutions to the fixed KD (set to 22 nM, KD ≡ koff/kon) and fixed α approaches (set to 5.6% or 100%), whereas the lines in Figure 1D and E show the effect of stepping the α between 0.5% and 100%—by increments of 0.1% while allowing both kon and koff to vary freely—on the kon parameter values ( Fig. 1D ) and the resulting kinetic KD value ( Fig. 1E ) for all α values that converged to fit the experimental data. Note that the lines of Figure 1D and E , representing all sets of best-fit kon and KD values as the value of α increases, converge with the fixed KD and fixed α approaches (indicated by the symbols). The monotonically decreasing line in Figure 1D indicates that higher values of α resulted in lower values of kon (M−1s−1), spanning an order of magnitude. This effect propagates to the calculation of the kinetic KD (koff/kon); however, an input of the equilibrium KD (“fixed KD”) to the model yields kinetic parameters and a kinetic KD that are much closer to the measured equilibrium KD (22 nM) than those obtained from a fixed value of α at 5.6%.
Kinetic Parameters Vary with Distinct Bmax Values (values in parenthesis denote α or KD values fixed for numerical solution.
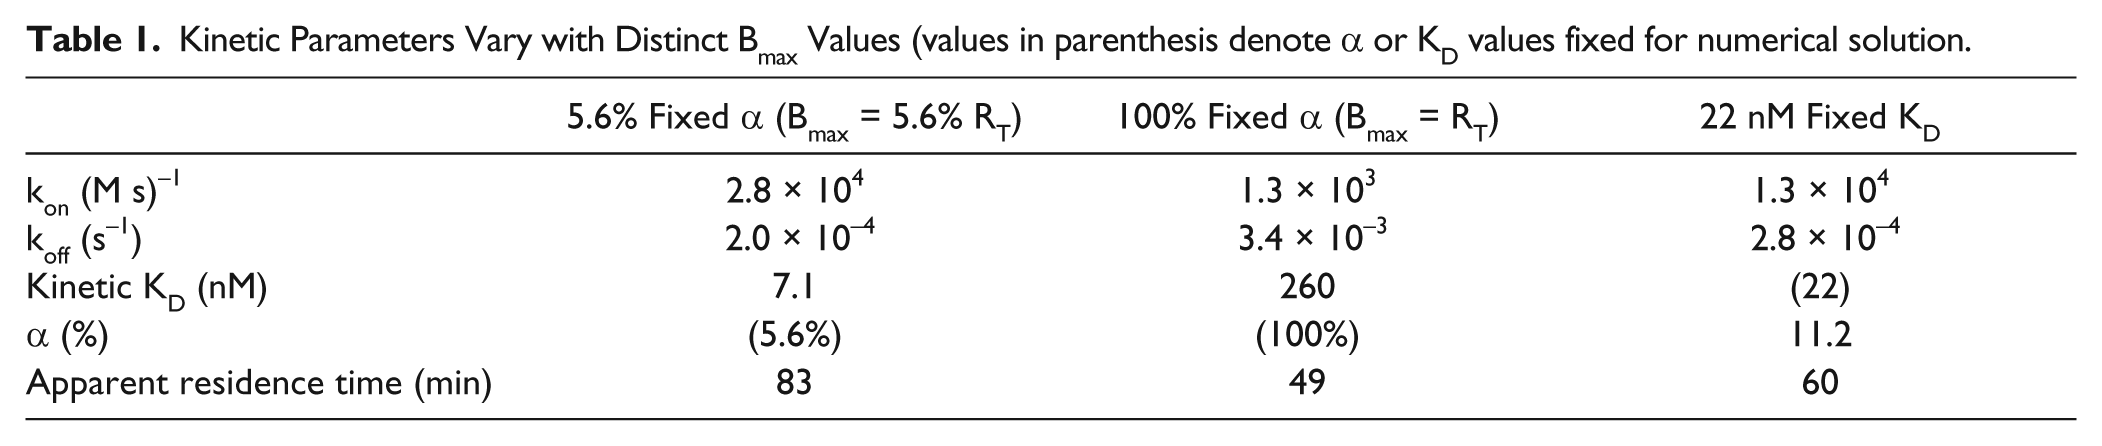
To test the robustness of the fixed KD and fixed α approaches, the numerical solution approach was applied to FITC-APEC association-binding experiments (n = 16) with 30 nM FITC-APEC and A2AR concentrations ranging from 625 to 800 nM ( Fig. 1F ). For clarity, lines in Figure 1F show only results from the numerical solution when using the equilibrium KD value (22 nM) to constrain the model solution; however, as in Figure 1C , curves fit with the other approaches essentially overlap. Kinetic parameters were determined by fixing the kinetic KD to the value obtained from equilibrium (i.e., KD = 22 nM; circles in Fig. 1G , H ) and progressively stepping α from 0.5% to 20% in 0.1% increments to determine kon and koff (results shown for kon, solid lines, Fig. 1G ). For clarity, Figure 1F–H show only six representative association-binding experiments; results from the fixed KD approach are shown with circles. For later comparison with the numerical solution, the one-ligand analytical solution was also used for parameter value determination. All kinetic parameter values are presented in Table 2 .
Kinetic Parameter Values for FITC-APEC Binding to A2AR Obtained Using the Numerical and Analytical Solutions.
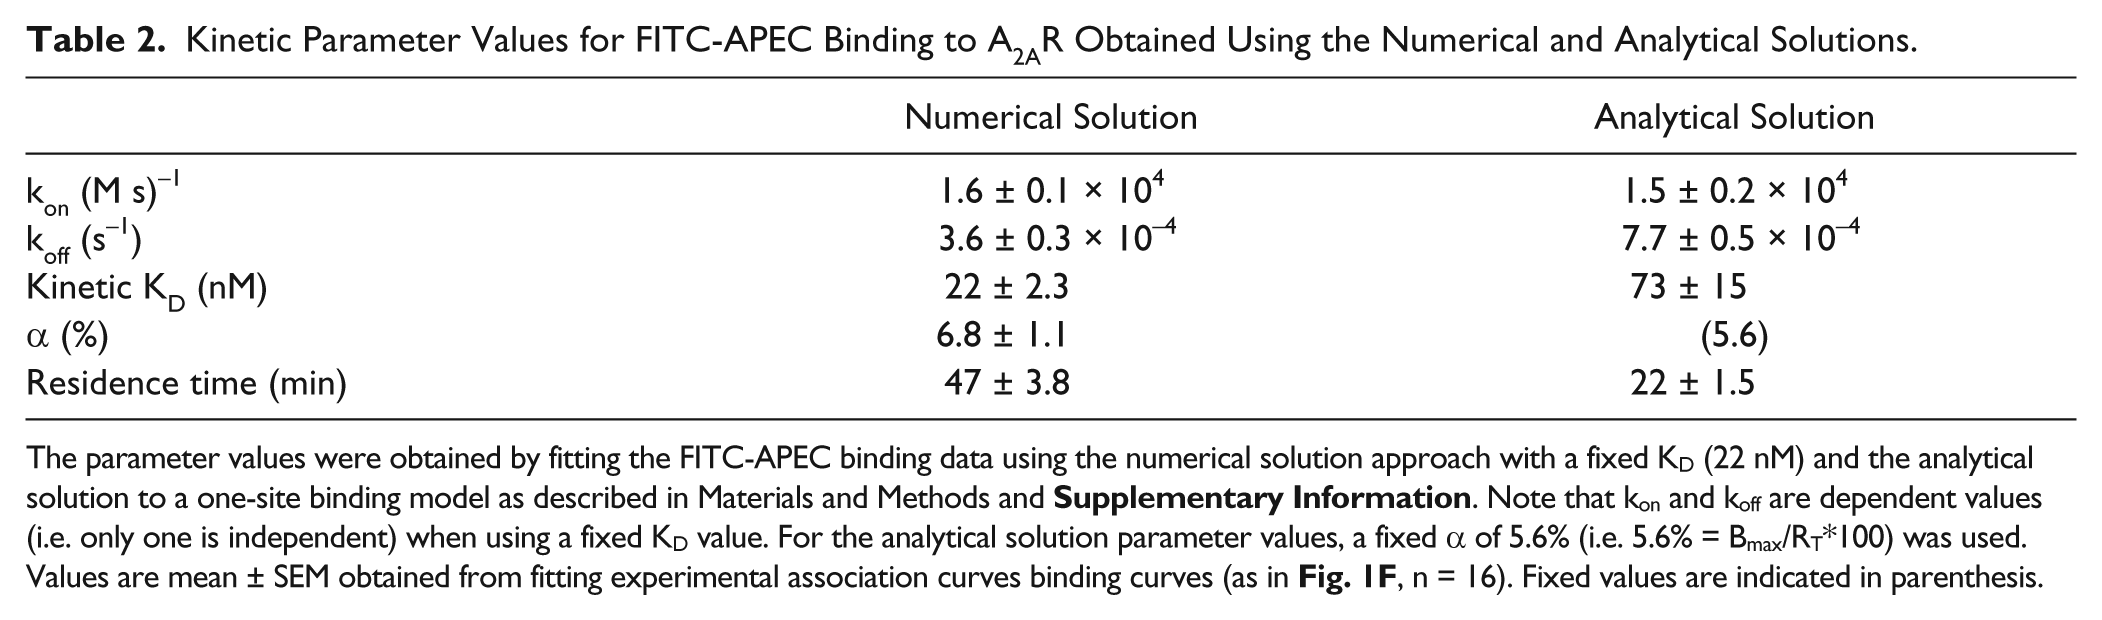
The parameter values were obtained by fitting the FITC-APEC binding data using the numerical solution approach with a fixed KD (22 nM) and the analytical solution to a one-site binding model as described in Materials and Methods and
The apparent kinetic KD value that resulted from the kon and koff calculation for each experimental kinetic binding curve ( Fig. 1H ) linearly increased with increasing α; however, the slope of each kinetic KD line, corresponding to each experimental binding curve, was unique. Each kinetic KD line represents the set of best-fit kon and koff values; although the resulting KD values varied, each set of kon and koff values individually fit each of the experimental data well (as in Fig. 1C , F ). This result implies that there are many viable sets of kon and koff values that fit the data as α increases. However, of the many paired kon and koff values that allow an excellent fit to the experimental data, only one pair yields a kinetic KD equal to the equilibrium KD value (highlighted by the dashed horizontal line in Fig. 1H ). By fixing the kinetic KD of the system to the equilibrium KD value, the algorithm located a single pair of kon and koff values that best fit the data at the intersection of equilibrium KD values and kinetic KD values. The kon and koff values from those intersections were determined using the fixed KD approach for all 16 association binding experiments and are reported as mean ± standard error of the mean in Table 2 .
In our laboratory, we have observed less than ~10% variation in the values for KD in equilibrium binding experiments, across multiple purifications and with different total receptor yields (e.g., as described previously16,30). Because of the low experimental variability in equilibrium KD and the close fit between model and experimental data, the fixed KD approach was used in the remaining one-ligand binding numerical analysis and is recommended for those implementing this technique. Just as there can be some variation in the RT value between preparations, it is likely that there is variation in the proportion of active sites (i.e., variability in α). Furthermore, in addition to compensating for changes in the Bmax of the system, the α parameter also provides some compensation for variations between different protein preparations and day-to-day experimental variability (e.g., variation in background scattering or small changes in Amin and Amax parameters).
Comparison of Analytical and Numerical Solutions of One-Site Ligand Binding Model
Why use the analytical solution under ligand depletion conditions, and if one were to use it, how bad is the assumption of excess ligand (e.g., see refs. 19 and 20) for FA conditions in which at least 20% of the ligand is bound? Certainly the analytical solution is more straightforward to implement, and the kinetic association binding fits of experimental data resulting from the analytical and numerical solutions are nearly identical (not shown for clarity, as the resulting analytical fits closely match the numerical fits in Fig. 1C , F ), although the kinetic parameter values obtained are quite distinct ( Table 2 ). However, it was evident that a good fit to the experimental data may be obtained with many α values, and that for a given α, the numerical and analytical kinetic parameter values diverged (as in Tables 1 and 2 ). Given that we were able to determine several sets of “best” parameter fits, we were interested to explore which approach, from either the fixed KD numerical approaches or the analytical solution, led to optimal parameter determination for the ligand depletion regime. We therefore examined the convergence of the numerical and analytical solutions, using simulated data, to illustrate the range of ligand-receptor ratios in which the analytical solution may be appropriate to use for kinetic parameter value determination.
To this end, a set of simulation kinetic parameters were fixed to values similar to those found in Table 2 ; that is, the kinetic on-rate and off-rate were fixed to 1.0 × 10⁴ (M s)−1 and 2.2 × 10⁻⁴ s−1, respectively, yielding a kinetic KD of 22 nM. Ligand-receptor association binding was simulated using these fixed kinetic parameters for many initial ligand and receptor concentrations as a means of testing the parameter accuracy of the numerical and analytical solutions. The L0 and RT concentrations in each simulation were varied between 2.5 and 10,000 nM and 10 and 1000 nM, respectively. For simplicity, α was likewise assumed to be 100%, and thus RT = Bmax. The L0/RT ratio was used as a measure of ligand excess or depletion in kinetic association-binding experiments. Using the resulting simulated association-binding data, the kinetic-binding parameters were redetermined using the numerical and analytical solutions (kestimated). The resulting parameter values were compared with the initial simulation kinetic parameters, which were known and fixed to the values listed above (koriginal). Using this approach, the accuracy of the numerical and analytical solutions for a wide range of ligand and receptor concentrations could be analyzed.
Figure 2 shows very good agreement between the parameter values determined from the numerical and analytical solutions at L0/RT ratios greater than ~3. The point (*) in Figure 2 indicates a similar ligand-receptor ratio as the experiments described in Figure 1 (i.e., 30 nM labeled ligand and Bmax—approximately 5% of 800 nM RT—ca. 40 nM). Based on Figure 2B , a discrepancy of approximately twofold should be expected if the analytical solution was inappropriately applied for ligand-receptor ratios similar to those used in these FA-based experiments. Table 2 highlights this result using experimental data, in which the koff value obtained from the analytical solution was roughly twofold greater than that of the numerical solution. Interestingly, the overall accuracy of the analytical solution for predicting the original kon values (not shown) was reasonable, yielding no more than 40% error for all simulation L0/RT ratios tested. Thus, we expect that Figure 2 may serve as a helpful guide for conditions under which application of the analytical solution may be appropriate.
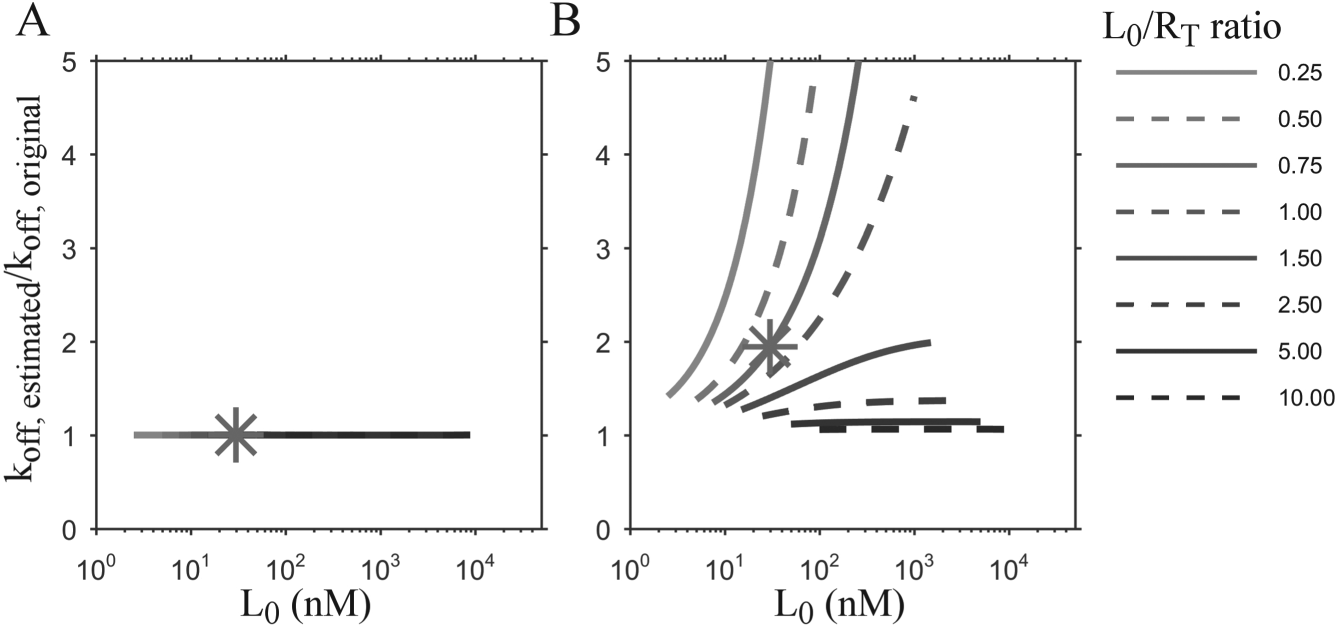
Effect of implementing numerical and analytical solutions for a range of ligand-receptor ratios (L0/RT) on dissociation rate constants (koff). The numerical solution with fixed KD (
Determining the Equilibrium and Kinetic Binding Properties of Unlabeled Ligands
The application of FA to measure ligand-binding kinetics of unlabeled ligands in competition with fluorescent ligands offers great potential for drug discovery. To determine whether the numerical solution approach would enable the determination of kinetic-binding properties of unlabeled ligands in the ligand depletion regime, we carried out competition experiments with FITC-APEC and three unlabeled ligands: adenosine, NECA, and ZM 241,685 ( Fig. 3A ). As with the FITC-APEC equilibrium binding experiments, 800 nM A2A receptor and 30 nM FITC-APEC were used to minimize scattering and maximize anisotropy signal. Increasing amounts of unlabeled ligands were added simultaneously, and the system was allowed to equilibrate prior to anisotropy measurements. The values for the half-maximal inhibition concentration (IC50) and KI were then determined from fits to the equilibrium anisotropy values as described in the Materials and Methods section by standard competition models. 23 Although it is possible that different conformations of the receptor may show selective preference for one ligand type (agonist, inverse agonist, antagonist) over another, based on our analysis of the equilibrium competition ( Fig. 3A ), including the calculation of the Hill slope from this experimental data, the data are consistent with competition with one binding site.
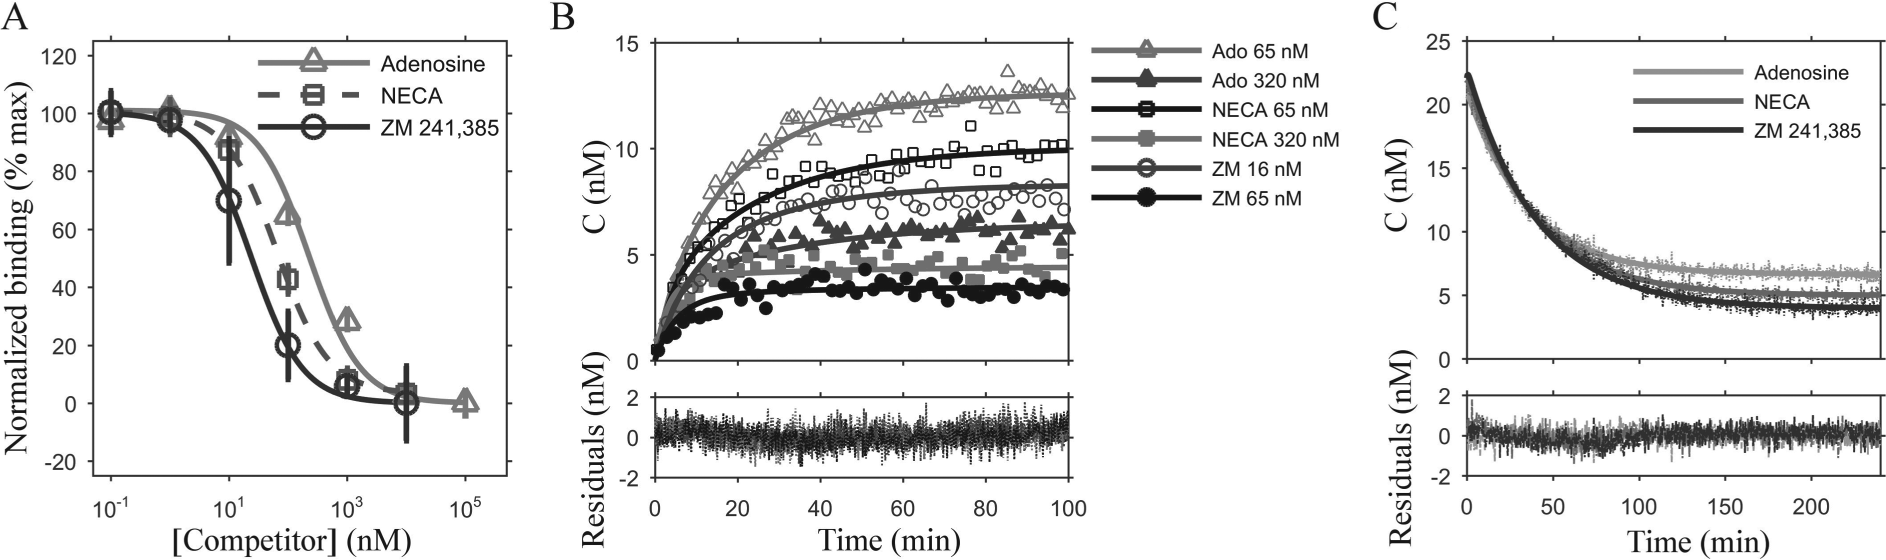
Equilibrium and kinetic competition binding of 30 nM FITC-APEC and model fits of various unlabeled ligands to A2AR. (
Kinetic association-binding experiments using these unlabeled ligands were then determined in competition with 30 nM FITC-APEC, with both labeled and unlabeled ligands added at time 0 ( Fig. 3B ). In these experiments, the unlabeled competitor was added with 30 nM FITC-APEC at one of two concentrations (65 and 320 nM for NECA and adenosine, 16 and 65 nM for ZM 241,385).
The experimental data shown in Figure 3B were subjected to kinetic parameter determination, using the values (KD, kon, koff, α) for FITC-APEC obtained from the one-ligand binding experiments. As with the one-ligand experiments, unlabeled-ligand kinetic parameters were constrained using equilibrium binding data (KI values, Fig. 3A ) to inform the data fitting ( Fig. 3B ). However, to solve for the kinetic parameters of the unlabeled ligand, a hybrid fixed-α/KI numerical approach was required.
The parameter determination strategy involved progressively fixing α (Bmax ≡ αRT) at plausible values (0.5%–20%) and obtaining kon and koff values that minimize the error between the resulting fit and the kinetic data. The resulting parameter values were used to compute the kinetic KI (≡ koff/kon); of the kinetic KI values determined for all α values, only one matched the equilibrium KI. The resulting α, kon, and koff values that matched the equilibrium KI were then recorded. This approach, deemed the fixed α/KI hybrid, is essentially an extension of the fixed KD approach used for one-ligand kinetic parameter determination. Values of kon and koff for adenosine, NECA, and ZM 241,385 were thus determined for a set of experimental data ( Fig. 3B ; Table 3 ). Note that the koff and kon values are determined independently of the equilibrium KI, at each stepped α value in the competition experiments with simultaneous addition of the two ligands at time 0.
Unlabeled Ligand Kinetic-Binding Parameters for A2AR Determined from Competitive Association Experiments, Using the Numerical Solution Approach.
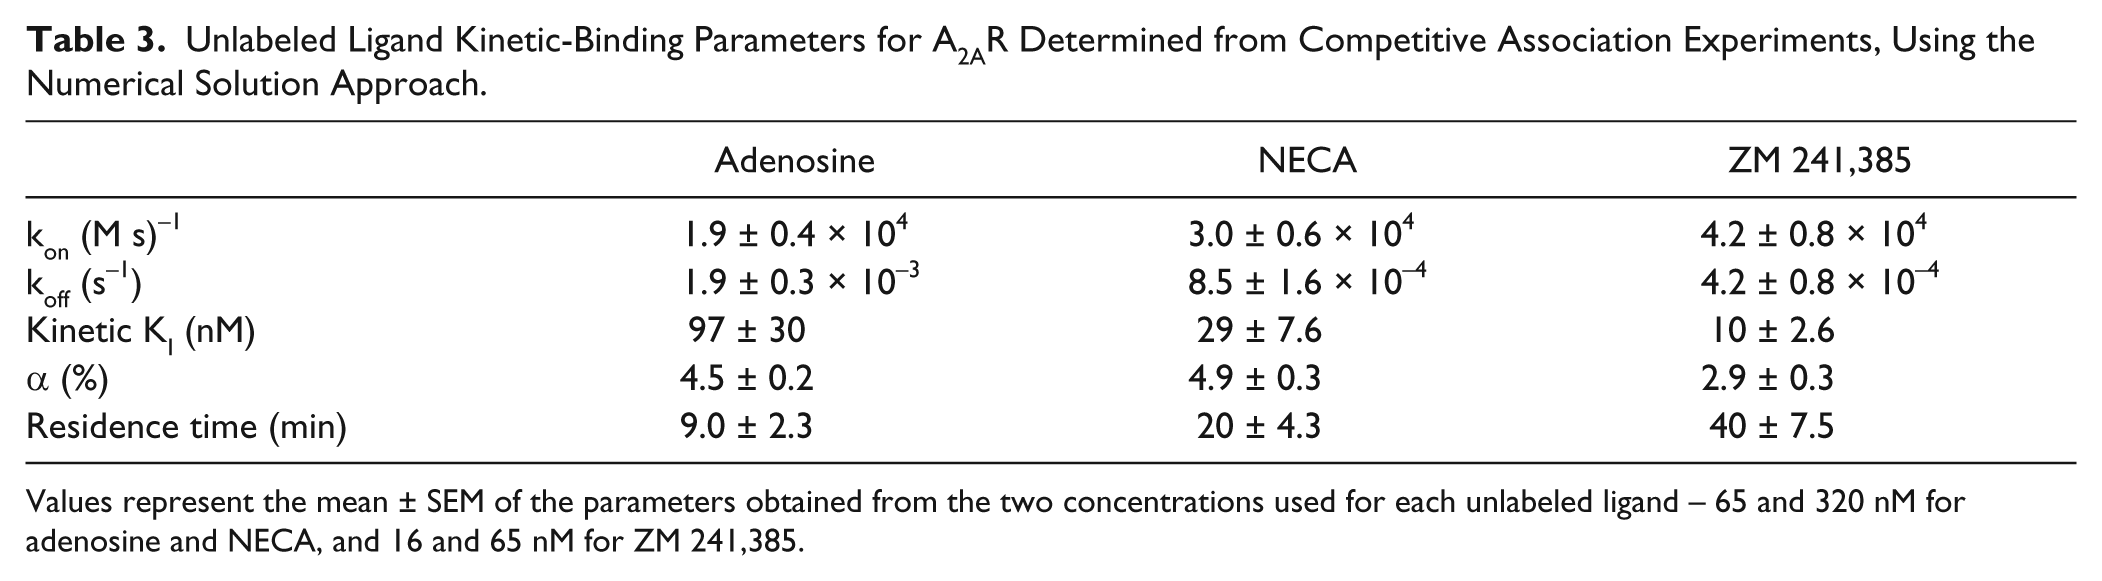
Values represent the mean ± SEM of the parameters obtained from the two concentrations used for each unlabeled ligand – 65 and 320 nM for adenosine and NECA, and 16 and 65 nM for ZM 241,385.
Competitive dissociation data were used as an independent confirmation of the rate constants (kon and koff) obtained for the unlabeled ligands from the association experiments ( Table 3 ). Competitive dissociation experiments were conducted with unlabeled ligand at 1.0 µM and 30 nM FITC-APEC ( Fig. 3C ). Based solely on the kon and koff values obtained for both FITC-APEC ( Table 2 ) and the unlabeled competitor ligand obtained from competitive association experiments ( Table 3 ), the dissociation curves were predicted for unlabeled ligand (1 µM) and 30 nM FITC-APEC, as shown in Figure 3C . Note that only α was allowed to change, to allow for variation between protein purifications. The predicted dissociation curves overlap the data obtained from experiments with high accuracy only when using the kinetic parameters obtained with the one-ligand fixed KD and two-ligand fixed α/KI hybrid approaches (that is, parameters determined with the fixed α numerical or analytical solutions fail to overlay the dissociation curves). As the kinetic parameters were fixed from competitive association experiments ( Fig. 3B ; Table 3 ) and used to predict competitive dissociation data, with very different competitor concentrations, we believe that these kinetic parameters describe with high accuracy the kinetic-binding properties of these ligands to A2AR in our system.
Comparison of the kinetic binding parameters obtained for several ligands studied here using the numerical method with values previously reported using other models for both wild-type A2AR and agonist-selected, truncated variants (A2A-Star2 and rant21) for FITC-APEC, NECA, and [3H]-ZM 241,385 shows good consistency. Specifically, the kon values we obtain for micelle-solubilized A2AR are within ~10-fold of those for FITC-APEC 22 and 5- to 10-fold of those determined from ZM 241,385 and NECA using [3H]-ZM 241,385 4 for wild-type A2AR in membrane preparations. The kon values for ZM 241,385 antagonist-selected, truncated variants (thermostabilized A2A-Star2 and rant21) were reported to be ~50- to 500-fold higher than we determined in this study.31,32 Interestingly, our koff estimate and those of the other reports vary only by ~0.5- to 15-fold, indicating much less variability in koff for ZM 241,285 relative to kon. This comparison suggests that both the membrane environment and the peptide sequence of the receptor play a strong role in the determining the kinetics of ligand binding. To our knowledge, the kinetic binding properties of adenosine to A2AR have not been reported elsewhere for comparison.
The analytical solutions to the system of ODEs describing GPCR-ligand interaction are commonly used for kinetic parameter determination. However, the analytical solutions assume that the experimental data are collected in an excess ligand regime. In FA-based assays, increasing concentrations of unbound labeled ligand decrease the measured anisotropy signal. 12 Hence, by necessity, FA assays often operate in the ligand depletion regime to maximize the signal-to-noise ratio. Here we implement a numerical solution to the one-site ligand-binding model for determining kinetic parameters for A2AR using experimental data collected in the ligand depletion regime. As the one-site binding model for receptor-ligand interactions is agnostic toward any particular receptor or ligand combination, we expect our results will apply to all receptor-ligand interactions that follow the one-site binding model.
We find that determination of Bmax is essential for accuracy in finding subsequent kinetic parameters and that the resulting value of the kinetic KD is strongly dependent on the Bmax. Importantly, using a numerical solution approach, we were able to determine Bmax from association binding experiments, using the KD value obtained from equilibrium experiments. However, we also found that in our purified system and using FITC-APEC, RT is not necessarily a good proxy for Bmax, requiring the determination of the active fraction of receptors (α = Bmax/RT). This limitation may be ligand dependent, as agonists are likely to bind a lower fraction of receptors than antagonists (R* vs. R). Kinetic binding parameters were determined for the labeled ligand FITC-APEC, as well as for unlabeled competitor ligands (adenosine, NECA, and ZM 241,385). The kinetic parameter values were found to successfully predict independent competitive dissociation curves. Finally, we highlight the region of ligand:receptor ratios that are well suited for the analytical solution approach and have shown that the numerical solution approach is suited for a broad range of experimental conditions and for determining rate constants for unlabeled ligands in competition with fluorescent ligand.
Footnotes
Declaration of Conflicting Interests
The authors declared no potential conflicts of interest with respect to the research, authorship, and/or publication of this article.
Funding
The authors disclosed receipt of the following financial support for the research, authorship, and/or publication of this article: This work was supported by NSF 1249200 and 1033268. P.M.M. was supported in part by NIH training grant T32GM008550. A.N.N. was supported in part by an NSF Graduate Research Fellowship. We thank Ed Lyman (UD) for helpful suggestions in data analysis and interpretation.
References
Supplementary Material
Please find the following supplemental material available below.
For Open Access articles published under a Creative Commons License, all supplemental material carries the same license as the article it is associated with.
For non-Open Access articles published, all supplemental material carries a non-exclusive license, and permission requests for re-use of supplemental material or any part of supplemental material shall be sent directly to the copyright owner as specified in the copyright notice associated with the article.