
Abstract
There is interest in developing inhibitors of human group III secreted phospholipase A2 (hGIII-sPLA2) because this enzyme plays a role in mast cell maturation. There are no potent inhibitors for hGIII-sPLA2 reported to date, so we adapted a fluorescence-based enzyme activity monitoring method to a high-throughput screening format. We opted to use an assay based on phospholipid substrate present in phospholipid vesicles since this matrix more closely resembles the natural substrate of hGIII-sPLA2, as opposed to phospholipid/detergent mixed micelles. The substrate is a phospholipid analogue containing BODIPY fluorophores dispersed as a minor component in vesicles of nonfluorescent phospholipids. Action of hGIII-sPLA2 liberates a free fatty acid from the phospholipid, leading to a reduction in quenching of the fluorophore and hence an increase in fluorescence. The assay uses optical detection in a 1536-well plate format with an excitation wavelength far away from the UV range so as to minimize false-positive library hits that result from quenching of the fluorescence. The high-throughput screen was successfully carried out on a library of 370,276 small molecules. Several hits were discovered, and data have been uploaded to PubChem. This study describes the first high-throughput optical screening assay for secreted phospholipase A2 inhibitors based on a phospholipid vesicle substrate.
Introduction
Secreted phospholipases A2 (sPLA2s) are a class of Ca2+-dependent enzymes that release fatty acids from the sn-2 position of glycero-phospholipids. 1 Humans contain several sPLA2s that fall into three structural groups (groups I, II, V, and X; group III; group XII), but all share a similar active site in which Ca2+ functions to help bind a phospholipid substrate to the active site and also plays a catalytic role. 2 Several inhibitor classes for sPLA2s have been reported, 3 but none have been found to inhibit group III sPLA2. We are interested in developing inhibitors of human group III sPLA2 (hGIII-sPLA2) because this enzyme is involved in mast cell function and maturation, and hence inhibitors may be useful anti–mast cell therapeutics. 4
Inhibitors of sPLA2s are more difficult to analyze than inhibitors of many enzymes because they act at the lipid-water interface (interfacial enzymes). Many inhibitors act as nonspecific agents that cause desorption of the enzyme from the interface. 5 Most previously reported assays for sPLA2s are not well suited for high-throughput assays of compound libraries. Many lack sensitivity and thus require impractical amounts of enzyme to screen hundreds of thousands of compounds. High-throughput screening (HTS) assays are commonly carried out with fluorescence-based optical readouts. Among fluorescence-based sPLA2 assays, the one based on pyrene-containing phospholipids is sufficiently sensitive and adaptable to small-volume assays in microtiter plates 6 but is not appropriate for HTS because excitation occurs in the near-UV, and thus there will be optical quenching with a large number of test compounds in the library. Furthermore, this assay uses a high amount of serum albumin in the aqueous phase to trap the fluorescent product, and this protein is well known to bind to many drug-like molecules.
In this article, we report the adaptation of an assay (MP07701; Molecular Probes (Eugene, OR) for sPLA2s that has all of the properties desired for a high-throughput assay: (1) the assay is sufficiently sensitive so that a reasonable amount of enzyme is needed, (2) the assay is easy to execute and miniaturize, (3) the fluorescence excitation and emission are well into the visible range where quenching is less of a problem, and (4) the assay uses phospholipid vesicle substrate, thus allowing compounds to be tested in a matrix that well resembles the natural environment of sPLA2s.
Materials and Methods
Materials
Commercial lipids were as follows: Red/Green BODIPY PC-A2 (part A10072; Molecular Probes, Eugene, OR); BODIPY Fluorescence Product (BODIPY FL C5) (part D3834; Molecular Probes, Eugene, OR); dioleoylphosphatidylcholine (DOPC) (part 850375; Avanti Polar Lipids, Alabaster, AL); dioleoylphosphatidylglycerol (DOPG) (part 840475; Avanti Polar Lipids, Alabaster, AL). Other reagents and supplies were: Tris (part 0497; Amresco, Solon, OH); NaCl (part 7581, Macron Fine Chemicals, Avantor, Center Valley, PA); CaCl2 (calcium chloride pellets) (part 1313; J.T. Baker, Avantor, Center Valley, PA); ethylene-bis(oxyethylenenitrilo)tetraacetic acid (EGTA) (part 03779; Sigma-Aldrich, St. Louis, MO); 96-well plates black (part 6005279; PerkinElmer, Waltham, MA).
Recombinant hGIII-sPLA2
Expression of hGIII-sPLA2 in Escherichia coli has been previously described. 7 Inclusion bodies were isolated as described. 8 The inclusion body pellet was dissolved in 35 mL of 6 M guanidine-HCl, 0.3 M sodium sulfite, and 50 mM Tris (pH 8.0) using a Dounce homogenizer and sonication. The mixture was treated with Thanhauser reagent. Full details have been published. 8 The mixture was centrifuged for 20 min at 10,000 rpm at 4 °C to remove insolubles, and the supernatant was subjected to refolding using the dialysis method 8 with refolding buffer consisting of 0.9 M guanidine-HCl, 50 mM Tris (pH 7.0), 0.8 M L-arginine, 6 mM L-cysteine, 5 mM L-methionine, 1 mM EDTA, and 0.1 M sulfobetaine SB 12 (Sigma-Aldrich, St. Louis, MO). After 3 h of refolding at room temperature, the mixture was removed from the bag and concentrated by ultracentrifugation using a YM-10 membrane (EMD Millipore, Billerica, MA). The concentrate was dialyzed against 20% acetonitrile/0.1% trifluoroacetic acid/5 mM L-methionine. The dialyzed solution was filtered to remove particulate (0.2-micron nylon-66 membrane) and submitted to high-performance liquid chromatography (HPLC) purification on a C18 Symmetry Shield column (Waters Corp., Milford, MA) using a gradient of 20% to 30% acetonitrile in water with 0.1% trifluoroacetic acid. Purity of hGIII-sPLA2 was estimated at 95% by sodium dodecyl sulfate polyacrylamide gel electrophoresis (SDS-PAGE). sPLA2s are very stable proteins, and we have shown in several previous publications that they can be purified in native form using the methods described above. They have at least five disulfides. Mass spectrometry analysis of our purified sPLA2s, including group III sPLA2, shows that all disulfides are formed. This has been published previously. 8
96-Well Plate hGIII-sPLA2 Inhibition Assay
Protein concentrations were measured with the Bradford dye reagent (Bio-Rad, Hercules, CA) using bovine serum albumin as a standard. hGIII-sPLA2 solution (1 mg/mL) was stored at −80 °C and was thawed on ice prior to assay. hGIII-sPLA2 assay buffer was prepared as 50 mM Tris HCl (pH 8.9), 100 mM NaCl, and 1 mM CaCl2. hGIII-sPLA2 stop buffer was prepared as 20 mM EGTA in 50 mM Tris-HCl and 100 mM NaCl. Fresh before use, the hGIII-sPLA2 solution was diluted with hGIII-sPLA2 assay buffer to a concentration of 14 µg/mL (7 µg/mL final concentration). Test compounds were dissolved and diluted in DMSO (typical stock solution 1 mM in DMSO). Then, 1 µL of compound solution and 49 µL of enzyme solution were combined in the well of a black 96-well plate and incubated at room temperature (25 °C) for 15 min. To generate the control wells, hGIII-sPLA2 stop buffer (20 µL) was added to a well containing 49 µL enzyme solution and 1 µL DMSO. During the incubation period, the BODIPY substrate solution in a suspension of liposomes was made as follows. Red/Green BODIPY PC-A2 (1 mM in DMSO), DOPC (10 mM in ethanol), and DOPG (10 mM in ethanol) were thawed to room temperature (25 °C). Solutions containing BODIPY reagents were protected from light. Red/Green BODIPY PC-A2 (6.5 µL), DOPC (6.5 µL), and DOPG (6.5 µL) were combined in a 1.5-mL conical polypropylene microfuge tube. The tube was flicked by hand several times to mix the substrate solution. After a brief centrifugation to bring the fluid to the bottom of the tube, 18 µL was removed and mixed with 982 µL of assay buffer, and the mixture was vortexed briefly (this gives 6 µM Red/Green BODIPY PC-A2 and 60 µM DOPC and DOPG). This substrate solution (50 µL) was added to the well containing hGIII-sPLA2 and inhibitor after the 15-min incubation period (see above) to start the reaction. The assay was incubated at room temperature (25 °C), protected from light, for 35 min. Stop buffer (20 µL per well) was then added to all wells (except for control wells, in which it was already present). The assay was incubated for an additional 10 min, and the plate was read on a UV/VIS fluorimeter (Victor3V; PerkinElmer) with 485 nm excitation and 535 nm emission.
96-Well Plate hGIII-sPLA2 Counterscreen Assay
Compounds that display a false-positive inhibition due to quenching of the fluorescent product released by the enzyme were identified using the following counterscreen method. The assay was run as previously described along with an additional well per test compound that contained 1 µL test compound in DMSO, 49 µL enzyme solution, 50 µL BOPIDY:DOPC:DOPG substrate solution (as above) but containing 300 nM BODIPY Fluorescence Product, and 20 µL stop buffer. The BODIPY Fluorescence Product was added from a 1-mM stock solution in DMSO. The amount of BODIPY FL C5 per well (150 nM) was determined by varying the concentration of BODIPY FL C5 until the fluorescence response matched that of the uninhibited enzyme.
1536-Well hGIII-sPLA2 Inhibition HTS Assay
The 96-well assay was miniaturized to the 1536-well plate format requiring some modifications, which resulted in the final conditions listed in
Screening Data
Raw fluorescent data were uploaded into the Scripps Research Institutes Molecular Screening Center (SRIMSC) HTS database (Symyx, Santa Clara, CA). Activity of each well was normalized on a per plate basis using the following equation:
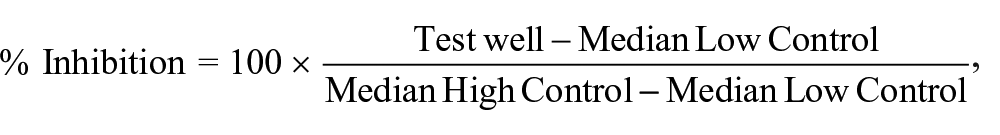
where Test well is defined as wells containing hGIII-sPLA2 enzyme in the presence of test compound and BODIPY PC-A2 substrate. Low Control is defined as the median of the wells containing test compounds, and High Control is defined as the wells containing DMSO and BODIPY PC-A2 but no hGIII-sPLA2.
Data were normalized on a per plate basis, and each assay plate underwent a quality control check. A value greater than 0.5 for Z′ was required before further testing. 9 For the primary screen, test compounds from the library were screened in singlicate at a final nominal concentration of 12.2 µM (final DMSO concentration of 1.2%). Well fluorescence was measured with a ViewLux plate reader (PerkinElmer), and the percent inhibition of each test compound was calculated on a per plate basis. A mathematical algorithm was used to determine nominally inhibiting compounds in the primary screen. Four values were calculated to determine an interval based cutoff: (1) the average percent inhibition of all high controls tested plus three times the standard deviation of the high controls, (2) the average percent inhibition of all low controls tested minus three times the standard deviation of the low controls, (3) the average percent inhibition of all compounds tested between (1) and (2), and (4) three times their standard deviation. The sum of two of these values, (3) and (4), was used as a cutoff parameter. Any compound that exhibited greater percent inhibition than the cutoff parameter was declared active.
For dose-response experiments, the average of triplicate well data was plotted against compound concentration. A four-parameter equation describing a sigmoidal dose-response curve was fitted using Assay Explorer software (MDL Information Systems; Symyx). All further results from the screens can be found at the National Institute of Health’s (NIH’s) PubChem website (http://pubchem.ncbi.nlm.nih.gov/) using the AID listed in the
A two-way Venn diagram generator was used to cross-compare data from the hGIII-sPLA2 confirmation and substrate counterscreen assays. Each of the assays was run at the SRIMSC and previously published in PubChem (AIDs 743126,743280, 743282, 743457, and 743455). The tool used is freely available and can be found at http://www.pangloss.com/seidel/Protocols/venn4.cgi.
Screening Library
The Molecular Libraries Small Molecule Repository (MLSMR) library was provided by BioFocus DPI (South San Francisco, CA) through the NIH’s Roadmap Molecular Libraries Initiative. Details regarding compound selection for this library can be found online at http://mli.nih.gov/mli/compound-repository/mlsmr-compounds/. At the time of this assay, the library consisted of 370,276 small molecules (more than 50% in the molecular weight range 350–410 g/mol) and comprises both synthetic and natural products, from either commercial or academic sources, that can be grouped into the following categories: specialty sets of known bioactive compounds such as drugs and toxins (0.65%), focused libraries aimed at specific target classes (2.85%), noncommercial sources (7.4%), and diversity sets covering a large area of the chemical space (89.1%).
HTS Confirmation and Tertiary Assays
The confirmation screen was run under the same conditions as the primary HTS, except that plates were assessed in triplicate, and results for each compound were reported as the average percent inhibition of the three measurements, plus or minus the associated standard deviation (PubChem AID 743280). For titration experiments, assay protocols were identical to those described above, with the following exception that compounds were prepared in 10-point, 1:3 serial dilutions starting at a nominal test concentration of 120 µM and assessed in triplicate using known methods 10 (PubChem AIDs 743457 and 743455).
Results and Discussion
Assay Principle
The structure of Red/Green BODIPY PC-A2 is shown in Figure 1 along with the product (BODIPY FL C5) released by the action of hGIII-sPLA2. Intramolecular fluorescence energy transfer between the two fluorophores of Red/Green BODIPY PC-A2 leads to low fluorescence. Formation of the free fatty acid product leads to an increase in fluorescence due to spatial separation of the two fluorophores. Susceptibility to compound interference is always a concern, and generally the higher the spectral emission of a fluorophore, the less likely a compound will interfere. A key advantage of BODIPY FL C5 is that excitation and emission maxima are well into the visible range, and thus there should be minimal interference from compounds in the test library that absorb in the UV-visible region. However, the possibility of interference is still relevant but is also concentration dependent. Here we set the substrate concentration at 3 µM, and generally as the concentration of the fluorophore increases, the contribution from fluorescent compounds should be reduced. If readily available, we may have chosen a probe that emits at a longer wavelength, known to help reduce compound interference because the intensity of scatter light decreases with increasing wavelength based on the Rayleigh principle. 11
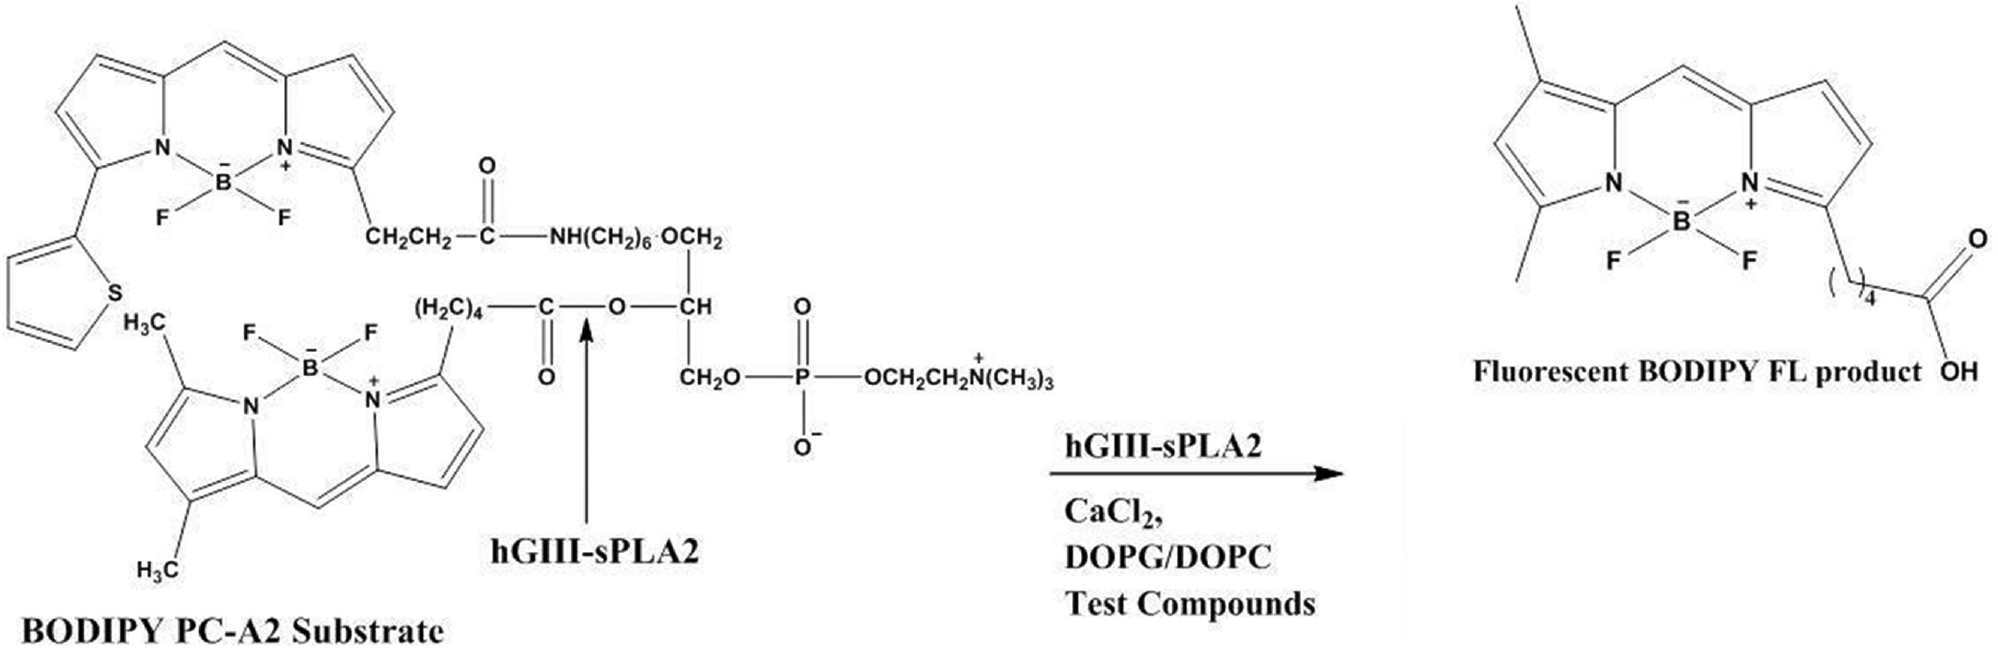
hGIII-sPLA2-catalyzed cleavage of Red/Green BODIPY PC-A2. DOPC, dioleoylphosphatidylcholine; DOPG, dioleoylphosphatidylglycerol.
Some of the compounds contained in the screening library may emit light in the region of our fluorescence assay response and thus lead to a false-negative result. To take measures to prevent this, fluorescence would need to be measured at time zero (before addition of the enzyme) and at the end point of the assay. The presence of a fluorescent compound would presumably shift the fluorescence upward at both time points and to the same extent. In the high-throughput screen, the fluorescence at time zero was not measured, and we decided to live with the possibility of false negatives rather than collecting twice as much fluorescent data. The results of the high-throughput screen show that fluorescent compounds (compounds with negative inhibition beyond the low control + 3 SD) tended to be more prevalent than putative quenchers. This was observed during the HTS campaign since 18,801 compounds had activity below three standard deviations plus the average of the sample field (<−19.21%). Thus, by employing a signal increase assay as opposed to a signal decrease assay, we were able to avoid false positives due to the presence of fluorescent compounds.
To rule out quenchers (compounds that did not inhibit the enzymatic activity but instead quenched the fluorescence of the BODIPY FL C5 product), we developed a counterscreen in which no enzyme was present. The amount of BODIPY FL C5 found to produce the same signal as that released by the uninhibited enzyme was incubated with the hits verified in the triplicate primary confirmation screen. A change in fluorescence of the enzymatic product by the library compound tells us if the compound itself reduces light emitted in the fluorescence channel of the instrument.
In this study, we adapted an assay for sPLA2s to an HTS platform based on phospholipids present in the form of lamellar vesicles. Some reported assays of sPLA2s rely on mixed-micelle substrate in which a small relative amount of phospholipid is dispersed in an excess of detergent as micelles. While the latter may be relevant to the action of pancreatic sPLA2 on phospholipid–bile salt mixed micelles, the group III sPLA2 acts on a cellular context and will presumably always act on phospholipids in cell membranes. In this article, we document that a high-throughput assay using lamellar phospholipid vesicles is feasible.
We chose to use Red/Green BODIPY PC-A2 as a minor component in vesicles of DOPC/DOPG so that phospholipid vesicles with a well-defined lamellar structure would be formed (in case the fluorescent phospholipid did not form well-structured vesicles). A second feature is that all known mammalian sPLA2s bind tightly to the interface of vesicles that contain a critical amount of the anionic phospholipid DOPG.7,8 Tight binding to the vesicle interface is important for sPLA2 inhibitor analysis, since many compounds inhibit these enzymes by the nonspecific effect of causing desorption of enzyme from the interface into the aqueous phase, and we are more interested in true competitive inhibitors that bind in the active site slot of sPLA2 bound at the lipid-water interface. 5
Recently, there has been a report of an assay platform that incorporated sPLA2 as a reporter enzyme. 12 This assay screened for inhibitors of deubiquitylase (DUB) using a substrate composed of ubiquitin (Ub) or a ubiquitin-like protein (UBL) fused to the N-terminus of an sPLA2, rendering the sPLA2 inactive. Cleavage of the Ub-sPLA2 substrate by DUB released the sPLA2, which cleaved the fluorescent reporter NBD C6-HPC, generating a signal that was linear with DUB concentration. In this study, the fluorescent lipid appears to be simply dispersed from a solid into an aqueous buffer. This probably leads to the formation of multilamellar vesicles. In contrast, in our study, we used the ethanol dilution method, which is a reliable way to obtain unilamellar vesicles. In addition, we did not use pure fluorescent phospholipid but rather a minor amount of the fluorescent phospholipid dispersed in nonfluorescent phospholipids that are well known to form well-defined, unilamellar vesicles.
Performance of the 96-Well Plate Assay
The robustness and reproducibility of the 96-well assay were examined by determining the Z′ value.
9
The fluorescence response at 35 min of 10 replicates containing 0.7 µg hGIII-sPLA2 per well, five preincubated with stop buffer and five in which stop buffer was added at 35 min, was used to determine a Z′ value of 0.90. Next, we tested the compound indoxam, a well-known inhibitor of many sPLA2s.
13
This compound dose-dependently inhibited hGIII-sPLA2 in the 35-min fixed time point assay with an IC50 of 24 µM (not shown). When 24 µM indoxam was added to the counterscreen, the fluorescent signal was reduced by only 11%, showing that the inhibitor blocks the action of hGIII-sPLA2 rather than quenching the fluorescence emission from the BODIPY FL C5 product. We also showed that inclusion of DMSO in the assay buffer up to 1.5% had no effect on the assay response (
hGIII-sPLA2 1536-Well Assay Optimization
Miniaturization of the assay to the 1536-well plate format (
Performance of the 1536-Well HTS Assay
To reduce the cost and increase the throughput of the HTS campaign, the assay was miniaturized and implemented in 1536-well plate format. Optimization of the assay was performed as described above during assay implementation to achieve the appropriate sensitivity and separation between controls. Two sets of controls, n = 24 per set, were placed on every assay plate: the high control (no enzyme) and the low control (enzyme), with both controls containing DMSO (1.2% final). These controls were used to ensure hGIII-sPLA2 activity, normalize the data, and monitor the data quality by measuring Z′ and signal-to-blank. While using such controls can artificially inflate Z′ values, they do provide a reasonable gauge of assay robustness, particularly when more appropriate small-molecule or specific ligand controls are unavailable. All primary HTS data were normalized to the no-enzyme control vs. enzyme and were used to produce a scatterplot to aid in visualization of the activity across the HTS campaign (
Fig. 2
). To help remove fluorescence artifacts, a counterscreen assay was implemented in a 1536-well plate format using the BODIPY fluorescence product in the absence of hGIII-sPLA2 enzyme at the HTS secondary and tertiary stages. This assay measures changes in fluorescence signal in the absence of the enzyme. To use this assay as a counterscreen, a titration of the BODIPY fluorescence product was performed to achieve a fluorescence signal equivalent to the completed reaction when the enzyme is present in the reaction. All subsequent experiments were performed using the conditions listed in
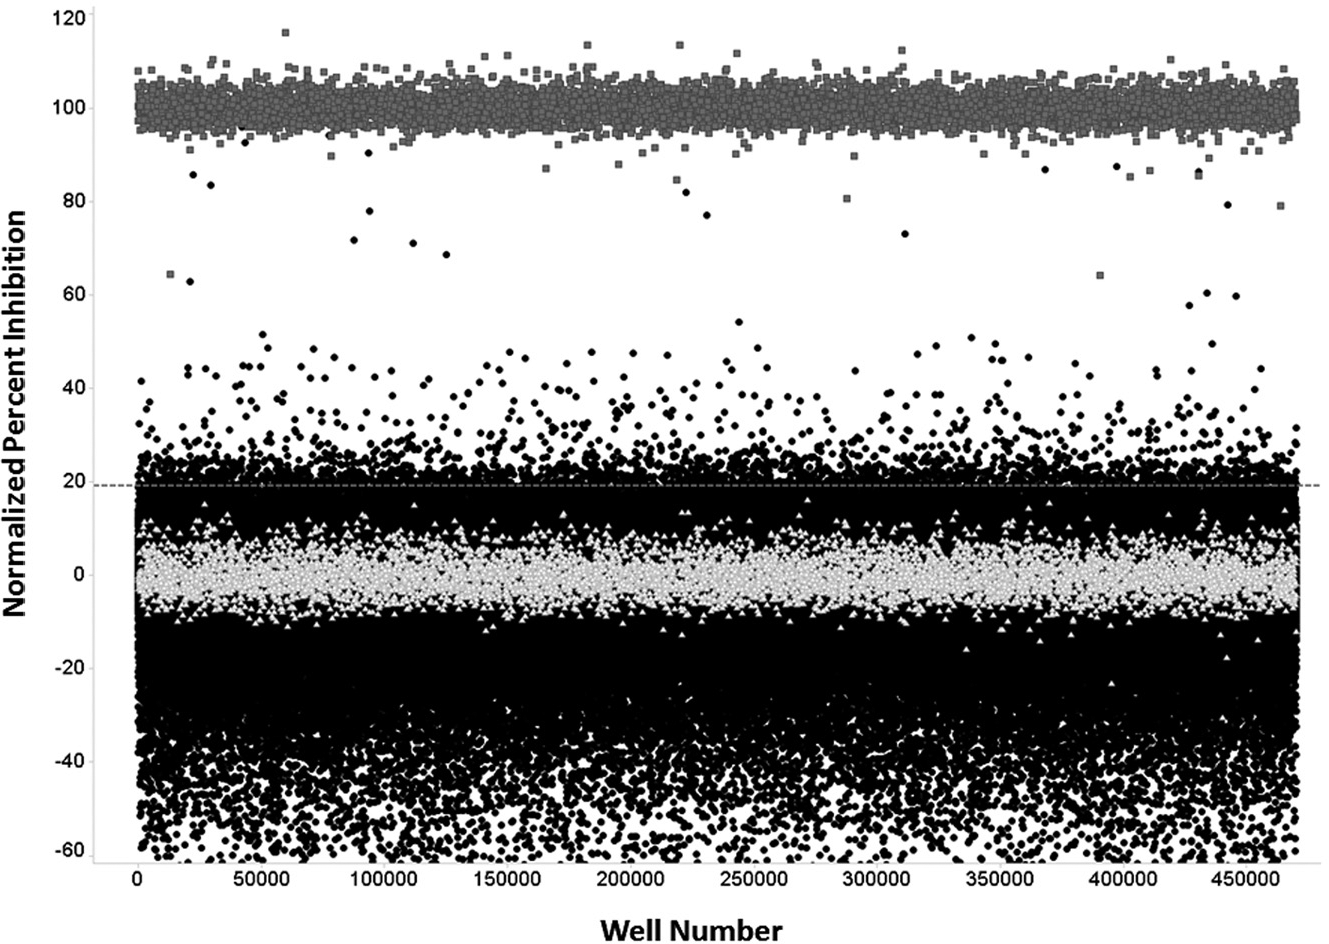
Primary screen scatterplot. Normalized percent inhibition data vs. well number were plotted in randomized order. (∆) Low control wells containing enzyme, substrate and DMSO only; (•) represent data wells containing enzyme, substrate, and compounds; and (■) represent high control wells containing substrate, no enzyme, and DMSO. The dashed line represents the hit cutoff of 19.21%, which is the average + 3 SD of the data wells. Compounds with inhibition above this line were considered primary active hits. Using the cutoff of 19.21%, 2,090 compounds were identified as hits.
The hGIII-sPLA2 primary assay and counterscreen assay were implemented at a final assay volume of 3 µL/well in 1536-well plates. The primary assay was screened against the entire available MLSMR collection; 370,276 unique compounds were tested. All MLSMR compounds were screened at 12.2 µM. The median of the wells containing test compounds was used as a low control. Using these controls, the hGIII-sPLA2 assay demonstrated robust screening statistics. It had an average signal-to-background ratio (S/B) of 1.91 ± 0.07 and a Z′ of 0.81 ± 0.04 (n = 306 plates).
Selection of Hits
The hGIII-sPLA2 inhibition screening campaign is summarized in
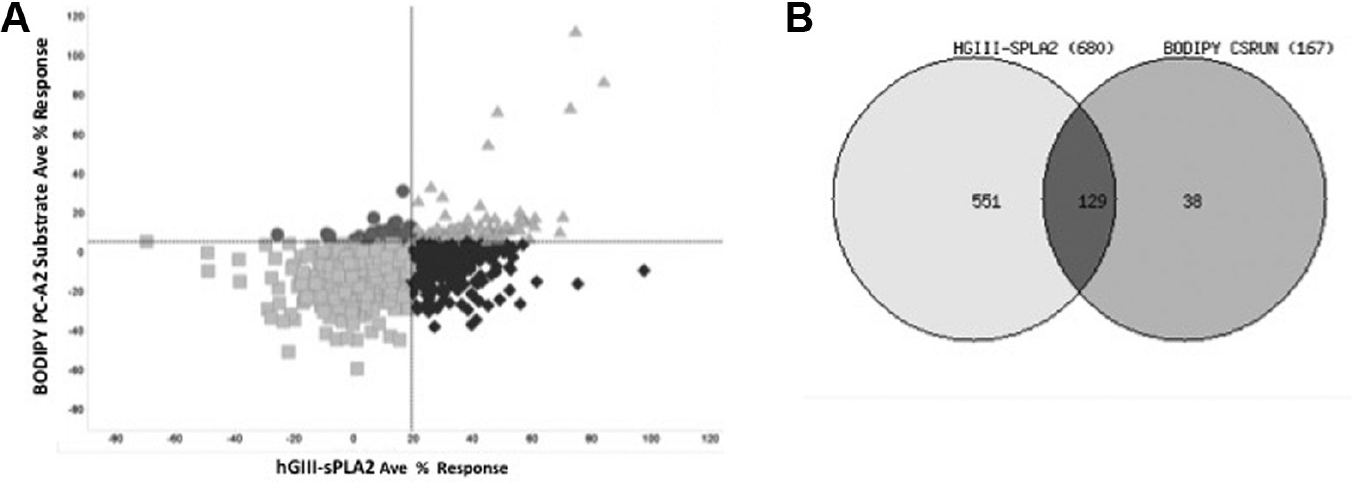
Comparison of hGIII-sPLA2 confirmation and substrate counterscreen results. (
This yielded 551 compounds out of the 680 (
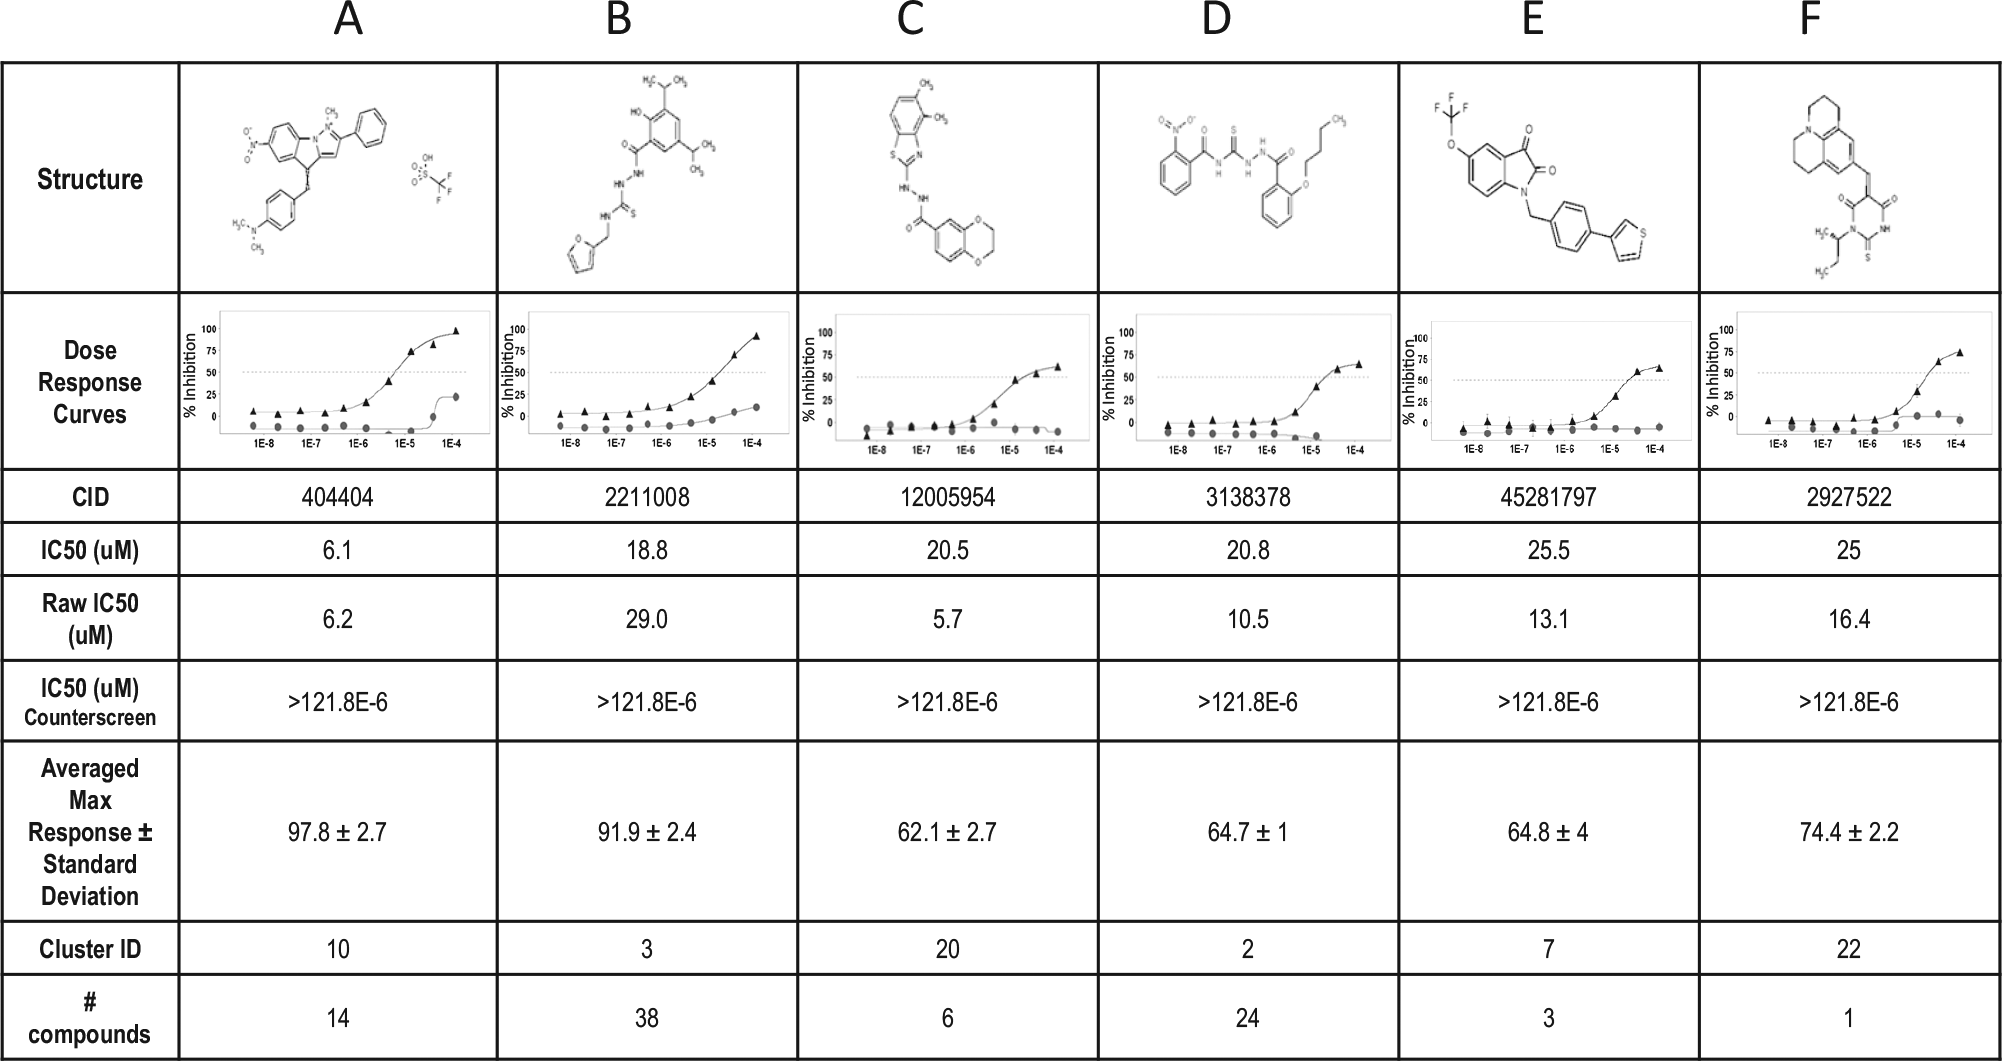
Compound dose-response curves. Normalized percent inhibition data (y-axis) were plotted vs. the log concentration in molar units on the x-axis. (▲) represent hGIII-sPLA2 fluorescence primary assay curve and (•) represent substrate counterscreen curve. Representive compounds for the top six most populated clusters (A–F) are shown with their structures, averaged maximum percent response, and the IC50 values. All these compounds have an activity >50% in the hGIII-sPLA2 primary assay and low activity (<50%) in the counterscreen assay. For cluster A, compound CID 404404 was identified as a hit with an IC50 <10 µM. For cluster B, compound CID 2211008 displayed high activity based on the averaged maximum response (92%) but with a final IC50 >10 µM (18.8 µM). Compounds named CID 12005954, 3138378, 45281797, and 2927522 had an averaged maximum response between 60% and 75% with an IC50 in the range of 20 to 30 µM (C–F). Note: Raw IC50 data were obtained by fitting nonnormalized data to provide a point of reference compared to IC50 data. Compounds that do not reach high levels of inhibition compared to the controls can still be fairly active so long as they exhibit an upper and lower asymptote. All these compounds have some structure-activity relationship based on the number of compounds represented in each cluster number assigned by the clustering algorithm; all results are provided in the supplemental section.
The CRCs for the 240 compounds were determined via testing in triplicate
10
a 10-point, 3-fold serial dilution format against both primary and counterscreen assays. The dose-response and counterscreen assays yielded satisfactory performance with an average Z′ of 0.77 ± 0.03 and an S/B of 2.04 ± 0.03 for the primary assay and a Z′ of 0.87 ± 0.01 and an S/B of 2.94 ± 0.08 for the counterscreen assay. Individual CRCs offered better insight into individual compound inhibition profiles between the primary and counterscreen assays, facilitating the triage of fluorescence artifacts such as CID “5399788,” a possible fluorescence quencher based on comparable inhibition in the primary and counterscreen assays (
Evaluation of Hits
Hits obtained from the high-throughput screen (
Fig. 4
) were tested in an orthogonal assay to confirm sPLA2 inhibition. A well-established assay for PLA2 activity on [3H]-oleic acid–labeled E. coli membranes
17
(see also supplemental materials) was employed for this purpose. This assay measures the release of radiolabeled oleic acid from autoclaved membranes derived from E. coli that have been grown in the presence of tritiated oleic acid. After incubation with sPLA2, membranes are centrifuged, and released [3H]-oleic acid in the supernatant is measured by scintillation counting. It should be noted that compound E (
Fig. 4
) was not available for further testing. The data confirm that compounds representing clusters A, C, D, and F are inhibitors of hGIII-sPLA2 (
Hits obtained from the high-throughput screen (
Fig. 4
) were further analyzed for specificity by testing their ability to inhibit two other mammalian sPLA2s, human group IIA and human group X sPLA2s (
The logP value for each compound was calculated using Collaborative Drug Discovery (CDD) software (
In conclusion, this study describes the first high-throughput optical screening assay for secreted phospholipase A2 inhibitors based on a phospholipid vesicle substrate. The screen displayed acceptable statistics and allowed us to carry out a successful analysis of a large library of compounds. A few hits emerged that will set the stage for a medicinal chemistry campaign in attempts to develop the first potent inhibitor of hGIII-sPLA2.
Footnotes
Acknowledgements
We thank Pierre Baillargeon and Lina DeLuca (Lead Identification Division, Translational Research Institute, Scripps, Florida) for their assistance with compound management.
Declaration of Conflicting Interests
The authors declared no potential conflicts of interest with respect to the research, authorship, and/or publication of this article.
Funding
The authors disclosed receipt of the following financial support for the research, authorship, and/or publication of this article: This work was supported by grants from the National Institutes of Health HL36235 and U54MH074404.
References
Supplementary Material
Please find the following supplemental material available below.
For Open Access articles published under a Creative Commons License, all supplemental material carries the same license as the article it is associated with.
For non-Open Access articles published, all supplemental material carries a non-exclusive license, and permission requests for re-use of supplemental material or any part of supplemental material shall be sent directly to the copyright owner as specified in the copyright notice associated with the article.