
Abstract
Induction of the Fanconi anemia (FA) DNA repair pathway is a common mechanism by which tumors evolve resistance to DNA crosslinking chemotherapies. Proper execution of the FA pathway requires interaction between the FA complementation group M protein (FANCM) and the RecQ-mediated genome instability protein (RMI) complex, and mutations that disrupt FANCM/RMI interactions sensitize cells to DNA crosslinking agents. Inhibitors that block FANCM/RMI complex formation could be useful therapeutics for resensitizing tumors that have acquired chemotherapeutic resistance. To identify such inhibitors, we have developed and validated high-throughput fluorescence polarization and proximity assays that are sensitive to inhibitors that disrupt interactions between the RMI complex and its binding site on FANCM (a peptide referred to as MM2). A pilot screen of 74,807 small molecules was performed using the fluorescence polarization assay. Hits from the primary screen were further tested using the proximity assay, and an orthogonal proximity assay was used to assess inhibitor selectivity. Direct physical interaction between the RMI complex and the most selective inhibitor identified through the screening process was measured by surface plasmon resonance and isothermal titration calorimetry. Observation of direct binding by this small molecule validates the screening protocol.
Introduction
Genomic instability is a hallmark of cancer that arises from the inactivation of DNA repair pathways during tumorigenesis. 1 This defect is exploited by many cancer chemotherapeutics that act by indiscriminately damaging DNA; cancerous cells lacking robust DNA repair capacity cannot survive chemotherapeutic doses that are tolerated by healthy tissue. Although DNA-damaging chemotherapies are often initially effective, reactivation of tumor DNA repair pathways can lead to treatment failure and poor patient outcomes. 2
DNA crosslinking agents, such as cisplatin and mitomycin C, are first-line therapies for a range of malignancies, including testicular, 3 lung, 4 and ovarian cancers. 5 Crosslinking agents act by covalently binding two DNA strands together, and the resulting interstrand crosslinks (ICLs) block DNA replication and transcription, leading to cell death unless the crosslinks are promptly repaired. 6 ICLs formed during S phase stall replication forks at crosslinks, activating the Fanconi anemia (FA) repair pathway. Nondividing cells or cells in the G1 cell cycle phase lack replication machinery and instead use nucleotide excision repair for ICL removal. 7 The FA pathway is commonly inactivated during tumorigenesis; reactivation or upregulation of FA pathway has been linked to chemotherapy resistance in multiple myeloma, 8 leukemia, 9 gliomas, 10 squamous cell head and neck tumors, 11 and ovarian cancer.12,13 Because noncancerous tissues maintain a functional alternative repair mechanism, reliance on the FA pathway is relatively specific for resistant tumors, and its disruption is hypothesized to restore sensitivity to crosslinking agents. 14
The FA pathway is initiated by binding of the FA complementation group M protein (FANCM) to ICL DNA, at which two replication forks have collided.15,16 FANCM subsequently recruits two DNA repair complexes, the FA core complex and the Bloom dissolvasome, to the lesion via protein-protein interactions. 17 The FA core complex directs the excision of the crosslink and bypass of one of the strands by a translesion DNA polymerase. The newly repaired strand serves as a template for homologous recombination to repair the remaining double-strand break. 15 This process results in the formation of a double Holliday junction DNA structure, which can lead to sister chromatid exchange events if not resolved by the Bloom dissolvasome. 18 The Bloom dissolvasome comprises the Bloom DNA helicase, topoisomerase IIIα, and a heterodimeric subcomplex of “RecQ-mediated genome instability” proteins, RMI1 and RMI2. 19 The RMI complex anchors the Bloom dissolvasome to FANCM by binding to a 34–amino acid motif within FANCM called MM2.17,20
We and others have demonstrated that the interaction between RMI1/2 and MM2 is required for repair of DNA crosslinks.17,21,22 The introduction of point mutations in either RMI1/2 or MM2 that disrupt the association leads to genomic instability, as measured by increases in sister chromatid exchanges. In addition, our laboratory has determined the X-ray crystal structures of the RMI core complex (composed of the OB2 domain of RMI1 and the entirety of RMI2) 22 and of the RMI core complex bound to MM2. 21 Along with biochemical and cellular studies, these structures have defined a binding pocket formed by RMI1/2 that is essential for MM2 binding. Introduction of a single lysine-to-alanine mutation in the RMI core complex pocket (K121 of RMI1) reduces the affinity for MM2 by over 80-fold, suggesting the pocket is a “hotspot” for anchoring MM2 onto the RMI1/2 complex. These data further suggest that the RMI/MM2 interaction could be amendable to disruption by small molecules that compete with MM2 for binding to this critical pocket. Such inhibitors could be of value as research probes and in the development of therapeutics that sensitize resistant tumors to DNA crosslinking chemotherapeutics.
To identify small-molecule inhibitors that block MM2 interaction with the RMI proteins, we have developed two high-throughput-ready assays that measure interaction between the MM2 peptide from FANCM and the RMI core complex. A 74,807-compound library was screened using a fluorescence polarization (FP)–based assay, and hits were rescreened using a proximity assay. Counterscreening against an orthogonal proximity assay led to the identification of a single compound that specifically disrupted the RMI core complex–MM2 interaction. Direct binding of this compound to the RMI core complex was confirmed by surface plasmon resonance (SPR) and isothermal titration calorimetry (ITC). Success of this pilot screen supports future screens against larger libraries of compounds and structure-activity relationship studies to improve potency of the identified inhibitor.
Materials and Methods
Protein Purification
Expression and purification of the RMI core complex, MM2 peptide, control MM2 variant peptide incapable of binding RMI (cMM2, containing F1232A and F1236A mutations), and fluorescein-labeled MM2 (F-MM2) were performed as previously described.22,21 MM2 was biotinylated (Bio-MM2) with the EZ-link NHS-PEG4-Biotin kit (ThermoFisher, Waltham, MA) according to the manufacturer-provided directions. Expression and purification of the RMI core complex with an N-terminal 6X-His tagged RMI2 were performed in an identical manner as unlabeled RMI core complex except that the thrombin protease site linking RMI2 and the His tag was mutated to prevent removal of the His tag. A peptide (SSBct) and a biotinylated variant (Bio-SSBct) containing the eight residues from the carboxyl-terminus of Escherichia coli single-stranded DNA binding protein were purchased from the University of Wisconsin Biotechnology center (Madison, WI). E. coli PriA was purified as previously described. 23
Fluorescence Polarization
All FP measurements were carried out in black 384-well plates (ThermoFisher). For IC50 determinations, F-MM2 and RMI core complex were preincubated in 10 mM Tris-HCl (pH 8.8) and 1 mM dithiothreitol (DTT). Unlabeled MM2 was serially diluted, added to the F-MM2/RMI core complex mixture to a final concentration of 7 nM F-MM2 and 100 nM RMI core complex, and covered with a foil plate seal. After incubation for at least 20 min, FP was measured on a Tecan Biotek “Synergy 2” plate reader (BioTek, Winooski, VT).
To assess the suitability of the FP assay for high-throughput screening (HTS) applications, 100 nM RMI core complex and 7 nM F-MM2 in 10 mM Tris-HCl (pH 8.8), 1.0 mM DTT, and 7.5% DMSO was mixed with 8 µM MM2 or SSBct peptide (positive or negative controls, respectively). After 20 min, the mixture was dispensed by multichannel pipet and centrifuged, and FP values were measured on a Biotek “Synergy 2” plate reader (128 wells of each peptide), independently repeated over 3 days. The Z′ score was calculated by equation (1) 24 :

FP HTS
Screening took place at the University of Wisconsin Small Molecule Screening and Synthesis Facility. A master mix of RMI core complex and F-MM2 (30 µL per well) was plated in black 384 shallow-well plates (ThermoFisher), using a BioTek “MicroFlo Select” reagent dispenser. Compounds were added using a Beckman FX liquid handler; 0.33 µL of a 10-mM stock was added for a final compound concentration of 33 µM. MM2 and cMM2 were each added to four wells of master mix per plate to a final concentration of 10 µM to serve as controls. Following compound addition, plates were covered, centrifuged briefly, and incubated for 20 min at room temperature. FP measurements were taking using a Tecan “Safire 2” microplate reader. Instrument settings were as follows: top read, EX 470, EM 525/20, G-factor 0.89947. A suitable gain was calculated from the first plate of each day. Z′ scores were calculated for each plate; plates with Z′ scores <0.5 were rerun prior to analysis. All FP measurements from the primary screen will be made available on PubChem.
Screen Library Composition
A total of 74,807 compounds were screened from the following compound libraries maintained by the University of Wisconsin Small Molecule Screening and Synthesis Facility: Life Chemicals library of ~50,000 compounds, Maybridge HitFinder library of ~14,400 compounds, the National Institutes of Health (NIH) clinical collection of 4709 compounds, Prestwick library of 1280 compounds, the spectrum collection of 2000 compounds, and the JDRF transforming growth factor (TGF)–β collection of 2418 compounds. PIP-199, the most selective inhibitor discovered in the screen, was purchased from Life Chemicals (Burlington, ON, Canada).
Proximity Screen (AlphaScreen)
For determination of AlphaScreen IC50 values, the inhibitor was titrated into a fixed amount of Bio-MM2 and His-tagged RMI core complex under subdued lighting conditions. The final reaction mixture contained 30 nM Bio-MM2, 100 nM His-tagged RMI core complex, 30 mM MOPS-HCl (pH 7.2), and 0.05% (v/v) Triton X-100 to a final reaction volume of 10 µL. The white 384-well plate (ThermoFisher) was sealed with foil, centrifuged, and incubated for at least 2 h prior to measurement on a Tecan “M1000” plate reader.
For validation of the AlphaScreen assay under high-throughput conditions, 10 µL of reaction mixture containing 30 nM Bio-MM2, 100 nM His-tagged RMI core complex, 30 mM MOPS-HCl (pH 7.2), 0.05% (v/v) Triton X-100, 5% (v/v) DMSO, and 5 µM of either SSBct or unlableled MM2 (negative and positive controls, respectively) were added to white 384-well plates by multichannel micropipette. Plates were covered with foil seals, centrifuged, and incubated for 2 h prior to measurement. Large edge effects were noted on the extreme rows of the plate; these rows were omitted during subsequent experiments. A Z′ score was calculated using equation (1).
The PriA-SSB AS was prepared and analyzed as above, except the 10-µL reaction contained 100 µM inhibitor in a final mixture of 100 nM PriA, 100 nM Bio-SSBct, 10 mM HEPES-HCl (pH 7.4), 150 mM sodium chloride, 1 mM magnesium chloride, 10 mM DTT, 1 mg/mL bovine serum albumin, and 0.01% (v/v) Triton X-100.
Isothermal Titration Calorimetry
RMI core complex was dialyzed against 30 mM potassium phosphate (pH 7.0), 100 mM sodium chloride, and 10% (v/v) glycerol overnight at 4 °C. The sample was diluted and DMSO added to a final concentration of 1.5% (v/v) and 300 µM RMI core complex. PIP-199 dissolved in DMSO was diluted in the dialysis buffer to a final concentration of 30 µM and 1.5% (v/v) DMSO. RMI core complex was titrated into the sample cell containing PIP-199 solution maintained at 25 °C using a MicroCal VP-ITC (GE Healthcare, Little Chalfont, UK). Five 1-µL injections were followed by 14 injections of 1.6 µL. Data analysis was performed with Origin software using a single-site binding model (GE Healthcare).
Surface Plasmon Resonance
SPR experiments were performed using a Bio-Rad “ProteOn XPR36” system with ProteOn GLH sensor chips (Bio-Rad, Hercules, CA). Phosphate-buffered saline with detergent and DMSO (137 mM sodium chloride, 2.7 mM potassium chloride, 10 mM disodium phosphate, 1.8 mM monopotassium phosphate, 0.01% (v/v) Triton X-100, 1.5% (v/v) DMSO, pH 7.2) was used as running buffer throughout. RMI core complex was immobilized onto the sensor chip by amine coupling in 10 mM NaCH3O2 (pH 5.5). PIP-199 was serially diluted in running buffer containing 1.5% (v/v) DMSO from 150 µM to 9 µM using 2-fold dilutions and injected over the immobilized RMI core complex. Running buffer was injected simultaneously as a reference and subtracted from all traces. Analysis of SPR data was conducted using ProteOn Manager software (Bio-Rad). Data from each ligand surface were grouped to fit ka, kd, and Rmax with a Langmuir kinetic model. The dissociation constant, Kd, was calculated from the equation Kd = kd/ka.
Statistical Analysis
All analysis of dose-response curves was carried out in Prism version 5.0c (GraphPad Software, La Jolla, CA) using a four-parameter logistic fit to determine IC50 values.
Results
Development of the Primary FP Screen
To identify inhibitors of the RMI core complex–MM2 interaction, we adapted a previously developed FP assay 21 for use in a high-throughput format. In this FP assay, RMI core complex is incubated with fluorescein labeled MM2 peptide (F-MM2). After equilibration, F-MM2 is excited by polarized light. Free F-MM2 tumbles rapidly in solution, and the emitted light is less polarized relative to emissions from RMI core complex–bound F-MM2. The fraction of free F-MM2 may then be calculated from the ratio of unpolarized to polarized emission intensity.
In a prior study, we determined the Kd of the RMI/F-MM2 to be <5 nM and showed that unlabeled MM2 competed with F-MM2 with an IC50 of 520 ± 50 nM. 21 To adapt the assay for HTS, we transitioned to a 384-well format and evaluated assay performance. An IC50 of 510 ± 20 nM was observed by titration of unlabeled MM2 into a fixed concentration of performed RMI core complex/F-MM2 ( Fig. 1A , B ), in excellent agreement with the previously determined value. To further assess assay reproducibility and uniformity in a high-throughput format, RMI core complex and F-MM2 were incubated in 384-well plates in the presence of 7.5% DMSO and 8 µM of either unlabeled MM2 or an unrelated peptide, SSBct, serving as positive and negative controls, respectively. We observed a Z′ score of 0.53 over 3 days (n = 128 wells per control per day, 384 total), demonstrating the suitability of our FP assay for HTS ( Fig. 1C ).
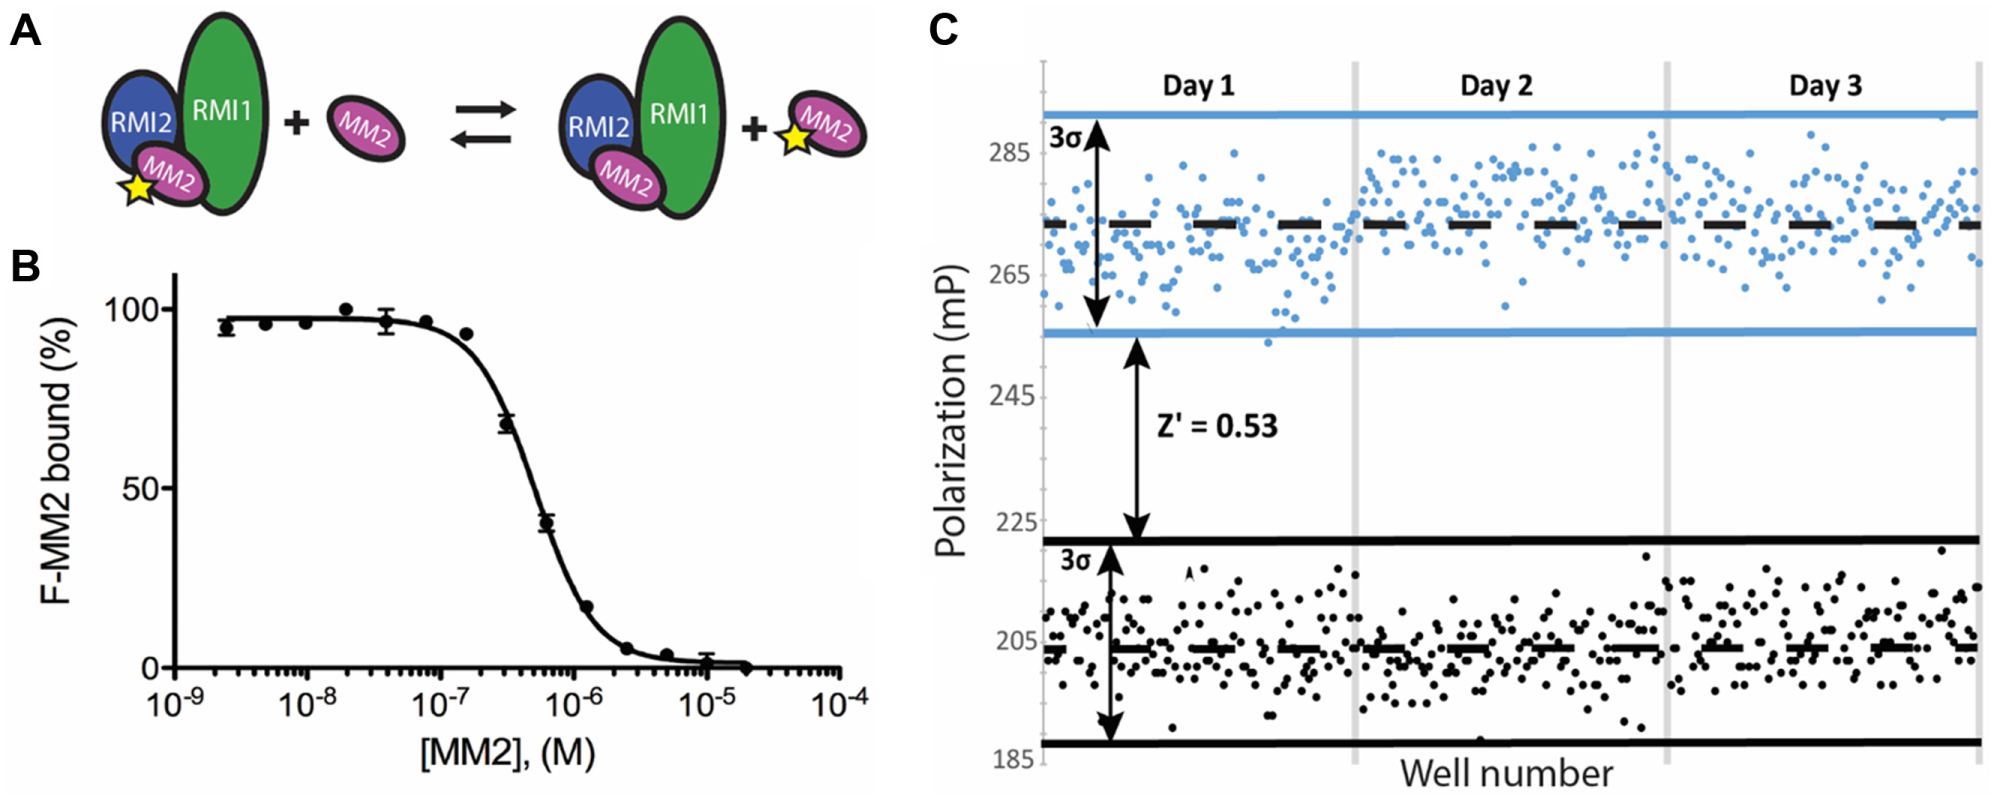
Characterization of the fluorescence polarization (FP) assay to identify inhibitors that disrupt the interaction between the RMI core complex and the MM2 peptide from Fanconi anemia complementation group M protein. (
Development of the Secondary AlphaScreen
Because small molecules with intrinsic fluorescence or fluorescence quenching properties may be falsely identified as hits in FP assays, we adapted an AlphaScreen (AS) proximity assay for use with the RMI core complex–MM2 interaction to serve as a secondary screen. AS is a bead-based proximity assay using donor and acceptor beads that are tethered to the interaction partners. Stimulation of the donor bead with 680 nm light generates singlet oxygen. If the singlet oxygen encounters an acceptor bead, a chemical reaction on the acceptor bead results in the emission of 570 nm light. The short half-life of the singlet oxygen ensures that signal is produced only when the interacting partners are in contact.
MM2 was biotinylated to allow for association with streptavidin-coated donor beads, and an N-terminal 6X-His tagged version of RMI2 within the RMI core complex was bound to the Ni2+-coated acceptor beads ( Fig. 2A ). Titrating unlabeled MM2 into the AS assay disrupted the RMI core complex/MM2 complex with an IC50 of 180 ± 20 nM, modestly lower than the FP assay ( Fig. 2B ). To validate our assay for high-throughput use, the AS assay was performed in 384-well plates in the presence of either 5 µM unlabeled MM2 or SSBct as positive or negative controls, respectively. There was large day-to-day variation in the maximum signal of the AS, likely resulting from pipetting error in the addition of the AS beads to the reaction mixture. To allow for day-to-day comparison, the average maximum and minimum signals for each day were normalized to 100 and 0, respectively. Our AS assay proved suitable for HTS with Z′ scores ≥0.7 for each day (n = 88 per control), with an overall Z′ of 0.75 (n = 264 per control) ( Fig. 2C ).
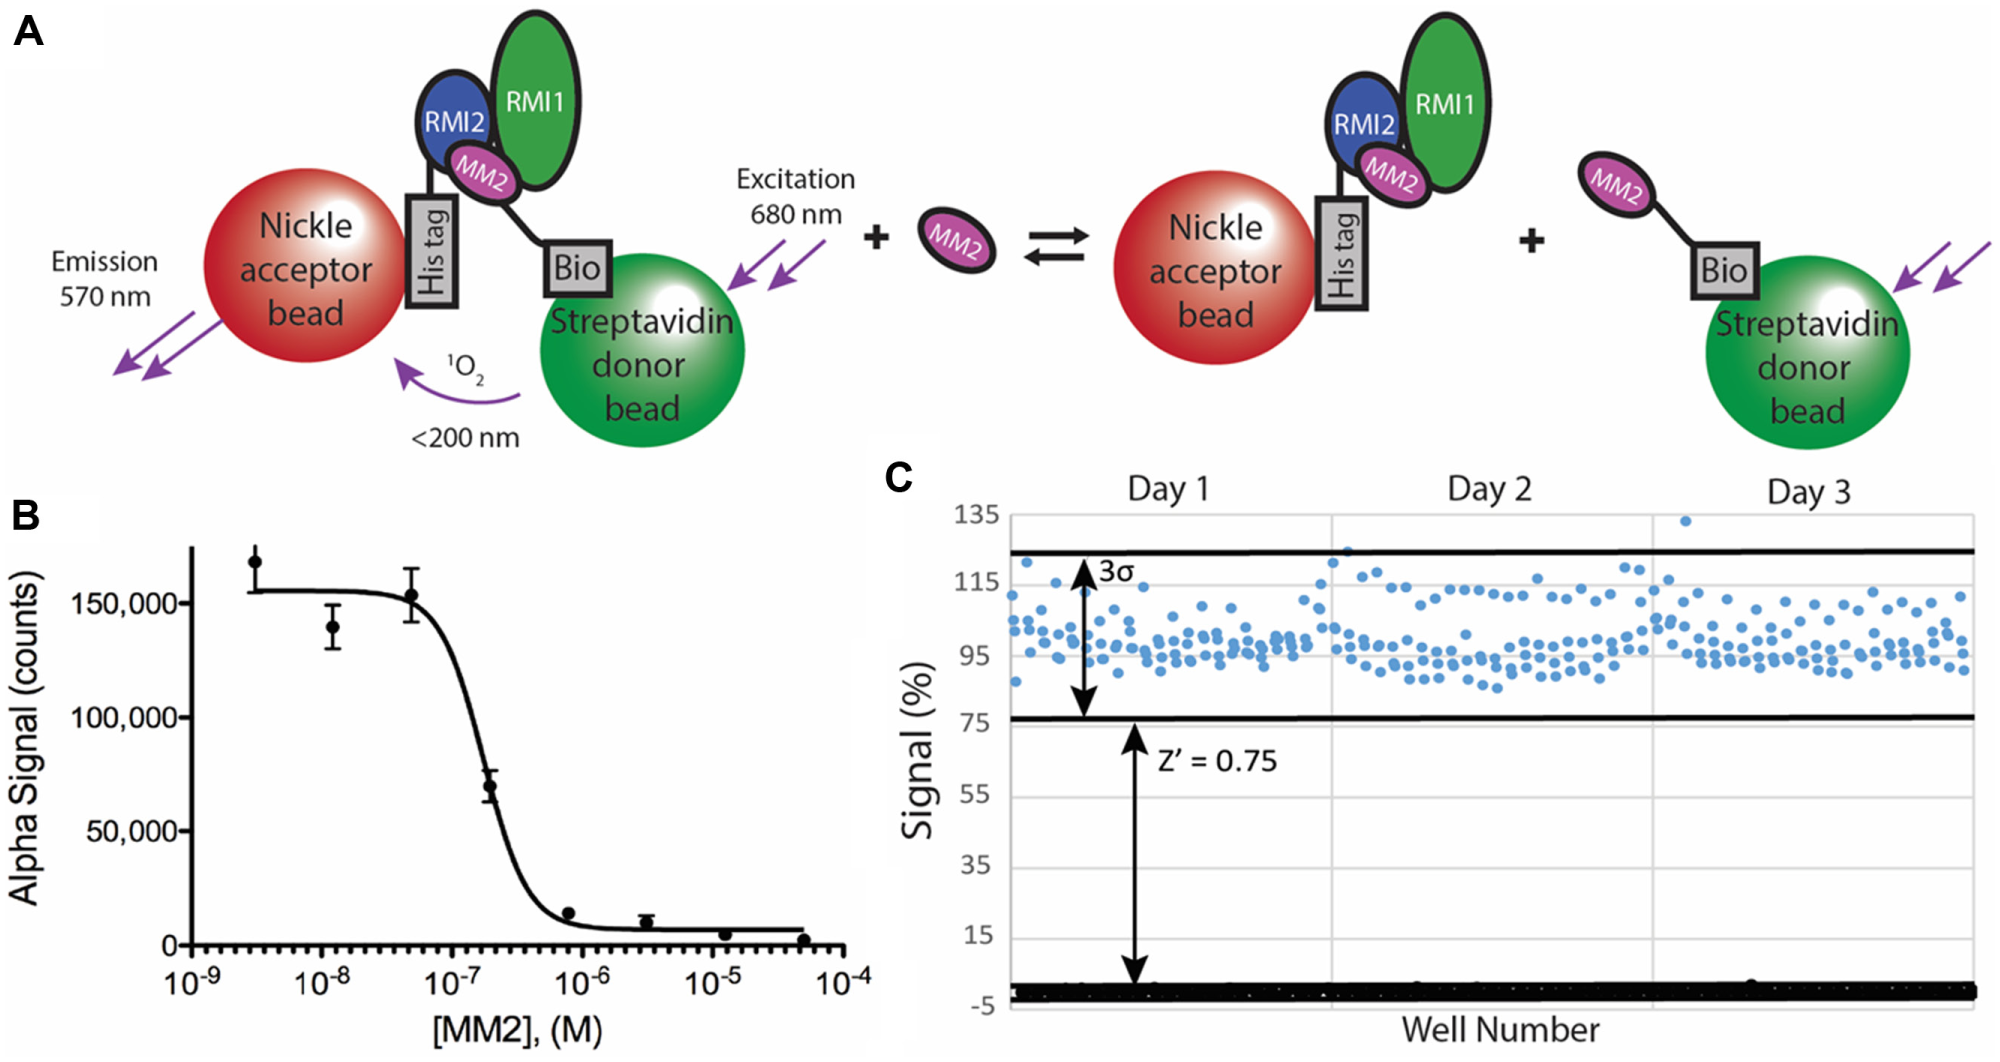
Characterization of the AlphaScreen (AS) assay to identify inhibitors that disrupt interaction between the RMI core complex and the MM2 peptide from Fanconi anemia complementation group M protein. (
High-Throughput Pilot Screen
To assess the effectiveness of our screening strategy for identifying small-molecule inhibitors of the RMI core complex–MM2 interaction, we conducted a pilot HTS campaign by screening 74,807 compounds at the Small Molecule Screening and Synthesis Facility at the University of Wisconsin. The primary FP screen was performed in 384-well plates, with each well containing 100 nM RMI core complex and 7 nM F-MM2. Each plate included four positive and four negative control wells for Z′ calculations with each plate. Small molecules dissolved in DMSO were individually added to wells to a final small-molecule concentration of 32 µM, and the polarization of each well was determined. Plates with individual Z′ scores of <0.5 were rescreened prior to analysis. We identified 415 hits (0.55% hit rate), defined as compounds that produced FP ≥2 standard deviations below the average FP of the plate ( Fig. 3 ). These compounds were rescreened in the FP assay at 320, 160, 32, and 3.2 µM. Sixty-eight compounds produced a dose-dependent decrease in polarization and were advanced to the secondary AS.
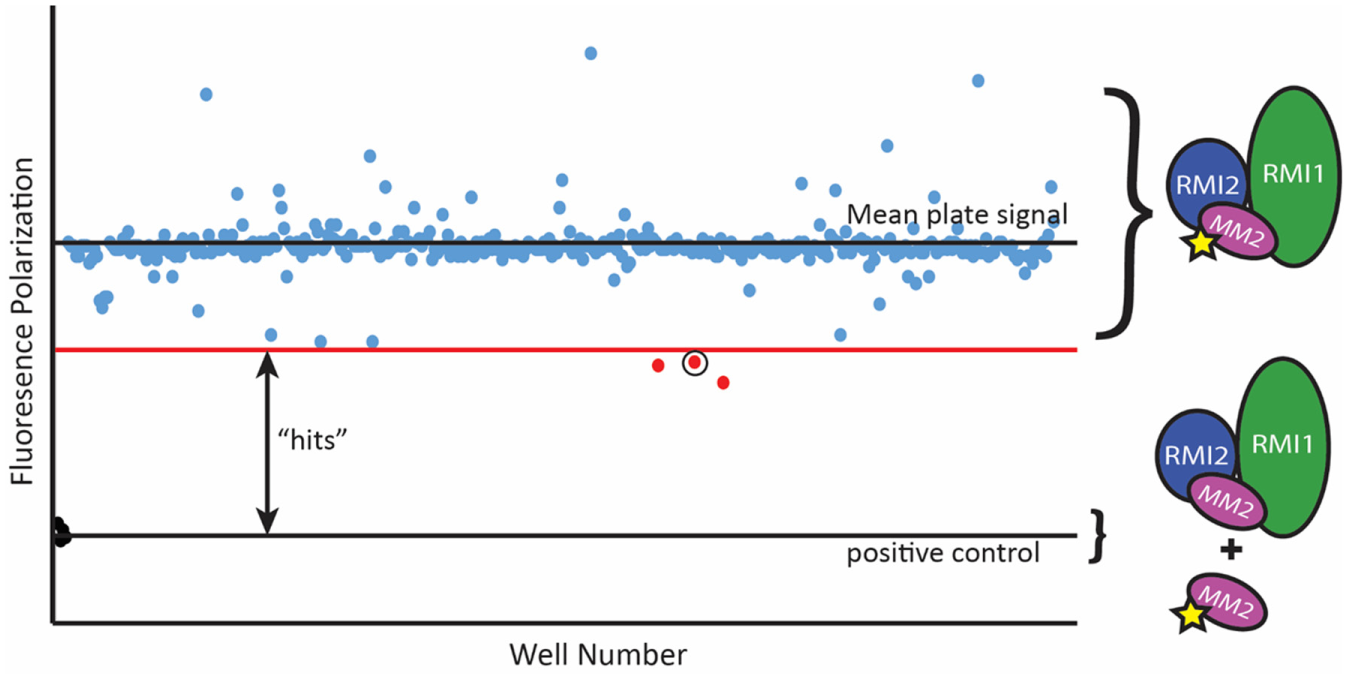
Representative plate from the high-throughput fluorescence polarization (FP) screen. Polarization values from each compound on the plate are reported. Compounds producing FP values ≥2 standard deviations below the mean plate polarization were advanced for further screening. The circled point is PIP-199.
Each compound was added to AS reactions at 100 µM, with 18 of the 68 compounds identified in the FP assay producing ≥50% decrease in AS signal. To exclude small molecules acting in a nonspecific manner, we tested these compounds in an AS assay developed against an unrelated bacterial protein-protein interaction (PriA/SSBct) at 100 µM. Seven compounds were found to also inhibit the PriA-SSBct interaction and were excluded. As the 11 remaining compounds exhibited significant structural similarities, stocks of seven of the most distinct compounds were purchased for further evaluation. Upon receipt, compounds were assayed against both the RMI core complex/MM2 and PriA/SSBct AS assays. A single compound, which we have named PIP-199 ( Fig. 4A ), exhibited selective inhibition of the RMI core complex/MM2 complex formation with an IC50 of 36 ± 10 µM ( Fig. 4B ), while the PriA-SSB AS was inhibited with an IC50 of 450 ± 130 µM. Repurchased PIP-199 was rescreened against the RMI core complex/MM2 FP assay and found to inhibit with an IC50 of 260 ± 110 µM ( Fig. 4C ).
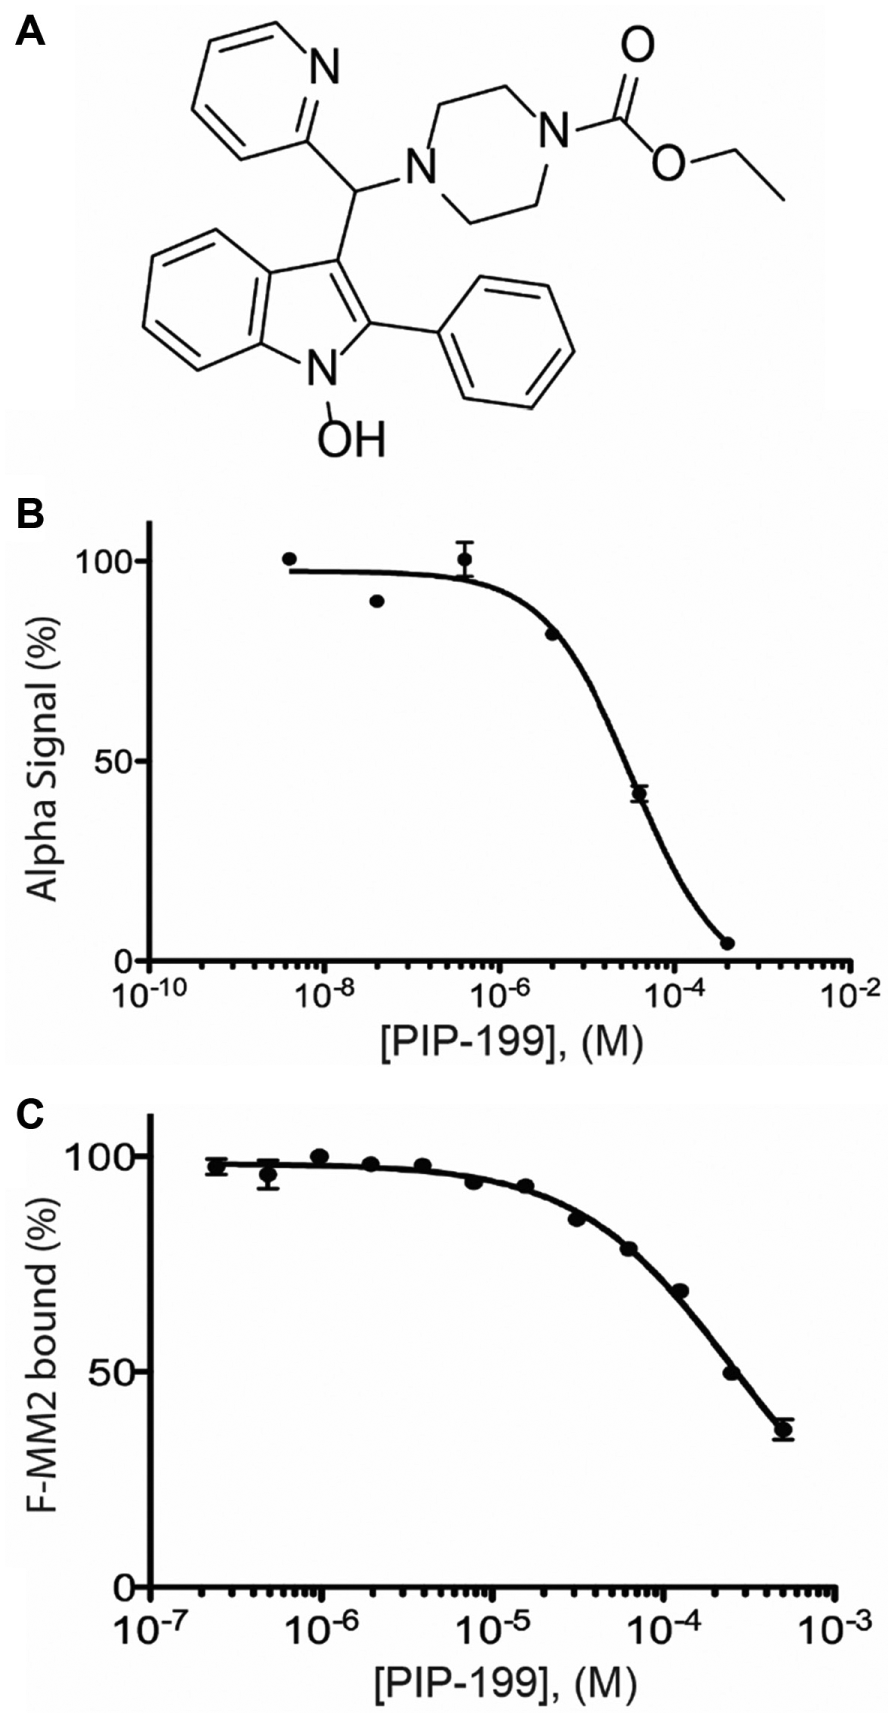
Characterization of the most selective inhibitor of the RMI core complex–MM2 interaction. (
Confirmation of Direct Physical Binding of PIP-199 to RMI Core Complex
Because of the disparate IC50 values obtained in the primary and secondary assays, we sought to confirm direct binding of PIP-199 to the RMI core complex. SPR has been shown to be capable of detecting small-molecule binding to proteins in a semi-high-throughput fashion. 25 To detect interactions via SPR, light is shined onto a gold chip bound by a receptor protein (RMI core complex) at an angle and then reflected onto a detector. A fraction of the light is not reflected but is absorbed to excite a resonant surface plasmon on the chip; the angle at which the absorbed light is reflected, or resonance angle, is highly dependent on the conditions at the chip surface. Binding of a small molecule (such as PIP-199) to the receptor alters the surface plasmon and is detected as a change in the resonance angle ( Fig. 5A ).
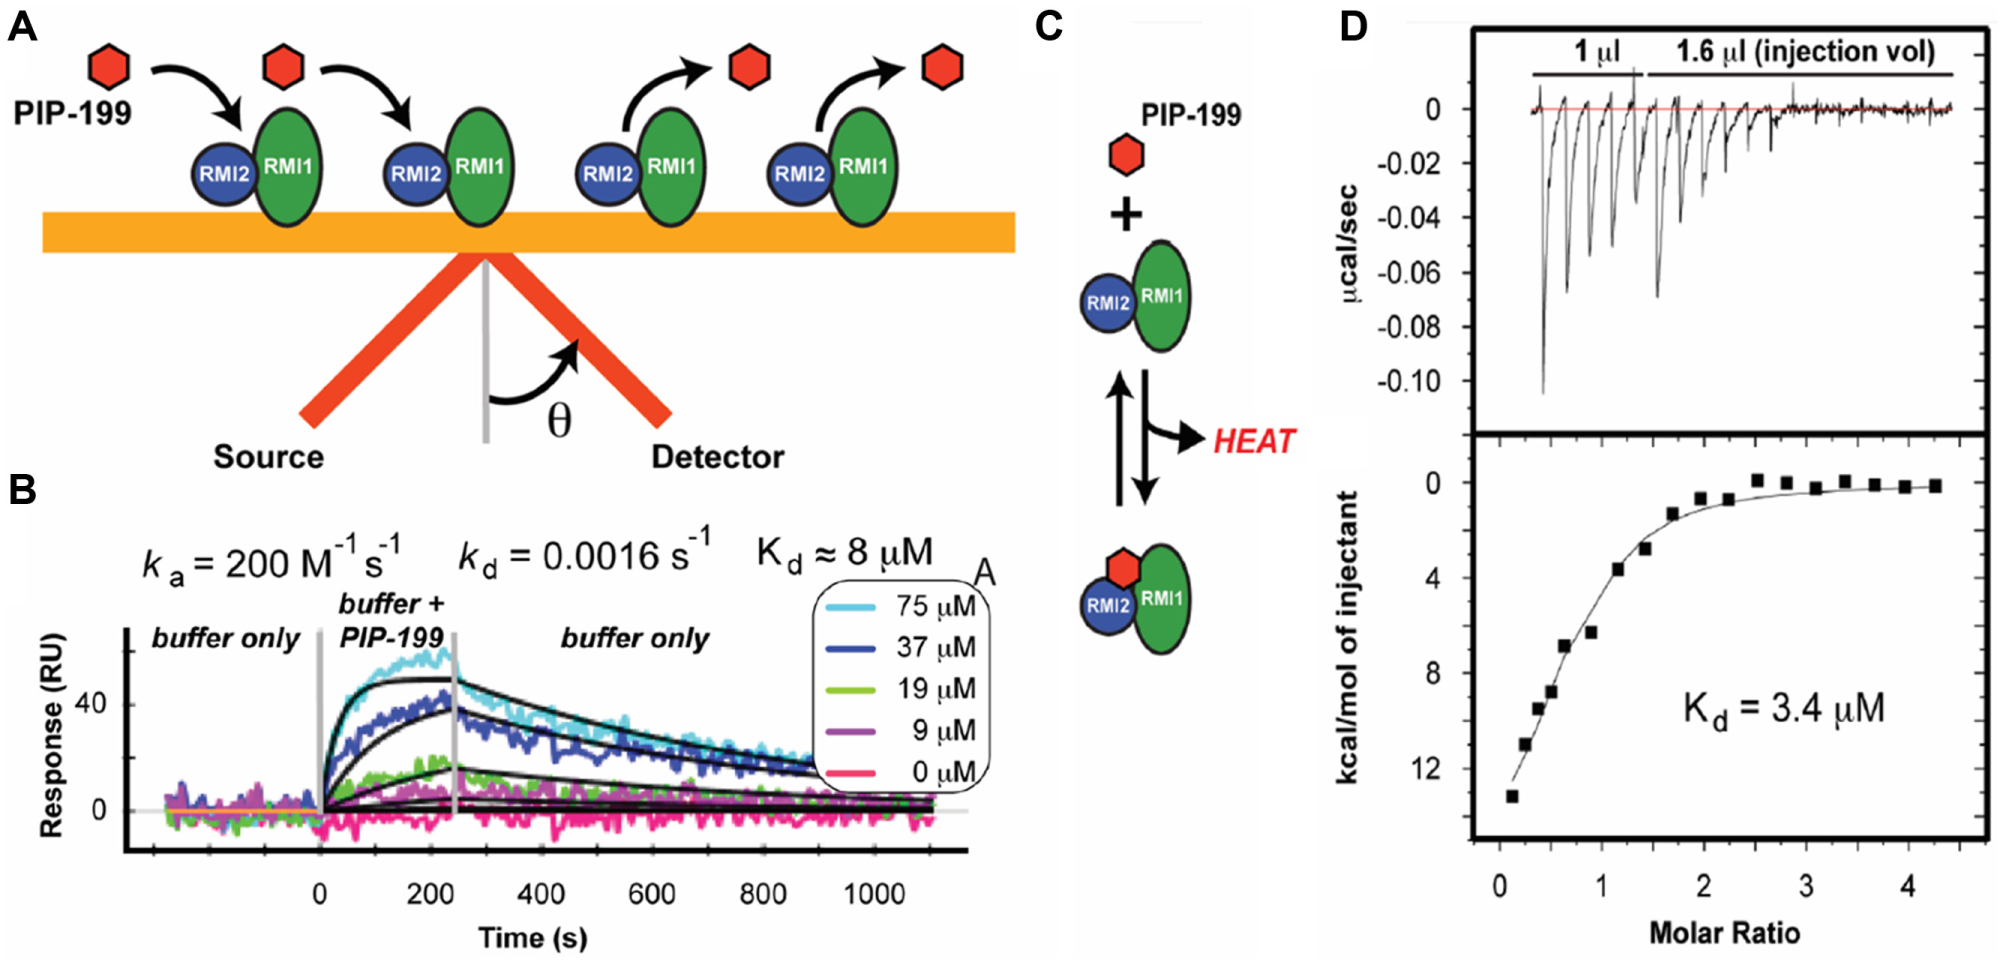
Biophysical confirmation of inhibitor binding to the RMI core complex. (
Anticipating the need to rapidly screen for physical binding as a part of a much larger screen, we sought to determine if the RMI core complex/PIP-199 interaction could be detected by SPR. Buffer containing varying amounts of PIP-199 was flowed over the immobilized RMI core complex, and a dose-dependent change in the resonance angle was observed ( Fig. 5B ). A Kd of 7.3 ± 0.8 µM (RUmax = 52 RU, χ2 = 15 RU) was calculated from the fit ka and kd ( Fig. 5B ). Nonspecific small-molecule binding to RMI core complex limited the quality of the fit, indicated by the relatively high observed χ2/RUmax (0.29, <0.1 is ideal).
To assess the reliability of the Kd obtained by SPR, we turned to ITC. In ITC, one interacting partner is titrated into a solution containing the other interacting partner. The heat evolved or absorbed from binding is measured by comparison to a reference cell lacking the interaction partners ( Fig. 5C ). RMI core complex was titrated into a solution of PIP-199 and was found to bind with a Kd of 3.4 ± 1.0 µM ( Fig. 5D ), in reasonable agreement with the Kd obtained from SPR. Each PIP-199 was calculated to interact with 0.68 ± 0.05 RMI core complexes, rather than the expected ratio of 1.0. This discrepancy likely results from the accumulation of small volumetric errors in the solubilization and dilution of the compound. Detection of a direct biophysical interaction by SPR and ITC suggests that activity in the FP and AS assays by PIP-199 is the result of true inhibition and not merely an assay artifact.
Discussion
Elevated activity of the FA DNA repair pathways has been implicated as a cause of chemotherapeutic resistance in a broad range of cancers, suggesting that targeted inhibition of the FA pathway could resensitize resistant tumors to ICL-forming chemotherapies.8,11 We and others have observed that destabilization of the RMI-MM2 interaction leads to a sensitization to crosslinking agents and an increase in genomic instability in cells.18,19 To screen for inhibitors that disrupt this interface, we have developed an HTS strategy that has identified RMI core complex–MM2 interaction inhibitors and biophysical assays showing that our most selective compound binds directly to the RMI core complex.
The first stage of our strategy uses an FP screen, followed by an orthogonal AlphaScreen to eliminate nonspecific inhibition. Both assays are suitable for use in HTS campaigns with Z′ scores of 0.53 and 0.75 for the FP and AS assays, respectively. Our pilot screen of 74,807 compounds yielded a single selective inhibitor of modest potency, a 0.001% overall hit rate. The low hit rate likely results from the high affinity of the RMI core complex–MM2 interaction (apparent Kd <5 nM). Only small molecules with a high affinity for the RMI pocket or an allosteric site would be capable of disrupting the RMI core complex–MM2 interaction, and these are expected to occur at a low frequency in a screening library. In a previous study, we identified MM2 variants with lower affinities for the RMI core complex. 18 Interactions with these variants are more easily disrupted and could complement the primary screen as a method to identify additional scaffolds for optimization.
One limitation of the screening method described here is the use of the RMI core complex and MM2 peptide in place of the full Bloom dissolvasome and full-length FANCM. The RMI core complex and MM2 peptide are stable and easily purified, which are essential for production of reagents needed for reproducible performance in an HTS. One potential complication of using minimal domains is that sites available for inhibition in our HTS may be obscured in vivo where full-length proteins and complexes exist. Activity against full-length proteins in a cellular context will be an important step in future studies that seek to determine the cellular activities of PIP-199 and related compounds.
In conclusion, our pilot screen has identified a small molecule that disrupts the protein-protein interaction between the RMI core complex and the MM2 region from FANCM. Structural studies to define the PIP-199 binding sites on the RMI core complex and SAR experiments to improve the activity of PIP-199 are currently under way. Future studies will test whether optimized, potent RMI inhibitors are able to block the FA DNA repair pathway in human cells. Such inhibitors will be valuable tools for the study of the mechanisms underlying DNA crosslink repair and could serve as lead compounds in developing new strategies for treating chemoresistant tumors.
Footnotes
Acknowledgements
The authors thank Gene Ananive from the University of Wisconsin Small Molecule Screening and Synthesis Facility for his assistance in carrying out the FP screen and Michael Killoran for the development of the PriA-SSB AS used as a counterscreen in this study.
Authors’ Note
The content is solely the responsibility of the authors and does not necessarily represent the official views of the National Institutes of Health (NIH). AS and SPR data were obtained at the University of Wisconsin–Madison Biophysics Instrumentation Facility, which was established with support from the University of Wisconsin–Madison and grants BIR-9512577 (NSF) and S10 RR13790 (NIH). A.F.V. conducted assay validation, secondary screening, and biophysical analysis. K.A.M. designed and performed the FP screen. A.F.V., K.A.M., and J.L.K. carried out data analysis. A.F.V., K.A.M., and J.L.K. wrote the manuscript.
Declaration of Conflicting Interests
The authors declared no potential conflicts of interest with respect to the research, authorship, and/or publication of this article.
Funding
The authors disclosed receipt of the following financial support for the research, authorship, and/or publication of this article: The project was supported by NIH R21 CA178475 (J.L.K.) and the Clinical and Translational Science Award program, through the NIH National Center for Advancing Translational Sciences (NCATS), grant UL1TR000427. K.A.M. was supported in part by an NIH Training Grant in Molecular Biosciences GM07217. A.F.V. is supported by the University of Wisconsin–Madison Integrated Training for Physician-Scientists NIH Training Grant GM008692.