
Abstract
The immortalized and proliferative cell line SH-SY5Y is one of the most commonly used cell lines in neuroscience and neuroblastoma research. However, undifferentiated SH-SY5Y cells share few properties with mature neurons. In this study, we present an optimized neuronal differentiation protocol for SH-SY5Y that requires only two work steps and 6 days. After differentiation, the cells present increased levels of ATP and plasma membrane activity but reduced expression of energetic stress response genes. Differentiation results in reduced mitochondrial membrane potential and decreased robustness toward perturbations with 6-hydroxydopamine. We are convinced that the presented differentiation method will leverage genetic and chemical high-throughput screening projects targeting pathways that are involved in the selective vulnerability of neurons with high energetic stress levels.
Introduction
Studies aiming to understand relationships between molecular and cellular events typically require large numbers of genetic or environmental perturbations. Compound as well as genetic screens are increasingly demanded approaches for systems biology studies targeting multifactorial neurodegenerative diseases. The interpretability of results, however, depends on experimental reproducibility and controllability. In a recent publication, we analyzed the whole genomic sequence of SH-SY5Y, presented RNAseq and proteomics datasets for undifferentiated cells, and provided network analysis tools for the evaluation of cell line suitability in the context of genetic perturbation studies. 1 This information provides a solid base for experimental design and data interpretation. The ability of SH-SY5Y cells to differentiate to a neuronal phenotype further leverages their potential for screening projects in neuroscience.
SH-SY5Y cells are a subclone of the SK-N-SH cell line, which was originally established from a bone marrow biopsy of a 4-year-old female neuroblastoma patient and is presumed to arise from neural crest cells. The SH-SY5Y cell line has been described to produce both substrate adherent (S-type) and neuroblastic (N-type) cells that can undergo transdifferentiation. 2 Therefore, even though the SH-SY5Y cell line is derived from triple successive subclone selection of N-type cells, it contains a small proportion of S-type cells. Several differentiation protocols have been developed in order to optimize the properties of SH-SY5Y as a neuronal cell culture model. 3 The most widely accepted are differentiation protocols involving treatments with retinoic acid (RA), and it has been reported that the established effects of RA on neuronal differentiation can be further enhanced by the brain-derived neurotrophic factor (BDNF).4,5 As retinoic acid has known effects on mitochondria and energy metabolism,6,7 and as mitochondrial dysfunction is supposed to be involved in the pathogenesis of several neurodegenerative diseases, we studied whether differentiation might affect the resilience of SH-SY5Y toward energetic stress. Indeed, cellular vulnerability and underlying energetic stress are important model properties for research in Parkinson’s disease. Mainly neurons with high energetic stress levels are affected in this disorder. 8 In contrast, undifferentiated SH-SY5Y cells have a low metabolic rate and can adapt their metabolism according to available substrates. 6 Here, we introduce an optimized differentiation protocol for SH-SY5Y cells and study related changes in neuronal marker fingerprints, energy homeostasis, and oxidative vulnerability.
Materials and Methods
Cell Culture
SH-SY5Y (cat. CRL-2266) neuroblastoma cells were obtained from the American Tissue Culture Collection (ATCC, passage 23). Cells were cultured in Dulbecco’s modified Eagle’s medium (DMEM, 41966-029, Invitrogen/Life Technologies Europe BV, Gent, Belgium) containing high glucose (25 mM),
Differentiation
The differentiation of SH-SY5Y cells was carried out in two steps using phase 1 and phase 2 media. The phase 1 medium was DMEM (cat. 41965-039, Invitrogen) containing high glucose (25 mM),
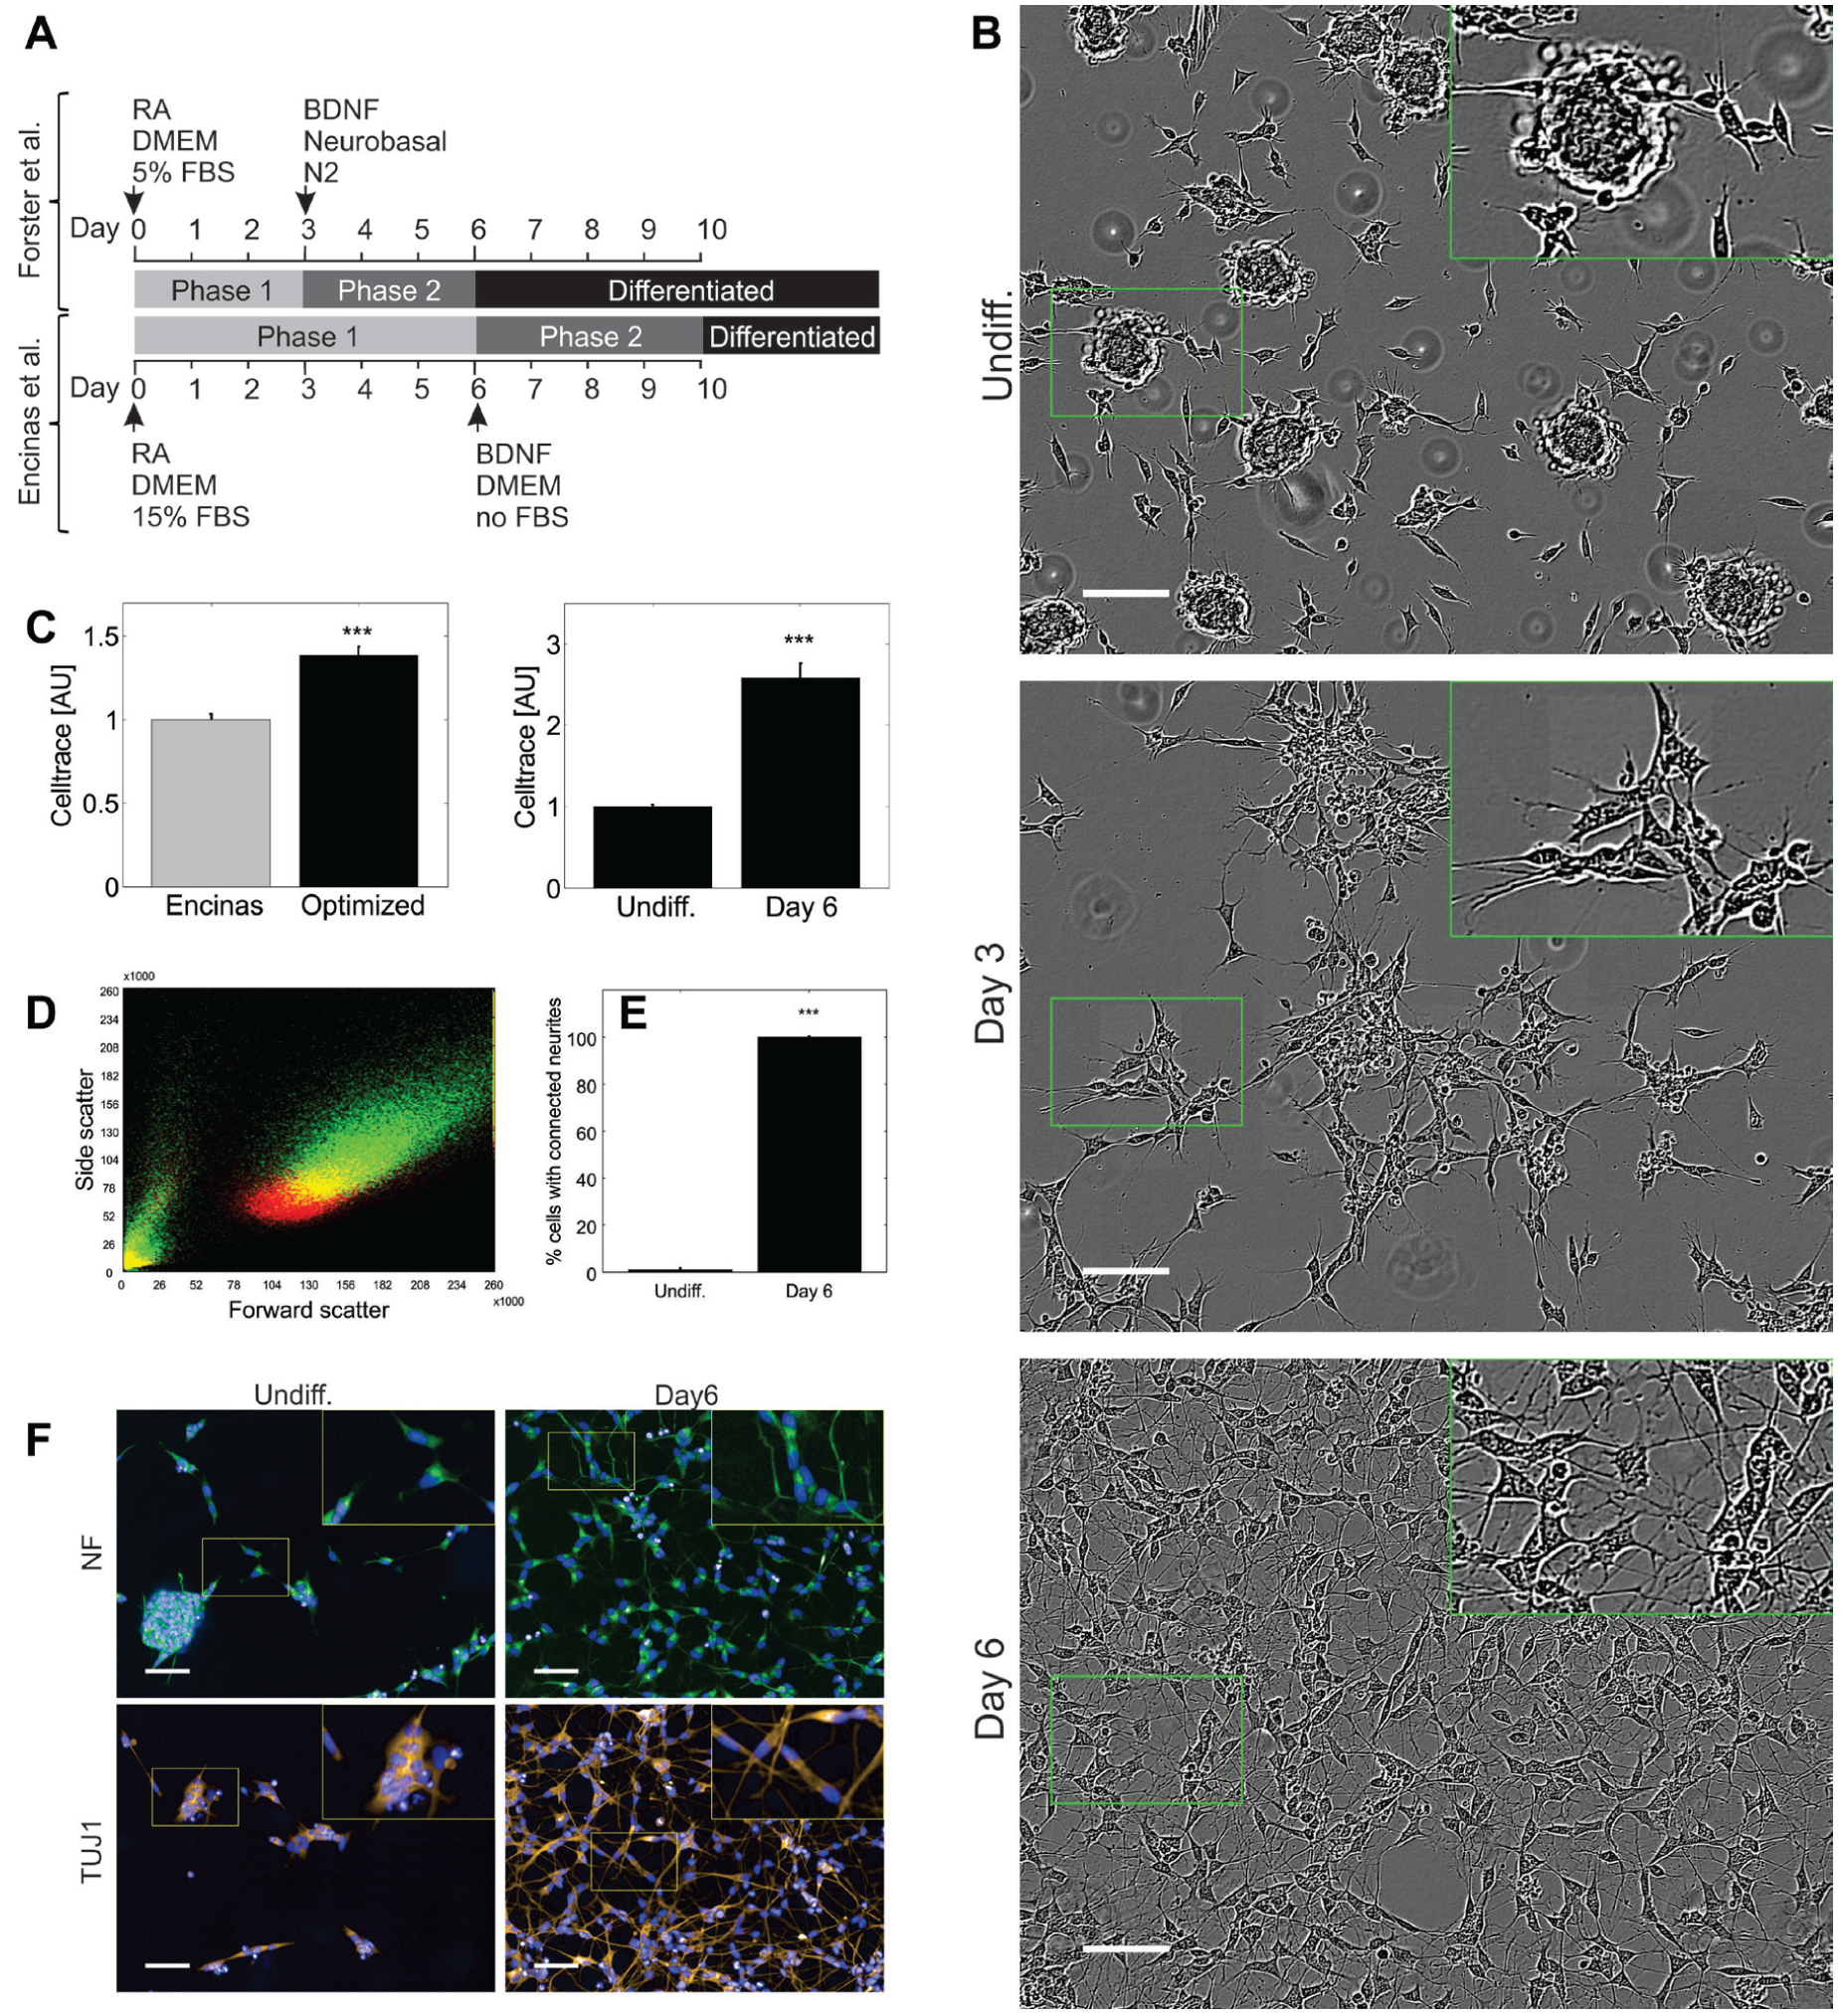
Morphology and growth in SH-SY5Y differentiation. (
Live Cell Imaging
Brightfield time-series images were acquired using an automated Incucyte microscope (Essen Bioscience, Welwyn Garden City, Hertfordshire, UK). Cells were seeded on a collagen-coated 96-well glass-bottom plate (cat. MGB096-1-2-LG-CC-L, Matrical, Spokane, WA) and imaged every hour during phases 1 and 2 of differentiation at 37 °C, 5% CO2, and saturated humidity. To enhance the visualization of neurites in brightfield images ( Fig. 1 ), an emboss effect was applied via ImageJ by convolving each image with the following kernel:

Immunofluorescence and Related Image Analysis
For immunofluorescence cells grown on poly-
Image analysis was done in Matlab R2013b (The MathWorks, Natick, MA). For each field of view and channel, the five acquired planes were maximum projected to a single plane. Masks for nuclei and cytoplasma were computed via thresholding, and small objects with an area below 250 pixels were removed. The mask for mitochondria was constructed from a flat-field-corrected mitochondria image highlighting local contrast information. For flat field correction, a Gaussian blurred image of mitochondria was subtracted from the corresponding maximum projection. Next, the mitochondrial mask was computed via thresholding and by restricting the area of interest to the cell area, which is defined as the union of nuclei and cytoplasma masks. Segmentation of cell bodies is based on the following rule set: (1) cell bodies lie within perinuclear zones, (2) cell bodies lie within the cell mask, and (3) at least some mitochondria are present within the perinuclear zone. The perinuclear zone was computed via dilatation of the nuclei mask using a disk-shaped structuring element. The presence of mitochondria was detected via thresholding on maximum projections. Furthermore, the raw cell body mask was filtered with a median filter in order to remove pixel noise. Boolean operations were used to define the cell periphery and to assign mitochondrial area to either cell body or periphery. The plotted variables were defined per field of view as follows: (1) Neurite growth corresponds to the ratio between the sum of periphery pixels and the sum of cell body pixels. (2) The area of mitochondria per cell corresponds to the ratio between the sum of mitochondrial pixels and the sum of cell mask pixels. (3) The area of mitochondria per nucleus is defined as the ratio between the sum of mitochondrial pixels and the sum of nuclei mask pixels. (4) Mitochondrial distribution is defined as the ratio between the sum of mitochondrial pixels in the periphery and the sum of mitochondrial pixels in the cell body.
Analysis of Mitochondrial Membrane Potential and 6-Hydroxydopamine Perturbations
6-Hydroxydopamine (6-OHDA, Sigma-Aldrich, H4381) solutions (10 mM) were freshly prepared in antioxidant saline corresponding to water supplemented with 0.9% NaCl and 0.2% ascorbic acid. The cells were perturbed with 25, 100, or 200 µM 6-OHDA and incubated for 24 h at 37 °C and 5% CO2. Nuclei were stained with 1 µg/mL Hoechst 34580 (Invitrogen, H21486), membranes with 0.5× CellMask Deep Red (Invitrogen, C10046), and active mitochondria with 10 nM tetramethylrhodamine methyl ester (TMRM, Invitrogen, T-668), allowing us to analyze mitochondrial membrane potential according to the TMRM subquenching method, where an increase in fluorescence indicates an increase in mitochondrial membrane potential. After staining for 1 h at 37 °C and 5% CO2, the media were replaced with fresh media containing appropriate 6-OHDA concentrations and TMRM, but no Hoechst and CellMask. Images were acquired on an Opera QEHS microscope (PerkinElmer, Hamburg, Germany). Hoechst and CellMask were measured in a simultaneous exposure, using a double excitation with 405 and 640 nm lasers. Hoechst was detected behind a 450/50 nm bandpass filter and CellMask behind a 690/70 nm bandpass filter. In a second exposure, TMRM was excited with a 561 nm laser and detected behind a 600/40 nm bandpass filter.
Image analysis was done with Matlab 2013b (illustrated in
The same images were also used for manual analysis of cells with connected neurites. Cell counts were derived from the Hoechst channel, and neurite connectivity was analyzed in the CellMask channel. Only cells with visible neurites, connecting via these neurites to other cells, were considered as cells with connected neurites. The metric “morphologically defined differentiation efficiency” is the difference between cells with connected neurites in differentiated and undifferentiated cells, expressed in percent.
ATP Assay
For the analysis of ATP levels, cells were seeded at a density of 20,000 cells per well in CellCarrier-96 plates (cat. 6005550, PerkinElmer). Before starting the ATP assay, the amount of cells was quantified via Hoechst staining and fluorescence microscopy. Briefly, nuclei were stained using 125 ng/mL Hoechst 34580 (cat. H21486, Invitrogen) and fluorescent images were acquired on an Opera QEHS microscope (PerkinElmer), using a 10× objective (NA 0.4). For normalization against uneven cellular distribution within a well, 47 fields of view covering the total area of the well were acquired. To cover both flat and elevated nuclei at each position, z stacks with three planes at a distance of 7.7 µm between each plane were acquired. Hoechst fluorescence was excited with a 405 nm laser, and the emission was detected behind a 450/50 nm bandpass filter.
Image analysis was performed in Matlab 2013b. First, the three planes available for each field of view and channel were maximum projected. Nuclei were highlighted with a white 15-pixel large top-hat filter. To reduce noise in the resulting images, a Gaussian filter of size 5 × 5 pixels with a standard deviation σ = 2 was applied. An approximate nuclei mask was then created by applying a fixed threshold. Small pixel noise objects were removed by erosion with a two-pixel-radius disk-shaped structuring element. The resulting mask was used for morphological reconstruction of the nuclei mask described above.
For ATP assays, the CellTiter-Glo luminescent cell viability assay kit (cat. G7571, Promega, Leiden, Netherlands) was used. CellTiter-Glo reagent was prepared according to the manufacturer’s instructions and luminescence was measured in white Costar 96-well plates (cat. 3912, Corning, Amsterdam, Netherlands) using a Synergy Mx monochromator microplate reader (BioTek, Winooski, VT) with an integration time of 1 s. The average nucleus area per cell for each of undifferentiated and differentiated cells was determined manually. Luminescence data were transformed to quantitative ATP data by integrating ATP titrations. Finally, the number of nuclei was estimated by dividing total nucleus areas by average nucleus areas. The ratio between titrated ATP level and cell number corresponds to average quantities of ATP per cell.
Cell Proliferation Assay
Cell proliferation was quantified using Celltrace Violet (cat. C34557, Invitrogen). Celltrace Violet diffuses into cells where it is cleaved by esterases to yield a blue fluorescent compound. This compound covalently binds to intracellular amines, resulting in stably retained staining. In consequence, fluorescence is evenly distributed between daughter cells during cell division. For staining, cells were incubated with 1 µM Celltrace Violet in PBS for 20 min at 37 °C. Excess staining was quenched with five sample volumes of complete growth medium (DMEM + 10% FBS + 1% P/S) and washed away. The stained cells were plated on six-well plates at a density of 300,000 cells per well and differentiated as shown in the results. Prior to cytometry, the cells were detached with trypsin. Trypsinization was blocked with complete growth medium, and cells were resuspended in PBS. Cytometry analysis was done with a Fortessa cytometer (BD Biosciences, Erembodegem, Belgium) using a 405 nm excitation laser and a 450/50 nm emission filter. Statistics are based on median fluorescence intensities per read.
Analysis of Gene Expression
RNA from frozen cell pellets was extracted with the Qiagen RNeasy Mini Kit (cat. 74106, Qiagen, Venlo, Netherlands) according to the manufacturer’s protocol. RNA quality was assessed with an Agilent Bioanalyzer, and only RNA samples with an RNA integrity number ≥ 9 were used. For reverse transcription, 10 μg of RNA, 10 μL of oligo(dT)20 primer (cat. 18418020, Invitrogen), 10 μL of 10 nM dNTP mix, and molecular-grade water added up to a volume of 110 μL were incubated for 5 min at 65 °C. Next, 40 µL of 5× first-strand buffer, 10 µL of 0.1 M dithiothreitol, 10 µL of SuperScriptIII Reverse Transcriptase (cat. 18080044, Invitrogen), and 10 µL of RNase OUT inhibitor were added. The reverse transcription was incubated at 50 °C for 45 min. For inactivation, the reaction was heated to 70 °C for 15 min.
Quantitative real-time PCR (qPCR) was performed using a Roche LightCycler 480 II. Reaction mixes were composed of the following components: 5 µL of iQ SYBR Green Supermix (cat. 170-8885, Bio-Rad, Hercules, CA), 2.5 µL of 0.12 μg/μL cDNA, and 1.25 µL of 2 μM forward and reverse primers, respectively. A list of primers and the PCR program can be found in the supplementary information (
Analysis of Plasma Membrane Potential
The voltage-sensing fluorescent protein (VSFP) constructs pCAG-VSFP-Butterfly-1.2 and pCAG-2.42 were kindly provided by Dr. Thomas Knopfel.11–13 Transfections were done using Lipofectamine 2000 transfection reagent (cat. 11668019, Invitrogen), according to the manufacturer’s protocol, using 200 ng of DNA and incubating for 20 min at room temperature for complex formation. For microscopy, an Opera QEHS microscope (PerkinElmer) was used and samples were excited with a stable-state 488 nm laser. The channels of the fluorescence resonance energy transfer (FRET) pair YFP and mKate2 were acquired using a 20× water immersion objective (NA 0.7) and two cooled charge-coupled device (CCD) cameras with simultaneous acquisition and 800 ms exposure time. The YFP signal was detected behind a 520/35 nm bandpass filter and the mKate2 signal behind a 650/40 nm bandpass filter. Image analysis was done in Matlab 2013b. In preparation for cell segmentation, the grayscale images of the donor channel were morphologically opened in 37 steps using a linear 50-pixel structuring element. This structuring element was rotated by 5° after each step in order to cover line-shaped structures in all major directions. The resulting image was thresholded to define an approximate cell mask. Another mask, showing bright cellular subregions but no dimmer fluorescent cell debris, was thresholded from raw donor images. This seed mask was used to morphologically reconstruct cells but not debris within the above-defined approximate cell mask. To extend the refined cell mask, a dilatation using a 3 × 3 pixels structuring element was applied. For each connected component, the FRET ratio was computed. This metric is defined as the ratio between an object’s sum of acceptor grayscale pixel intensities and the corresponding sum of donor grayscale pixel intensities. Figure 4A,B shows examples of analyzed cells in the donor channel. The background outside the cell mask was set to zero and cell borders were highlighted in red. Violin plots were used to show single-cell FRET ratio distributions in each experimental condition.
Quantification of Cell Death under 6-OHDA Perturbations
Cells were grown or differentiated in 12-well plates, at a starting density of 200,000 cells per well. At day 6, cells were treated for 3 h with 6-OHDA concentrations, as shown in the results. Next, cells were harvested via trypsinization, washed in PBS, and transferred to a 96-well plate. For the quantification of cell death, the cells were stained for 20 min at 37 °C with 5 µM SYTOX Green (Invitrogen, I35102). After staining, the cells were washed in PBS, centrifuged at 250 g for 5 min, and resuspended in 250 mL of PBS. SYTOX Green fluorescence was quantified on a Fortessa (BD Biosciences) cytometer, using a 488 nm laser for excitation and a combination of a 505 nm long pass filter and a 530/30 nm bandpass filter for emission.
Results
The presented neuronal differentiation method for SH-SY5Y cells was modified from Encinas and coworkers, as illustrated in Figure 1 .14,15 Compared to the Encinas method, the first phase of differentiation was shortened to 3 days, and for the second phase of differentiation, not DMEM but Neurobasal medium supplemented with N2 was used. During the first phase of differentiation, cell clumps dissociate to sparse cell islets with beginning neurite outgrowth. During phase 2 of differentiation, the cells distribute evenly on the growth substrate and interconnect via arborized neurites ( Fig. 1 ).
The cytometry-based analysis of single-cell Celltrace Violet fluorescence ( Fig. 1 ) shows that the presented differentiation protocol reduces cell growth compared to both undifferentiated cells (p < 0.001) and cells differentiated according to the Encinas protocol (p < 0.001). Analysis of forward scatter and side scatter in the same dataset shows a significant increase in size (p < 0.001) and complexity (p < 0.001) during differentiation. In undifferentiated cell populations, less than 2% of SH-SY5Y present neuritic connections to their neighbors, while more than 99% of differentiated cells show this phenotype, indicating a morphologically defined differentiation efficiency above 97%. The analysis of neuronal markers further confirms successful differentiation: both NF and β-III-tubulin are present in neurites of differentiated cells ( Fig. 1 ).
The expression of additional neuronal markers was analyzed via qPCR ( Fig. 2 ) in undifferentiated cells, and at the end of both phases 1 and 2 of differentiation. The progress of neuronal differentiation was analyzed via neuronal maturity markers: At the end of phase 1, SOX3 was significantly decreased but NES was significantly increased. At the end of phase 2, in contrast, EN1, SOX2, and PAX6 were significantly decreased and the expression of NES showed no significant differential expression compared to undifferentiated cells. In line with this neuronal maturation pattern, the expression of several synaptic markers was significantly increased in differentiated cells. The neuronal maturity marker RBFOX3, also known as NEUN, was expressed in both undifferentiated and differentiated cells, but not differentially expressed after differentiation. Furthermore, the analysis of catecholaminergic markers did not indicate a differentiation to dopaminergic neurons. Noteworthy, mRNA levels of TH and DAT were below the detection limit of a standard PCR in both undifferentiated and differentiated cells. However, the corresponding proteins are known to be expressed in SH-SY5Y. 16
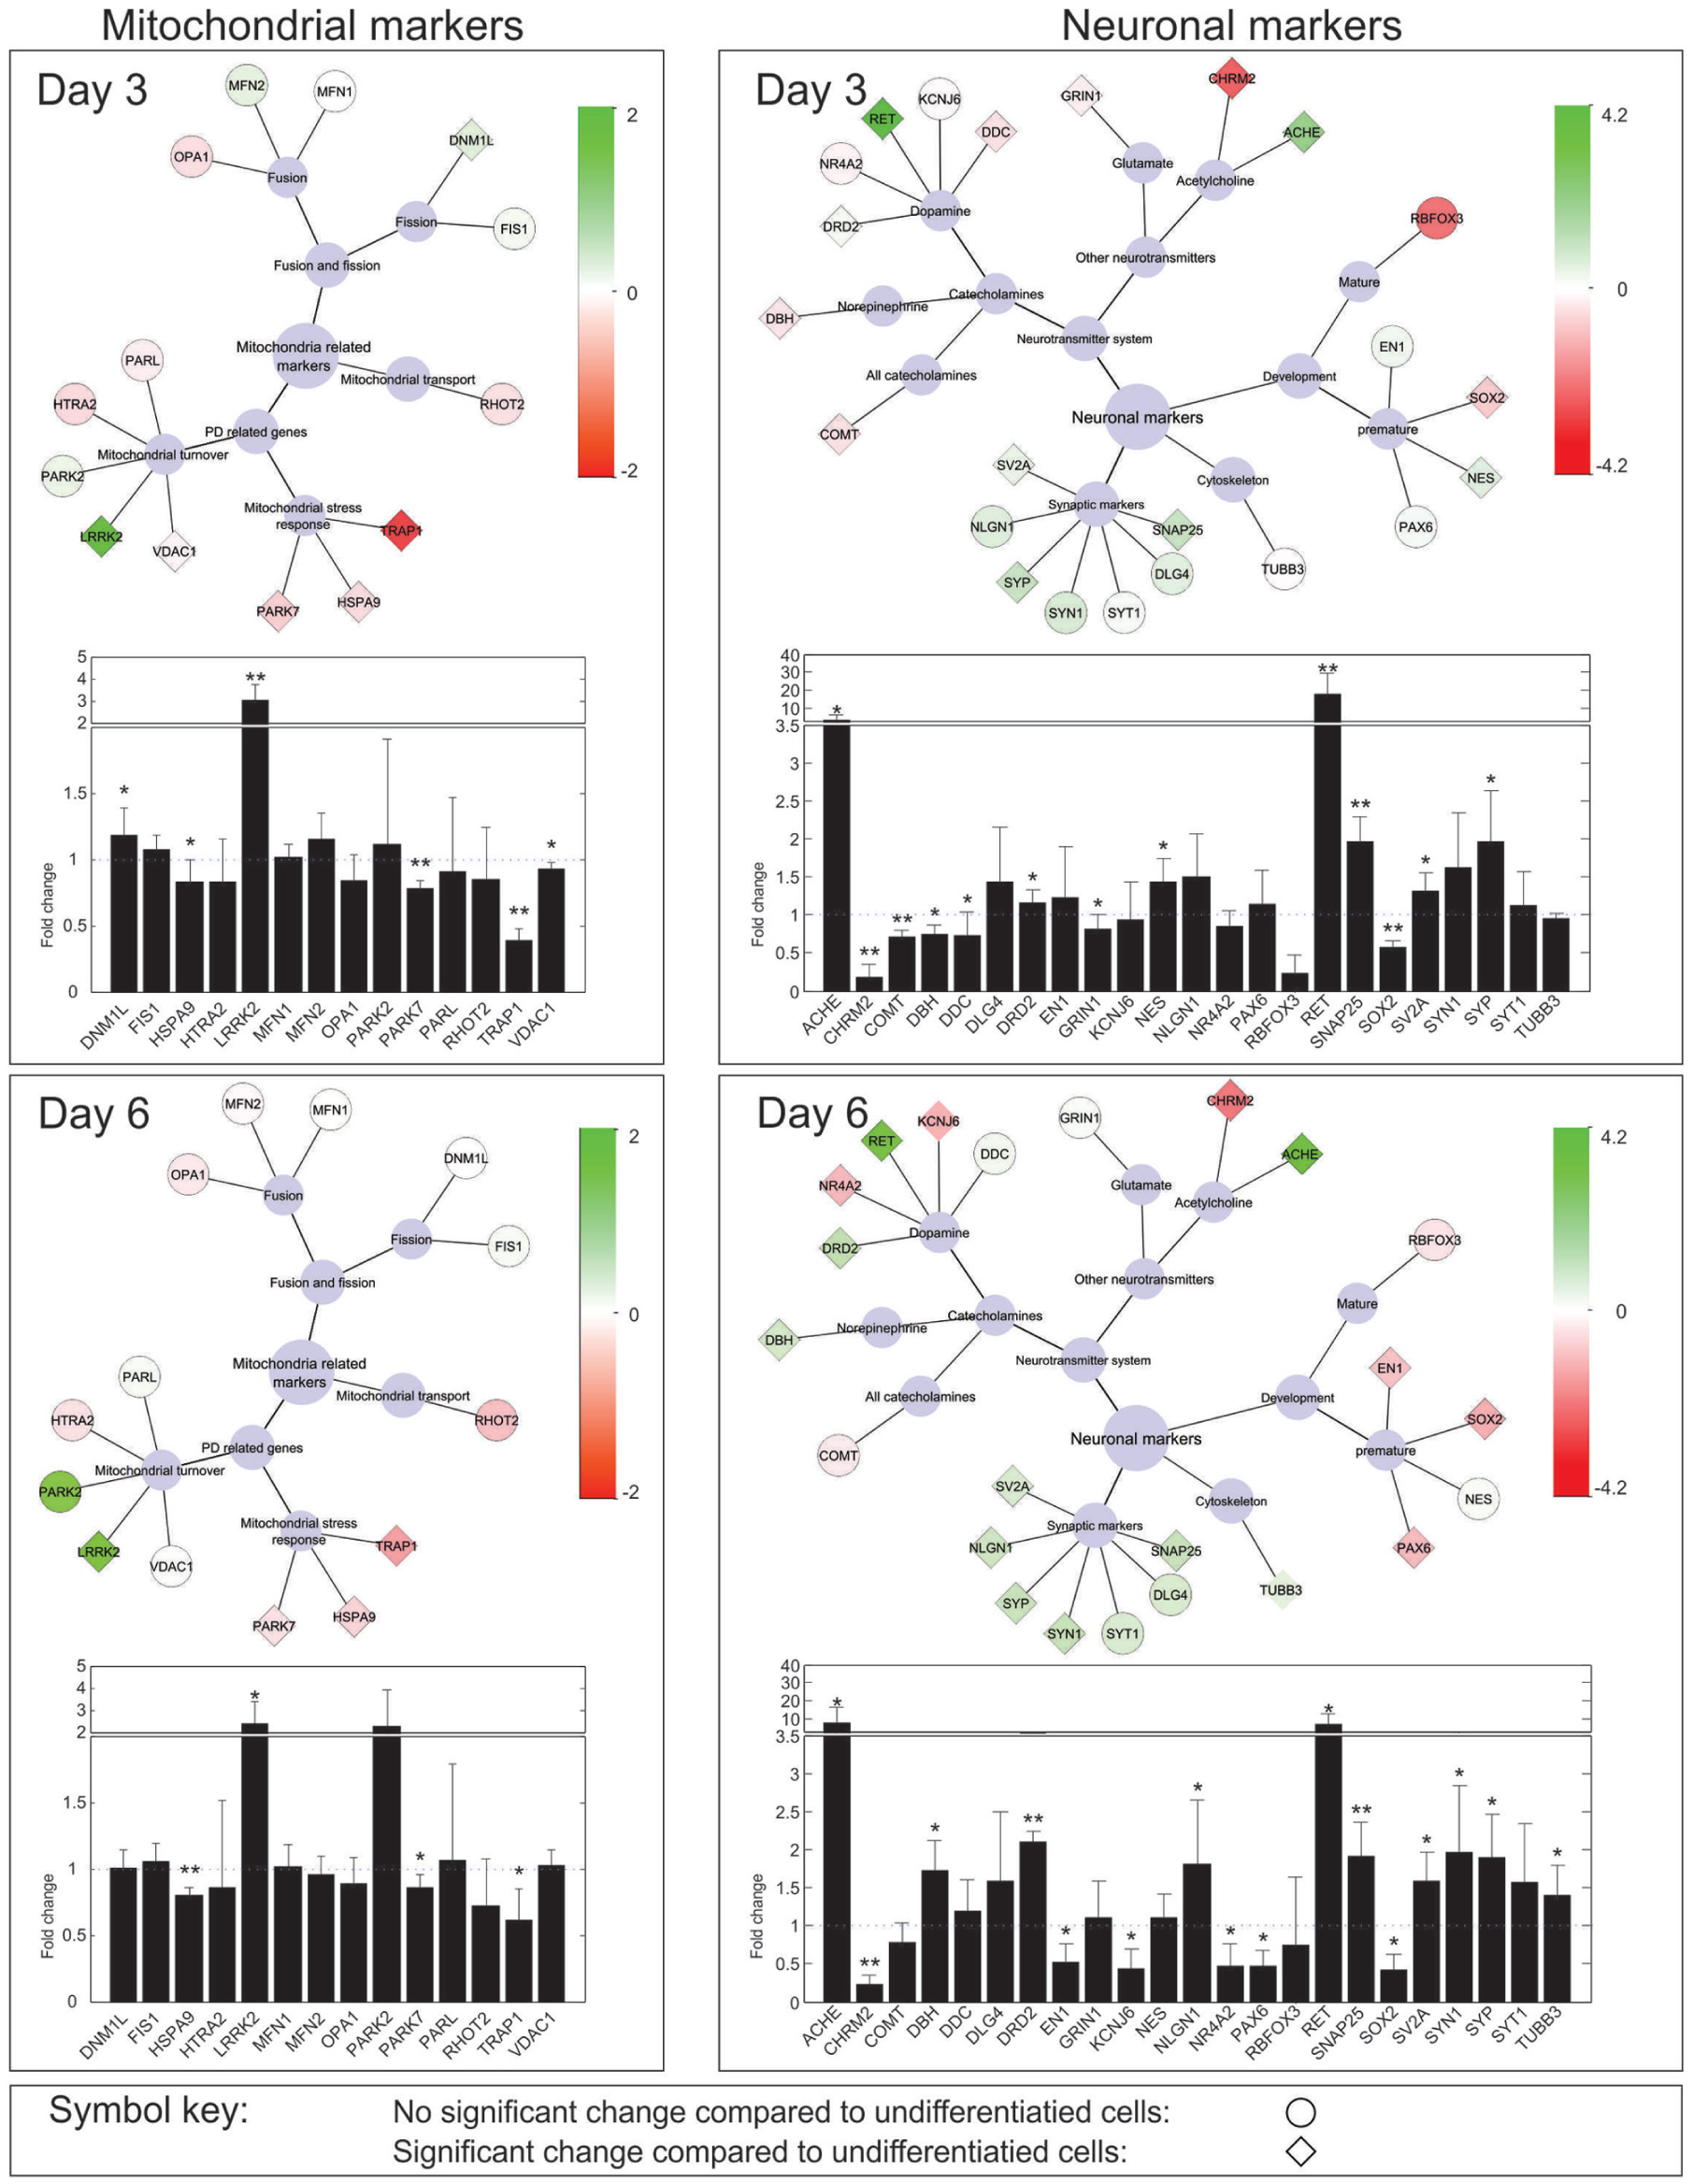
Gene expression of neuronal and mitochondrial markers throughout differentiation. Expression levels are shown as fold increase compared to undifferentiated cells. The light blue nodes in the center of each network represent a centered hierarchical structure visualizing key processes in which the connected genes are involved. For example, OPA1, MFN1, and MFN2 are mitochondria-related markers involved in mitochondrial fusion/fission processes, and more precisely in mitochondrial fusion. Diamond shapes indicate a significant change in gene expression (p < 0.05). The networks show the log2 transformed fold change of gene expression. Increased expression levels are shown in green and decreased expression levels in red. The color keys are specific to neuronal or mitochondrial genes respectively. Statistics were computed on log2 transformed fold changes using two-sample two-tailed Student t tests with α = 0.05. All experiments were performed in seven biological replicates, each including four technical replicates. The variation between biological replicates is shown in mean fold increase barplots. Error bars indicate the standard deviation between biological replicates. *, p < 0.05; **, p < 0.001. The dotted blue lines in the barplots indicate a fold change of 1 and serve as visual reference. Please note that all barplots are split in two parts with different axis scaling.
In the context of overall neuronal maturation, we asked the question if differentiated SH-SY5Y cells present similar vulnerability features toward mitochondrial dysfunction than those types of neurons that are typically affected in Parkinson’s disease. Interestingly, expression of DNML1, which is involved in mitochondrial fission, was significantly increased after phase 1, but this differential expression was lost after full differentiation. LRRK2, a genetic factor in Parkinson’s disease that is known to be involved in mitochondrial dynamics, 17 was significantly increased in differentiated cells. Furthermore, the expression of TRAP1, HSPA9, and PARK7, which are involved in mitochondrial stress response, was significantly decreased in differentiated cells. Because these results suggest an increased energetic vulnerability of differentiated SH-SY5Y cells, we also analyzed average ATP levels per cell. Nuclei staining, which was used for the normalization of ATP data, confirms significantly reduced cell numbers in differentiated SH-SY5Y. Average cellular ATP levels, in contrast, were significantly higher in differentiated cells than in undifferentiated cells ( Fig. 3 ).
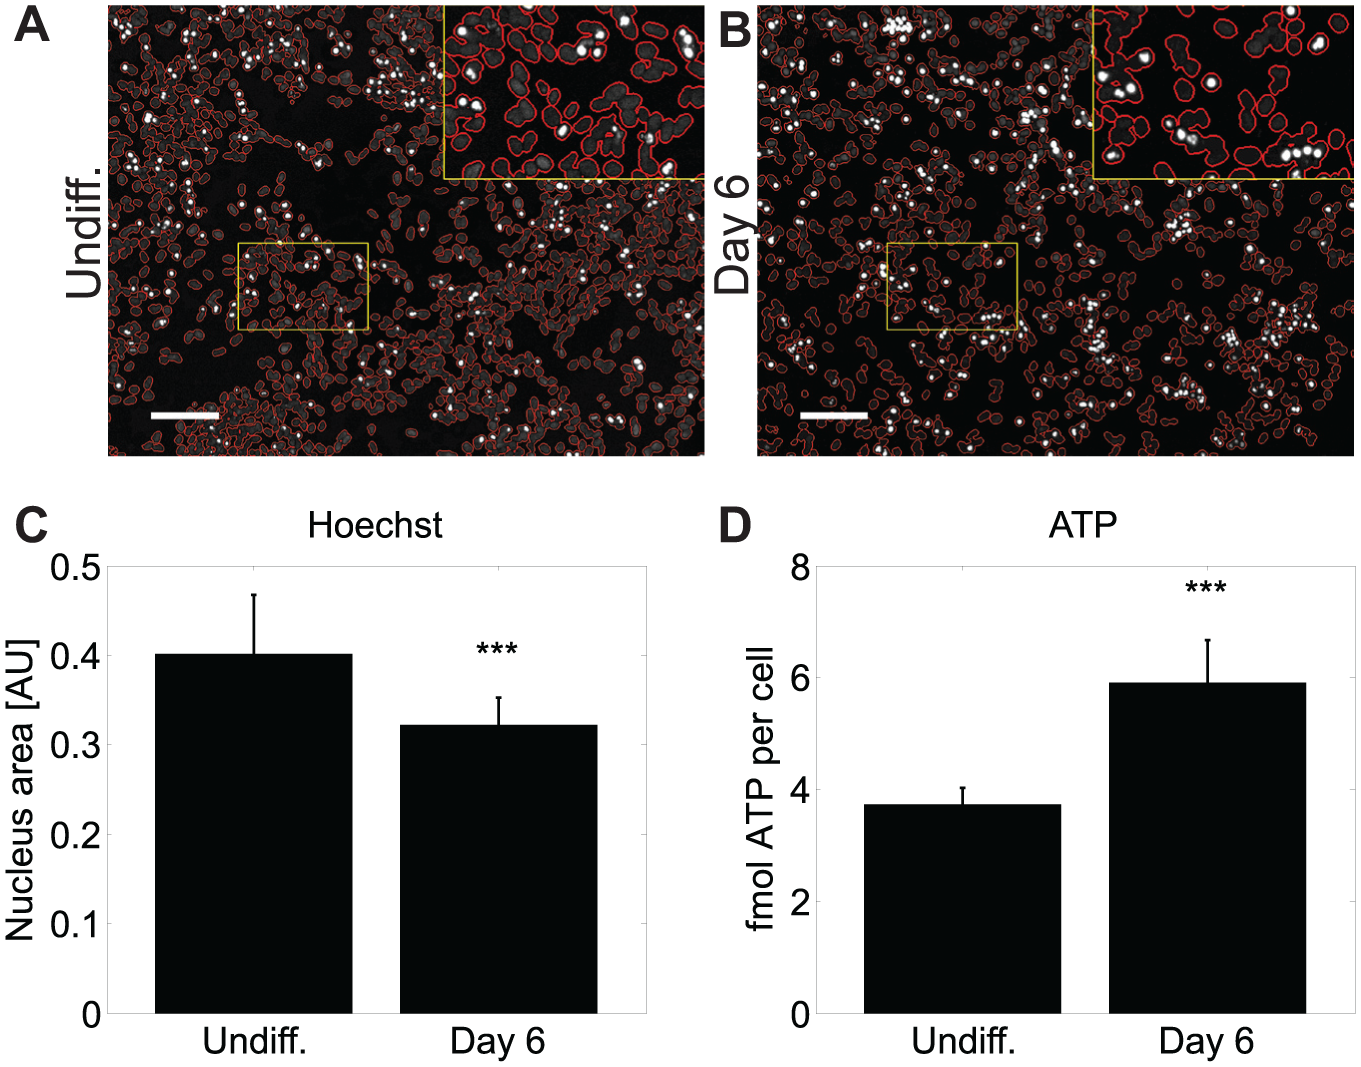
Increased ATP levels in differentiated SH-SY5Y. ATP levels quantified on cell populations were normalized against the corresponding area of nuclei. For this purpose, nuclei were stained with Hoechst and the area of the nuclei was measured via automated fluorescence microscopy and image analysis. (
Because neuronal activity is a major vulnerability factor associated with mitochondrial dysfunction and neurodegeneration in Parkinson’s disease, we probed the electrical activity of the plasma membrane. The FRET ratio of VSFPs showed significantly higher electrical plasma membrane activity in differentiated cells than in undifferentiated cells, and this result was confirmed with two independent FRET pairs ( Fig. 4 ).
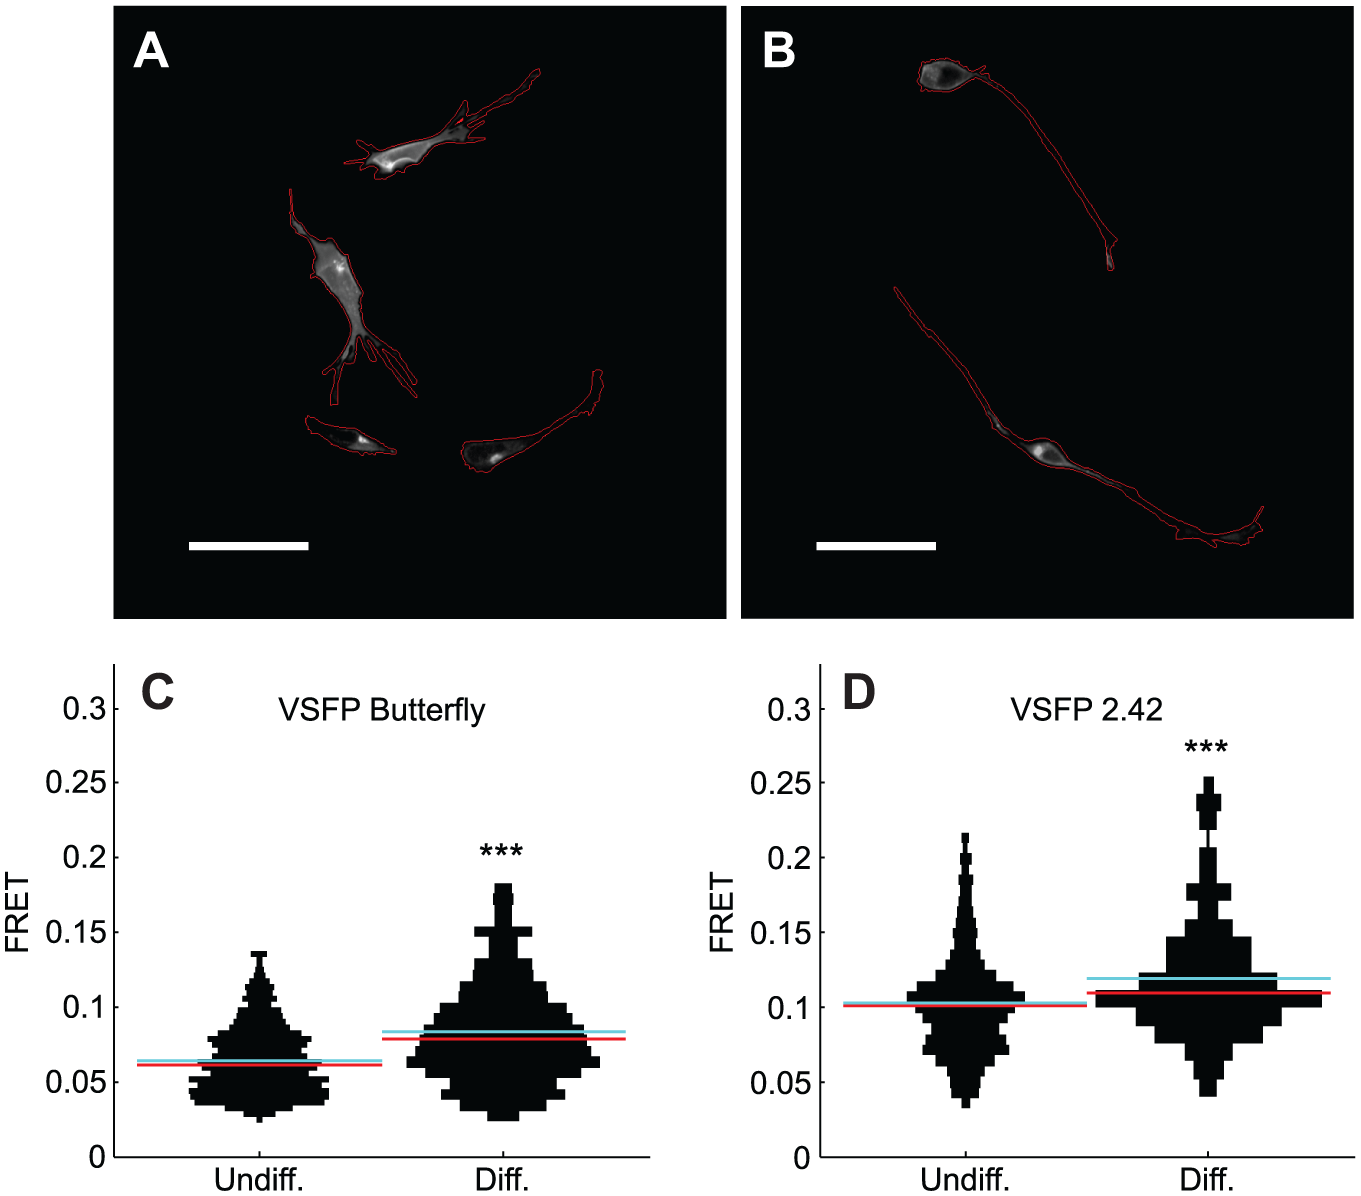
Increase of electrical plasma membrane activity in differentiated SH-SY5Y. Images show selected regions of interest on black background and were processed as explained in the methods. Borders of undifferentiated (
To investigate if reduced expression of oxidative stress response genes, increased ATP levels, and increased plasma membrane activity are related to microscopically observable phenotypes, we quantified neurite growth and mitochondrial features ( Fig. 5 ). The area of neurites was significantly increased in differentiated cells (p < 0.001). Mitochondrial area compared to the total cell area, in contrast, was significantly decreased in differentiated cells (p < 0.001). However, compared to the area of nuclei, which can be considered a surrogate for the number of cells per field, the number of mitochondria was significantly increased in differentiated cells (p < 0.001). Furthermore, the analysis of intracellular mitochondrial distribution shows significant mitochondrial spreading in differentiated cells (p < 0.001).
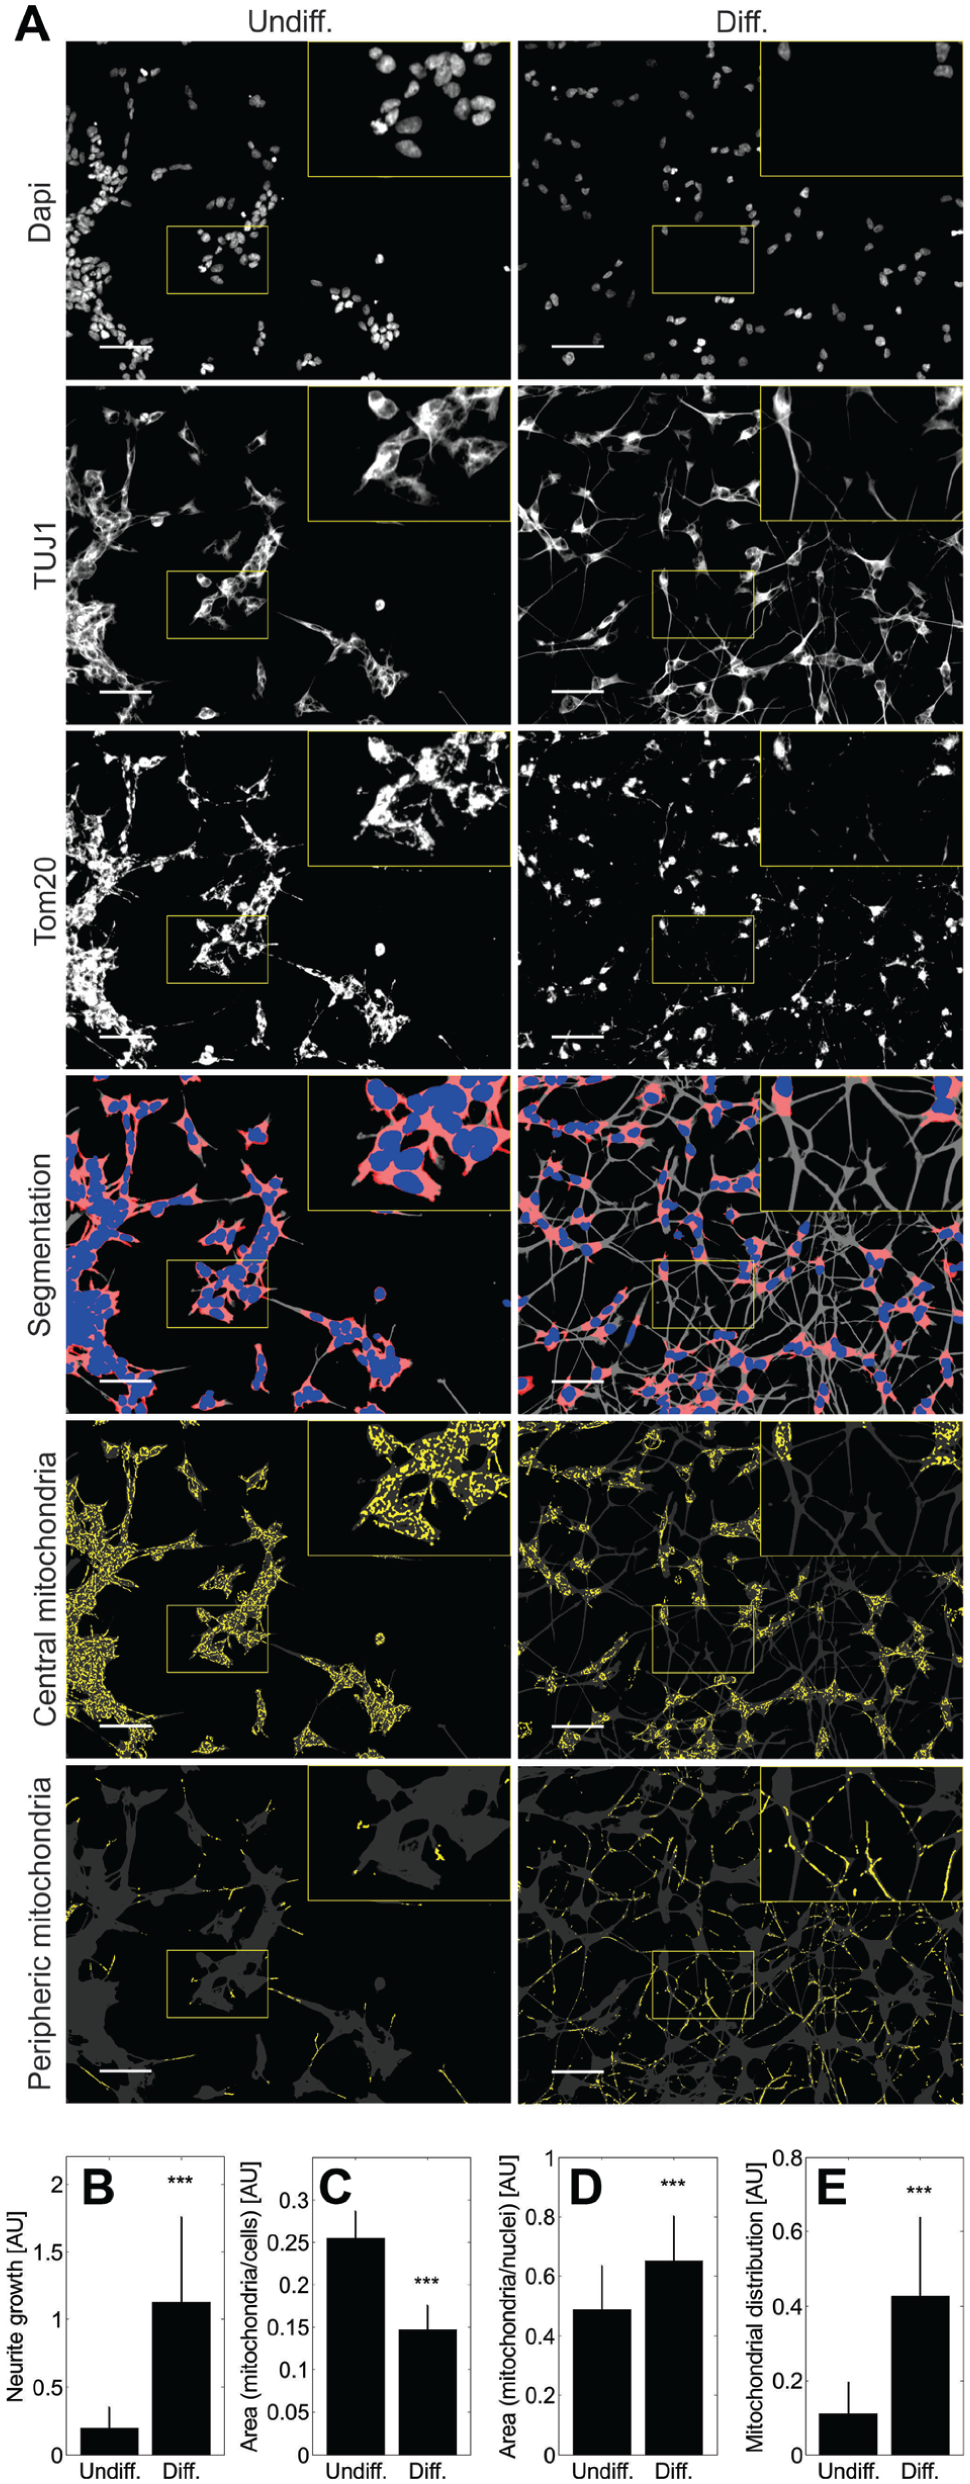
Mitochondrial redistribution during differentiation. (
The analysis of mitochondrial membrane potential using the TMRM method ( Fig. 6 ) has shown more than a twofold lower mitochondrial membrane potential in differentiated cells than in undifferentiated cells (p < 0.001). This difference in average TMRM intensity, in the absence of 6-OHDA perturbations, was confirmed in both mitochondrial and cellular areas. To compare the vulnerability of undifferentiated and differentiated SH-SY5Y cells toward oxidative perturbations, the cells were exposed to 6-OHDA for 24 h. While both undifferentiated and differentiated cells present significant loss of mitochondrial membrane potential after 6-OHDA perturbations, differentiated cells present a stronger response to 200 µM 6-OHDA than undifferentiated cells. Because undifferentiated SH-SY5Y present normal morphology after 24 h of 200 µM 6-OHDA treatment while differentiated cells shrink and detach under these conditions ( Fig. 6D ), we further quantified cell death under 6-OHDA treatments. After 3 h of 6-OHDA treatment, there was no change in cell death in undifferentiated cells compared to vehicle controls ( Fig. 6E ). For differentiated SH-SY5Y, in contrast, concentrations of 100 and 200 µM 6-OHDA caused a significant increase in cell death ( Fig. 6F ).
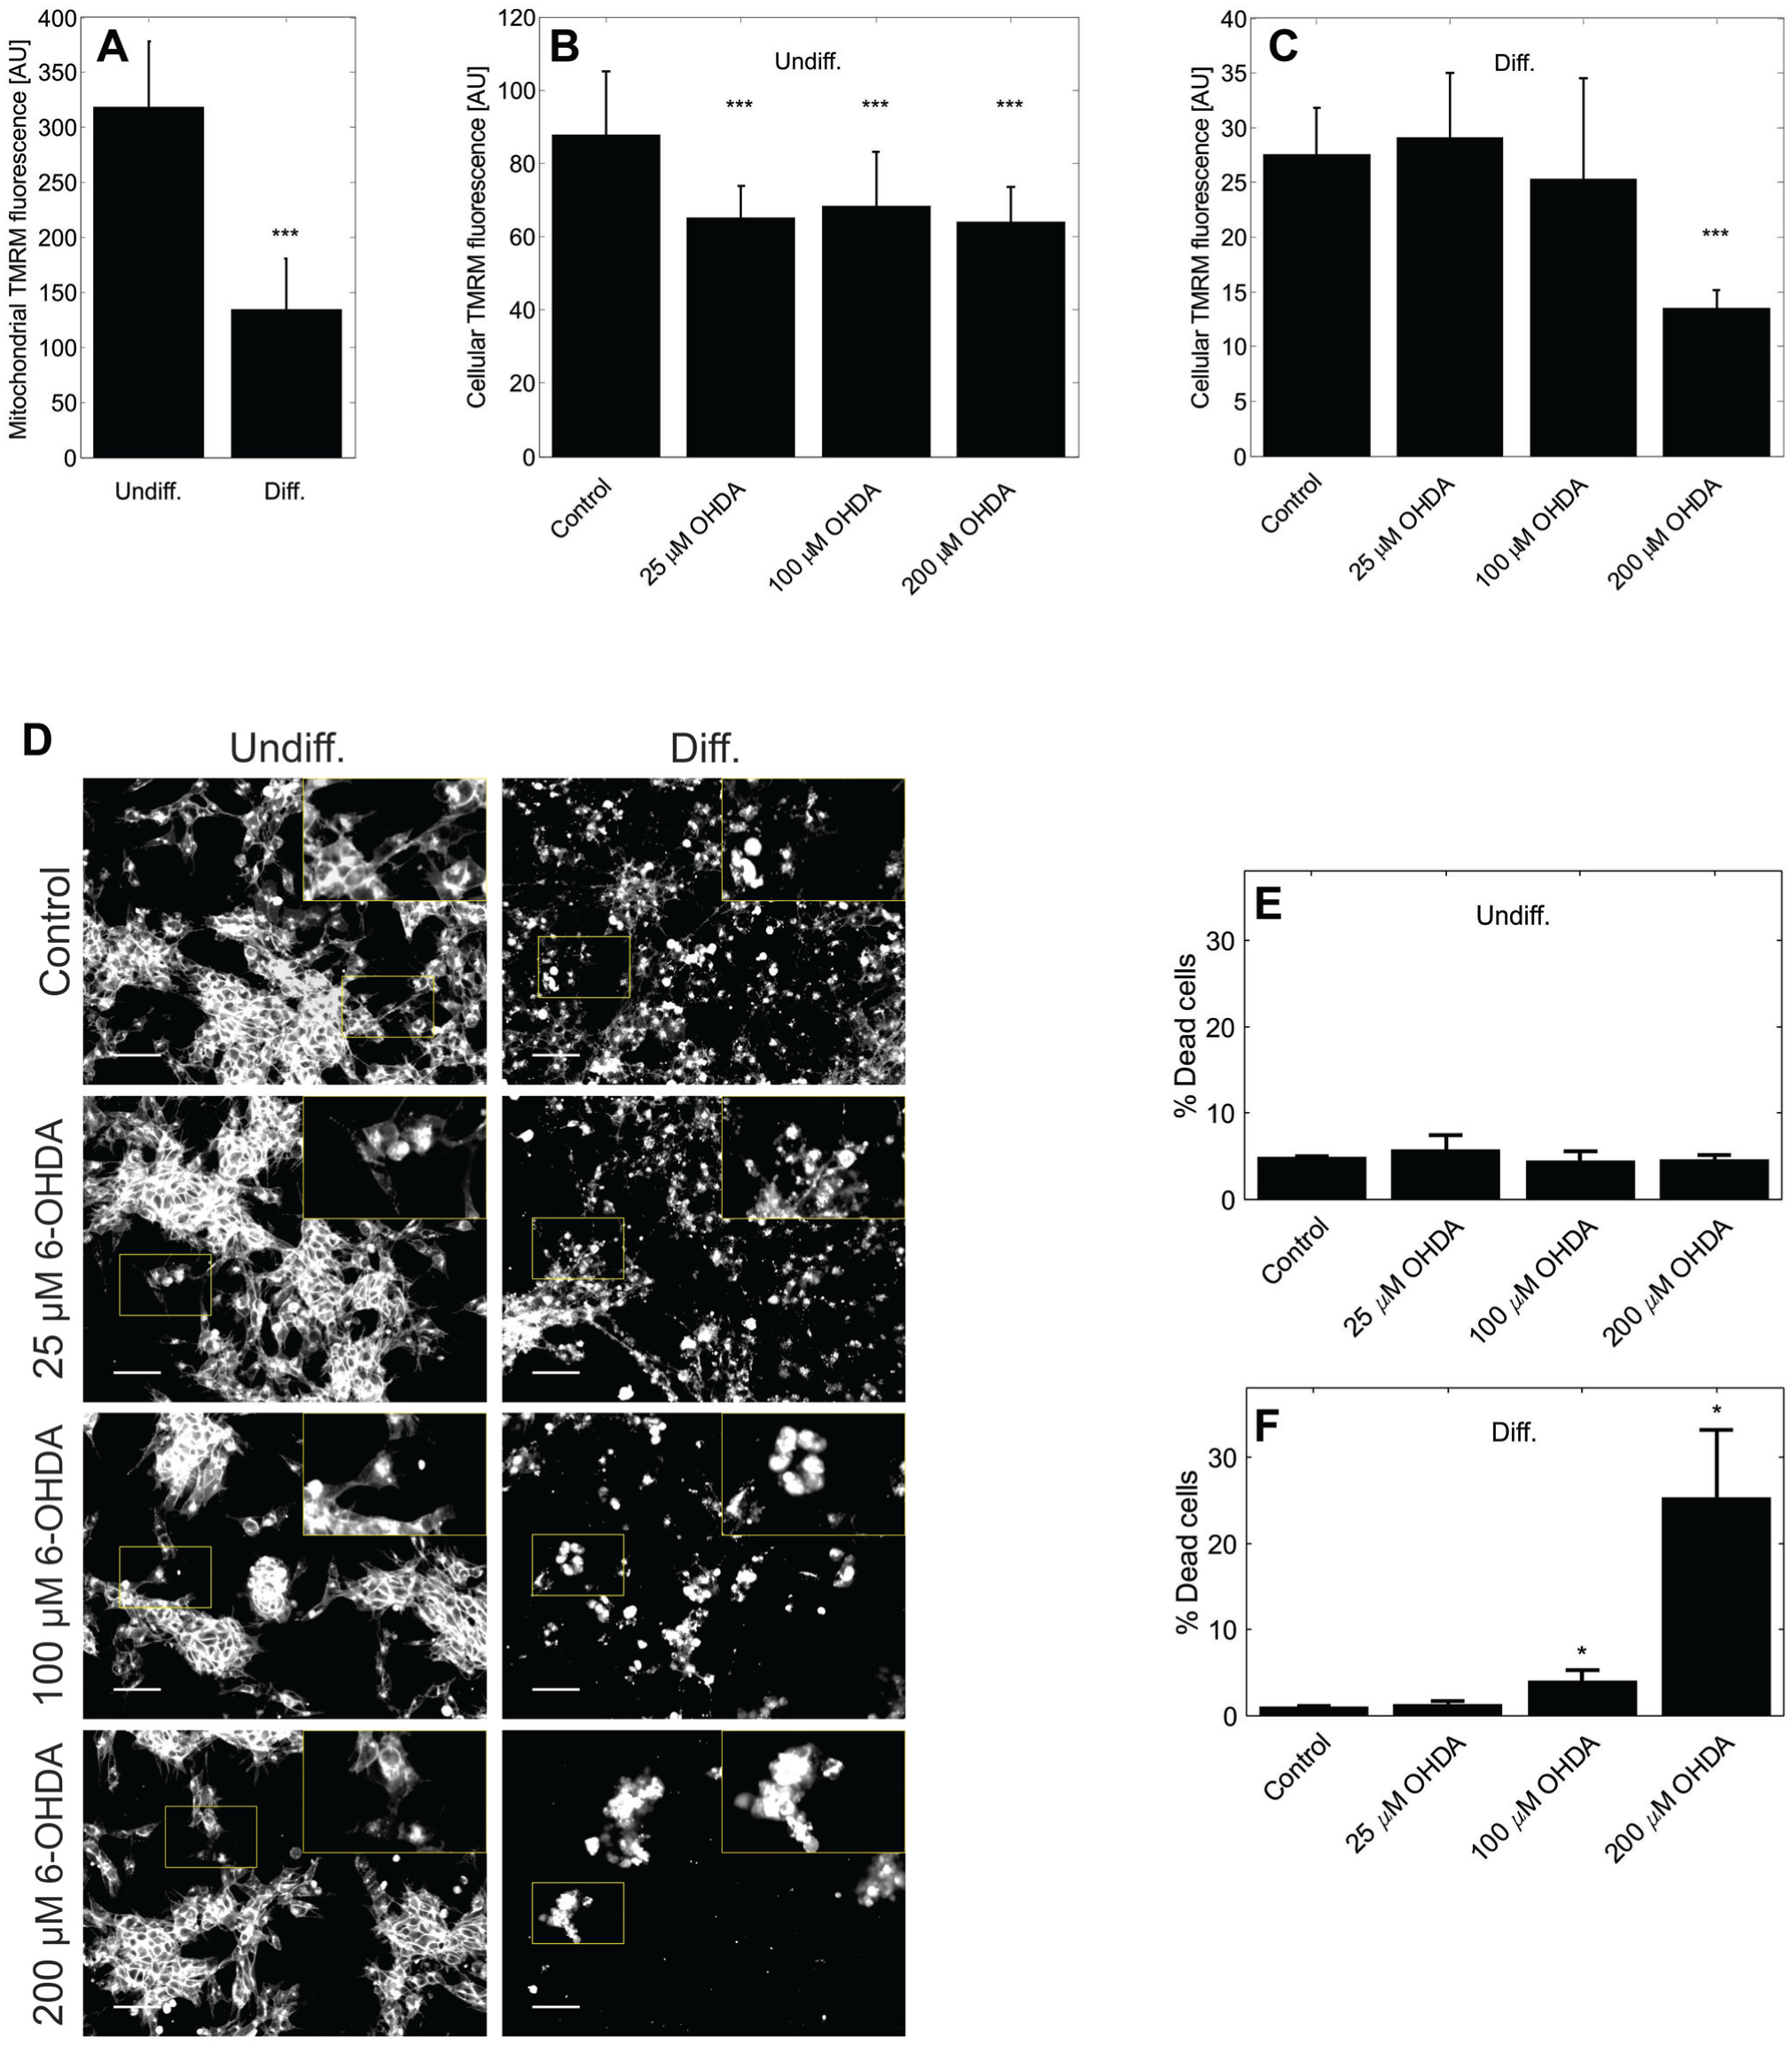
Decreased robustness of differentiated cells toward 6-OHDA. (
Discussion
Background
Neuroscientists often face the challenge that tissues of interest are not accessible for perturbation experiments. Available experimental models range from purely molecular systems to cell culture, brain slice culture, and animal models. Cells are the simplest models that allow us to study relations between molecular events and cellular physiology. Primary cells, induced pluripotent stem cells, and their differentiated daughter cells are a good choice for projects that aim to study complex individual traits. However, available sample sizes are typically limited and investments required for sustainable isogenic screening are high. For screening projects, however, the availability of large amounts of phenotypically homogenous cells with identical genetic background is a prerequisite. SH-SY5Y cells meet these criteria, and the characterization of this cell line further leverages educated experimental design and data interpretation. A further advantage of SH-SY5Y cells is the possibility for neuronal differentiation. Considering differentiation under RA treatment, a reported caveat is that substrate adherent S-type cells do not differentiate but continue dividing and tend to overgrow neuroblastic N-type cells. 15 This lack of N-type selective pressure in RA-only differentiation can at least in part be explained with transdifferentiation and selection of dividing S-type cells, resulting in heterogeneous cultures that are a suboptimal choice if homogenous neuronal cultures are required. A subsequent treatment with BDNF has two major effects: cell survival and progressive withdrawal from the cell cycle. 15 Mechanistically, RA induces the expression of functional tropomyosin receptor kinase (Trk) receptors. 14 The strong neuritic growth that we observed under BDNF treatment validates the functional effect of BDNF on neurite growth. 14 However, exclusively N-type cells, but not S-type cells, undergo differentiation to a more neuronal phenotype under RA/BDNF differentiation. 15
Advantages of the Presented Differentiation Method
The optimized RA/BDNF differentiation protocol that we present here has two major advantages: an increased selective pressure against S-type cells and a reduced duration of differentiation. The selective pressure was increased by using pyruvate-free medium with only 5% FBS during phase 1, by limiting the duration of RA treatment to 3 days, and by using Neurobasal medium supplemented with N2 during phase 2 of differentiation. Indeed, the report of evident expression of active phosphorylated Trk receptors after only 3 days of RA treatment14,18 motivated us to reduce the duration of RA treatment. The reduced cell growth during differentiation confirmed by both Celltrace Violet and nuclei area indicates successful suppression of dividing S-type cells.
The scalability of SH-SY5Y growth before differentiation in combination with the high differentiation efficiency further provides advantages for high-content screening compared to other neuronal models, such as human primary neurons, IPS-derived neurons, and LUHMES. Human primary embryonic neurons raise ethical concerns and once terminally differentiated are postmitotic. Thereby the number of available cells becomes a limiting factor for explorative screens. Considering that we decided to grow SH-SY5Y cells up to passage ATCC+15 before starting differentiation, and used splitting ratios of 1/4 during passaging, SH-SY5Y cultures can be scaled up to 4 15 times the number of live cells in an original ATCC freezing stock. In contrast to SH-SY5Y, IPS-derived neurons provide low differentiation efficiencies and therefore require neuronal counterstaining and filtering during image analysis. The main disadvantage in this scenario is that counterstaining requires a fluorescence channel and thereby limits the possibilities for other cell physiological readouts in high-content screening. An advantage compared to other fast differentiation models such as LUHMES cells 19 is the compatibility with uncoated plates, leveraging applications such as automated cell culture and high-content screening.
Evaluation of Neuronal Differentiation
The analysis of neuronal markers shows two major characteristics of SH-SY5Y maturation: a reduced expression of premature markers and an increased expression of synaptic markers. The high expression of the premature neuronal marker NES and the less pronounced expression of synaptic markers after phase 1 compared to fully differentiated cells validate that BDNF enhances the effect of RA during neuronal differentiation.
Currently, there is no consensus on the neurotransmitter profile of SH-SY5Y, and indeed, different differentiation protocols might have different impacts on the neurotransmitter profile of SH-SY5Y. 20 The data of the present study indicate that RA-BDNF differentiated SH-SY5Y do not present a fully mature neurotransmitter signature. This intermediate conclusion could easily be misinterpreted as a major caveat for the application of this cell line in neuroscience. However, disease-specific neurodegeneration is typically not restricted to a single type of neurons.
Cellular Energy States and Expected Effects on Cellular Vulnerability
A major property that has been proposed to underlie neuron-type selective degeneration in Parkinson’s disease is high vulnerability to energetic stress. 8 Further, there is a large body of evidence for both mitochondrial dysfunction 21 and impaired neuronal firing activity 22 in multiple neurodegenerative diseases, including Parkinson’s disease, amyotrophic lateral sclerosis, Huntington’s disease, and Alzheimer’s disease.
Our previous study analyzing the genome of SH-SY5Y leverages the suitability analysis of these cells for perturbation experiments targeting disease-specific networks. 1 However, this study was done with undifferentiated cells. To leverage future screening studies investigating mitochondrial dysfunction in neurodegenerative diseases, we aimed not only to optimize existing neuronal differentiation methods for high-content screening but also to mainly characterize the differentiated cells in the context of energetic vulnerability. Our hypothesis was that neuronal maturation might increase the energetic stress level in SH-SY5Y, and that this stress might increase the sensitivity toward mitochondrial perturbations. Analyzed key parameters related to neuronal energy homeostasis were the expression of mitochondrial genes, ATP levels, and the electrical activity of the plasma membrane. The downregulation of mitochondrial stress response genes contrasting an increase in both ATP levels and electrical plasma membrane activity indicates that differentiation leads to a cell state with increased energetic needs and reduced ability to balance energetic stress situations via the classical mitochondrial stress response machinery. It has been reported that mitochondrial membrane potential and reserve capacity are increased in RA differentiated SH-SY5Y cells. 23 Similarly, for RA/BDNF differentiated SH-SY5Y cells, increased spare respiratory capacity and oxygen consumption rates were reported. This indicates intensified oxidative phosphorylation in differentiated SH-SY5Y. 6 In the context of elevated ATP levels and plasma membrane activity, this indicates an increased ATP production rather than a decreased ATP consumption rate in RA/BDNF differentiated SH-SY5Y. In addition, differentiated SH-SY5Y form networks with their extended neurites. Maintaining and expanding such networks has been reported to require increased ATP levels and increased control of mitochondrial transport. 24 Both the high ATP levels and the mitochondrial redistribution that we report in RA/BDNF differentiated SH-SY5Y cells are in line with these neuronal vulnerability features and show that differentiated SH-SY5Y cells might be better suited for studies related to neuronal vulnerability than undifferentiated SH-SY5Y cells.
Increased LRRK2 expression is also in line with increased vulnerability for energetic stress. It has been proposed that LRRK2 might act as a negative regulator of autophagy, 25 and hence the ability to remove defective mitochondria via autophagy might be reduced in differentiated SH-SY5Y.
Based on the finding that the expression of oxidative stress response genes is reduced after differentiation, we asked whether this phenomenon was also reported in brain-derived neurons. Indeed, the very high-energy consumption of healthy brain tissue suggests high expression levels of oxidative stress response genes. However, human tissue–specific expression profiles from BioGPS show that whole brain expression levels of the stress response genes Park7, HSPA9, and TRAP1 are close to their respective average expression levels over all tissues. In the disease context, in contrast, the expression of oxidative stress response genes in the brain might be increased. 26 SH-SY5Y cells are originally derived from bone marrow, the most frequent location of metastases in neuroblastoma. 27 Knowing that cancer cells escape from oxidative stress during metastasis, high expression levels of oxidative stress response genes can be expected in undifferentiated cells.
Vulnerability toward 6-OHDA
Reports concerning the vulnerability of RA differentiated cells toward oxidative stress are contradictory: One study reported no change in dopaminergic marker expression during differentiation but reduced sensitivity toward 6-OHDA perturbations. 28 Another study, in contrast, reported increased vulnerability toward 6-OHDA. 29 It has been proposed that these contradictions could be due to different amounts and types of FBS in differentiation media. 30 An advantage of the RA/BDNF differentiation presented here is that FBS is not required for the second phase of differentiation.
It is striking that 6-OHDA perturbations on undifferentiated cells cause moderate but significant loss of mitochondrial membrane potential but no significant change in cell death. Differentiated cells, in contrast, die at high 6-OHDA concentrations. Indeed, the comparatively lower mitochondrial membrane potential in differentiated cells, revealed by our high-throughput TMRM assay, might exacerbate compensatory cell responses and increase their oxidative vulnerability compared to undifferentiated SH-SY5Y.
Indeed, selective vulnerability of neurons is believed to be an underlying factor of multiple neurodegenerative diseases, and therefore screening of metabolic modifiers is a promising approach for the discovery of disease-modifying compounds. 31 Furthermore, the genetics underlying selective neuronal vulnerability are not yet fully understood. However, it is widely accepted that many cell fate decisions related to neurodegeneration spare somatic cells but not energetically vulnerable neurons. We are convinced that genetic screens in energetically vulnerable SH-SY5Y will leverage the understanding of such selective neurodegeneration.
Our study consists of an optimization of the RA/BDNF differentiation protocol and the characterization of underlying mitochondrial changes and their impact on oxidative vulnerability. The accelerated and highly efficient differentiation protocol provides considerable advantages for studies, such as chemical or genetic screens that require large homogeneous cell populations.
Because differentiated SH-SY5Y cells present reduced expression of oxidative stress response genes, increased electrical plasma membrane activity, increased levels of ATP, decreased mitochondrial membrane potential, and decreased robustness toward 6-OHDA perturbations, we conclude that differentiation triggers the transition from an oxidative stress–resistant cell state to a neuronal cell state with increased energetic stress and oxidative vulnerability. In consequence, differentiated SH-SY5Y cells are better suited for studies related to neuronal energetic vulnerability than undifferentiated SH-SY5Y cells.
The differentiation protocol in combination with the presented image analysis methods for the analysis of mitochondrial features provides a robust starting point for medium- and large-scale high-content screening projects.
Footnotes
Acknowledgements
We thank Dr. Thomas Knopfel from the Riken Institute, who kindly provided voltage-sensing protein constructs. Furthermore, we thank Bob Pepin for many valuable inputs in the development of Matlab-based image analysis scripts. Finally, we thank Dr. Eric Koncina and Dr. Djalil Coowar for being welcomed to their lab and for scientific discussions during the early days of this project and our research institute.
Declaration of Conflicting Interests
The authors declared no potential conflicts of interest with respect to the research, authorship, and/or publication of this article.
Funding
The authors disclosed receipt of the following financial support for the research, authorship, and/or publication of this article: J. I. Forster was funded by the Fonds National de la Recherche Luxembourg (AFR-PhD 6910367).
References
Supplementary Material
Please find the following supplemental material available below.
For Open Access articles published under a Creative Commons License, all supplemental material carries the same license as the article it is associated with.
For non-Open Access articles published, all supplemental material carries a non-exclusive license, and permission requests for re-use of supplemental material or any part of supplemental material shall be sent directly to the copyright owner as specified in the copyright notice associated with the article.