
Abstract
Electrospray ionization Fourier transform ion cyclotron resonance mass spectrometry (ESI-FTICR-MS or ESI-FTMS) was used to screen 192 natural product extracts and a 659-member natural product-based fragment library for bindings to a potential malaria drug target, Plasmodium falciparum Rab11a (PfRab11a, PF13_0119). One natural product extract and 11 fragments showed binding activity. A new natural product, arborside E, was identified from the active extract of Psydrax montigena as a weak binder. Its binding activity and inhibitory activity against PfRab11a were confirmed by ESI-FTMS titration experiments and an orthogonal enzyme assay.
Introduction
Malaria is one of the most harmful infectious diseases in the world. According to the World Health Organization, there were approximately 200 million malaria cases in 2014, resulting in about 600,000 deaths. Around 3 billion people continue to be in danger of contracting malaria, mostly in Africa and Southeast Asia. 1
Natural products have been an important source for the development of new drugs to treat malaria. 2 The use of medicinal plants against parasitic illnesses has been recorded over thousands of years. By way of example, the bark of the Cinchona tree was the first effective treatment for malaria used by the Romans in the 17th century, 3 followed by the later identification of the active constituent. 4 Artemisinin, also known as “qinghaosu,” which is active against all Plasmodium species, was isolated from the Chinese medicinal herb Artemisia annua L. (sweet wormwood) that had been used to treat malaria for over 2000 years. 5
Rab GTPases are key regulators of vesicular traffic in eukaryotic cells. In 2003, Langsley and his colleagues reported that Plasmodium falciparum Rab11a (PfRab11a, PF13_0119) might mediate an essential recycling endosome function in P. falciparum. 6 Later, they demonstrated that the final step in parasite cell division involves delivery of new plasma membrane to the daughter cells, a process requiring functional Rab11a. Importantly, Rab11a can be found in myosin-tail-interacting protein (MTIP), also known as myosin light chain 1 (MLC1). 7 MLC1 is a member of a four-protein motor complex called the glideosome that is known to be crucial for parasite invasion of host cells. Ablation of Rab11a function results in a block at a late stage of cell division. 7 PfRab11a therefore is a potential target for antimalarial drug discovery.
Bioaffinity mass spectrometry has been used as an effective screening method to identify small molecules that bind to proteins. 8 The fundamental concept of affinity screening methodologies is to detect a noncovalent complex containing protein and small ligand. 8 We have shown that a target protein added to a natural product extract can form a noncovalent complex, and we have established a method that employs electrospray ionization Fourier transform ion cyclotron resonance mass spectrometry (ESI-FTMS) to screen extracts. 8 We then adapted the method to fragment-based screening and identified seven securinine derivatives, which bound to P. falciparum deoxyuridine 5′-triphosphate nucleotidohydrolase (PfdUTPase, PF11_0282). 9 A subsequent in vitro whole-cell assay against P. falciparum showed that the securinine derivatives also had inhibitory activity against the parasite. 9
In this study, ESI-FTMS was used to screen 192 natural product extracts and an in-house natural product-based fragment library of 659 members for active constituents that bind to PfRab11a. One extract from the plant Psydrax montigena and 11 fragments (details in Table 1 ) were identified by ESI-FTMS to bind to PfRab11a. Mass guided fractionation and purification of the extract resulted in the identification of a new natural product, arborside E. We here report the isolation of arborside E, its binding affinity and inhibitory activity against PfRab11a, and the structures of the fragment hits.
Fragment Hits of PfRab11a.
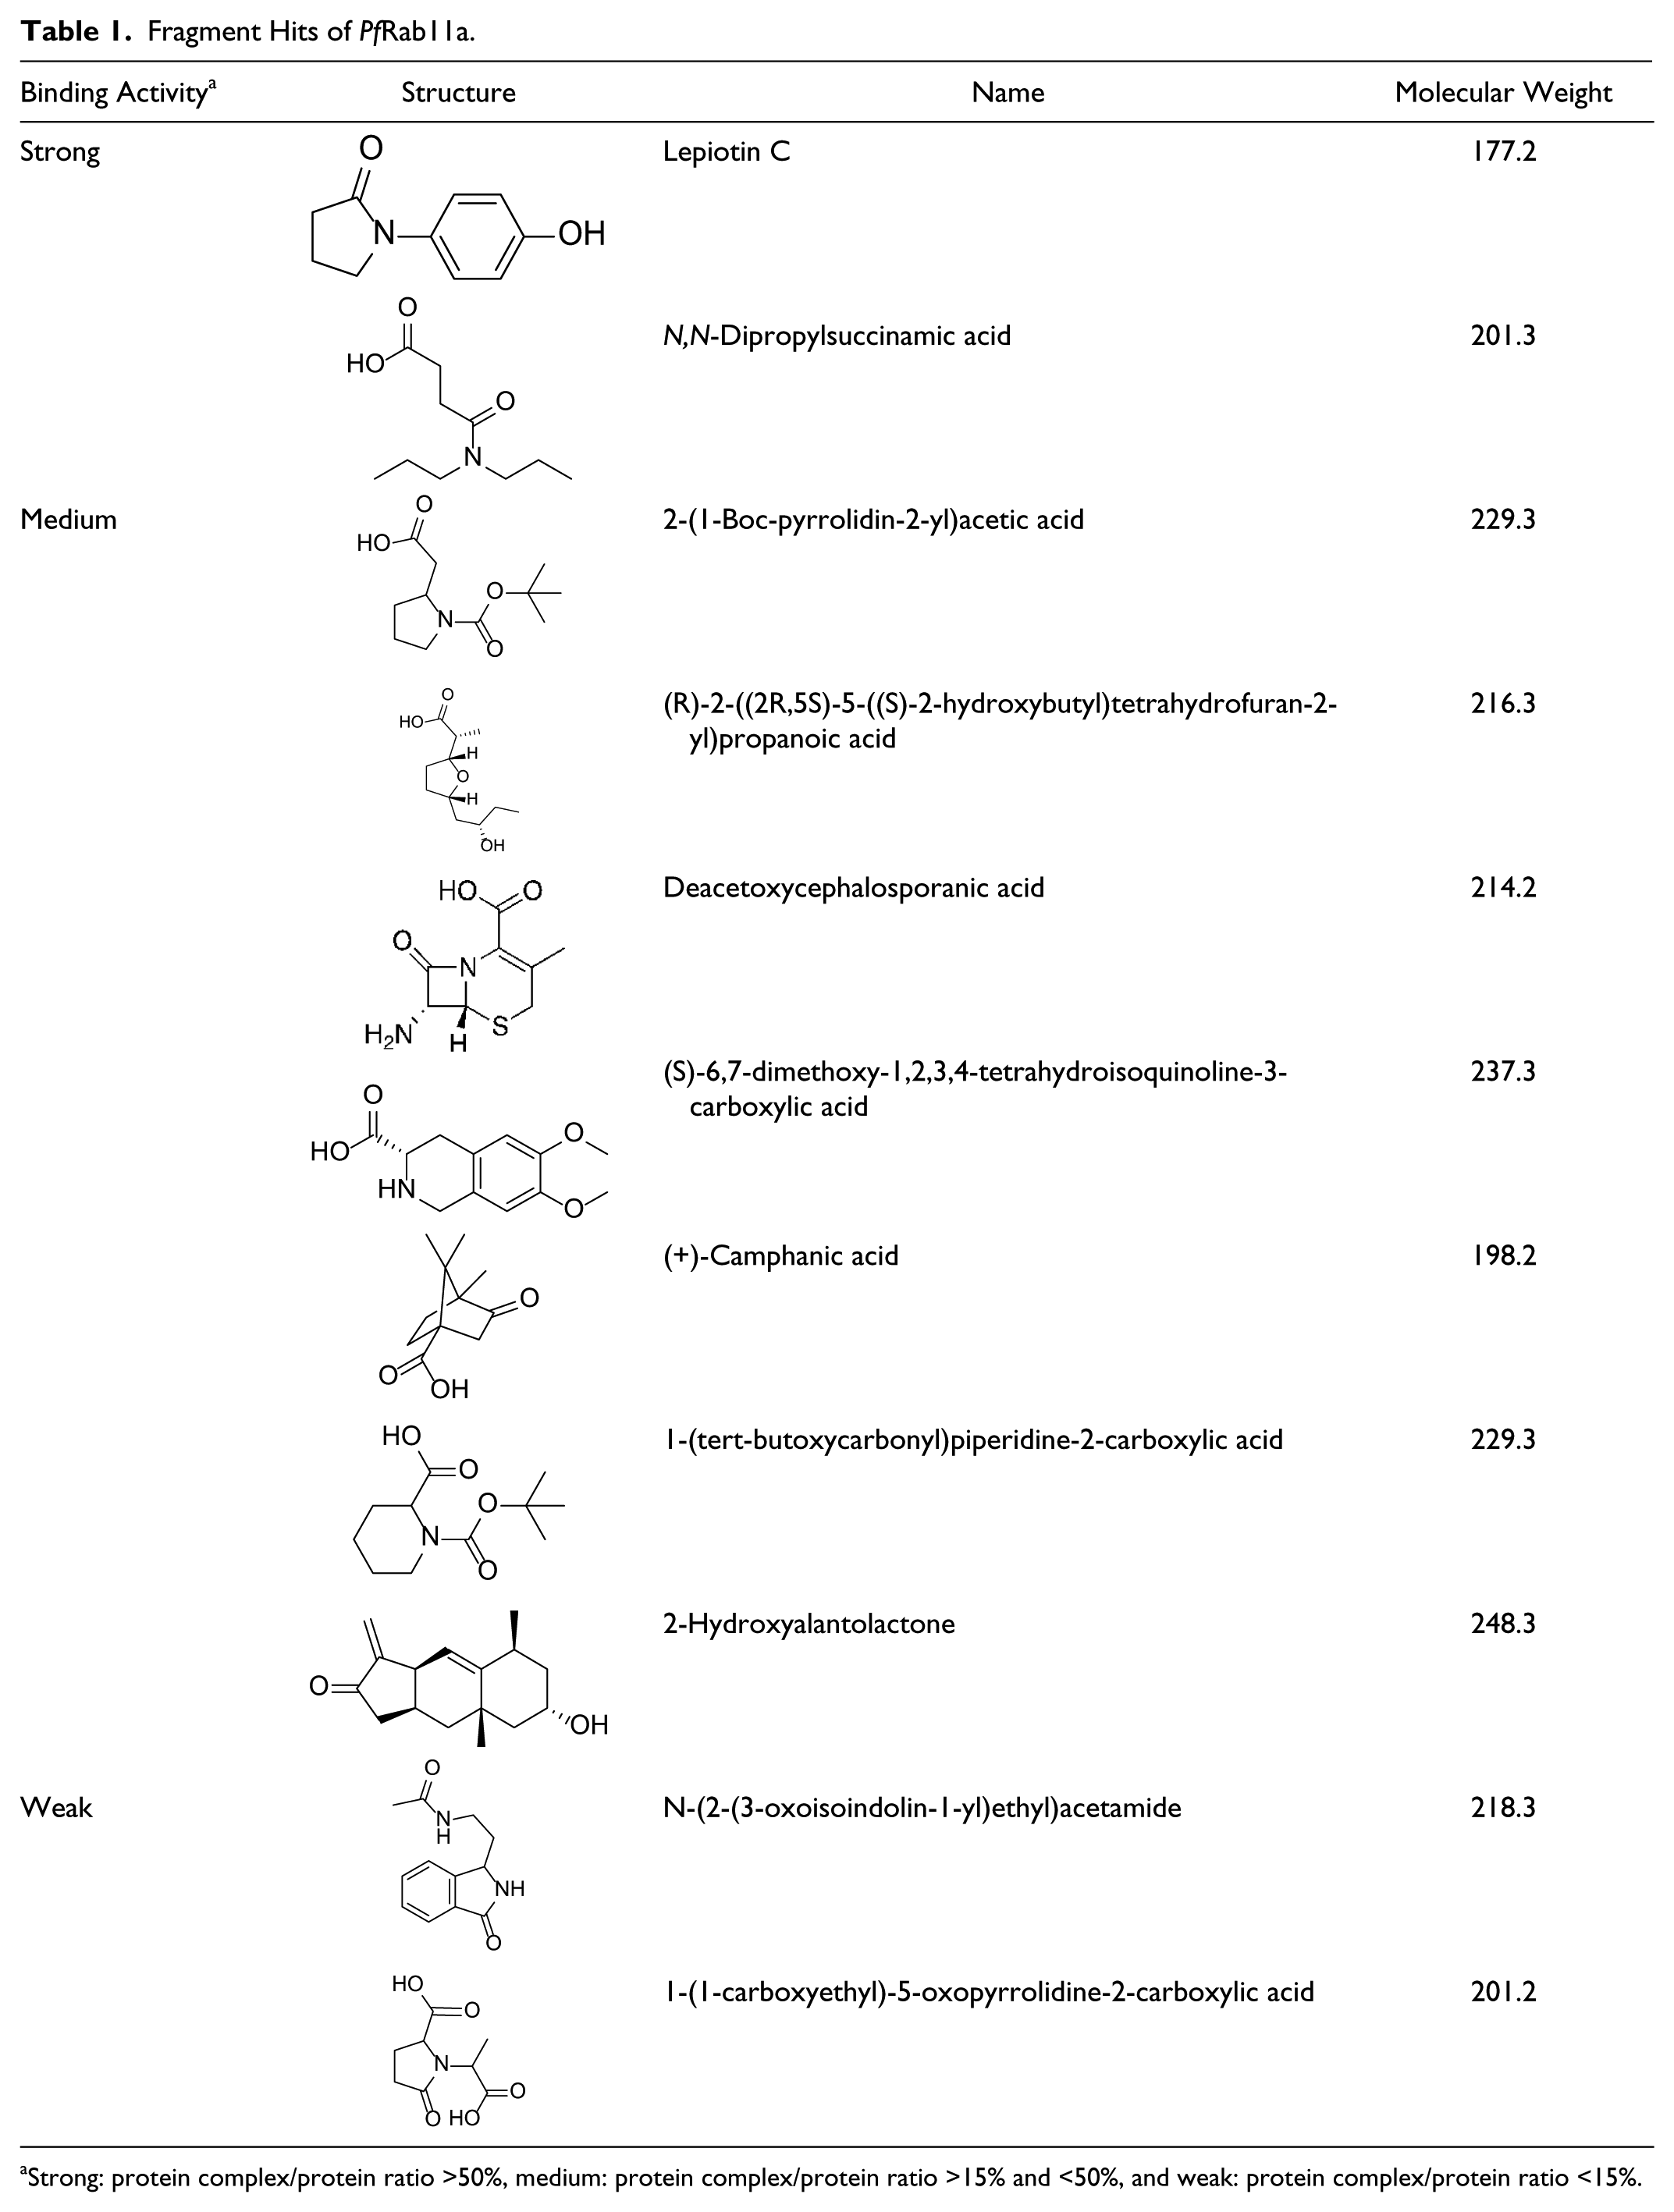
Strong: protein complex/protein ratio >50%, medium: protein complex/protein ratio >15% and <50%, and weak: protein complex/protein ratio <15%.
Materials and Methods
General Experimental Procedures
Nuclear magnetic resonance (NMR) spectra were acquired at 30 °C on an Agilent (Santa Clara, CA, USA) INOVA 600 MHz spectrometer, which was equipped with a triple-resonance cold probe. Low-resolution electrospray ionization mass spectrometry (LRESIMS) spectra were measured on a Waters ZQ mass spectrometer (Milford, CT, USA). High-resolution electrospray ionization mass spectrometry (HRESIMS) spectra were recorded on a Bruker (Bremen, Germany) Apex III 4.7 Tesla external electrospray ionization (ESI) source Fourier transform ion cyclotron resonance (FTICR) mass spectrometer. A Thermo Electron (Waltham, MA, USA) C18 Betasil 5-µm 143Å column (21.2 × 150 mm) and a Phenomenex (Lane Cove, Australia) C18 Onyx monolithic column (4.6 × 100 mm) were used for semi-preparative high-performance liquid chromatography (HPLC) and compound purity analysis. HPLC separations were conducted on a Waters 600 pump equipped with a 996 Photodiode Array Detector and Gilson 215 Liquid Handler (Middleton, WI, USA).
All ESI-FTMS experiments were performed on a Bruker Apex III 4.7 Tesla external ESI source FTICR mass spectrometer. Samples were directly infused by a Cole-Parmer syringe pump (Chicago, IL, USA) with a flow rate of 2 µL/min. The end plate voltage was biased at 3200 V and the capillary voltage at 4500 V relative to the ESI needle during data acquisition. A nebulizing N2 gas pressure of 50 psi and a counter-current drying N2 gas with a flow of 30 L/min was used. The drying gas temperature was maintained at 100 °C for direct-infusion ESI-FTMS. The capillary exit voltage was tuned at 140 V and the skimmer 1 voltage at 15 V. Ions were accumulated in an external ion reservoir composed of a hexapole, a skimmer cone (skimmer 2) with a tuning voltage of 12 V, and an auxiliary gate electrode, prior to injection into the cylindrical Infinity analyzer cell (Bruker, Bremen, Germany), where they were mass analyzed. These optimized conditions were used based on our previous studies.8,9
Mass spectra were recorded in the positive ion mode with mass range from 50 to 6000 m/z for broadband low-resolution acquisition. All data acquisitions were performed on a 1200-MHz Pentium III data station running Bruker’s Xmass software under the Windows 2000 (Microsoft Corp., Redmond, WA) operating system.
ESI-FIMS Optimization
Based on previous work,8,9 optimization of protein concentration and the influence of methanol (MeOH) (from 10%–90%) on Pf Rab11a mass spectra were determined.
Pf Rab11a was dissolved in ammonium acetate (10 mM, pH 6.8) to generate solutions with different concentration (0.5 µM, 1.0 µM, 1.5 µM, 4.5 µM, and 10 µM). The total volume of each solution was 100 µL. After being incubated at 4 °C for 1 h, 50 µL of each sample was injected into the ESI-FTMS for analysis.
Pf Rab11a (4.5 µM) was incubated with different concentrations (10%, 20%, 30%, 40%, 50%, 60%, 70%, 80%, and 90%) of MeOH. Samples were incubated at 4 °C for 1 h and then analyzed by ESI-FTMS.
Sample Preparation and ESI-FTMS Screening
In total, 192 extracts from Nature Bank (Eskitis Institute, Brisbane, Australia) were added to each well of a V-plate microtitre plate (BioCentrix, Carlsbad, CA, USA). Each well contained lead-like enhanced extract prepared by extraction and solid-phase extraction (SPE) from 125 µg of dried biota dissolved in MeOH (5 µL) as previously described. 2 The PfRab11a (50 µL, 4.5 µM) was added into each extract. The mixtures were incubated for 1 h at 4 °C and then analyzed by ESI-FTMS.
For ESI-FTMS fragment screening, 659 natural product fragments were provided as methanol solutions in 96-well plates. The blank control was prepared by mixing the protein PfRab11a (50 µL, 7.29 µM) with methanol (1 µL). Screening samples were prepared by mixing the protein (50 µL, 7.29 µM) with a pool of eight fragments in methanol (1 µL). The final total volume of each well was 51 µL. The concentration of each fragment in the screening assay wells was 98.03 µM. The fragment to protein ratio was ~14:1. All plates were covered and incubated at 4 °C for 1 h and then analyzed by ESI-FTMS. The acquired spectra were compared with the experiment control spectrum.
Plant Material
The plant sample (family: Rubiaceae; species: P. montigena) was collected at Daintree National Park, Mt Sorrow track, North Queensland, Australia, in December 1997 by Dr. P. I. F. Forster. A voucher sample has been deposited at the Queensland Herbarium, Brisbane, Australia.
The natural product fragment library had 659 members and was built from a selection of our natural product compound collection. The selection criteria for fragments were as follows: molecular weight, ≤250 Da; calculated log P, <4; hydrogen bond donors, ≤4; hydrogen bond acceptors, ≤5; rotatable bonds, ≤6; and polar surface area, <45.
Extraction and Isolation
The freeze-dried and ground plant material (10 g) was placed into a conical flask (1 L), n-hexane (250 mL) was added, and the flask was shaken at 200 rpm for 2 h. The n-hexane extract was filtered under gravity and then discarded. CH2Cl2 (250 mL) was added to the defatted plant material in the conical flask and shaken at 200 rpm for 2 h. The resultant extract was filtered under gravity and set aside. MeOH (250 mL) was added, and the MeOH/plant mixture was shaken for a further 2 h at 200 rpm. Following gravity filtration, the biota was extracted with another volume of MeOH (250 mL) while being shaken at 200 rpm for 16 h. All CH2Cl2/MeOH extracts were combined and dried under reduced pressure to yield a dark brown solid (2.80 g). A portion of this material (1.0 g) was preadsorbed to C18-bonded silica (1 g) and then packed into a stainless steel cartridge (10 × 30 mm) that was subsequently attached to a C18 semipreparative HPLC column. Isocratic HPLC conditions of 90% H2O (0.1% trifluoroacetic acid [TFA])/10% MeOH (0.1% TFA) were employed for the first 10 min, and then a linear gradient to MeOH (0.1% TFA) was run over 40 min, followed by isocratic conditions of MeOH (0.1% TFA) for a further 10 min, all at a flow rate of 9 mL/min. Sixty fractions (60 × 1 min) were collected from the start of the HPLC run. Fractions were analyzed by (±)-LRESIMS and NMR spectroscopy. Fraction 41 yielded arborside E (1.4 mg, 0.58% dry weight).
Enzyme Assay
PfRab11a was cloned from P. falciparum complementary DNA (cDNA) and produced and purified as previously described. 10 The protein was dissolved in ammonium acetate (10 mM, pH 6.8) to generate stock solution (4.5 µM).
PfRab11a activity was measured with a colorimetric GTPase assay kit purchased from Innova Biosciences (BioNovus Life Sciences, Cherrybrook, Australia) following the manufacturer’s protocol. Briefly, different concentrations of arborside E (0.01 µM, 1.0 µM, 1.5 µM, 4.5 µM, 10 µM, 20.0 µM, 30.0 µM, 40.0 µM, 50.0 µM, 80.0 µM, and 100.0 µM) were incubated with PfRab11a (4.5 µM) for 1 h; GTP (10 µM) was added, and the mixture incubated for 30 min at 4 °C. Colorimetric buffer (Pi ColorLock Gold and Accelerator; Innova Biosciences) was added, and the mixture was incubated for 5 min at 4 °C. Then, stabilizer buffer was added, and the reaction mixture was incubated for 30 min. Optical density was determined at 620 nm by using an EnVision Multilabel Reader (PerkinElmer, Waltham, MA).
KD Determination
Dissociation constant (KD) is the equilibrium constant for the dissociation of a complex into its components. To determine the KD, the relative abundances of bound to total protein in the mass spectra were correlated to the relative equilibrium concentrations of bound to total protein in solution, as follows:
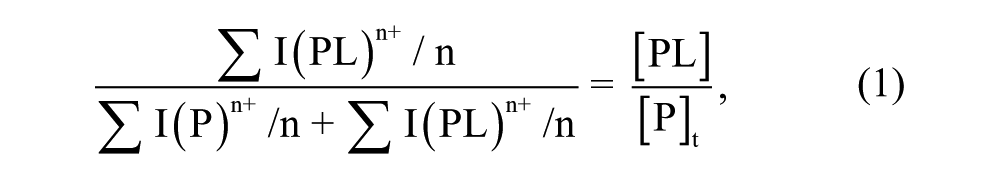
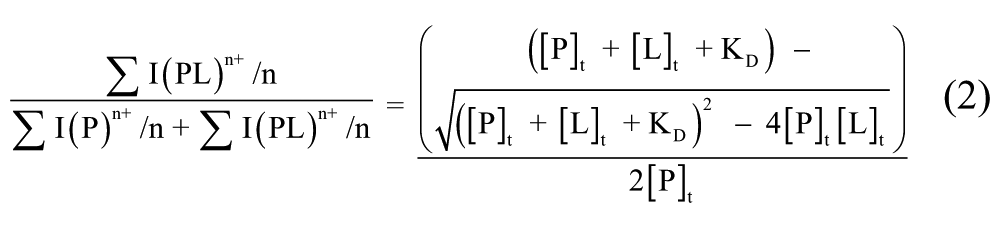
where the total abundances of free protein and protein-ligand complex were obtained by the sum of all the respective charges states intensity peaks (I) normalized for charge state (n). As in each spectrum, three charge states (9+, 10+, and 11+) of free protein and protein-ligand complexes can be observed. The total abundances of free protein and protein-ligand complex were obtained by the sum of their three charge states intensity peaks. By plotting experimentally observed ratios between bound and total protein ion abundances against total concentration of ligand, KD was obtained as a parameter of a nonlinear least squares curve fitting 11 :
Results and Discussion
In the initial spray solution, the protein concentration is an important factor that significantly affects the ESI–mass spectrometry (MS) signal intensity. 12 In this study, ESI-FTMS optimization suggested that 4.5 µM was the most suitable protein concentration to do bioaffinity MS screening (details in supplementary materials). MeOH can increase the solubility of natural products in buffer solution, thus appearing to improve the interaction between protein and ligands. However, too much methanol can cause protein denaturation. 13 The results showed that methanol increased the intensity of the protein signal (details in supplementary materials).
A 659-member fragment library and 192 crude extracts from Australian plants were screened using ESI-FTMS. Eleven fragments and one extract were identified to bind to the target. Depending on the protein-ligand/protein ratio, the binding of the fragments was ranked as strong, medium, or weak ( Table 1 ). The active extract from the plant P. montigena was identified to contain a constituent that bound to the protein Pf Rab11a ( Fig. 1 ). As shown in the ESI-FTMS spectrum, six peaks were observed. The two at m/z 2113.7144 and 2170.9110 represented [PfRab11a]11+ and [PfRab11a-ligand]11+ complex, respectively; two peaks at m/z 2325.4072 and 2388.3710 represented [PfRab11a]10+ and [PfRab11a-ligand]10+ complex, respectively; and two peaks at m/z 2583.3924 and 2653.4289 represented [PfRab11a]9+ and [PfRab11a-ligand ]9+ complex, respectively.
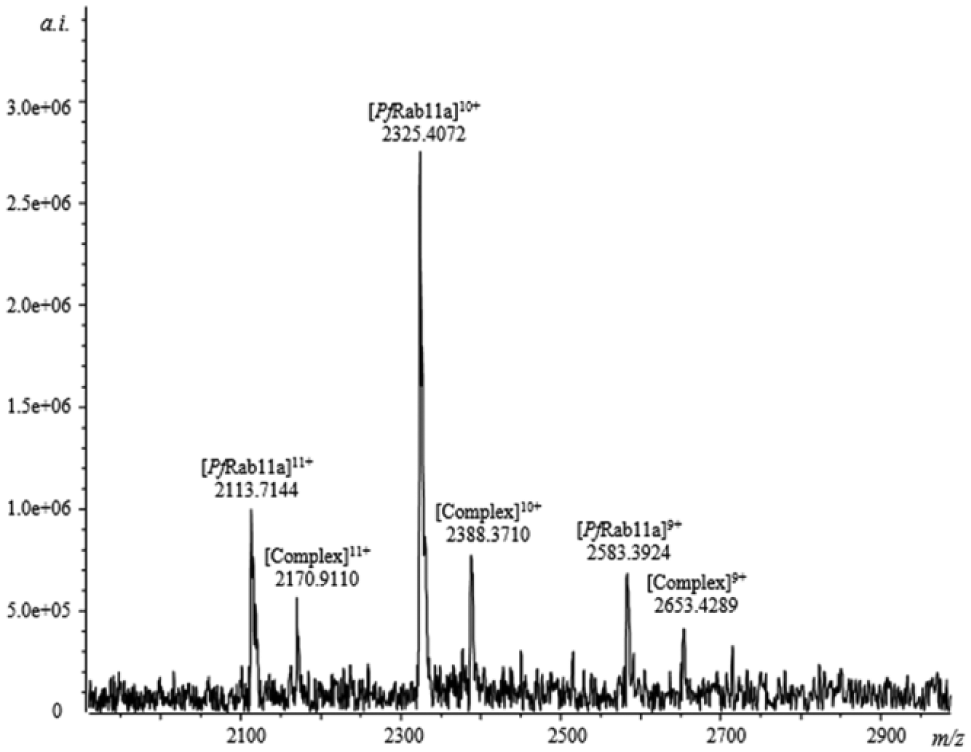
Electrospray ionization Fourier transform ion cyclotron resonance mass spectrometry (ESI-FTMS) spectrum of the protein-ligand complex.
The molecular weight (MW) of the bound ligand was calculated as 629.6380 Da using the following equation 14 :
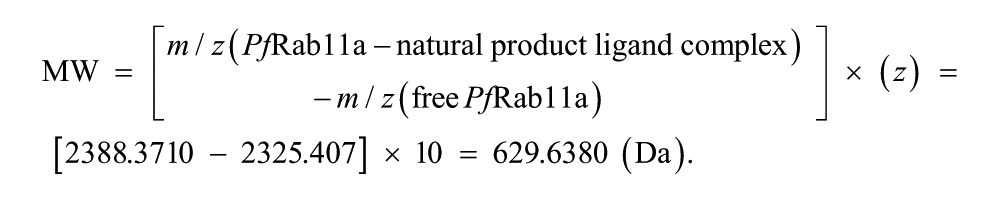
To obtain sufficient quantity of the compound for further structure identification and biological activity study, 10 g freeze dried plant sample was extracted with n-hexane, CH2Cl2, and MeOH. (+)-LRESIMS measurement of the combined CH2Cl2/MeOH extracts confirmed the presence of the target compound in the extract. The combined CH2Cl2/MeOH extract was then fractionated using reversed-phase C18 HPLC eluting with 10% MeOH (0.1% TFA) to 100% MeOH (0.1% TFA) over 60 min. LRESIMS measurement indicated that fraction 41 contained the ion of interest at m/z 631.0 Da, which led to the isolation of a new compound, arborside E.
Arborside E (
Fig. 2
) was isolated as a light yellow, amorphous solid with a
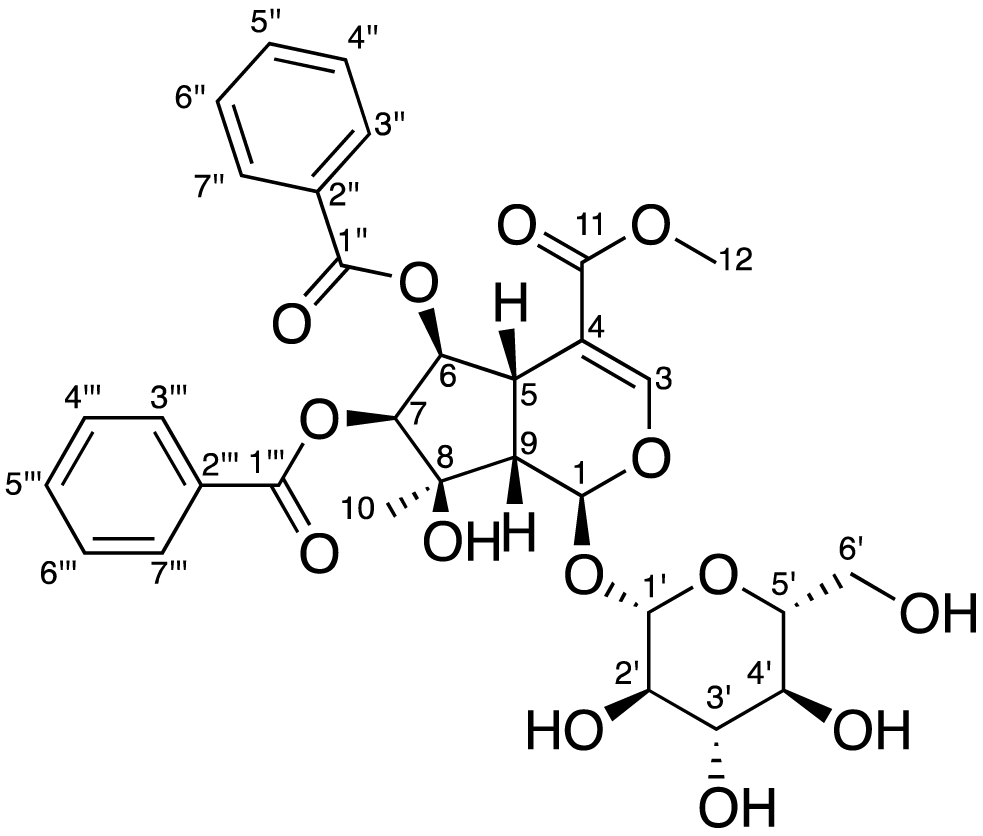
Structure of arborside E.
Nuclear Magnetic Resonance (NMR) Spectroscopic Data for Arborside E. a
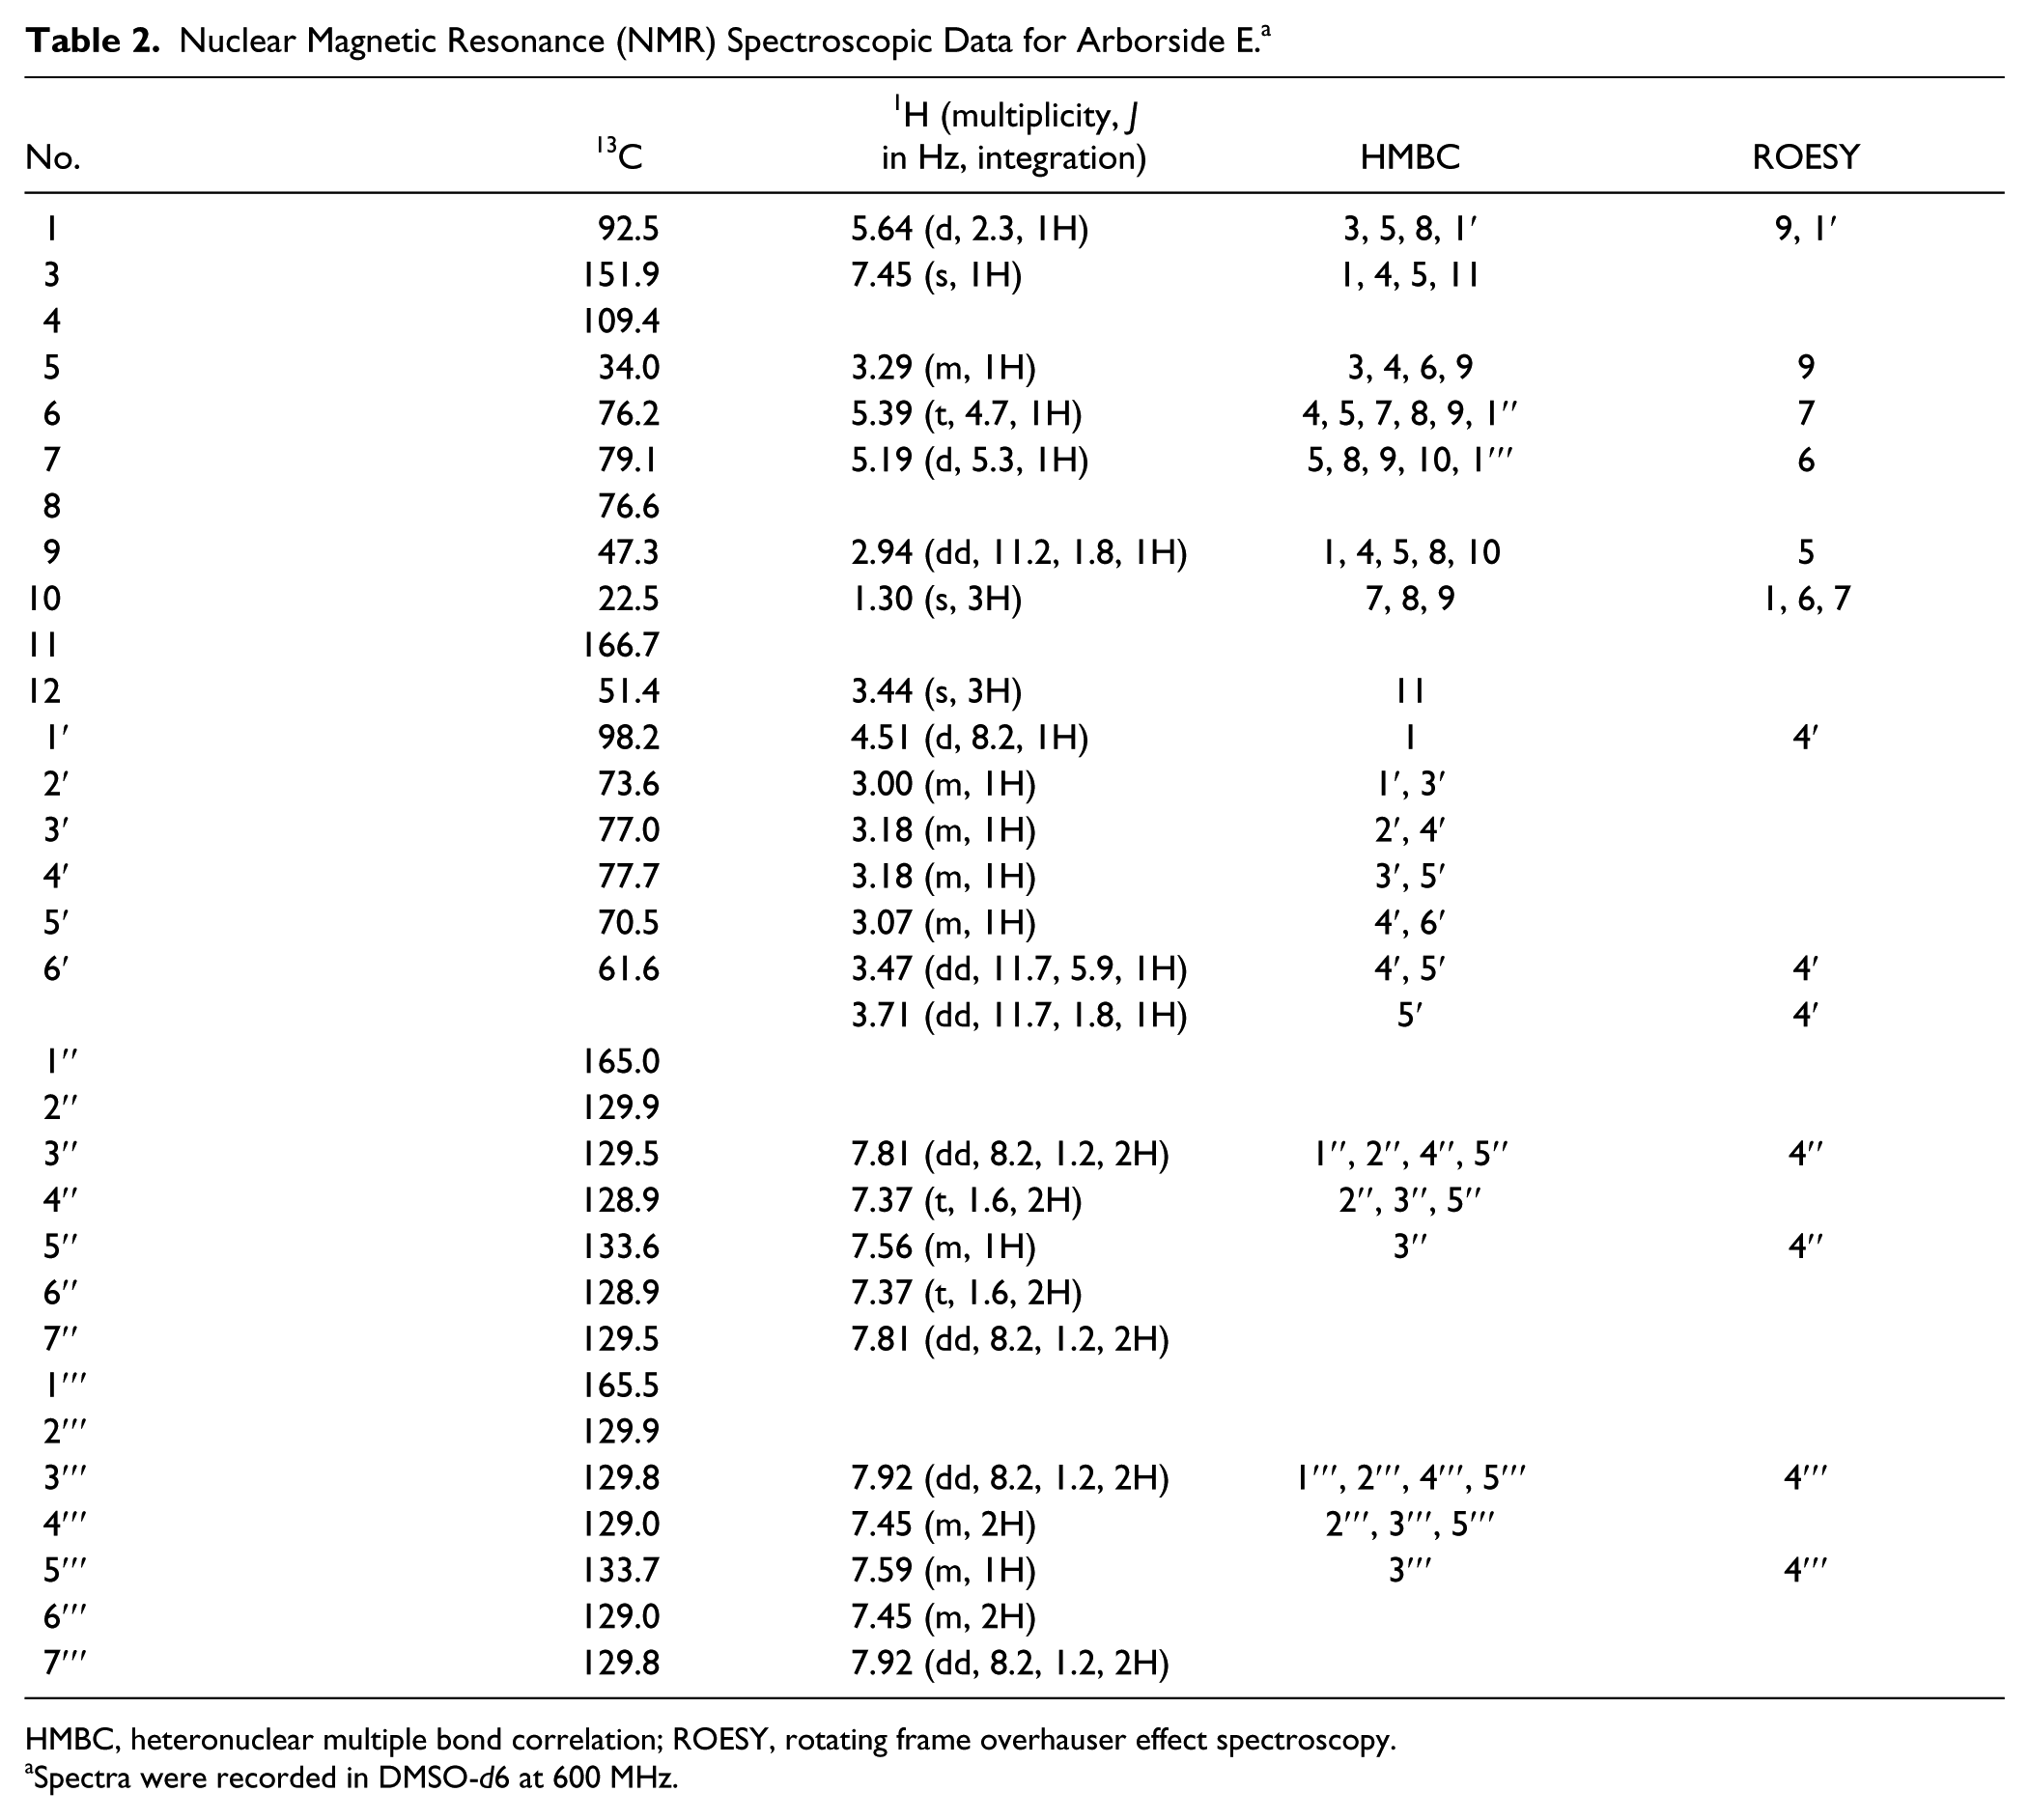
HMBC, heteronuclear multiple bond correlation; ROESY, rotating frame overhauser effect spectroscopy.
Spectra were recorded in DMSO-d6 at 600 MHz.
To determine the binding affinity of arborside E, the KD was measured by a titration experiment monitoring the equilibrium population of free protein and ligand-protein complex using a constant concentration of protein (4.5 µM in 10 mM ammonium acetate buffer, pH 6.8) and increasing concentrations of ligand (2 µM, 3 µM, 4 µM, 8 µM, 40 µM, and 50 µM). Each protein-ligand mixture was incubated at 4 °C for 1 h before analyzing by ESI-FTMS. The experiment was run in triplicate. Prism software (GraphPad Prism, La Jolla, CA) was used to plot the fraction of bound protein against the total ligand concentration of arborside E. According to equation (2), the value of KD of arborside E was determined as 1.921 ± 0.4028 µM ( Fig. 3a ). To distinguish a real affinity from titration-like binding, we used the same method to measure the KD again with a lower protein concentration (3.0 µM), and the KD value was 1.963 ± 0.2134 µM ( Fig. 3b ), which indicated a real KD was measured.
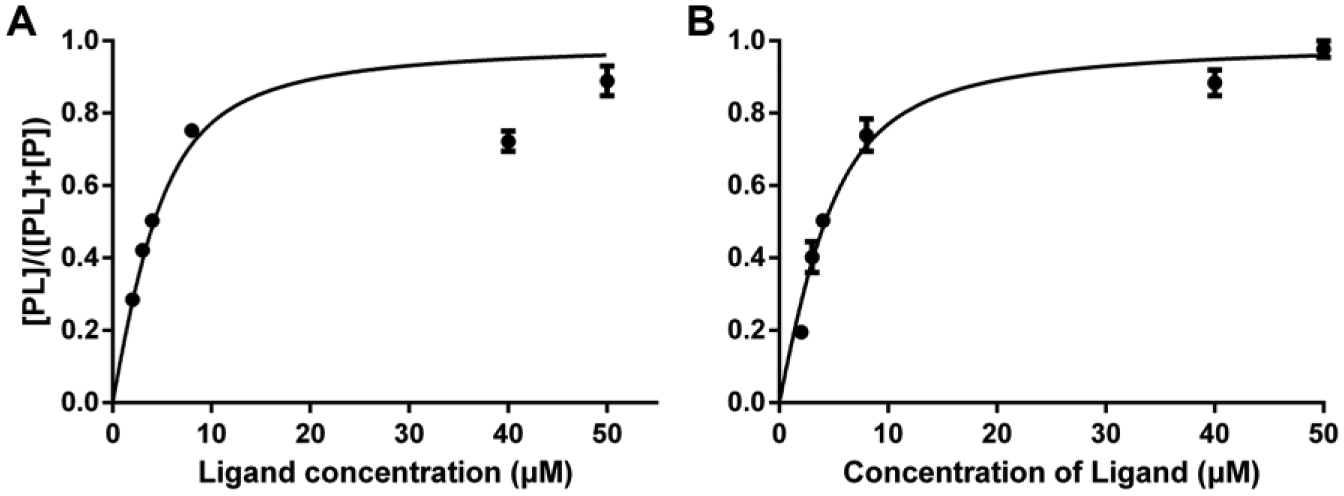
Titration of arborside E in PfRab11a for determination of KD.
Nonspecific binding can be detected by a competition experiment using a known ligand to compete with binding of the first ligand to the specific site. However, there is no published ligand for PfRab11a. Under this circumstance, an orthogonal enzyme assay was run against PfRab11a using the Innova Biosciences GTPase kit to confirm the inhibitory activity of arborside E. Titration experiments were carried out with PfRab11a at a fixed concentration of 4.5 µM in 10 mM ammonium acetate buffer (pH 6.8) and the ligand at a varied concentration from 0.01 µM to 100 µM (0.01 µM, 1.0 µM, 1.5 µM, 4.5 µM, 10 µM, 20.0 µM, 30.0 µM, 40.0 µM, 50.0 µM, 80.0 µM, and 100.0 µM). The result showed that arborside E had an IC50 value of 19.73 ± 1.174 µM ( Fig. 4 ). Inhibition constant (Ki) was calculated from the IC50 using a web-based tool 16 to give a value of 3.042 ± 0.1767 µM. The Michaelis constant (Km) is the substrate concentration at which the reaction rate is at half-maximum and is an inverse measure of the substrate’s affinity for the enzyme. According to a published method, 17 Km was calculated to have a value of 2.134 µM. All these data confirmed arborside E’s binding activity and inhibitory activity against PfRab11a.
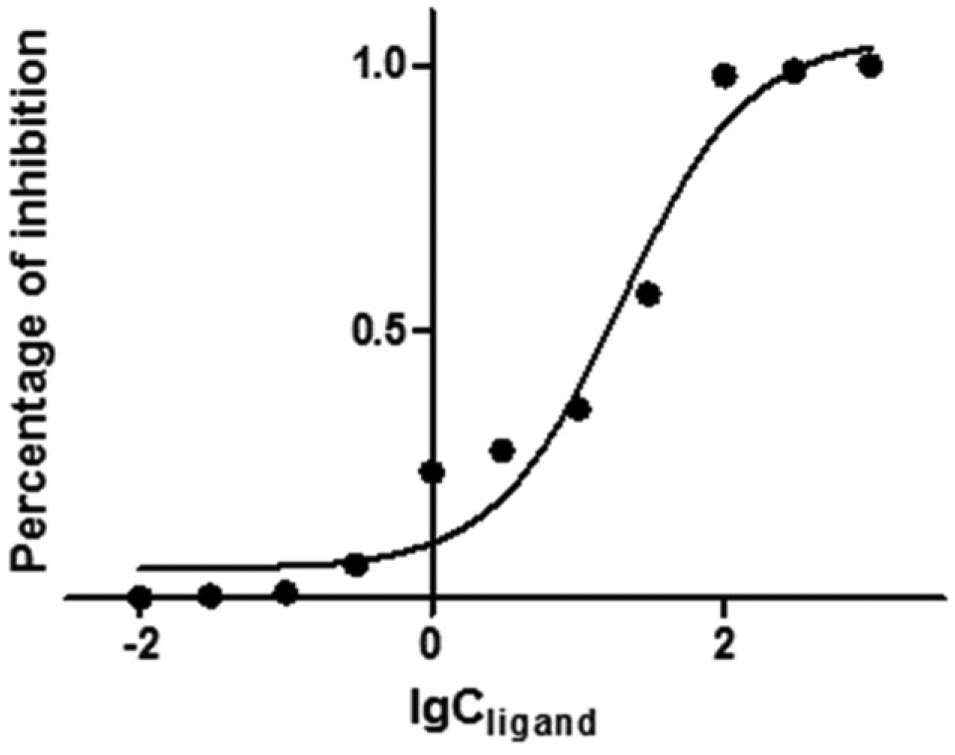
Enzyme assay result.
ESI-FTMS was used to screen 192 natural product extracts and a library of 659 fragment-sized natural products against PfRab11a. One extract from Australian plant P. montigena and 11 fragments were identified to bind to the protein PfRab11a. Screening a fragment library gave a higher hit rate (1.6%) than screening the natural product extracts (0.5%). MS-directed isolation led to the identification of a new natural product, arborside E. Its binding activity and inhibitory activity against PfRab11a were confirmed by ESI-FTMS titration experiments and an orthogonal enzyme assay.
To our knowledge, this is the first time a bioaffinity MS screening method has been used to study the malarial target PfRab11a, and it is the first time that binders (a compound and 11 fragments) to this target and a new natural product inhibitor have been reported.
Our study demonstrated that ESI-FTMS screening is a quick and accurate method to identify binders to the potential drug target PfRab11a. ESI-FTMS can detect a protein-ligand complex in a complex natural product extract and detect protein-fragment interactions. Bioaffinity ESI-FTMS fragment screening has several advantages. First, there is no need for labeling of protein or compounds. Second, the screening and analysis are fast. The library of 659 fragment members required only 3 h for data acquisition and another 3 h for data analysis and confirmatory testing. Third, the consumption of the protein is very small. The screen of 659 fragments consumed less than 1 mg protein. Fourth, the mass signal of the protein-ligand complex provides the molecular weight of the active binding fragment in a pooled library and the molecular weight of the binding constituent in a complex extract.
In summary, this direct bioaffinity ESI-FTMS screening has a great potential to become a widely used screening method in drug discovery owing to its sensitivity, reliability, and speed.
Footnotes
Acknowledgements
The authors thank the Queensland Herbarium for the collection of the plant sample.
Declaration of Conflicting Interests
The authors declared no potential conflicts of interest with respect to the research, authorship, and/or publication of this article.
Funding
The authors disclosed receipt of the following financial support for the research, authorship, and/or publication of this article: The Bruker 4.7 Tesla Apex III was partially funded by the Australian Research Council (ARC LIEF LE0237908). We acknowledge support from the Australian Research Council (ARC Discovery DP0343419, ARC Linkage Project LP120100485) and the Bill & Melinda Gates Foundation Grand Challenges Explorations Grant Phase II OPP1035218 GCE.
References
Supplementary Material
Please find the following supplemental material available below.
For Open Access articles published under a Creative Commons License, all supplemental material carries the same license as the article it is associated with.
For non-Open Access articles published, all supplemental material carries a non-exclusive license, and permission requests for re-use of supplemental material or any part of supplemental material shall be sent directly to the copyright owner as specified in the copyright notice associated with the article.