
Abstract
We have implemented a solid-phase extraction based time-of-flight mass spectrometer system in combination with novel informatics to rapidly screen and characterize the covalent binding of different irreversible inhibitors to intact proteins. This high-throughput screening platform can be used to accurately detect and quantitate the extent of formation of different covalent protein-inhibitor adducts between electrophilic inhibitors and nucleophilic residues such as cysteine or lysine. For a representative 19.5 kDa protein, the analysis time is approximately 20 s per sample, including an efficient sample loading and desalting step. Accurate protein masses are measured (±0.5 amu of the theoretical molecular weight; measured precision of ±0.02 amu). The fraction of protein reacted with an electrophilic compound is determined relative to an unmodified protein control. A key element of the workflow is the automated identification and quantitation of the expected masses of covalent protein-inhibitor adducts using a custom routine that obviates the need to manually inspect each individual spectrum. Parallel screens were performed on a library of approximately 1000 acrylamide containing compounds (different structures and reactivities) using the solid-phase extraction mass spectrometry based assay and a fluorescence based thiol-reactive probe assay enabling comparison of false positives and false negatives between these orthogonal screening approaches.
Keywords
Introduction
Covalent inhibitors have long been included among approved drugs and have recently become the subject of renewed interest with the launches of ibrutinib and afatinib, acrylamide-based inhibitors targeting cysteine residues in BTK and EGFR, respectively.1,2 A historical bias against covalent inhibitors has been founded on the perception of the risk of off-target reactions. To minimize such reactions, a molecule should react extensively with its intended target, but only minimally with off-targets. If the residue modified is a cysteine, thiol-reactive probe reagents
3
or mass spectrometry (MS) are well suited to the detection of such modifications. Traditional liquid chromatographic (LC)–MS approaches, which are based on ultra-high-pressure liquid chromatography (UPLC) systems,4,5 typically feature a throughput of 4–5 min per sample, which includes UPLC reequilibration time (
RapidFire MS systems have typically been applied to detect the products produced in an enzyme reaction by mass spectrometry and hence to screen for inhibitors of that reaction. 6 Another MS-based screening method (affinity selection) is based on the detection of noncovalent ligands following their binding and subsequent release upon protein denaturation. 7 In a third approach, MS was used to identify covalent inhibitors. Kathman et al. 8 screened approximately 100 acrylate fragments (in pools of 10) by detecting the covalent protein-inhibitor adducts produced. However, the slower LC-MS method employed in that effort placed inherent limits on both throughput and library size. To our knowledge, a truly high-throughput mass spectrometric approach to screen for covalent inhibitor adducts on intact proteins has not been reported due to both LC-MS capacity and informatics limitations. We have employed the RapidFire MS system together with a custom data processing workflow to rapidly quantitate the extent of covalent protein-inhibitor adduct formation in various proteins and used this system to screen libraries of reactive compounds in an almost fully automated fashion ( Scheme 1 ). This approach should be generally applicable for the unambiguous detection and quantitation of covalent protein modifications, including but not limited to covalent inhibitors, in a high-throughput fashion.
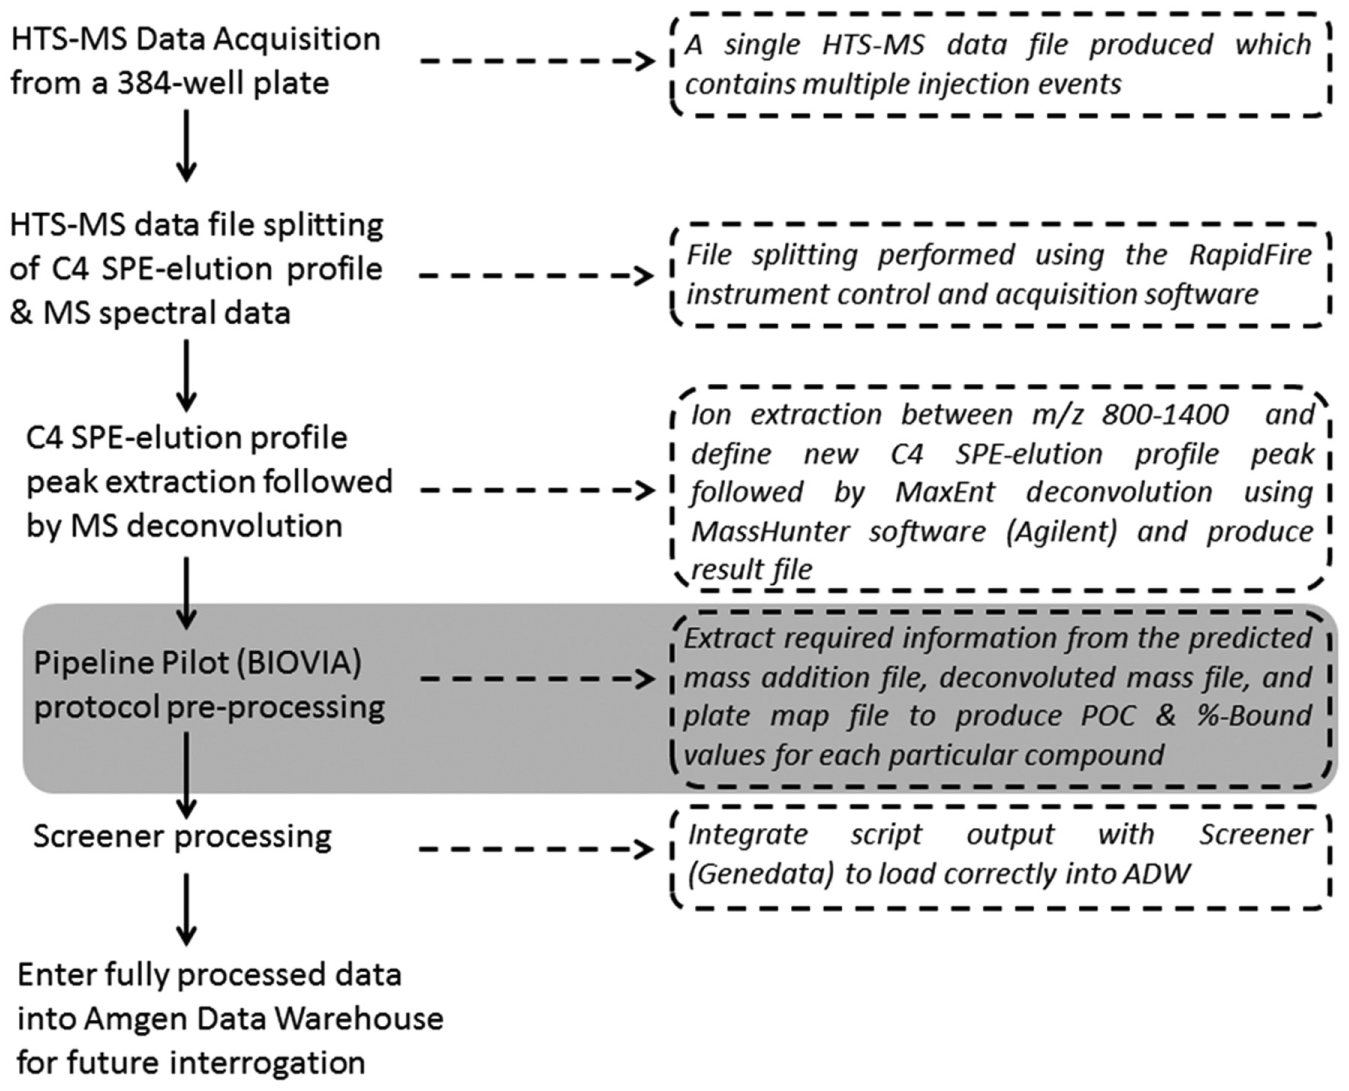
Summary of the high-throughput screening mass spectrometry (HTS-MS) workflow developed for this study. The text on the right-hand side of the workflow offers more detail for each stage. The key automated identification and quantitation step of the expected covalent protein-inhibitor adduct mass is highlighted in gray. MaxEnt, Baysein probability–based maximum entropy deconvolution algorithm; ADW, Amgen Data Warehouse.
Materials and Methods
Protein Purification
Example proteins of 19.2 kDa (surface mutant construct) and 19.5 kDa (target construct) were expressed in Escherichia coli. Several surface mutant proteins were designed and evaluated. The selection of the final surface mutant construct was based on X-ray crystallographic data; pKa calculation of the newly introduced surface cysteine residue, such that it matched the pKa of the active site cysteine of the target protein; level of solvent exposure; thermal melting point experiments; and one-dimensional (1D) 1H-NMR determination of surface mutant protein solution folding properties. The E. coli paste was resuspended in 20 mM Tris, pH 7.5, 10 mM imidazole, 150 mM NaCl, 10% glycerol, 10 mM β-mercaptoethanol, and protease inhibitors (EDTA-free, Thermo Scientific, Waltham, MA) and passed through microfluidizer (two passes) to break open the cells. The solution was then centrifuged in a JLA 16.250 centrifuge at 13,000 rpm for 2 h at 4 °C. Supernatant was filtered through a 0.45 µm Versaflow capsule (Pall, Port Washington, NY) and 0.45 µm cellulose acetate (Corning, Lowell, MA) and loaded onto HisPur NiNTA (Thermo Scientific). Collected fractions were concentrated and the Ni-NTA pool cleaved overnight with bovine thrombin (MP Biomedicals, Santa Ana, CA) at room temperature. The solution was diluted 10× with water and loaded onto SP-HP and Q-HP columns. After loading, the SP column was removed and fractions eluted from the Q-HP column with a 20-column volume (0–400 mM NaCl) gradient. Eluate was dialyzed against 25 mM Tris, pH 7.5, 50 mM NaCl, and 5 mM MgCl2 at 4 °C and filtered (0.22 µm Acrocdisc, Pall). An additional 60 kDa of protein was similarly expressed and purified. Recombinant human serum albumin (HSA Recombumin AlbIX, reduced cys-34, 66.4 kDa) was purchased from Novozymes (Bagsvaerd, Denmark) and used without further purification.
Assay Conditions
Thiol probe IV fluorescence spectroscopy and mass spectrometry assay conditions
3-(7-Hydroxy-2-oxo-2H-chromen-3-ylcarbamoyl)acrylic acid methyl ester (Thiol Fluorescent Probe IV) ( Scheme 2 ) was obtained from Merck Millipore (Billerica, MA). Both fluorometric and MS assays were performed in identical buffers: 25 mM HEPES, pH 7.4, 20 mM MgCl2, 10 mM NaCl, 3% DMSO, 0.0005% CHAPS, and 100 µM GDP made fresh and added to the assay buffer. The final concentrations of the 19.5 kDa target protein, electrophile (reactive compound), and Thiol Fluorescent Probe IV were 2, 10, and 30 µM, respectively. Thiol Fluorescent Probe IV was absent in the RapidFire MS assays. Assay incubation times were 2 and 20 h. Each electrophile was dispensed to a separate well in a 384-well plate. Costar polypropylene black U-bottom plates were used for the fluorescence assay, and Greiner polypropylene clear V-bottom plates were used for the MS assays. More than 1000 different electrophilic compounds were assessed by both the thiol-reactive probe fluorescence assay and MS in parallel.
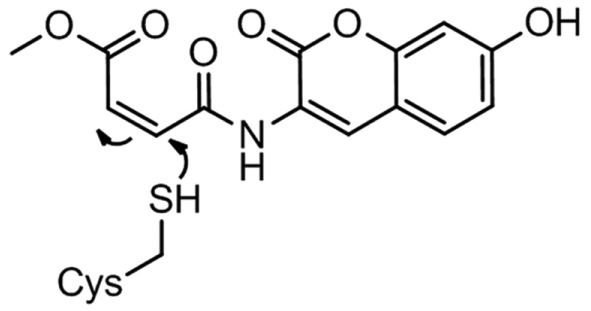
The reaction of Thiol Fluorescent Probe IV with a cysteine thiol residue.
Instrumentation
Thiol Fluorescent Probe IV fluorescence spectroscopy
Spectrofluorometric data were acquired on a Safire II instrument using excitation and emission wavelengths of 358 and 455 nm, respectively, and excitation and emission band wavelengths of both 20 nm, using an integration and lag time of 20 and 0 µs, respectively. The results are expressed as percent of control (POC), where POC = (x – low control)/(high control – low control), where x is the fluorescent signal in a particular well.
RapidFire sample liquid handling system
The RapidFire liquid handling unit used was the RF 360 model. Solvents were delivered by Agilent 1260 Infinity pumps. The instrument control software was the Agilent RapidFire High Throughput MS system software (v4.0.12333.14274). A single C4 Type A (Agilent, G9203) SPE cartridge was used for these experiments. A volume of 10 µL (sample loop determined) was removed from each well of a 384-well plate by using an aspiration time of 300 ms. The sample load/wash time was 6000 ms at a flow rate of 1.25 mL/min (H2O, 0.1% v/v formic acid, 0.05% v/v trifluoroacetic acid); elution time was 7000 ms (acetonitrile, 0.1% v/v formic acid, 0.05% v/v trifluoroacetic acid); reequilibration time was 700 ms at a flow rate of 1.25 mL/min (H2O, 0.1% v/v formic acid, 0.05% v/v trifluoroacetic acid). Taking into account the needle moving from well to well, the overall analysis time per sample was 20 s. Additional blank washes can be performed between injections, however, this option was not used during this data acquisition, for the reason of higher throughput and increased analysis times, and protein carryover from injection to injection was determined to be below the level of detection. For a more detailed discussion of the RapidFire fluidic system, refer to Ozbal and Jonas.6,9
Mass spectrometry
Mass spectrometric data were acquired on an Agilent 6530 quadrupole time-of-flight (QToF) MS system, operated with a dual Agilent Jet Spray (AJS) ion source, in positive ionization mode. The instrument parameters were as follows: gas temperature 350 °C, drying gas 5 L/min, nebulizer 60 psi, sheath gas 350 °C, sheath gas flow 11 L/min, capillary 3.5 kV (0.037 µA), nozzle 1.75 kV, fragmentor 200 V, skimmer 75 V, and octapole RF 800 V peak-to-peak. Data were acquired at the rate of 5 spectra/s. The mass scale was calibrated using the Agilent positive ion tune mix, over the m/z range 300–3200. The instrument control software was Agilent MassHunter Workstation Data Acquisition (vB.05.01).
Mass spectrometry data processing and informatics
All data processing was performed using a HP Z620, 64-bit, 12-processor Windows 7 PC, using a combination of Agilent MassHunter Qualitative Analysis (B.05.00) Agilent RapidFire control software (v4.0.12333.14070), and the Agilent DA Reprocessor Offline Utilities (B.05.00, Build 162). The SPE-MS data acquired from the RapidFire MS system is typically a single SPE-MS data file composed of multiple injection events (
Once the individual injection event MS data files have been produced, they are all batch processed using the DA Reprocessor Offline Utilities (B.05.00, Build 162, Agilent). For batch processing, a method file was created using Agilent MassHunter Qualitative Analysis B.05.00. The details of this method file are contained within the BioConfirm Workflow and are as follows:
Integrate (MS), Integrator Selection: General, smooth option selected; detector point sampling 1; start threshold 5.0; stop threshold 0.0; filtering 5 point; peak location, top
Extract (MS): Peak spectrum extraction (MS) within m/z 800–1400
Deconvolute (MS) Maximum Entropy: Mass range 19,000–21,000 Da; mass step 1.0 Da; S/N threshold 20.0; use limited m/z range 800–1400; adduct proton; isotope peak width automatic; minimum consecutive charge states 5
Once the individual injection event MS files are processed using the method file described above, a single report file is generated for each injection event MS file, in the form of an Excel spreadsheet. The format of this report file is determined by parameters defined within Workflow Automation. Typical defined options are
Reporting Options: Save report as Excel file.
WorkList Actions: Extract defined chromatograms, integrate and deconvolute, generate analysis report.
Selected Ranges: Operate on entire run.
Relevant protein molecular weight and intensity values, contained within specific cells in the spread sheet, are extracted from the Excel report/result file using a custom routine written within Pipeline Pilot (BIOVIA, Waltham, MA) and used to calculate percent of control (POC) and percent bound (% Bound) values in the form of a concatenated output file (text, tab delimited in format;
Results and Discussion
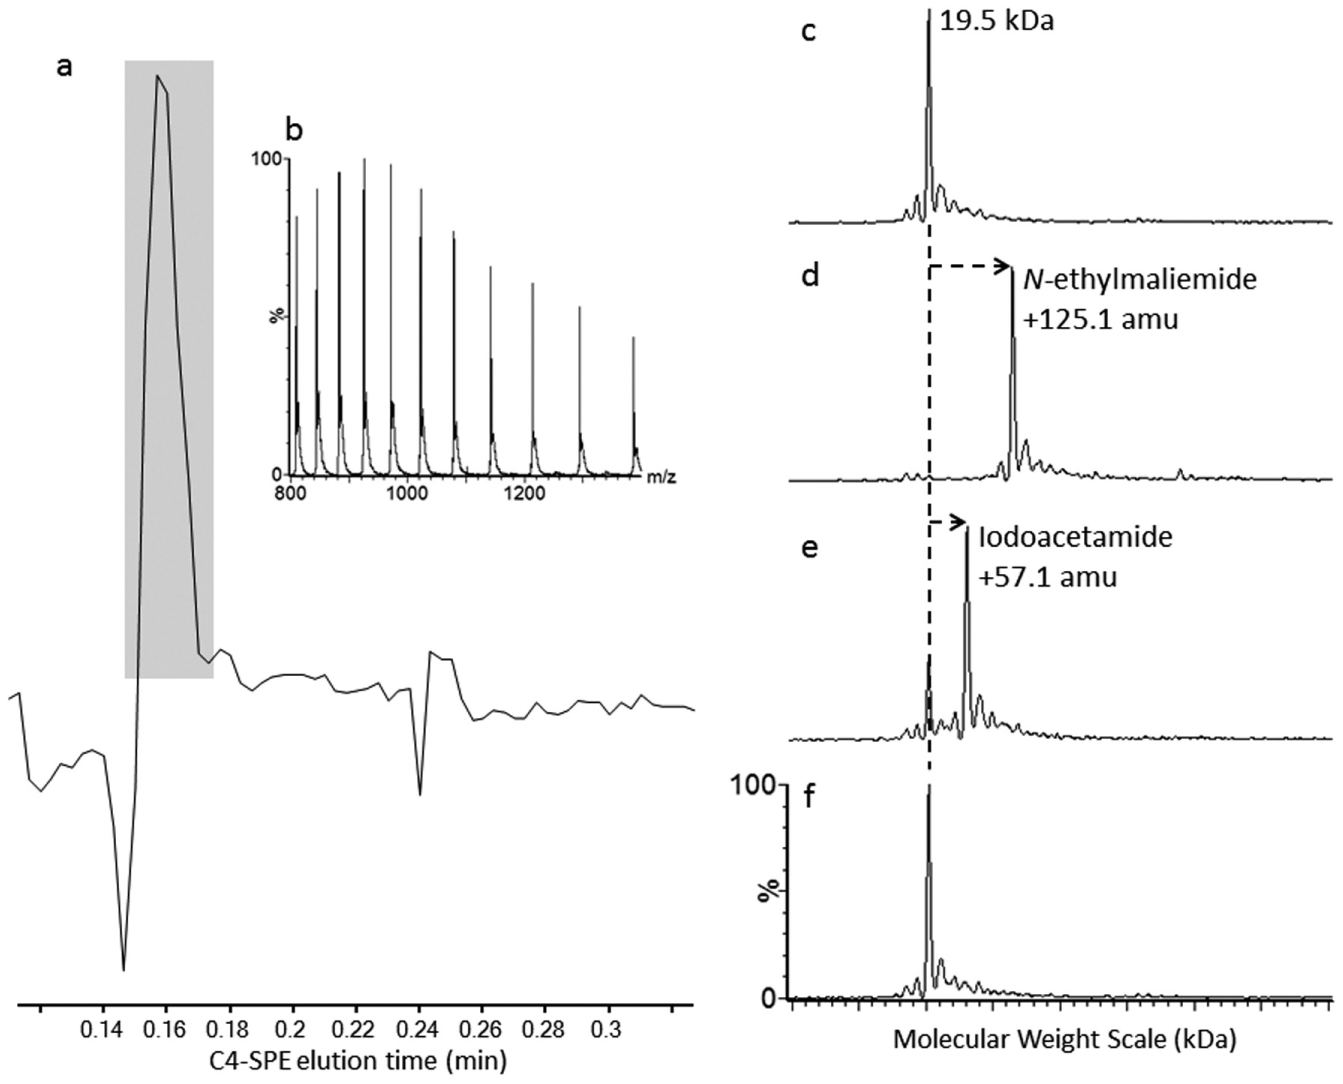
We initially used a representative 19.5 kDa protein containing a noncatalytic cysteine and several reactive model compounds to assess the ability of the RapidFire MS system to accurately detect covalent modifications to this target protein. The three electrophilic model compounds used were N-ethylmaleimide, iodoacetamide, and N-phenylacrylamide ( Table 1 ). Upon incubation (20 h) of the 19.5 kDa target protein (2 µM) with these electrophiles (10 μM) and injection of 0.4 µg of protein onto the C4-SPE cartridge followed by MS analysis, an example of the SPE-extracted chromatogram of ions in the m/z range 800–1400 is shown in Figure 1a . A well-defined SPE chromatogram profile is achieved, with a measured peak width at half height of 0.66 s. The overall turnaround time for each sample, including an efficient load/wash, needle and loop wash, and C4-SPE reequilibration, is 20 s. Figure 1b shows the m/z region, which is extracted from the 20 s SPE acquisition. Figure 1c is a representative deconvoluted zero-charge spectrum of the unreacted target protein. As can be observed, a high-quality spectrum with an excellent signal-to-noise ratio is produced. The mass measurement accuracy, based on multiple mass measurements (10 × 0.4 µg injections) of the 19.5 kDa protein, can be measured to within 0.5 Da of the expected construct molecular weight. The standard deviation for these measurements was ±0.02 Da. Such mass accuracy and precision measurements are routinely achievable on the current instrumentation. In fact, highly comparable measurements have been achieved on a quadrupole instrument more than a decade ago. 10 These reported mass measurements were achieved without internal mass calibration. Figure 1d , e shows the expected mass additions of 125.1 and 57.1 amu for the reactive electrophiles N-ethylmaleimide and iodoacetamide, respectively, which are easily identified, due to the observed increase in molecular weight, the excellent mass accuracy, and signal-to-noise ratio that is achieved. N-Phenylacrylamide showed no detectable levels of covalent modification ( Fig. 1f ). To determine the observed mass additions to the target protein of interest, the unprocessed MS data was deconvoluted to a zero-charge molecular weight (kDa) spectrum using the Bayesian probability–based maximum entropy deconvolution algorithm 11 such that the expected mass addition, based on the molecular weight and the expected covalent addition of the compound of interest, is easily visualized.
Sample Electrophile Compounds Used to Covalently Modify the Reactive Cysteine of the Target Protein.
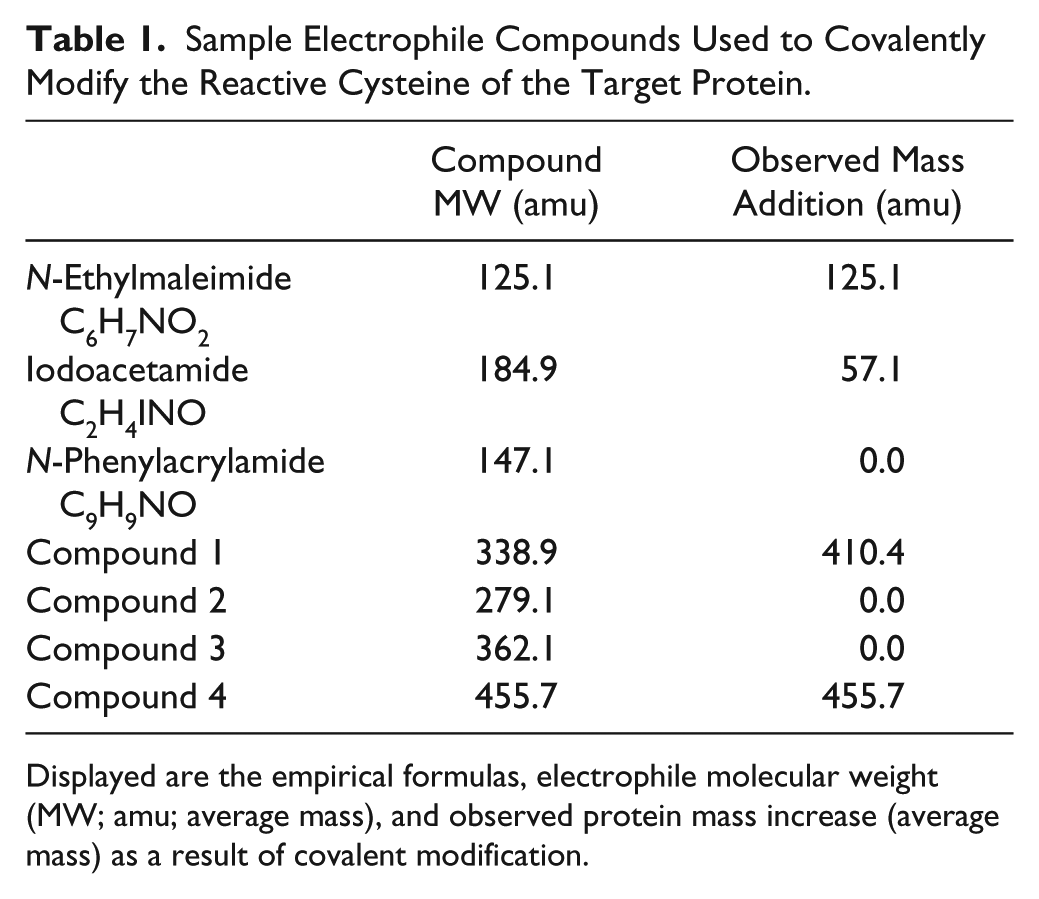
Displayed are the empirical formulas, electrophile molecular weight (MW; amu; average mass), and observed protein mass increase (average mass) as a result of covalent modification.
(
The limit of detection (LOD) and the dynamic range of the RapidFire MS system for intact protein detection were also assessed.
Importantly, the C4-SPE cartridge used in this study appears to be a very effective and versatile stationary phase for the analysis and extraction of intact proteins of various sizes and in various buffers. For example, we demonstrated the effective C4-SPE extraction of a 19.5 kDa protein (
Fig. 1a–f
) from 25 mM Tris, pH 7.5, buffer.
A key element of the workflow is the automated identification and quantitation of the expected masses of covalent protein-inhibitor adducts using a custom Pipeline Pilot (BIOVIA) routine that obviates the need to manually inspect each individual spectra and allows the capture of numerical information about the extent of protein-inhibitor adduct formation with a particular protein at a particular concentration and time.
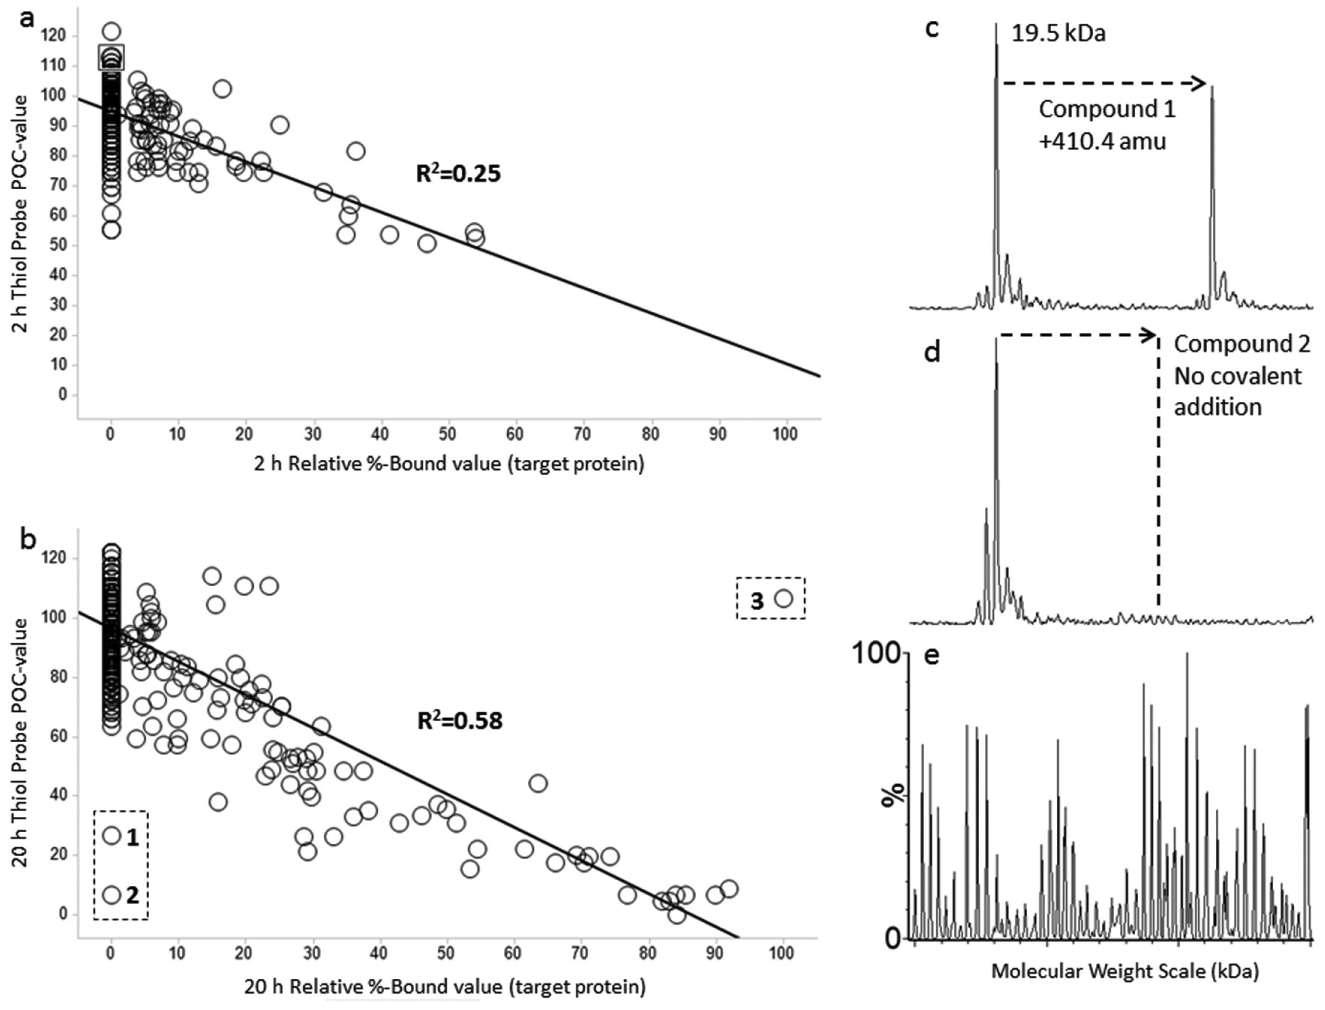
Acrylamides are electrophilic moieties commonly employed as covalent irreversible inhibitors. The intrinsic reactivity of acrylamides with thiol nucleophiles, such as glutathione, can vary up to three orders of magnitude, depending on the activating or deactivating nature of substitutions in the vicinity of the acrylamide.20–23 Highly activated acrylamides are likely to have significant off-target reactivity with glutathione or nontarget proteins with nucleophilic residues, especially cysteine. Thiol-reactive probes have been used to screen libraries of compounds for reaction with or binding to target proteins containing reactive cysteine residues. 3 In such assays, the extent of reaction between the cysteine residue of the protein and a test compound is assessed by addition of a highly reactive, cysteine-specific fluorescent probe. We utilized 3-(7-hydroxy-2-oxo-2H-chromen-3-ylcarbamoyl)acrylic acid methyl ester (Thiol Fluorescent Probe IV; Scheme 2 ), a coumarin acrylate derivative, in such an assay of a screen of approximately 1000 acrylamides, including the corresponding acetamides of several acrylamides (no carbon–carbon double bond, which therefore cannot alkylate via a Michael Addition with a nucleophile), in parallel with a Rapidfire MS-based screen to identify hits and assess false positive and false negative values in the two aforementioned orthogonal assays. The addition of an early time point (2 h, Fig. 2a ) has twofold utility: (1) it indicates compounds that are highly reactive and exhibit covalent addition even at 2 h, compared to those whose addition is only observed at the 20 h time point ( Fig. 2b ), and (2) it indicates that the mass additions observed at the 20 h time point, but not at the 2 h time point, are time dependent and likely covalent versus nonspecific interactions between the compound and the target protein. The thiol fluorescent probe assay was validated against the target protein by using known thiol alkylators such as iodoacetamide and N-ethylmaleimide ( Table 1 ) and also compounds known not to bind to our target of interest, such as N-phenylacylamide ( Table 1 ). Significantly, acetamides lacking a reactive group (see above and data not shown), including the analogous acetamides of even highly activated acrylamides, showed no covalent addition.
(
Covalent binding to the target protein in the mass spectrometric–based assay is expressed in two ways: Average % Bound (
The 2 and 20 h Relative % Bound correlation of the results of these parallel screens is shown in Figure 2a , b . In general, there is good correlation between hits from the thiol-reactive probe-based assay and the mass spectrometric–based assay. As expected, most of these modestly reactive compounds exhibit more extensive reaction with the target protein at 20 h versus at 2 h. The majority of compounds react sufficiently slowly that little reaction is observed even at 20 h. However, a number of selected compounds exhibit significant reaction with the target at both 2 and 20 h, indicating relatively rapid reaction due to either high intrinsic reactivity or specific interaction with the target protein.
Two outlier compounds showing no apparent covalent modification were detectable by MS despite significant inhibition of the thiol-reactive probe signal ( Fig. 2b , lower left quadrant of the plots annotated as 1 and 2). By examining the MS data in more detail, we can determine whether these hits are either thiol-reactive probe false positives or mass spectrometric false negatives. Compound 1 ( Table 1 , Fig. 2b , c ) should result in the expected covalent mass addition of 338.9 amu to the target protein. The thiol probe data suggest that covalent binding has occurred. However, the observed mass addition is 410.4 amu ( Table 1 , Fig. 2c ). In this case, the automated Pipeline Pilot routine is specifically looking for the expected mass increase of the compound (338.9 amu), and when this mass increase is not detected, a value of zero % Bound is calculated. The % Bound value is 40% when considering an observed mass addition of 410.4 amu. The chemical entity causing the alkylation was determined to be a highly reactive low-level by-product of the synthesis of Compound 1. Compound 2 ( Table 1 , Fig. 2d ) shows no detectable covalent addition (absence of +279.1 amu addition) by MS. In this instance, it is speculated that this is either a thiol-reactive probe false positive result caused by fluorescence interference in the thiol probe assay or a MS false negative caused by the absence of Compound 2 in the RF-MS plate due to a robotic sample handling error.
Due to lack of any chromatographic separation between the unreacted acrylamide and the target protein, the excess levels of the acrylamide (10 µM) in comparison to the target protein (2 µM) could potentially cause ionization suppression of the target protein. This can result in misleadingly high Relative % Bound values if the POC value is low, as shown in
Figure 2b
(Compound 3; upper right quadrant), where a single compound apparently produces such an effect. Compound 3 (
Table 1
,
Fig. 2e
) results in an uninterpretable deconvoluted mass spectrum. The reason for this is clear when the C4-SPE elution profile and unprocessed MS data are examined.
Extensive reaction between an electrophile and a cysteine-containing protein may reflect an electrophile’s intrinsic reactivity with nucleophilic residues, with which more reactive electrophiles react more quickly and likely more promiscuously. In contrast, a more promising electrophilic hit should exhibit significant selectivity for the on-target protein compared to an off-target protein containing a cysteine of similar solvent exposure and pKa. Presumably, faster reaction with such selective hits is driven by favorable noncovalent binding interactions in addition to the intrinsic reactivity of the electrophile. Reaction with off-target proteins such as HSA can aid in the differentiation of promiscuous reactive hits from selective hits (
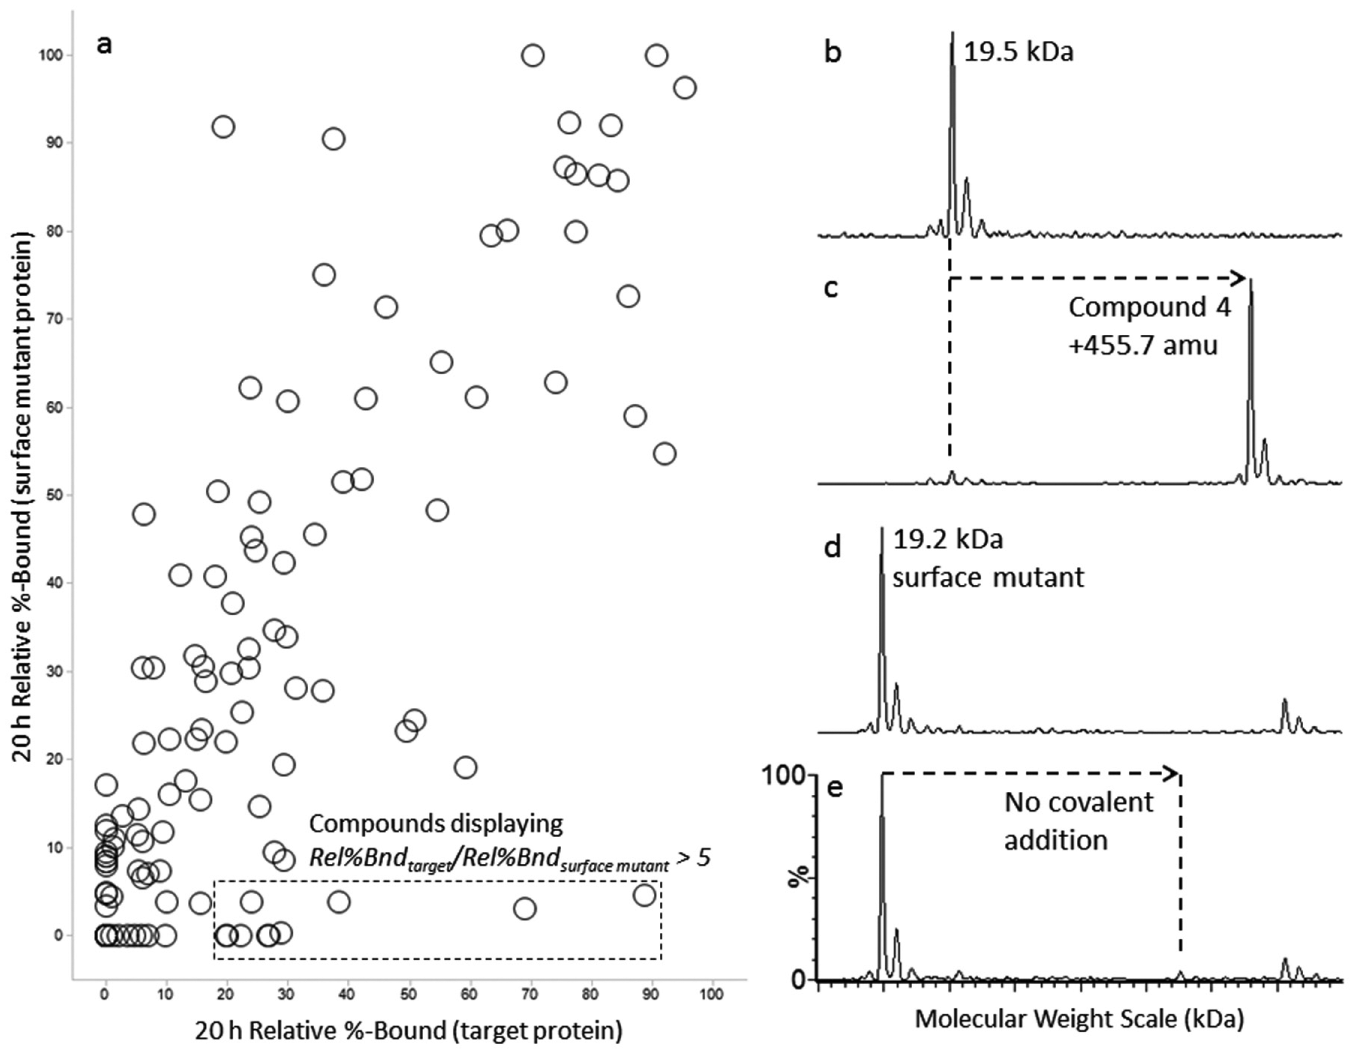
(a) Selectivity of the electrophiles (10 µM, 20 h) indicated by extent of reaction (Rel % Bound) with target protein vs. surface mutant protein. (b) Deconvoluted MS spectra of the unmodified target protein. (c) Deconvoluted MS spectra of the target protein incubated with Compound 4. (d) Deconvoluted MS spectrum of the surface mutant protein. (e) Deconvoluted MS spectrum of the surface mutant incubated with Compound 4. All data points are derived from a single mass spectrometric measurement (n = 1). Compounds displaying a Rel%Bndtarget/Rel%Bndsurface mutant of above fivefold are highlighted.
In conclusion, we have implemented an Agilent RapidFire MS system to rapidly quantitate the extent of covalent protein-inhibitor adduct formation by MS and applied this to several proteins ranging in molecular weight. Together with a novel informatics workflow that enables automated processing of expected covalent mass additions to the protein of interest, we have used this approach to screen large numbers of potential covalent inhibitors. The RapidFire MS system can yield mass measurements to an accuracy of 0.5 amu, based on the expected molecular weight for a 19.5 kDa protein construct. The precision of these measurements displayed a standard deviation of ±0.02 amu. The MS system also proved very sensitive, with a LOD of 0.04 µg of target protein loaded onto the C4-SPE cartridge. The C4-SPE cartridge proved very versatile in its ability to extract and desalt proteins of varying size (19.2–66.4 kDa) in buffers of varying salt concentrations (up to 500 mM NaCl tested). A specific data processing workflow was also developed and implemented through the MassHunter (Agilent) software, which allowed for the production of a concise data result file for each specific sample injection that contained the deconvoluted molecular weight and intensity of the modified and unmodified protein. Furthermore, a custom script was implemented in Pipeline Pilot that enables calculation of the POC and % Bound values for each injection result file. The implementation of this high-throughput RapidFire MS system, in combination with the processing workflows and custom data extraction scripts, enables a user to screen large chemical libraries with minimal manual intervention. Screening via a thiol-reactive probe assay in parallel allows identification of false positive and false negative results in these two orthogonal assays. This HTS-MS approach should be generally applicable to the unambiguous detection and quantitation of covalent inhibitor modification of proteins in a high-throughput fashion. It could be easily envisioned in future applications and iterations of this technology that replacing the MS-ToF system with an ion mobility ToF instrument
25
would enable the gas-phase separation of small, singly charged species from the larger, multiply charged target protein. This would aid in reducing misleading MS results such as those indicated in
Footnotes
Acknowledgements
The authors gratefully acknowledge Carlo van Staden (Amgen, Discovery Technologies) for his help and advice and Trace Tsuruda (Amgen, Biologics) for purifying the 19.2 and 19.5 kDa protein constructs. The authors also wish to thank Andy Gieschen (Agilent Technologies), David Presser (Agilent Technologies), Patty Sun (Agilent Technologies), and William Lamarr (Agilent Technologies) for their continued support. The authors also wish to thank Chris Mohr (Amgen) and Brad Jordan (Amgen) for the X-ray crystallographic and NMR support, respectively. Chris Tegley (Amgen), Brian Lanman (Amgen), Anthony Reed (Amgen), and Kristin Andrews (Amgen) are acknowledged for their medicinal chemistry support.
Declaration of Conflicting Interests
The authors declared no potential conflicts of interest with respect to the research, authorship, and/or publication of this article.
Funding
The authors received no financial support for the research, authorship, and/or publication of this article.
References
Supplementary Material
Please find the following supplemental material available below.
For Open Access articles published under a Creative Commons License, all supplemental material carries the same license as the article it is associated with.
For non-Open Access articles published, all supplemental material carries a non-exclusive license, and permission requests for re-use of supplemental material or any part of supplemental material shall be sent directly to the copyright owner as specified in the copyright notice associated with the article.