
Abstract
The fatty acid synthase (FAS) enzyme in mammalian cells is a large multidomain protein responsible for de novo synthesis of fatty acids. The steps catalyzed by FAS involve the condensation of acetyl-CoA and malonyl-CoA moieties in the presence of NADPH until palmitate is formed. Inhibition of FAS causes an accumulation of intracellular malonyl-CoA, as this metabolite is essentially committed to fatty acid synthesis once formed. Detection of intracellular metabolites for screening can be problematic due to a lack of appropriate tools, but here we describe a targeted liquid chromatography–mass spectroscopy (LCMS) method to directly measure endogenous levels of malonyl-CoA to drive a drug development structure–activity relationship (SAR) screening cascade. Our process involves preparation of samples at 96-well scale, normalization postpermeabilization via use of a whole-well imaging platform, and the LCMS detection methodology. The assay is amenable to multiplexing cellular endpoints, has a typical Z′ of >0.6, and has high reproducibility of EC50 values.
Introduction
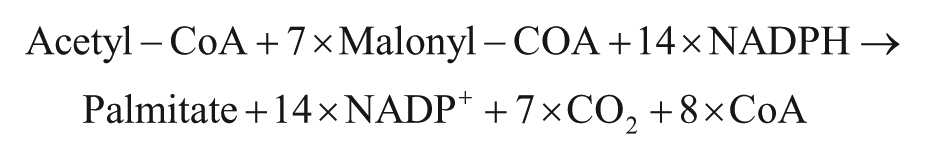
Fatty acid synthase (FAS; EC 2.3.1.85) is responsible for the de novo synthesis of fatty acids via condensation of acetyl-CoA and malonyl-CoA precursors predominantly leading to the generation of palmitate. 1
Fatty acid synthesis is an important part of the lipogenesis process, which together with glycolysis provides fats from blood sugar in living organisms. FAS has been linked to a number of key roles in a variety of different disease settings, including insulin-resistant conditions such as type 2 diabetes, obesity and associated cardiovasculature disease, 2 adult neurogenesis, 3 and human carcinomas, where it has been shown that FAS is overexpressed and is associated with poor prognosis in a variety of cancers. 4 These cancers include breast, prostrate, and lung, with the elevated levels of FAS becoming increasingly pronounced during tumor progression. 5 It has not yet been fully determined why FAS upregulation is beneficial to cancer cells. Studies have shown that there is no difference in utilization of endogenous fatty acids compared to exogenous sources, endogenous fatty acids are present in excess of the quantity required for the cancer cell, and they are not critical to support increased membrane biosynthesis. 6 Despite this, numerous studies have indicated that blocking FAS is cytostatic and indeed cytotoxic to cancerous cells,5,7 leading to a reduction in cellular proliferation and apoptosis induction.7,8 In addition, this inhibition causes a rapid accumulation of intracellular malonyl-CoA, as this metabolite is essentially committed to fatty acid synthesis once formed.9,10
Current literature surrounding the screening of compounds looking for FAS inhibitors mainly focuses on the use of proliferation, or apoptosis assays,11,12 which, while they can address the throughput required for screening, the generic nature of the endpoints means that compounds’ specific FAS activity is not determined. In order to ensure the medicinal chemistry campaign remains on target for FAS, a more mode-of-action-type assay is required within an assay cascade at high enough throughput to ensure FAS is still targeted as expected and potency is not being driven by off-targets, which could cause growth inhibition, or apoptosis.
Detection of intracellular metabolites for medium-throughput screening can be problematic due to a lack of appropriate tools to allow for direct measurements. Liquid chromatography–mass spectrometry (LCMS) is now sensitive enough to measure intracellular metabolites, but has not been demonstrably suitable for routine, higher-throughput compound screening purposes. Mass spectrometry methodologies to quantitate endogenous malonyl-CoA levels already exist;9,13,14 however, they are generally targeted to specific tissue/tumor preparations, or are carried out in 6- to 24-well plates and, as such, do not address the throughout requirement of true medicinal chemistry compound screening. Additionally, their sample preparation is manually intensive, requiring chloroform extractions or sample drying/reconstitution, for example, and as a result is unsuited to automated preparation. Currently published methods also do not address the issue of normalizing sample quantitation based on cell number as part of the process, a crucial factor in cellular screening, as disruptions to cell numbers from plating issues, plate edge effects, or compound toxicity will all affect a compound’s calculated EC50 unless accounted for.
To enable on-target screening of FAS inhibitors, we determined that monitoring the effect on malonyl-CoA after compound treatment in a cell number normalized assay would be a suitable, direct method. We have developed an optimized LCMS assay designed to directly measure endogenous malonyl-CoA, NADPH, and acetyl-CoA levels from cell extracts in a semiautomated 96-well format to drive a drug candidate screening cascade. The entire assay time per sample (including column reequilibration) is 2.7 min, allowing for a 96-well plate to be run in <4.5 h. This allows for data capture of ~40 compounds in a 9-point dose–response assay in less than 24 h. The resultant medium-throughput assay is amenable to multiplexing detection of multiple cellular endpoints (i.e., malonyl-CoA, NADPH, and acetyl-CoA), has a typical Z′ value of >0.6, and has high reproducibility of EC50 values.
Materials and Methods
Cell Culture
A549 cells (ATCC) were maintained in RPMI-1640 phenol red free medium (Sigma, St. Louis, MO) supplemented with 10% (v/v) fetal bovine serum (FBS) and 2 mM
Cell Sample Preparation
A549 cells were seeded at 3 × 10⁴ cells/well in black 96-well plates with a flat, clear bottom (Costar #3904, Corning, Lowell, MA) in 100 µL assay media. The cells were incubated for 24 h prior to dosing with compounds over a 9-point dose–response range, 30 µM to 0.45 nM, via a Labcyte Echo 555 Acoustic Dispenser (Sunnyvale, CA). The final DMSO concentration was maintained in the media at 0.3% (v/v) in all wells. Cells were incubated with compound for 3 h prior to media aspiration with a Bio-Tek 450CW plate washer (Winooski, VT). Chilled protein crash/fix reagent (150 µL/well 40% [v/v] methanol, 40% [v/v] acetronitrile, 20% [v/v] water) (LCMS grade, Sigma) was added and plates incubated for 10 min at −20 °C. Aliquots (120 µL/well) were transferred to Waters Acquity 350 µL U-bottomed collection plates with a FluidX Personal Pipettor (San Bruno, CA) and clarified by centrifugation at 4300 × g at 4 °C for 20 min. After clarification, 100 µL of supernatant was transferred to a new Acquity 350 µL U-bottomed collection plate using the Personal Pipettor, sealed and stored at −20 °C.
Hoechst 33342 in PBS (50 µL/well of 1 µg/mL) was added to the original cell plate once the initial 120 µL was removed. These plates were then sealed with black plate seals and stored at 4 °C prior to reading the cell count on a TTP Labtech Acumen Explorer ex3 high-content reader (Cambridge, MA).
Liquid Chromatography–Mass Spectrometry
The clarified supernatant samples were loaded to a Waters Xbridge Amide 3.5 µm, 2.1 × 50 mm column at 40 °C using a Waters Acquity (2.2.1) UPLC running a 2.7 min gradient (95%–70% A in 0.25 min to 60% A in 0.75 min to 25% A in 0.35 min, held at 25% A for 0.5 min to 95% A in 0.1 min and held at 95% A for 1 min). Buffer A was 10 mM ammonium formate (mass spectrometry grade, Sigma) in acetronitrile, pH 6.6. Buffer B was 10 mM ammonium formate in water (MilliQ grade > 18.2 MΩ, Millipore, Billerica, MA), pH 6.6. A constant flow rate of 0.4 mL/min was used to inject a 10 µL sample into a Thermo LTQ Velos Ion Trap mass spectrometer in negative mode via an electrospray ionization (ESI) spray (ivoltage −3.5 kV, heater temperature 120 °C, capillary temperature 270 °C, sheath gas 30 [arbitrary units], auxiliary gas 20 [arbitrary units], sweep gas 0 [arbitrary units], S lens radio frequency [RF] level 68%). The MSMS analysis was carried out on malonyl-CoA (852 m/z [M-H]–, main ion 808 m/z, collision energy [CE] 32 −V, iso width 1), NAPDH (744.3 m/z [M-H]–, main ion 620 m/z, CE 26 −V, iso width 6), acetyl-CoA (808.3 m/z [M-H]–, main ion 460.9 m/z, CE 30 −V, iso width 2), and 13Cx3-labeled malonyl-CoA (855 m/z [M-H]–, main ion 810 m/z, CE 24 −V, iso width 1) as an internal standard (Sigma 655759).
Image Analysis
The Hoechst-stained cell plates were analyzed on an Acumen Explorer eX3 to capture the images of whole-well staining using the 405 nm laser (6 mW, 425 V) and 420–490 nm emission filter. Population Manager settings were used to capture all stained objects with a width and depth between 8 and 100 µm (cell object population), with single-cell objects being classified as having an area of between 100 and 450 µm 2 . The average cell count per well was calculated in the software’s Population Characteristics by dividing the total cell object population’s fluorescence by the average single-cell fluorescence.
Data Analysis
LCMS peaks were integrated using Xcalibur version 2.1.0 build 1139 and normalized using the Acumen-determined whole-well cell counts. EC50 curves were plotted using Origin 7.5 SR6 v7.5885.
Results and Discussion
Small-molecule inhibitors of FAS could be an important opportunity for establishing a therapy in a number of different disease areas.2,3 Here we describe an assay to detect the modulation of endogenous levels of malonyl-CoA within a human lung carcinoma–derived cell line as part of a screening cascade to drive medicinal chemistry. The cell line chosen for the assay (A549) was selected out of a number of possibilities (data not shown) as being disease relevant and suitable to grow in vivo for subsequent studies.
Determination of LOD/LLOQ and Assay Parameters
In order to determine the basic parameters for measurement on the LCMS, the optimized malonyl-CoA, acetyl-CoA, and NADPH m/z ions were determined using pure standards. A malonyl-CoA standard curve ( Fig. 1A ) was prepared to determine the linear range of detection using the assay buffers, and from that the limit of detection (LOD)/lower limit of quantification (LLOQ) were determined. To ensure the limits of detection were not reached in the cell samples, samples were prepared containing 1000–50,000 cells/well (with early or late 13C malonyl-CoA internal standard [iSTD] spiking) to determine the levels of malonyl-CoA present in the samples. These measurements, along with the confluence data measured on an Essen IncuCyte ( Fig. 1B ), were used to determine the appropriate number of cells per well (30,000) for cell seeding to ensure the maximum and the minimum control wells in the assay fell within the linear detectable range of the LCMS. Similar LODs and LLOQs were also determined for acetyl-CoA and NADPH (data not shown). Figure 1C shows a typical LCMS trace for all metabolites from a single-cell sample.
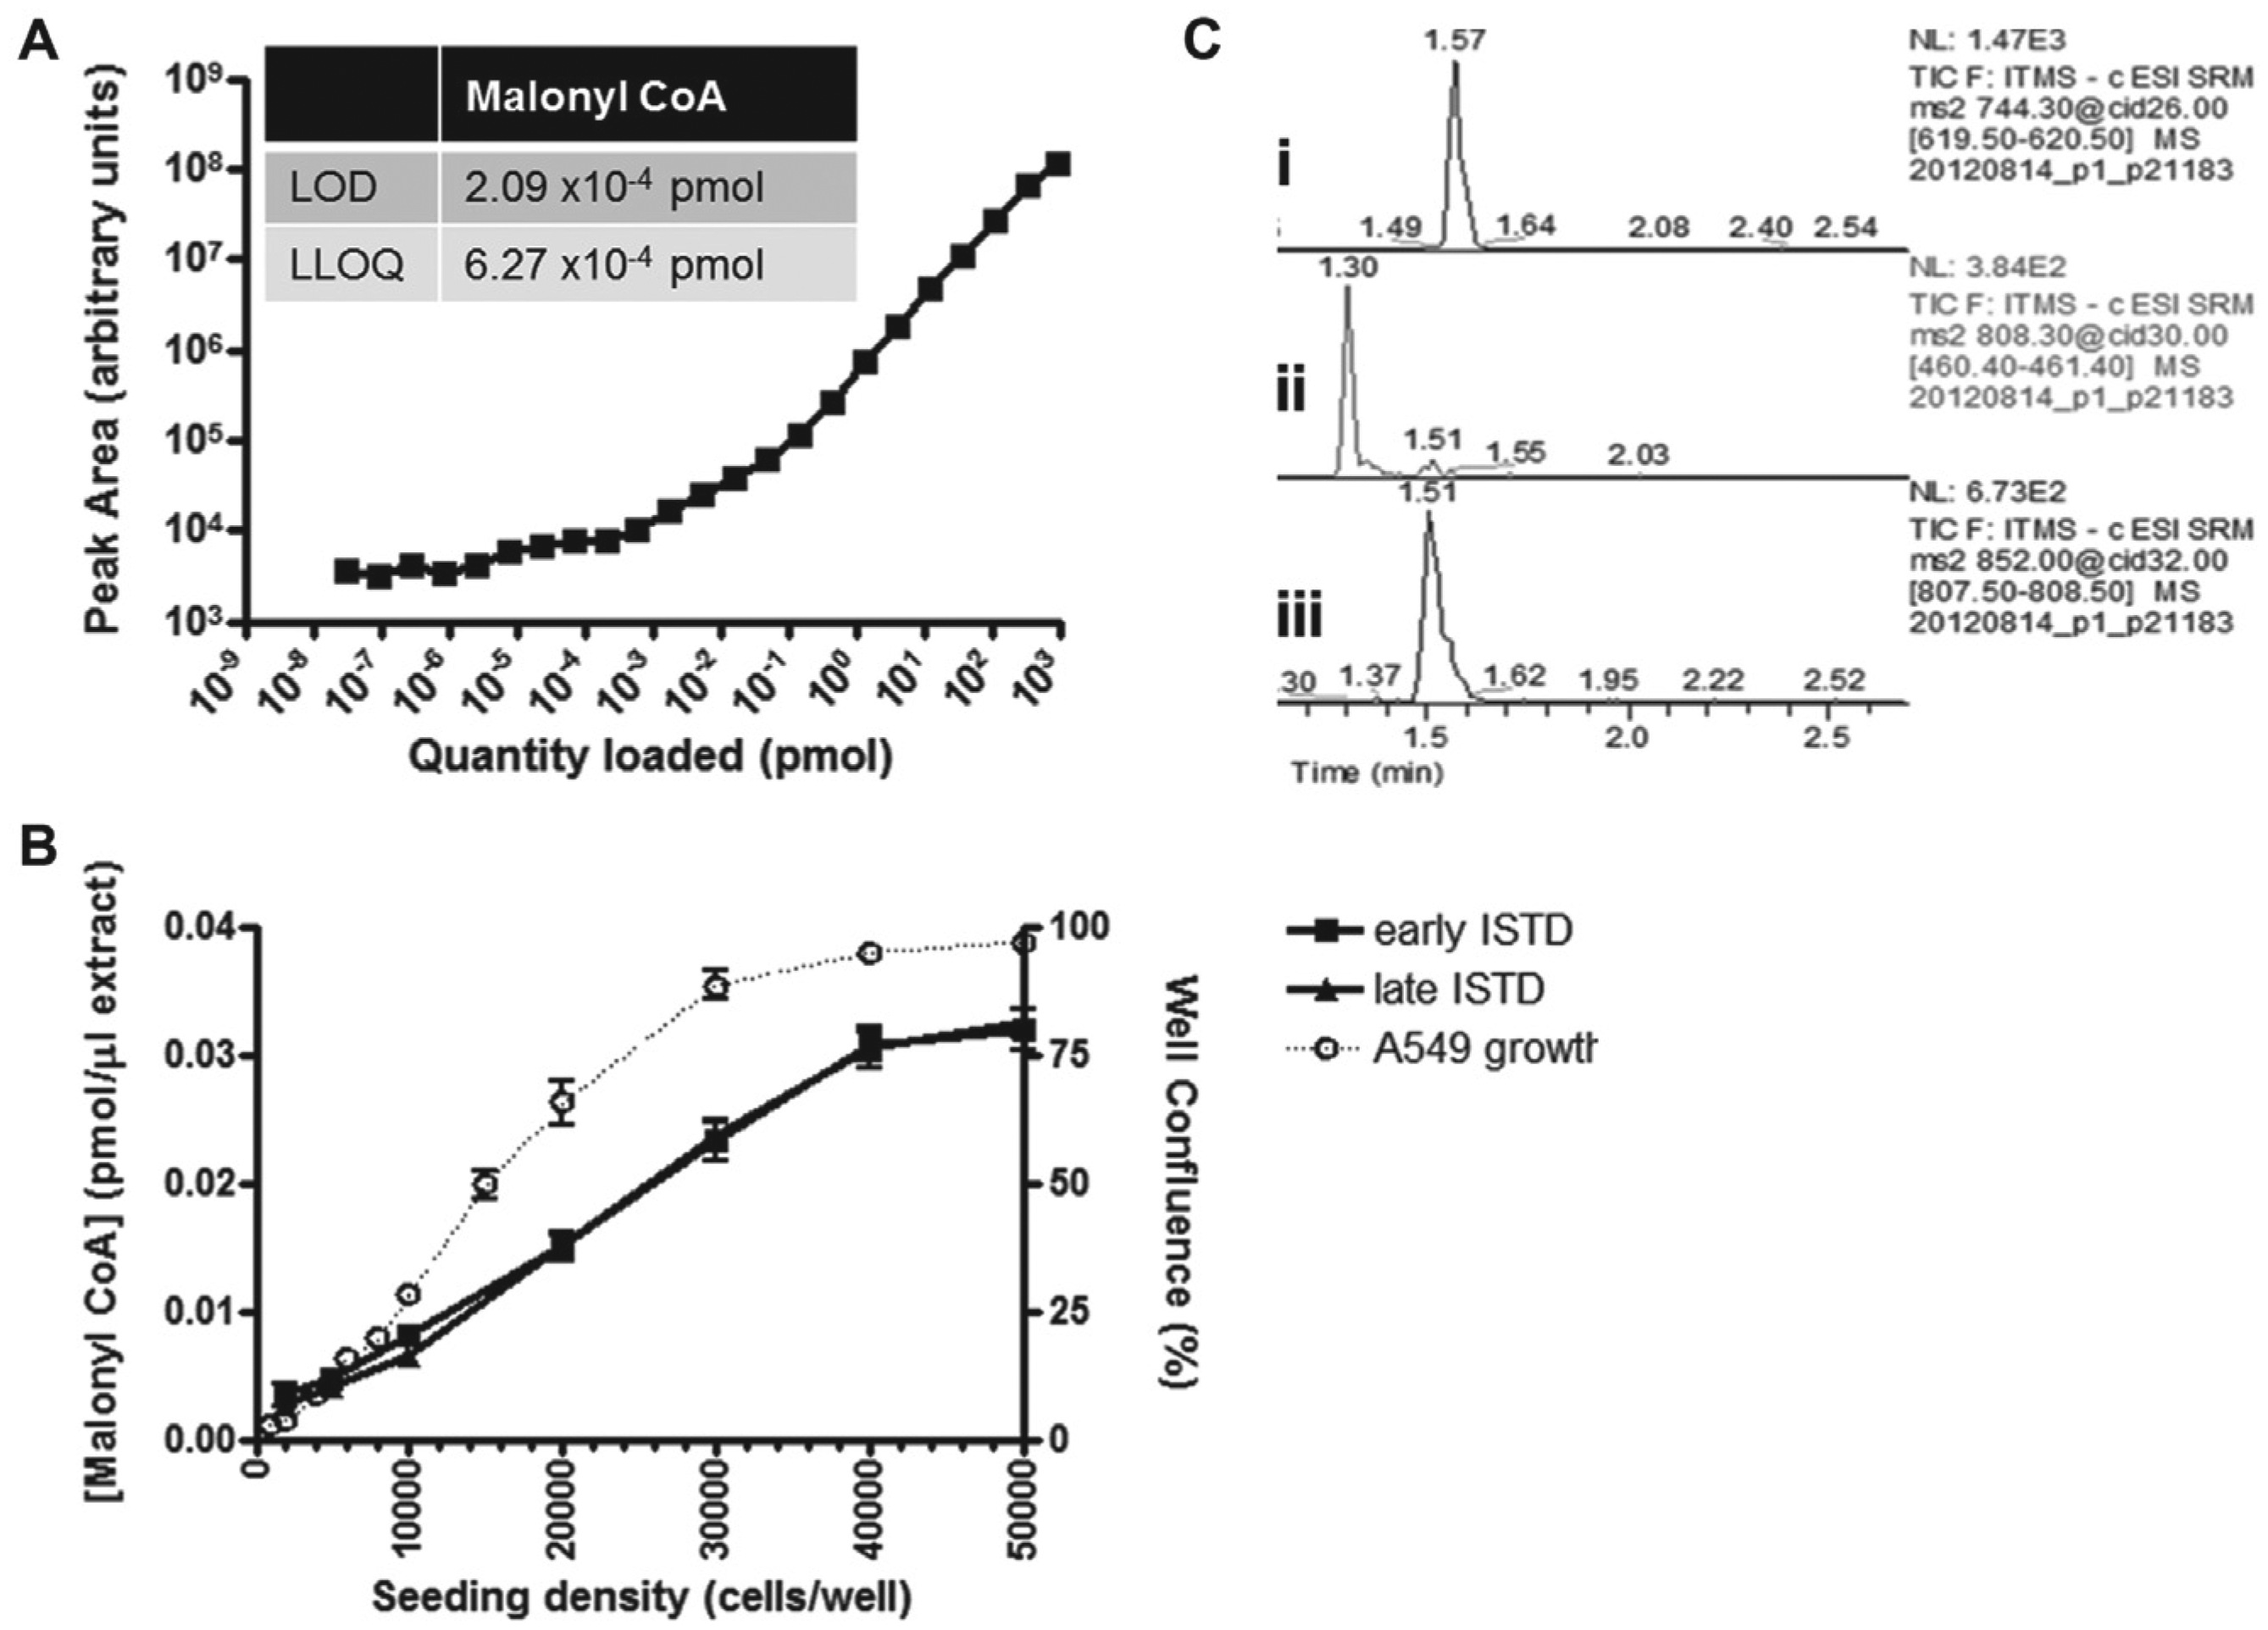
Defining assay limits and parameters. (
Development and Assay Validation
In order to further establish the inherent variability in the assay, a number of further tests were carried out to understand where variability may be introduced. The LCMS system was tested for reproducibility of the injection/ionization process by running multiple injections of the Sigma malonyl-CoA standard and 13C-labeled malonyl-CoA standard ( Table 1A ), which demonstrated a %RSD (percent relative standard deviation) of less than 5.
Assay Validation Data.
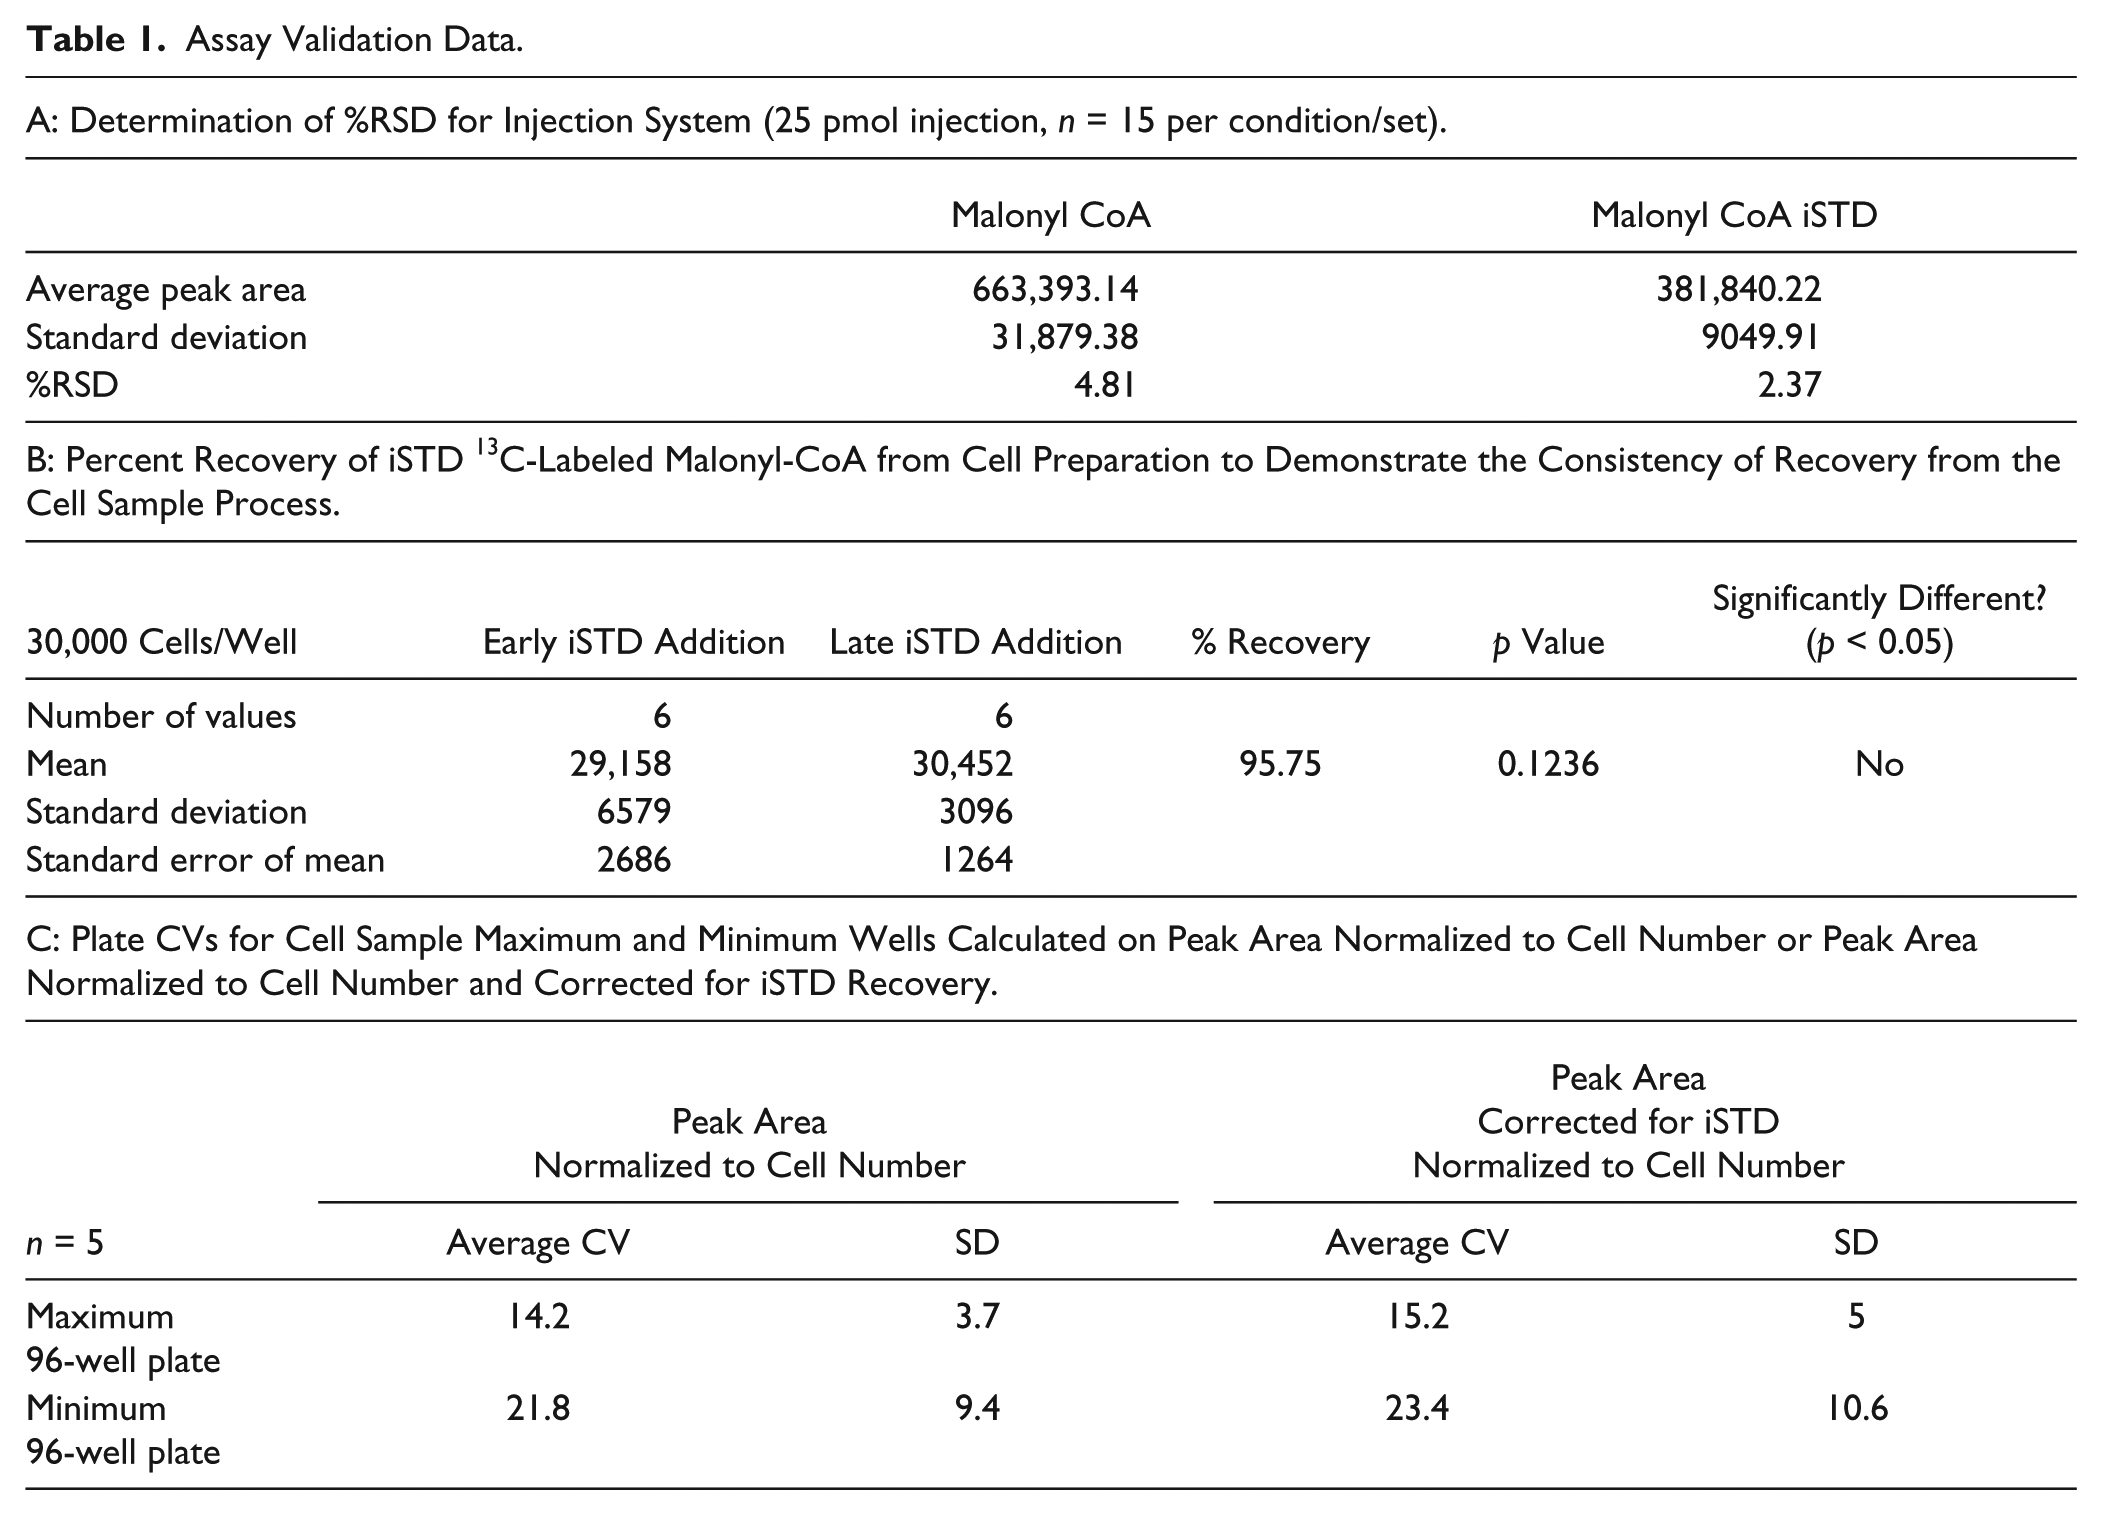
The variability of the recovery and detection of malonyl-CoA from the cell samples was evaluated by spiking the 13C-labeled malonyl-CoA either into the cell samples at the beginning of the cell preparation process in the crash/fix reagent (40% [v/v] methanol, 40% [v/v] acetronitrile, 20% [v/v] water) added to the cells after media aspiration (early iSTD) or into the extracted samples just prior to injection on the LC (late iSTD). Table 1B shows that overall recovery of the malonyl CoA standard was over 95% and that there was no significant loss of malonyl-CoA in the samples during the cell preparation process, as the recovery value for the iSTD shows no significant difference, irrespective of the timing of the spike with 13C-labeled malonyl-CoA.
Finally, robustness and variability of malonyl-CoA recovered from prepared cell samples was tested by looking at the coefficient of variation (CV) across multiple 96-well plates containing early addition of 13C-labeled iSTD, measuring the minimum levels (endogenous levels) or maximum levels (treated with 10 µM control compound) of malonyl-CoA ( Table 1C ). CVs and standard deviations were calculated to best determine which analysis method was the most suitable for screening, comparing the peak area normalized to the cell number read with the peak area normalized to the cell number read and corrected for the 13C-labeled iSTD recovery. For the routine assay, it was decided that a cell count methodology should be established, with the peak area being normalized to the cell number to allow for any cell number variation in the process that can occur from cell plating dispensing issues or compound toxicity, for example, which could skew the levels of malonyl-CoA present, but that correction with the 13C-labeled iSTD was unnecessary. A CV of 14.2% for the maximum signal from cell lysates normalized in this manner, reflecting the multistep, cell sample preparation, inherently allows some variability to occur.
Once the basic assay parameters had been fixed, a subset of in-house compounds with a variety of potencies were tested on two separate occasions with fresh samples and randomized dosing order to assess the assay performance under screening conditions. The correlation plot shown in Figure 2 demonstrates the reproducibility of the screening conditions on two separate occasions with randomized plate maps. Typical malonyl-CoA EC50 plots generated by the assay with compounds of various potencies are demonstrated in Figure 3A . Figure 3B,C shows typical plots of acetyl-CoA and NADPH from the same cell samples.
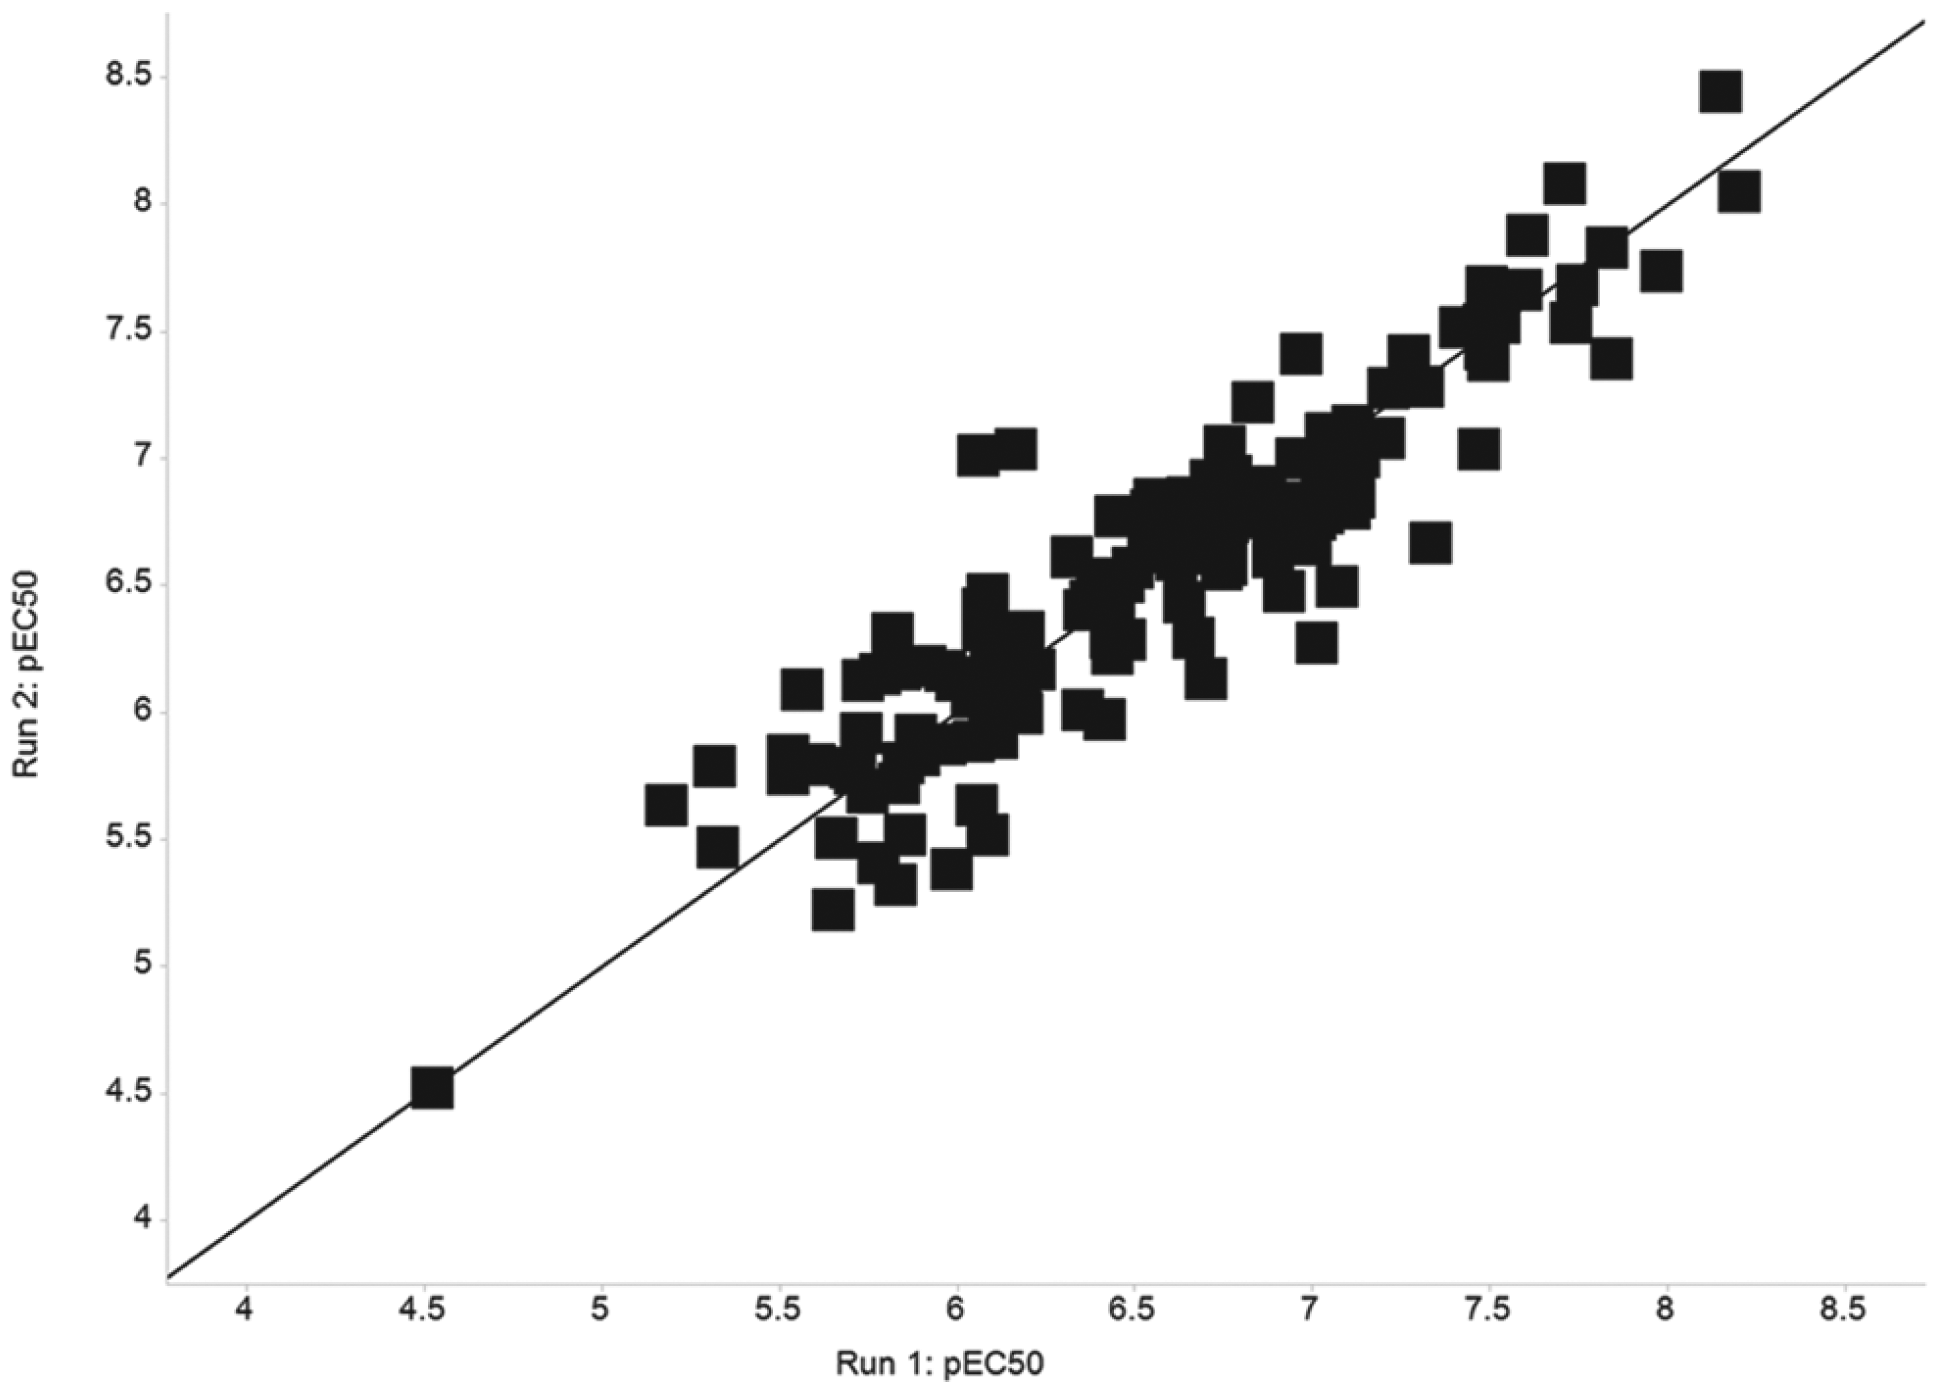
Correlation of pEC50 values generated for a validation set of 136 compounds. pEC50 data based on malonyl-CoA modulation were generated on two separate occasions with randomized plate maps.
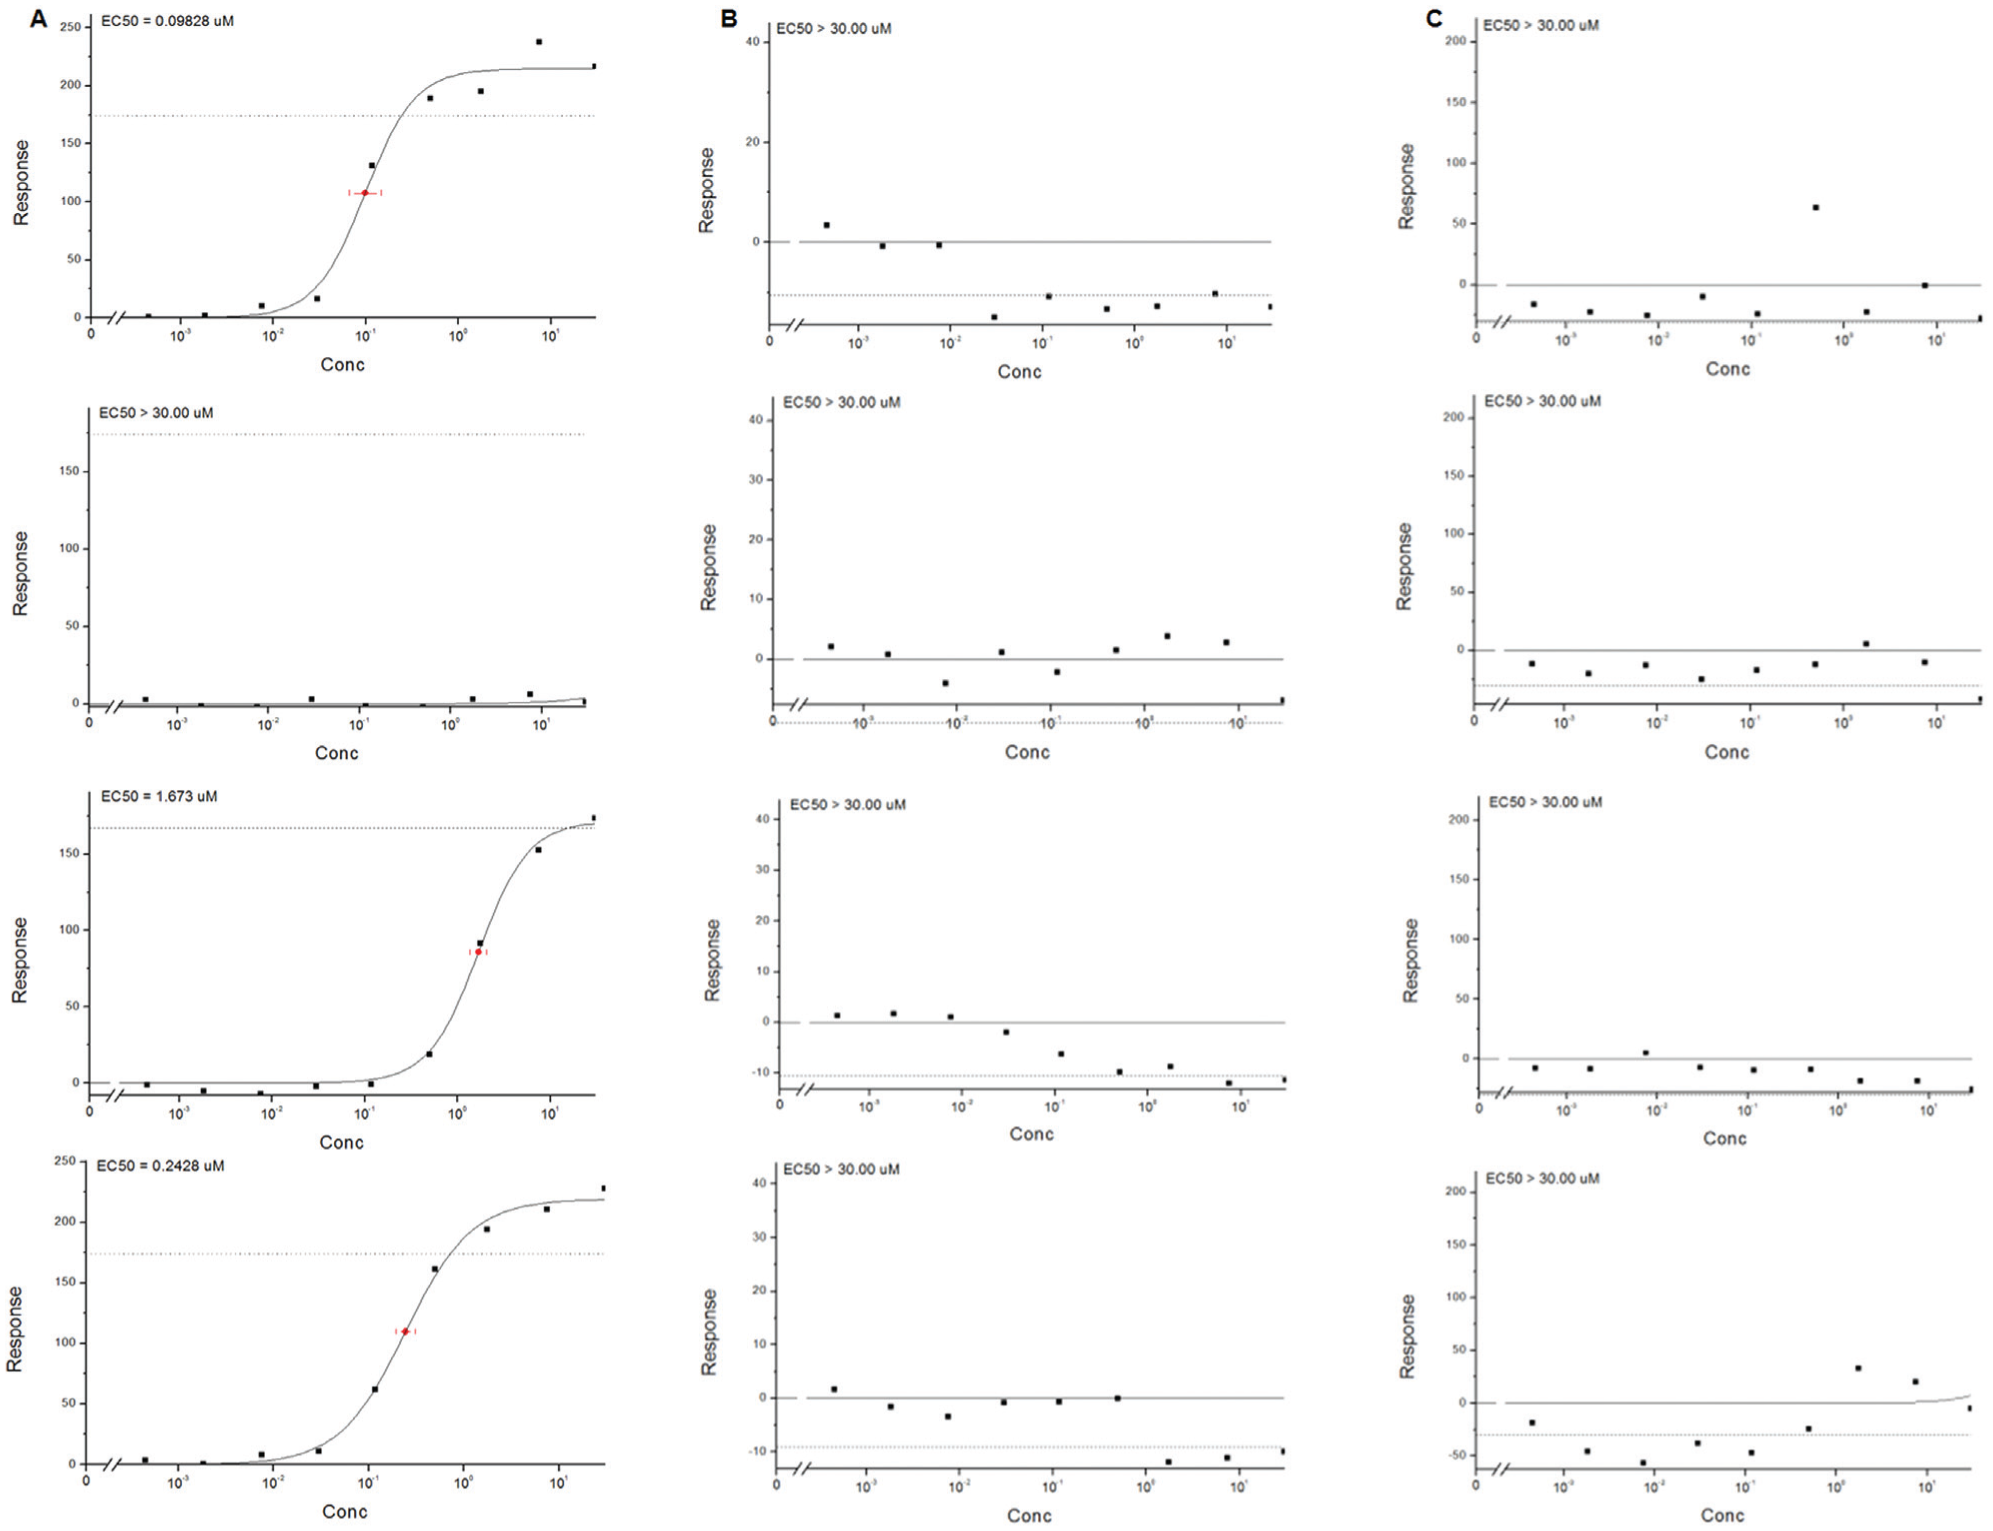
Typical dose–response plots of compounds displaying varying potencies. Dose–response plots based on modulation of (
Orlistat, an approved Food and Drug Administration (FDA) drug for the treatment of obesity and a known FAS inhibitor, has been shown to have an EC50 between 0.1 and 1 µM.12,15 These values were determined by scintillation counting of extracted lipids based on 14C malonyl-CoA incorporation in HUVEC and MDA-MB-435 cells. The EC50 determined in our malonyl-CoA endpoint assay was in line with literature precedent at 1.8 µM (data not shown).
Though the method was able to multiplex multiple-metabolite detection, no effect on NADPH or acetyl-CoA was seen with any of the compounds tested. We hypothesize that due to the fact that NADPH and acetyl-CoA are used in various cellular processes, their modulation by FAS inhibition is undetectable given the constant flux of these metabolites in a variety of pathways.
In summary, we have developed a robust cell screening assay to detect endogenous modulation of malonyl-CoA levels capable of driving a medicinal chemistry campaign against FAS. In principle, the LCMS methodology described is also capable of multiplexing endpoint detection from the cell lysate.
Footnotes
Acknowledgements
We wish to acknowledge Ian Sinclair’s help in preparing the manuscript. Tom Dunkley and Filippos Michopoulos provided support in setting the LCMS methodologies. Lastly, Brian Middleton provided advice for the statistical analyses.
Declaration of Conflicting Interests
The authors declared no potential conflicts of interest with respect to the research, authorship, and/or publication of this article.
Funding
The authors received no financial support for the research, authorship, and/or publication of this article.
References
Supplementary Material
Please find the following supplemental material available below.
For Open Access articles published under a Creative Commons License, all supplemental material carries the same license as the article it is associated with.
For non-Open Access articles published, all supplemental material carries a non-exclusive license, and permission requests for re-use of supplemental material or any part of supplemental material shall be sent directly to the copyright owner as specified in the copyright notice associated with the article.