
Abstract
Thrombin and factor Xa (FXa) are critical enzymes of the blood coagulation cascade and are excellent targets of anticoagulant agents. Natural sources present an array of anticoagulants that can be developed as antithrombotic drugs. High-resolution, online screening techniques have been developed for the identification of drug leads from complex mixtures. In this study, we have developed and optimized a microfluidic online screening technique coupled to nano–liquid chromatography (LC) and in parallel with a mass spectrometer for the identification of thrombin and FXa inhibitors in mixtures. Inhibitors eluting from the nano-LC were split postcolumn in a 1:1 ratio; half was fed into a mass spectrometer (where its mass is detected), and the other half was fed into a microfluidic chip (which acts as a microreactor for the online assays). With our platform, thrombin and FXa inhibitors were detected in the assay in parallel with their mass identification. These methods are suitable for the identification of inhibitors from sample amounts as low as sub-microliter volumes.
Introduction
Hemostasis is the normal physiological process that prevents blood loss followed by vascular injury. It is a complex cascade in which zymogens are activated by controlled proteolysis in a sequential manner. 1 Physiological formation of clots (thrombus) is critical for hemostasis and preservation of blood volume, while abnormal, pathologic thrombosis is related to cardiovascular and cerebrovascular diseases, myocardial infarction, and stroke. 2 Therefore, inhibition of abnormal thrombus formation is important in the prevention and treatment of such disorders. Thrombin and factor Xa (FXa) are two key enzymes of the blood coagulation cascade, and inhibitors targeting these two enzymes have excellent potential as potent anticoagulant therapeutics. 3 In search for novel anticoagulants with superior benefits, numerous exogenous molecules have been purified and characterized from natural sources. 4
High-resolution screening (HRS) techniques in which separation methods are coupled to bioassays that eliminate traditional, labor-intensive purification and screening tasks, as well as facilitate rapid identification of active compounds from complex mixtures, are becoming increasingly popular.5,6 These HRS techniques have also been adapted for the identification of enzyme inhibitors, where a liquid chromatography (LC)–based separation of a complex mixture is coupled to an absorbance or fluorescence-based bioassay. 7 Recent advancements have fueled the hyphenation of separation techniques with mass spectrometry for accurate identification of active molecules.8,9 HRS techniques in which analyte separation, coupled with biochemical detection in parallel with mass spectrometric identification, for ligand binding as well as enzyme inhibition have been developed in both at-line and online formats.10,11 Such HRS techniques are being used for the identification of individual compounds as lead molecules from complex mixtures like biological extracts or combinatorial libraries. 12 Scarce availability of starting material is a key limitation in this process for many types of biological extracts. 13 Hence, there is a need for new platforms that can use minute amounts of starting material for the identification of highly active lead molecules. Although microfluidic systems show lower sensitivities and thus higher limits of detection (approximately four to six times lower sensitivities) than macro-scale systems, these sensitivities have been reported to be within the concentration range of bioactivity detection and hence are implemented for screening of bioactives from limited sample amounts. 14 Therefore, microfluidic systems provide detection platforms for identifying bioactives from limited sample amounts and consume lesser amounts of bioassay reagents without a compromise in assay sensitivity. 15 Moreover, when coupled to a sensitive nano-spray electrospray ionization mass spectrometry (ESI-MS), these platforms also allow parallel mass determination and further peptide analysis from minute amounts of starting material that macro-scale systems fail to handle.
We have described microfluidic HRS procedures for bioaffinity profiling of the acetylcholine binding protein (AChBP) along with accurate mass determination.16–18 For this, a nano–high-performance liquid chromatography (HPLC) is coupled online to a fluorescence enhancement assay in parallel with a mass spectrometer to detect bioactive compounds and identify their masses in a single analysis. We have also developed a microfluidic chip–based method for screening of cathepsin B inhibitors and an HRS liquid chromatography–mass spectrometry (LC-MS) method for detection and identification of small-molecule inhibitors of p38α mitogen-activated protein kinase.15,19 Here, we describe a microfluidic postcolumn method for identifying thrombin and FXa inhibitors from a mixture of compounds. Since both enzymes prefer to hydrolyze an arginyl bond, we have used the same fluorogenic substrate, R22124 (Rhodamine 110, bis-(p-Tosyl-L-Glycyl-L-Prolyl-L-Arginine Amide)), for both enzymes to keep the method simple.
Materials and Methods
Chemicals and Reagents
Thrombin and FXa were purchased from BV Bioconnect, Haematologic Technologies (Huissen, Netherlands). Substrate R22124, Rhodamine 110, bis-(p-Tosyl-L-Glycyl-L-Prolyl-L-Arginine Amide), was obtained from Life Technologies (Amsterdam, Netherlands). NaCl, KCl, Na2HPO4·2H2O, KH2PO4, argatroban monohydrate, Tween 20, and PEG 6000 were purchased from Sigma-Aldrich (Zwijndrecht, Netherlands). Enzyme-linked immunosorbent assay (ELISA) blocking reagent was purchased from Hoffman-LaRoche (Mannheim, Germany). Ultra-LC-MS (ULC-MS)–grade methanol, ULC-MS–grade acetonitrile (ACN), and trifluoroacetic acid (TFA) were obtained from Biosolve (Valkenswaard, Netherlands). HPLC-grade water was produced using the Milli-Q purification system (Amsterdam, Netherlands). Venom of Dendroaspis polylepis was provided by Dr. Ryan McCleary.
Thrombin and FXa Assays in Microtiter Plates
Enzyme assays were performed in 96-well black microtiter plates (Griener Bio-One GmBH, Kremsmünster, Austria) to evaluate parameters such as KM, Vmax, and tolerance to additives. Briefly, 50 µL phosphate-buffered saline (PBS, pH 7.4) was mixed with 30 µL R22124, and 20 µL enzyme was then added to start the reaction. The rate of release of the fluorescent product R110 (excitation, 490 nm; emission, 520 nm) at room temperature was measured for 10 min with an Infinite 200Pro microtiter plate reader (Männedorf, Switzerland). For determination of KM and Vmax, two different enzyme concentrations (thrombin: 100 ng/mL−1 and 20 ng/mL−1; FXa: 1000 ng/mL−1 and 250 ng/mL−1) along with different substrate concentrations (for thrombin assay: 60, 20, 6.6, 2.2, 0.74, and 0.24 µM; for FXa assay: 50, 25, 12.5, 6.25, 3.12, 1.56, and 0.78 µM) were used. Initial reaction velocities were calculated as the rates of formation of the fluorescent product per second for the initial 5 min of the reaction. KM and Vmax values were obtained by fitting the data to Michaelis-Menten equation using the GraphPad Prism software (GraphPad Software, La Jolla, CA). To determine tolerance of the assay to different additives, similar enzyme assays were performed with different concentrations of additives such as PEG 6000 (2, 1, 0.5, 0.25, 0.12, 0.62, 0.31, and 0.15, 0.007 mg/mL−1), ELISA blocking reagent (10, 5, 2.5, 1.25, 0.62, 0.31, 0.15, 0.07, and 0.03 mg/mL−1), Tween 20 (2.5%, 1.25%, 0.62%, 0.31%, 0.15%, 0.08%, 0.04%, 0.02%, and 0.01%), acetonitrile or methanol (10%, 5%, 2.5%, 1.25%, 0.62%, 0.31%, 0.15%, 0.07%, and 0.03%), and TFA or FA (0.1%, 0.05%, 0.02%, 0.01%, 0.006%, 0.003%, 0.001%, 0.0008%, and 0.0004%). The reaction rates were calculated as described above, and percentage inhibition at different concentrations of additives was determined by comparing the reaction velocities in the presence and absence of additives. 20 The parameters obtained from these studies were used for the development and optimization of the online assays.
Instrumentation
The instrumental setup for the online assay ( Fig. 1A ) consisted of a nano-LC system, a miniaturized reaction coil in the form of a microfluidic chip, a microfluidic LED-based confocal detector, and a mass spectrometer.
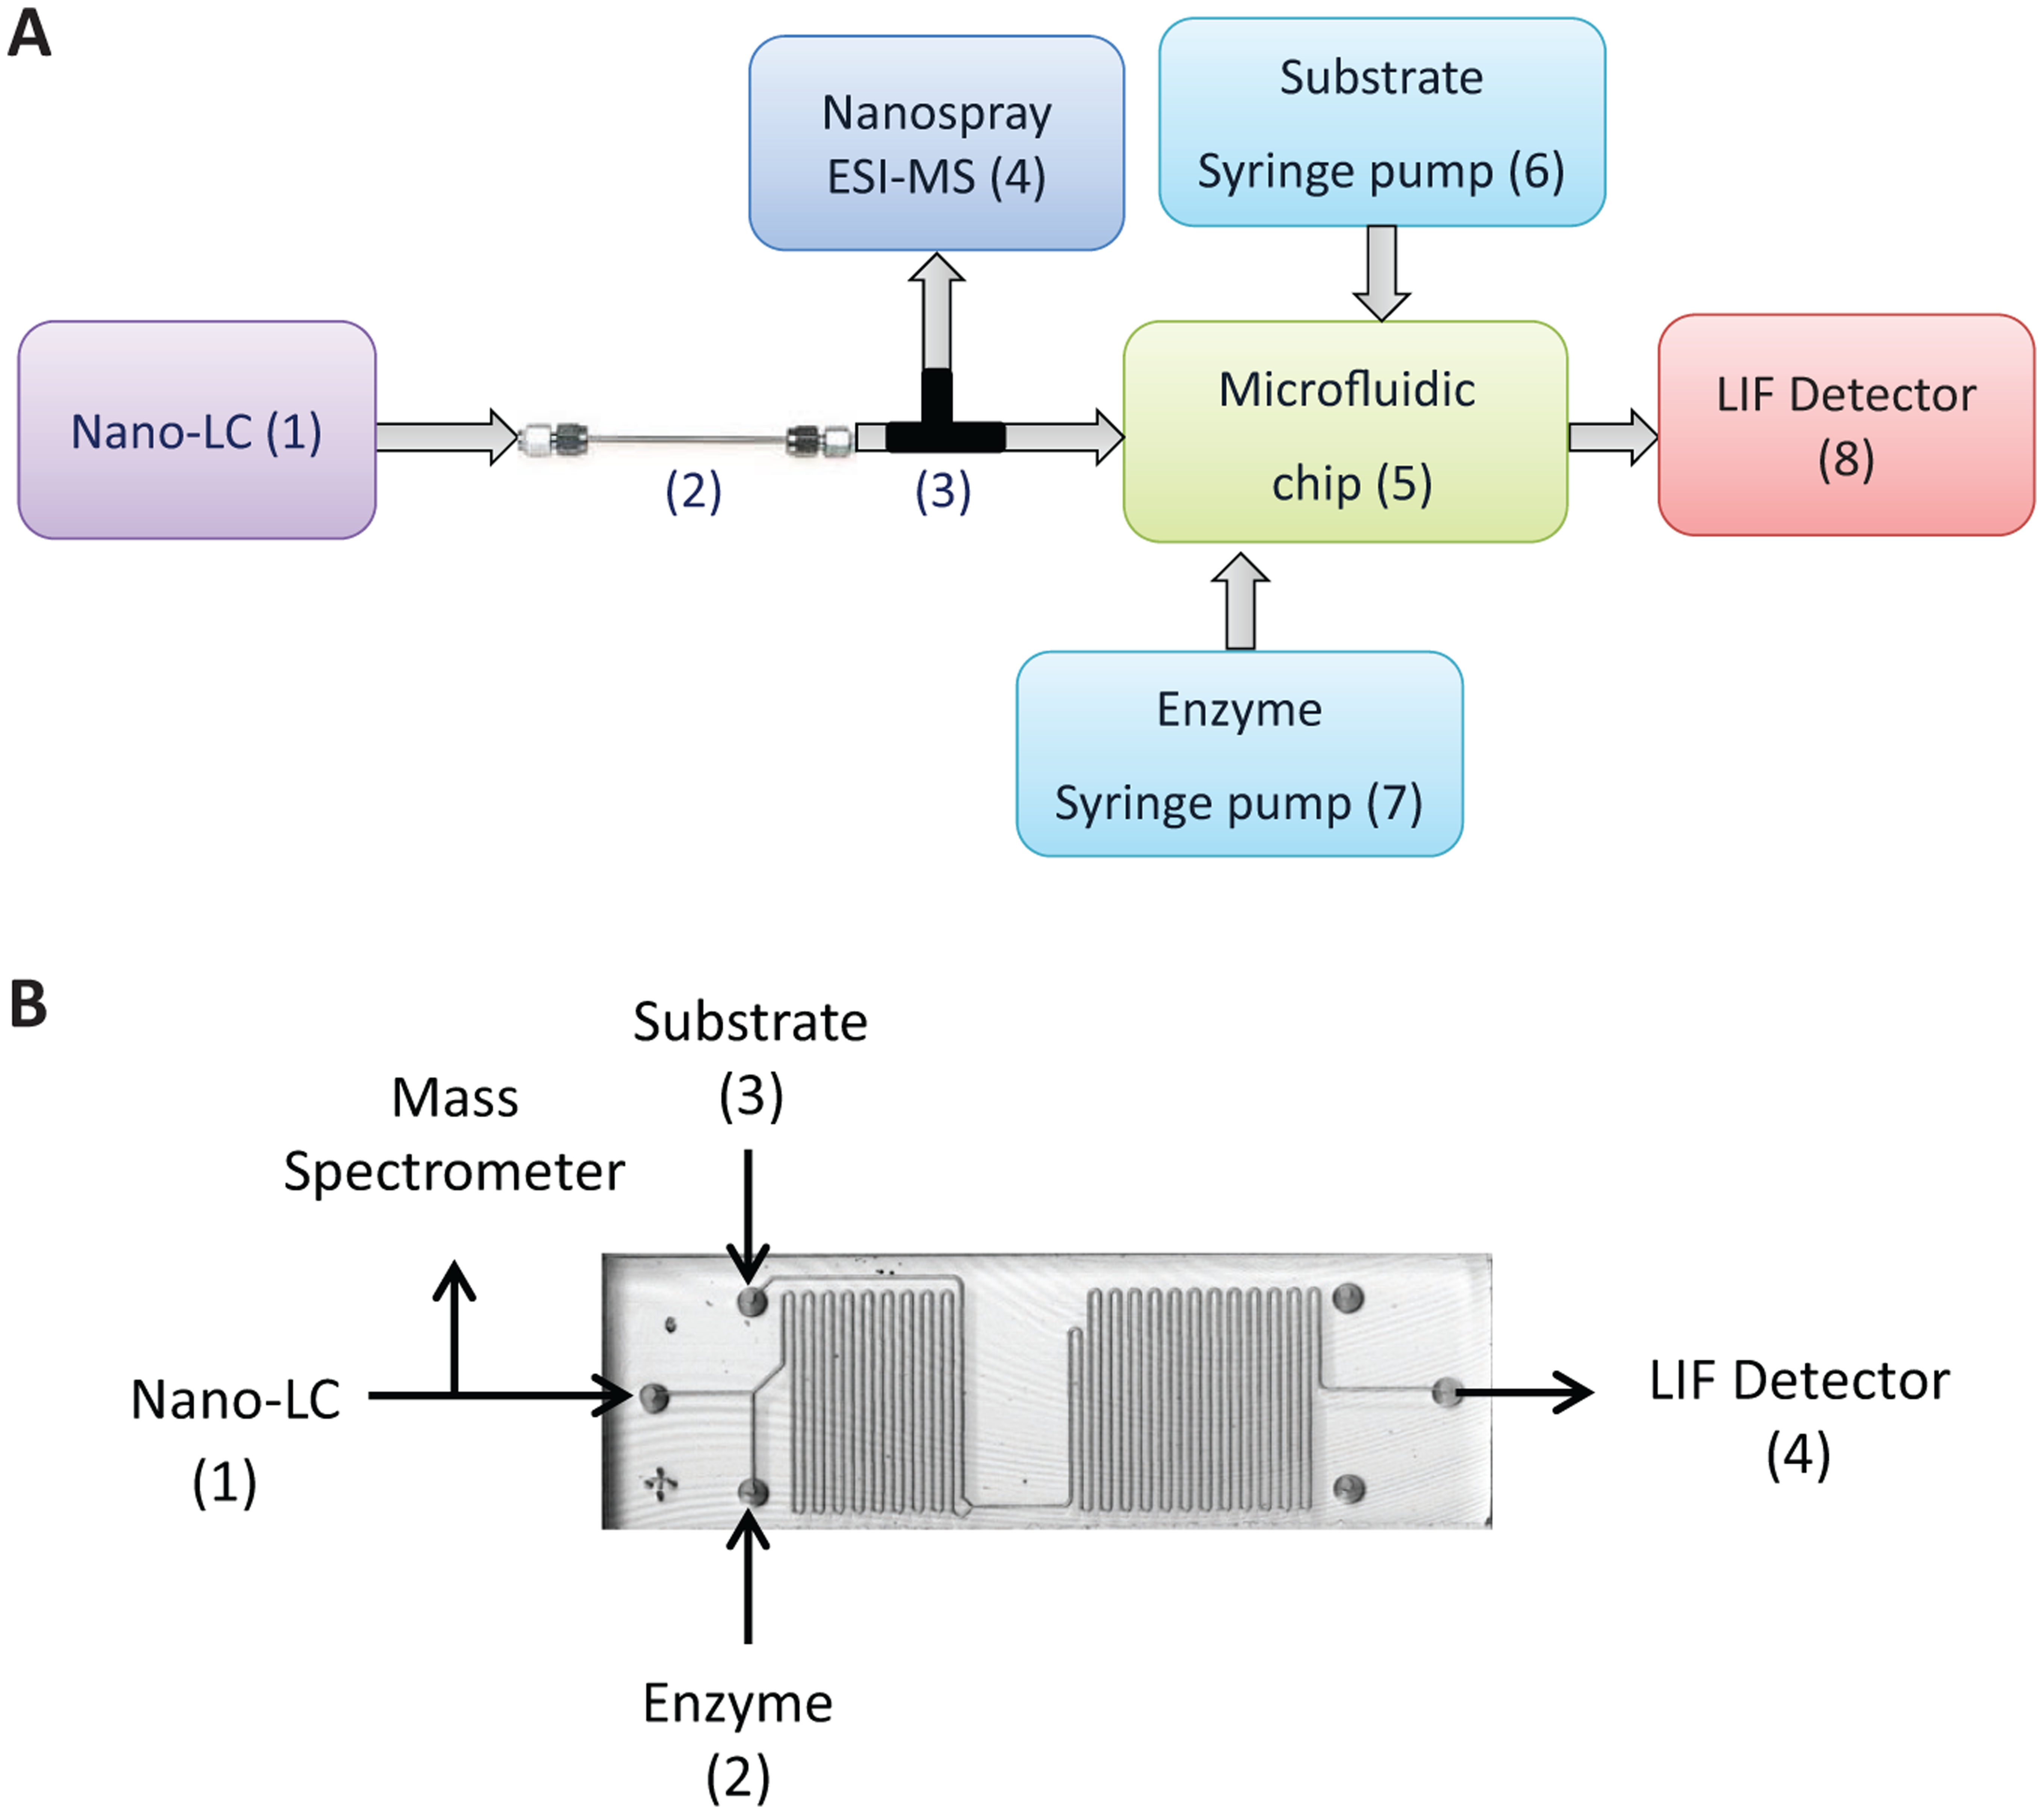
Online setup for identification of thrombin and factor Xa (FXa) inhibitors. (
Nano-LC system
The Dionex Ultimate 3000 nano-LC system was from Thermo Fisher (Breda, Netherlands). Flow rate of the nano-LC was maintained at 400 nL/min−1. Samples (500 nL to 1 µL) were injected in the flow injection analysis (FIA) mode or in the gradient analysis mode using nano-LC controlled autosampler. For FIA experiments, 100% Milli-Q water was used as the mobile phase. For gradient analysis, a capillary column (150 mm × 75 µm i.d.) packed in-house with Phenomenex Aqua C18 particles (5 µm, 200 Å pore diameter) was used with mobile phase eluent A as water/ACN 99:1 and 0.1% TFA and eluent B as water/ACN 1:99 and 0.1% TFA. The column was first equilibrated for 5 min at 5% eluent B, and then a linear gradient from 5% to 70% B in 60 min was applied. Eluate (400 nL/min−1) from the column was split via a T-splitter in a 1:1 ratio; half was infused into the microfluidic chip, and the other half was fed into a mass spectrometer. Two fused silica capillaries of identical length (150 cm) and diameter (25 µm i.d.) were used to connect the nano-LC with the mass spectrometer and with the microfluidic chip to obtain a 1:1 split ratio. After each run, the column was washed with 70% eluent B for 5 min and reequilibrated with 5% eluent A for 3 min before the next run.
Microfluidic chip
The microfluidic chip and 4515 chip holder were from Micronit Microfluidics (Enschede, Netherlands), and microfluidic chip nanoports were from Upchurch (Amsterdam, Netherlands). The microfluidic chip (described previously) with dimensions 45 mm × 15 mm × 2.2 mm had an open tubular channel that was 125 µm wide × 70 µm deep. 14 This open tubular channel had a total volume of 4 µL and was divided into two microreactors of volumes 1.6 µL and 2.4 µL by incorporating three inlets and one outlet ( Fig. 1B ). The enzyme (thrombin or FXa) was infused through the first inlet via a 2.5-mL syringe driven by syringe pumps (Harvard Apparatus, Holliston, MA) at a constant flow rate of 2 µL/min−1. Eluate from C18 column (containing potential inhibitors) was infused through the second inlet at a flow rate of 200 nL/min−1. This allowed an in-flow incubation of enzyme with the eluting inhibitor in the first microreactor. Substrate was infused through the third inlet via a 2.5-mL syringe driven by a syringe pump at a flow rate of 2 µL/min−1. In the second microreactor, enzyme hydrolyzed the substrate, releasing the fluorophore. The outlet from the chip was channeled to a microfluidic confocal fluorescence detector (CFD) to measure fluorescence of the product formed. The chip was connected to syringe pumps, nano-LC, and detector using fused silica capillaries, placed in the chip holder, and maintained at 37 °C in a water bath.
LED-based microfluidic CFD
The LED-based microfluidic CFD as described previously consisted of a bubble cell capillary of 150 µm i.d. and connecting capillaries of 50 µm i.d. from Agilent Technologies (Amsterdam, Netherlands). 21 Briefly, in the CFD setup, light emitted from the LED passes through the 465-nm single-bandpass filter followed by collimation by the lens and then reflected under a 90° angle using a dichroic mirror. This filtered light is focused onto the center of the fluorescence optical cell. Emitted light is allowed to pass through the same dichroic mirror, the focusing lens, and the 520-nm single-bandpass filter and subsequently detected by the photomultiplier tube.
Mass spectrometry settings
The ion trap time-of-flight (IT-TOF) hybrid mass spectrometer from Shimadzu (Hertogenbosch, Netherlands), with Picoview nano-ESI source from New Objective (Woburn, MA), was operated in the positive ion mode. A 40 mm × 180 mm o.d. × 30 mm i.d. stainless-steel emitter from Thermo Scientific (Waltham, MA) served as the spray needle. The temperature of the heating block was set to 200 °C, and interface voltage was set to 1.7 kV, which resulted in a current of 32 µA. The scan range was m/z 200 to 1000.
Microfluidic Online Assay of Snake Venom
For the analysis of snake venom, the nano-LC was connected to the MS and microfluidic chip (as described in the Instrumentation section). After stabilization of the elevated baseline fluorescence, 5 µg D. polylepis venom dissolved in 500 nL and spiked with 500 ng argatroban dissolved in mobile phase eluent A was injected into the C18 capillary column. The column was equilibrated with 5% eluent B for 5 min, and the snake venom was separated using an acetonitrile gradient (5%–70% eluent B in 60 min).
Results and Discussion
Microfluidic chip–based enzymatic assays and receptor binding studies for the detection of bioactives from complex mixtures have been used as alternatives to traditional screening approaches because of their speed, robustness, reproducibility, and sensitivity. They are most suitable for screening of novel drug leads from minute sample amounts. We have developed fluorescence-based online screening methods coupled with mass spectrometry in miniaturized formats for bioaffinity profiling of AChBP ligands, cathepsin B inhibitors, and inhibitors of p38α mitogen-activated protein kinase.15–19 In this study, we describe the development of an analytical platform for profiling of thrombin and FXa inhibitors.
Standardization of Enzyme Assays in Microtiter Plates
The assay is based on enzymatic cleavage of a fluorogenic substrate, R22124, by thrombin or FXa to release a fluorescent product. KM and Vmax values for R22124 with thrombin and FXa were determined as described in the Materials and Methods. The KM and Vmax for R22124 with thrombin were 4.05 ± 0.87 µM and 81 ± 4.72 RFU min−1/ng−1 (thrombin), respectively, and KM and Vmax for R22124 with FXa were 4.29 ± 0.55 µM and 10.01 ± 0.38 RFU min−1/ng−1 (FXa), respectively (
Nonspecific adsorption of enzymes and substrates to glass surfaces of the microfluidic chip and fused silica capillaries leads to increasing baselines and peak broadening. 21 To block this nonspecific adsorption, blocking reagents such as PEG 6000, Tween 20, and ELISA blocking reagent were used in the online assays. As these additives may inhibit the assay or lead to enzyme precipitation within the microfluidic chip, their effect on the assay was evaluated using microtiter plate assays prior to translation to the online format. 22 The enzyme activity of thrombin or FXa was not affected in the presence of PEG 6000 (up to 2 mg mL−1), Tween 20 (up to 0.02%), or ELISA blocking reagent (up to 3 mg mL−1) in the reaction mixture (data not shown).
In the online assay setup, organic mobile phase solvents such as ACN and methanol used for gradient elution in the nano-LC system will be infused into the microfluidic chip, and if the concentration of these solvents is significantly high, they might reduce thrombin and FXa enzymatic activities due to denaturation. Therefore, the effect of different concentrations of ACN and methanol (up to 10%) on activities of thrombin and FXa was evaluated using microtiter plate assays. At lower concentrations of these organic solvents (2%–5%), there were slight increases in thrombin and FXa enzymatic activities. This slight increase in enzyme activity in the presence of a small amount of organic solvent could be due to minor adsorption effects of the assay reagents on the surfaces of the microtiter plates or the microfluidic chip. Overall, the activities of both thrombin and FXa were not significantly affected in the presence of ACN or methanol at concentrations that would be used in the online assay. In the online assay format, 200 nLmin−1 of the nano-LC eluate will be infused with 4 µLmin−1 of reagents of the enzyme assay (2 µLmin−1 each of enzyme and substrate). Since the online assay reagents are prepared in a PBS buffer (pH 7.4), the final concentration of organic solvents in the online assay taking place within the microfluidic chip will be diluted to a concentration that will have little or no effect on the enzyme activities (organic solvent concentrations will remain well below 10%, even when the mobile phase gradient of the nano-LC reaches up to 70% eluent B). The effect of different concentrations of ion-pairing agents TFA and FA on enzyme activities was also evaluated. At the concentrations that would be used in the online assay (up to 0.01%), no inhibition was observed for both ion-pairing agents. Since TFA is the most commonly used ion pairing agent and gives better resolution, TFA was used in the online assay.
Optimization of Online Assay Parameters by FIA
Microfluidic setup
The microfluidic chip has two microreactors, where the enzyme and inhibitor are infused in the first, and substrate is infused in the second. Thus, the EI refers to enzyme-inhibitor complex is formed in the former, and the enzymatic cleavage of the substrate to release the fluorescent product takes place in the latter. The continuous infusion of enzyme and substrate, and thus constant release of fluorescent products in the second microreactor, gives stable elevated baseline fluorescence. The in-flow incubation of inhibitors eluting from the nano-LC provides its efficient mixing with the assay buffer and enzyme in the first microreactor. As these inhibitors bind to and inhibit the enzyme, the rate of substrate turnover is decreased, which is observed as a negative peak.
Standardization of enzyme assays online format
For the online assays, enzymes and substrates were used at concentrations lower than those used for the microtiter plate assays. These lower concentrations were chosen to avoid the formation of saturating amounts of fluorescent products. Initially, different enzyme concentrations (1.5 ngmL−1, 4.5 ngmL−1, and 13.5 ngmL−1 for thrombin and 10 ngmL−1, 25 ngmL−1 and 50 ngmL−1 for FXa) were used with a constant substrate concentration (3.3 µM of substrate for thrombin assays and 2.5 µM for FXa assays). Decreasing amounts of benzamidine (13.8 µg, 2.76 µg, and 0.55 µg) were injected in triplicate into the system in the FIA mode (
Fig. 2A
and
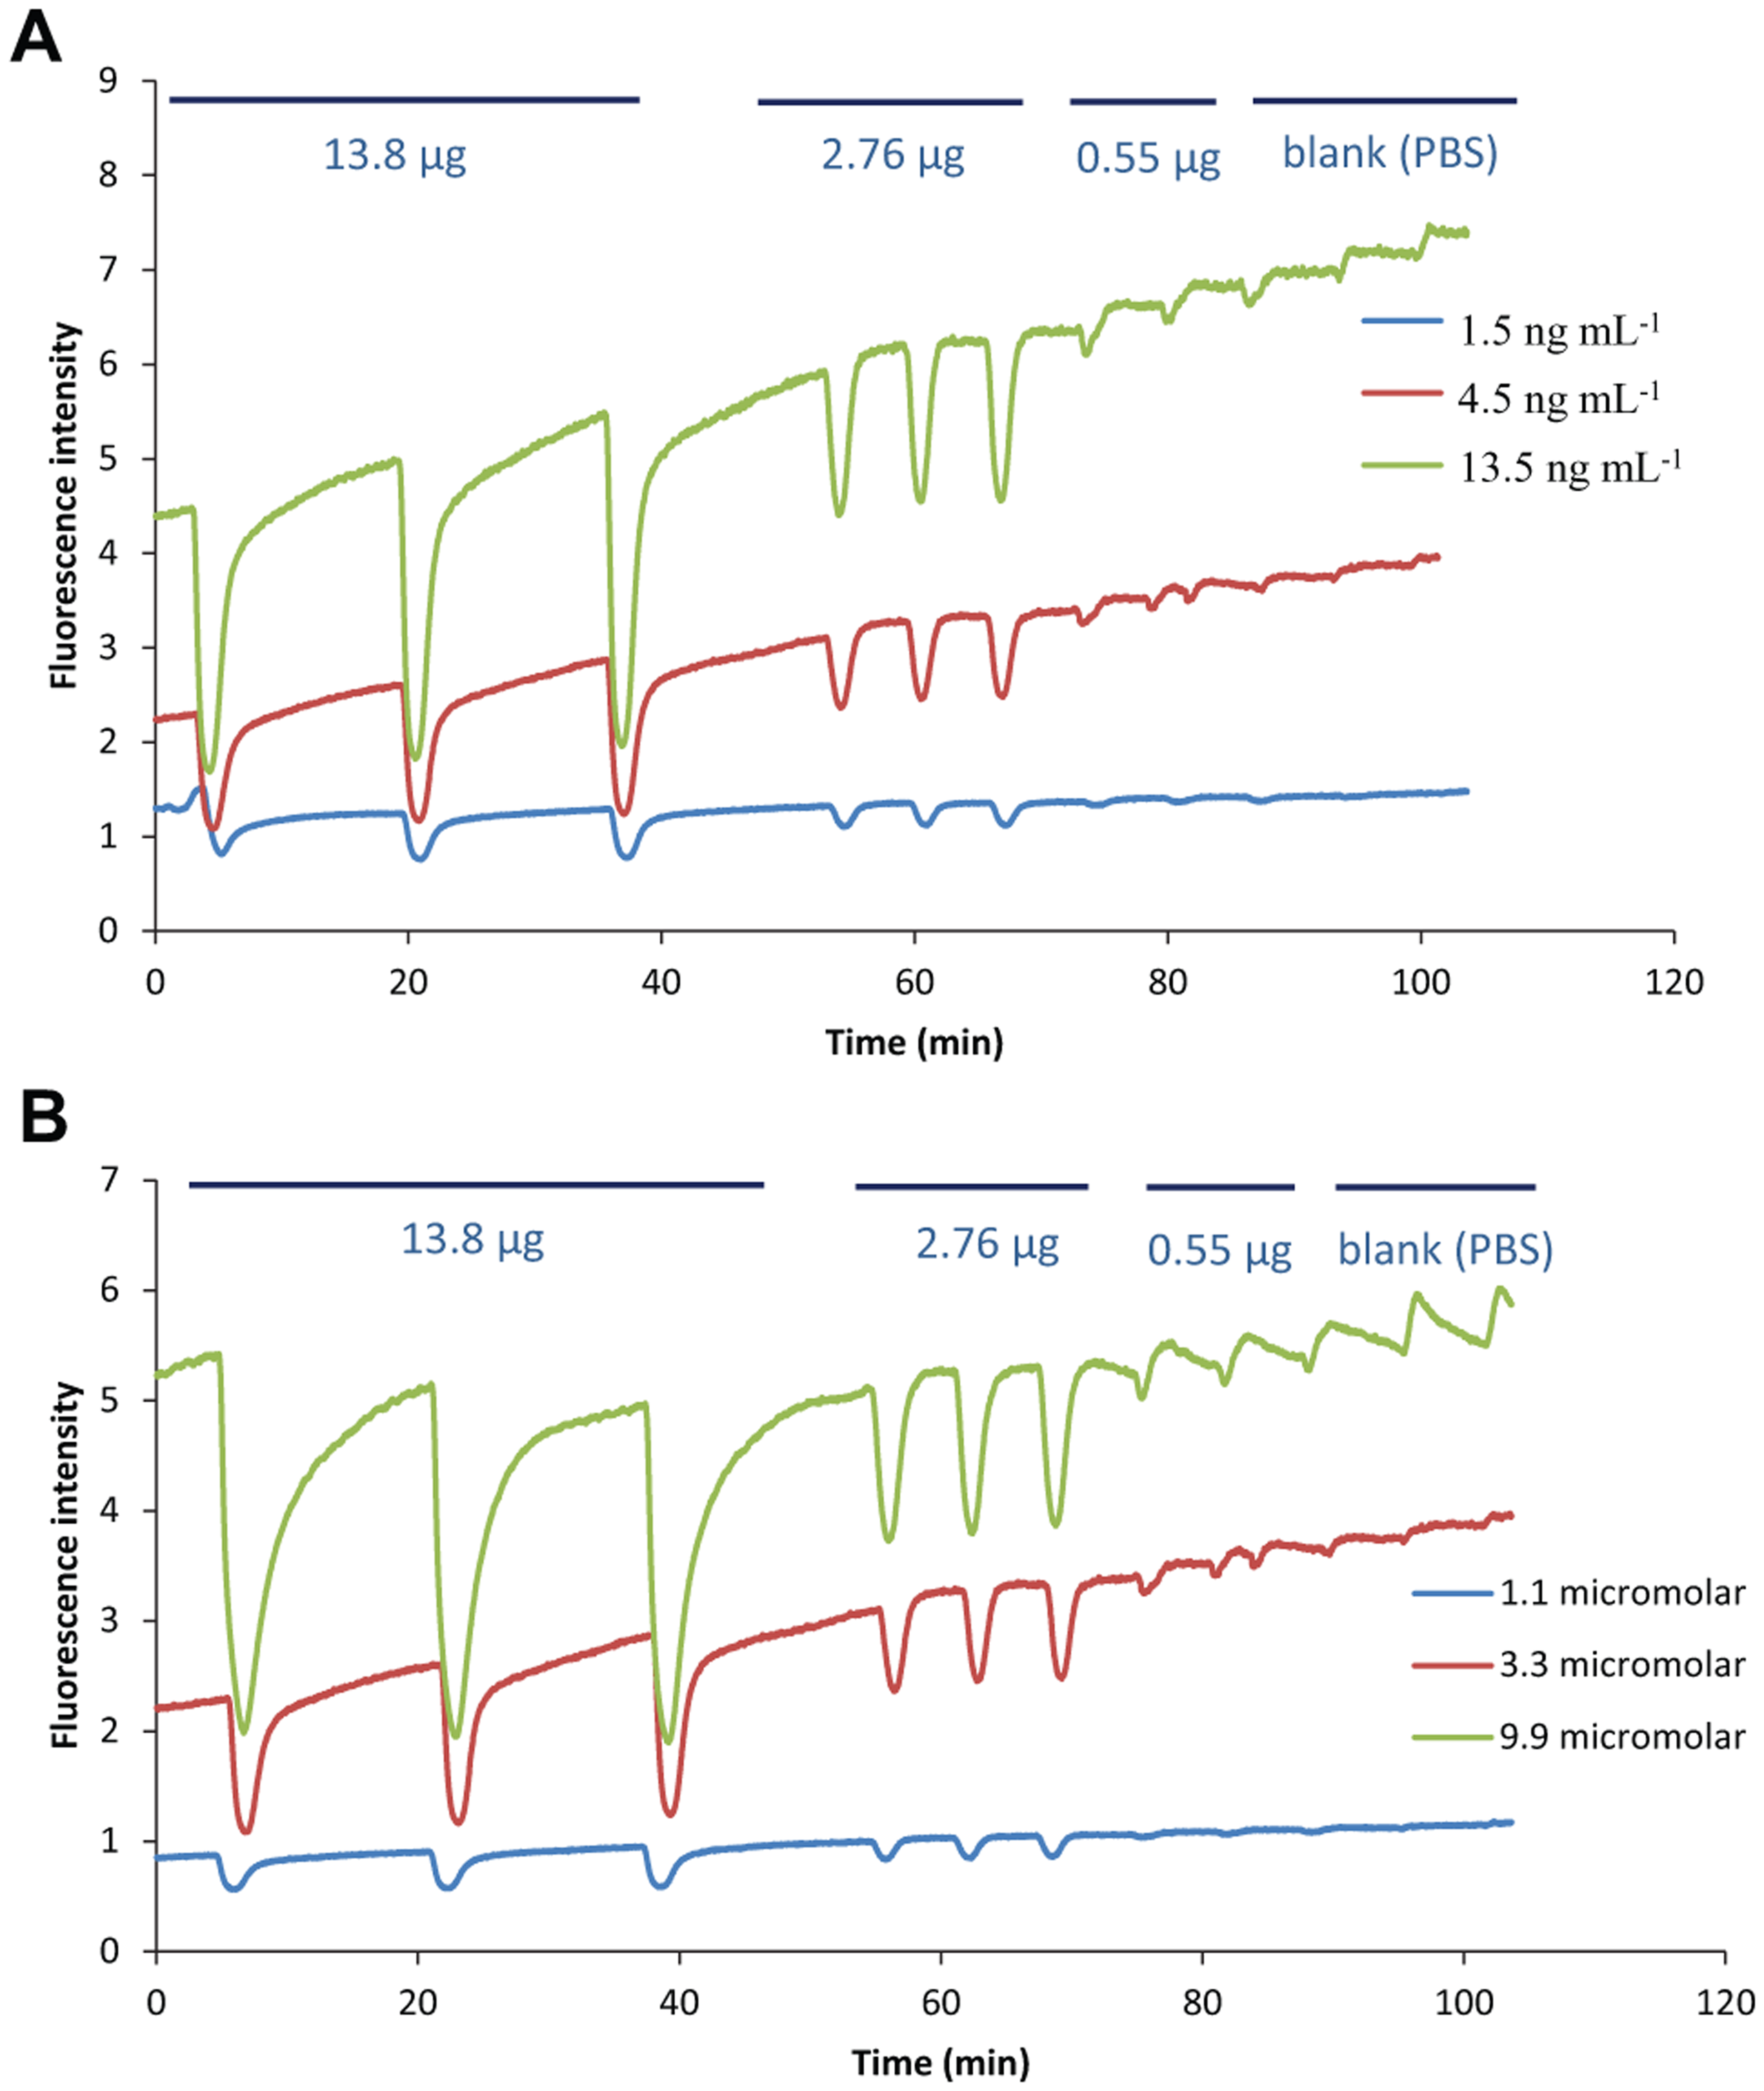
Optimization of enzyme and substrate concentration for online assays. (
The substrate concentration was optimized by using a constant enzyme concentration (thrombin, 4.5 ngmL−1; FXa, 25 ngmL−1) and different substrate concentrations (1.1 µM, 3.3 µM, and 9.9 µM for thrombin; 1.25 µM, 2.5 µM, and 4.5 µM for FXa). Decreasing amounts of benzamidine (13.8 µg, 2.76 µg, and 0.55 µg) were injected in triplicate into the system in the FIA mode. For thrombin and FXa, 3.3 µM and 2.5 µM were chosen as optimal R22124 concentrations, respectively (
Fig. 2B
and
For all further experiments, enzymes were prepared in PBS buffer (PH 7.4) containing 0.5 mgmL−1 PEG 6000 and 0.5 mgmL−1 ELISA blocking reagent, and substrate R22124 was prepared in a buffer containing 0.01% Tween 20.
Validation of the online assay by FIA
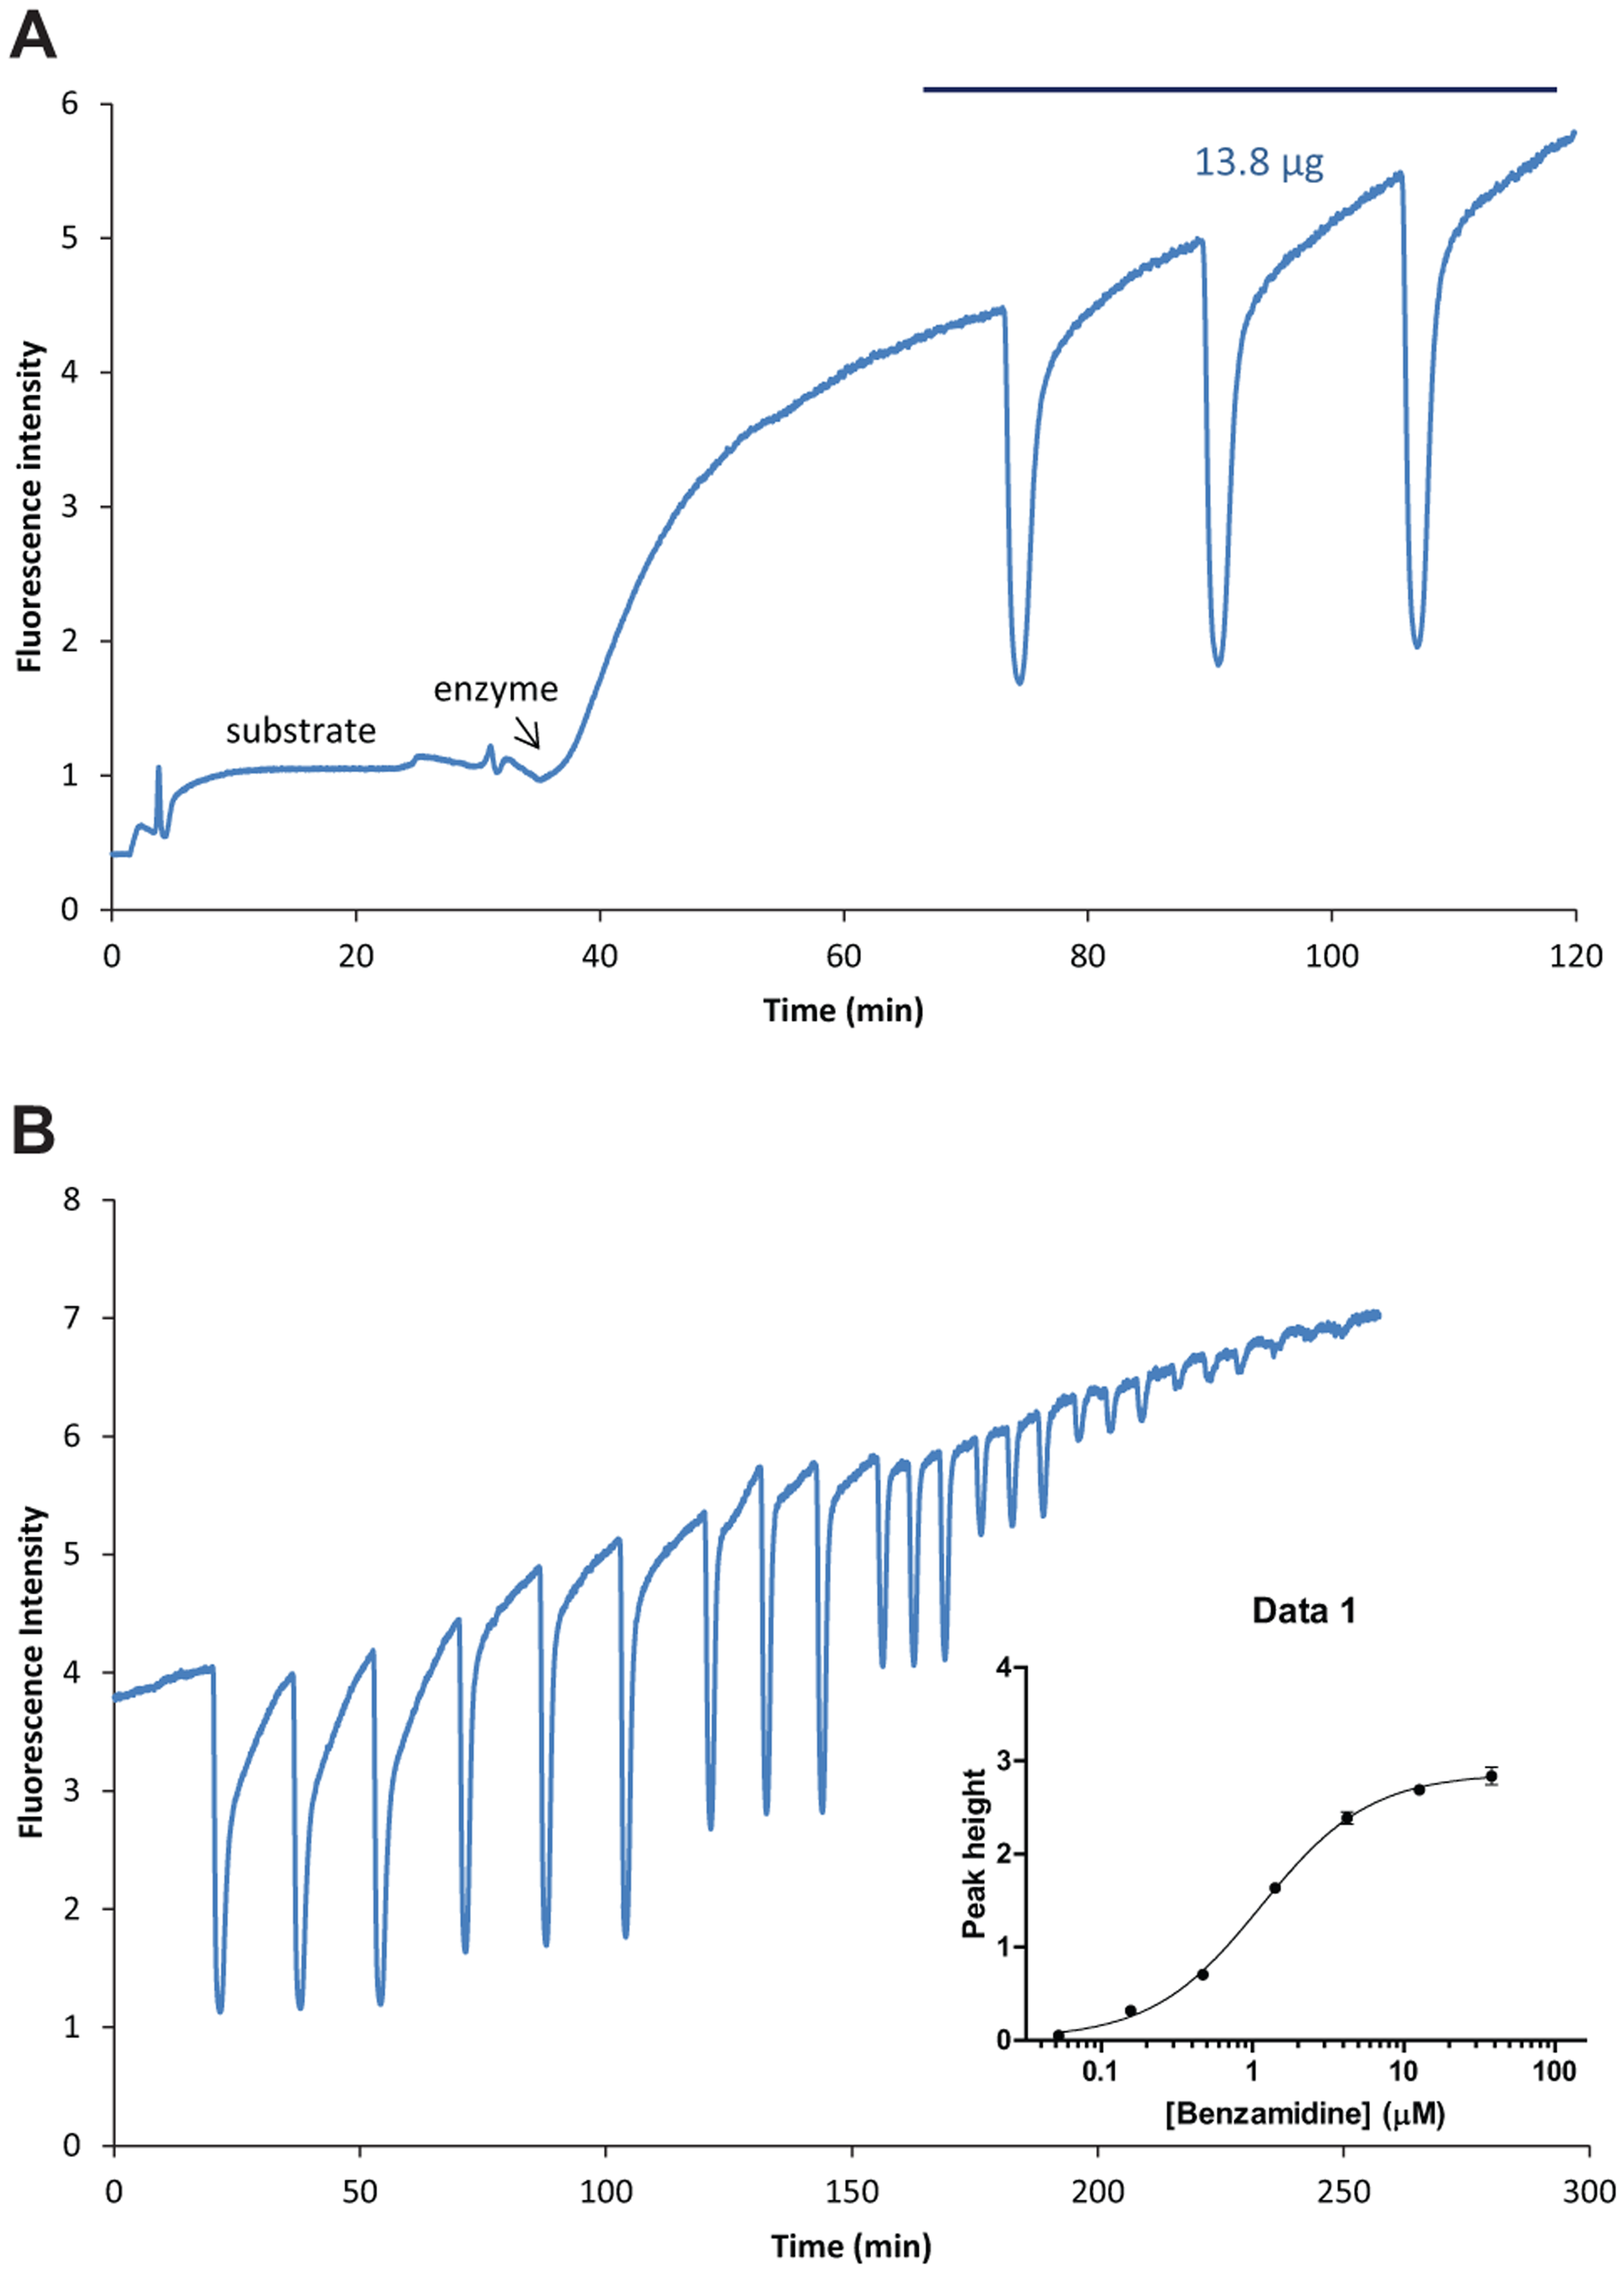
The setup for the online enzymatic assays was validated in the FIA mode. The substrate, R22124, was continually infused into the microfluidic chip until a stable substrate baseline was obtained (
Fig. 3A
). When thrombin infusion was started, there was a large increase in the fluorescence because of the formation of the fluorescent product, and this fluorescence stabilized as an elevated baseline, indicating that product formation had reached a steady state. Subsequently, 13.8 µg benzamidine was injected in triplicate through the nano-LC. Each injection resulted in a reproducible negative peak (
Fig. 3A
). To demonstrate that the increase in the elevated fluorescence baseline is due to the enzyme-substrate reaction, the chip was incubated at different temperatures (at 0 °C and at 37 °C). An increase in the baseline fluorescence was observed when the chip was placed from 0 °C to 37 °C and a sudden dip in fluorescence when the chip was again incubated at 0 °C. This behavior shows that the elevated baseline fluorescence is due to the enzymatic formation of fluorescent product because the enzyme-substrate reaction is optimal at 37 °C, while low or no product formation occurs at 0 °C (
Validation and dose response of the online assay. (
To demonstrate the robustness of the assay, statistical parameters such as screening window coefficient (Z′ factor), dynamic range, signal-to-background ratio (S/B), signal-to-noise ratio (S/N), and signal window (SW) were calculated for the thrombin assay (
Table 1
) and for the FXa assay (
Calculated Statistical Parameters for the Thrombin Assay Using Different R22124 Concentrations.
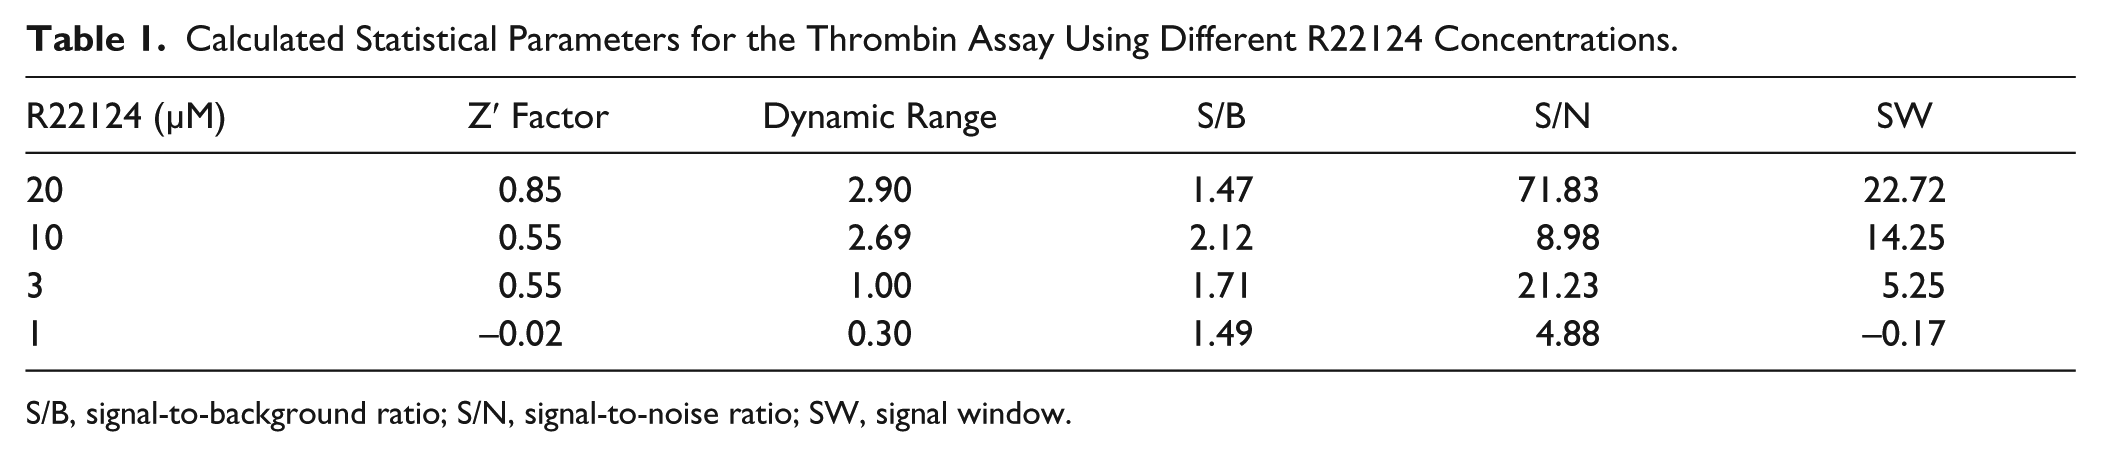
S/B, signal-to-background ratio; S/N, signal-to-noise ratio; SW, signal window.
Dose-response of inhibition in the online assay
To demonstrate the dose-dependent inhibition, the online assay was set up using optimized thrombin and substrate concentrations, and after stabilization of the elevated fluorescence baseline, different amounts of the inhibitor benzamidine (13.8 µg, 4.6 µg, 1.53 µg, 0.52 µg, 0.17 µg, 0.05 µg, and 0.016 µg) followed by a blank were injected in triplicates into the online assay system through the nano-LC using the FIA mode. After each injection, a negative peak in fluorescence was observed (
Fig. 3B
). The peak heights directly correlated with the concentrations of inhibitor. One important note in this regard is that the final inhibitor concentration in the assay after injection is diminished due to two factors: (1) mixing of nano-LC eluate with reagents of the online assay (mixing dilution DM) and (2) chromatographic dilution (DC). Detailed descriptions of calculating the final inhibitor concentrations considering these two dilutions are given elsewhere.
19
The peak heights were plotted against log final inhibitor concentrations to determine the IC50 values. The IC50 for benzamidine was determined to be 1.13 ± 0.02 µM for thrombin and 4.96 ± 0.12 µM for FXa (
Online thrombin assay coupled with mass spectrometry
To demonstrate the online thrombin assay coupled to the MS, the nano-LC was connected to the MS and the microfluidic chip such that half of the eluate from the nano-LC was fed into the assay and the other half into the MS. Briefly, once the elevated baseline fluorescence was obtained for the enzyme-substrate reaction, 1 µM argatroban was injected into the C18 capillary column and eluted using an acetonitrile gradient (5%–70% in 60 min). The eluted argatroban (509.27 Da) detected by the MS at 48 min could be correlated as a bioactive negative peak in the online assay at 54 min. This 6-min delay between the MS and the bioassay detection is due to the additional volume that the inhibitor has to flow through the microfluidic chip before it is detected in the fluorescence detector. Similarly, when a final concentration of 1 mM benzamidine was injected into the C18 column, dimer masses (277.11 and 241.14 Da) were detected by the MS at 10 min with a bioactive negative peak at 17 min.
Subsequently, a mixture of benzamidine (1 mM) and argatroban (1 µM) was injected into the capillary C18 column and eluted as described above ( Fig. 4 ). From this mixture, benzamidine dimers (277.11 and the 241.14 Da) detected at 10 min in the MS corresponded to the first bioactive negative peak at 17 min. Argatroban (509.27 Da) was detected at 48 min in the MS and as the third negative bioactive peak at 54 min in the assay. The second bioactive negative peak eluting at 46 min was not observed in MS. This bioactive could be a low-molecular-weight impurity from benzamidine, and in such a case, with the scan range used (m/z 200–1000), the mass of this eluting compound could not be detected. Due to the limitations of the experimental settings, there was no direct evidence that this second bioactive was an impurity from benzamidine.
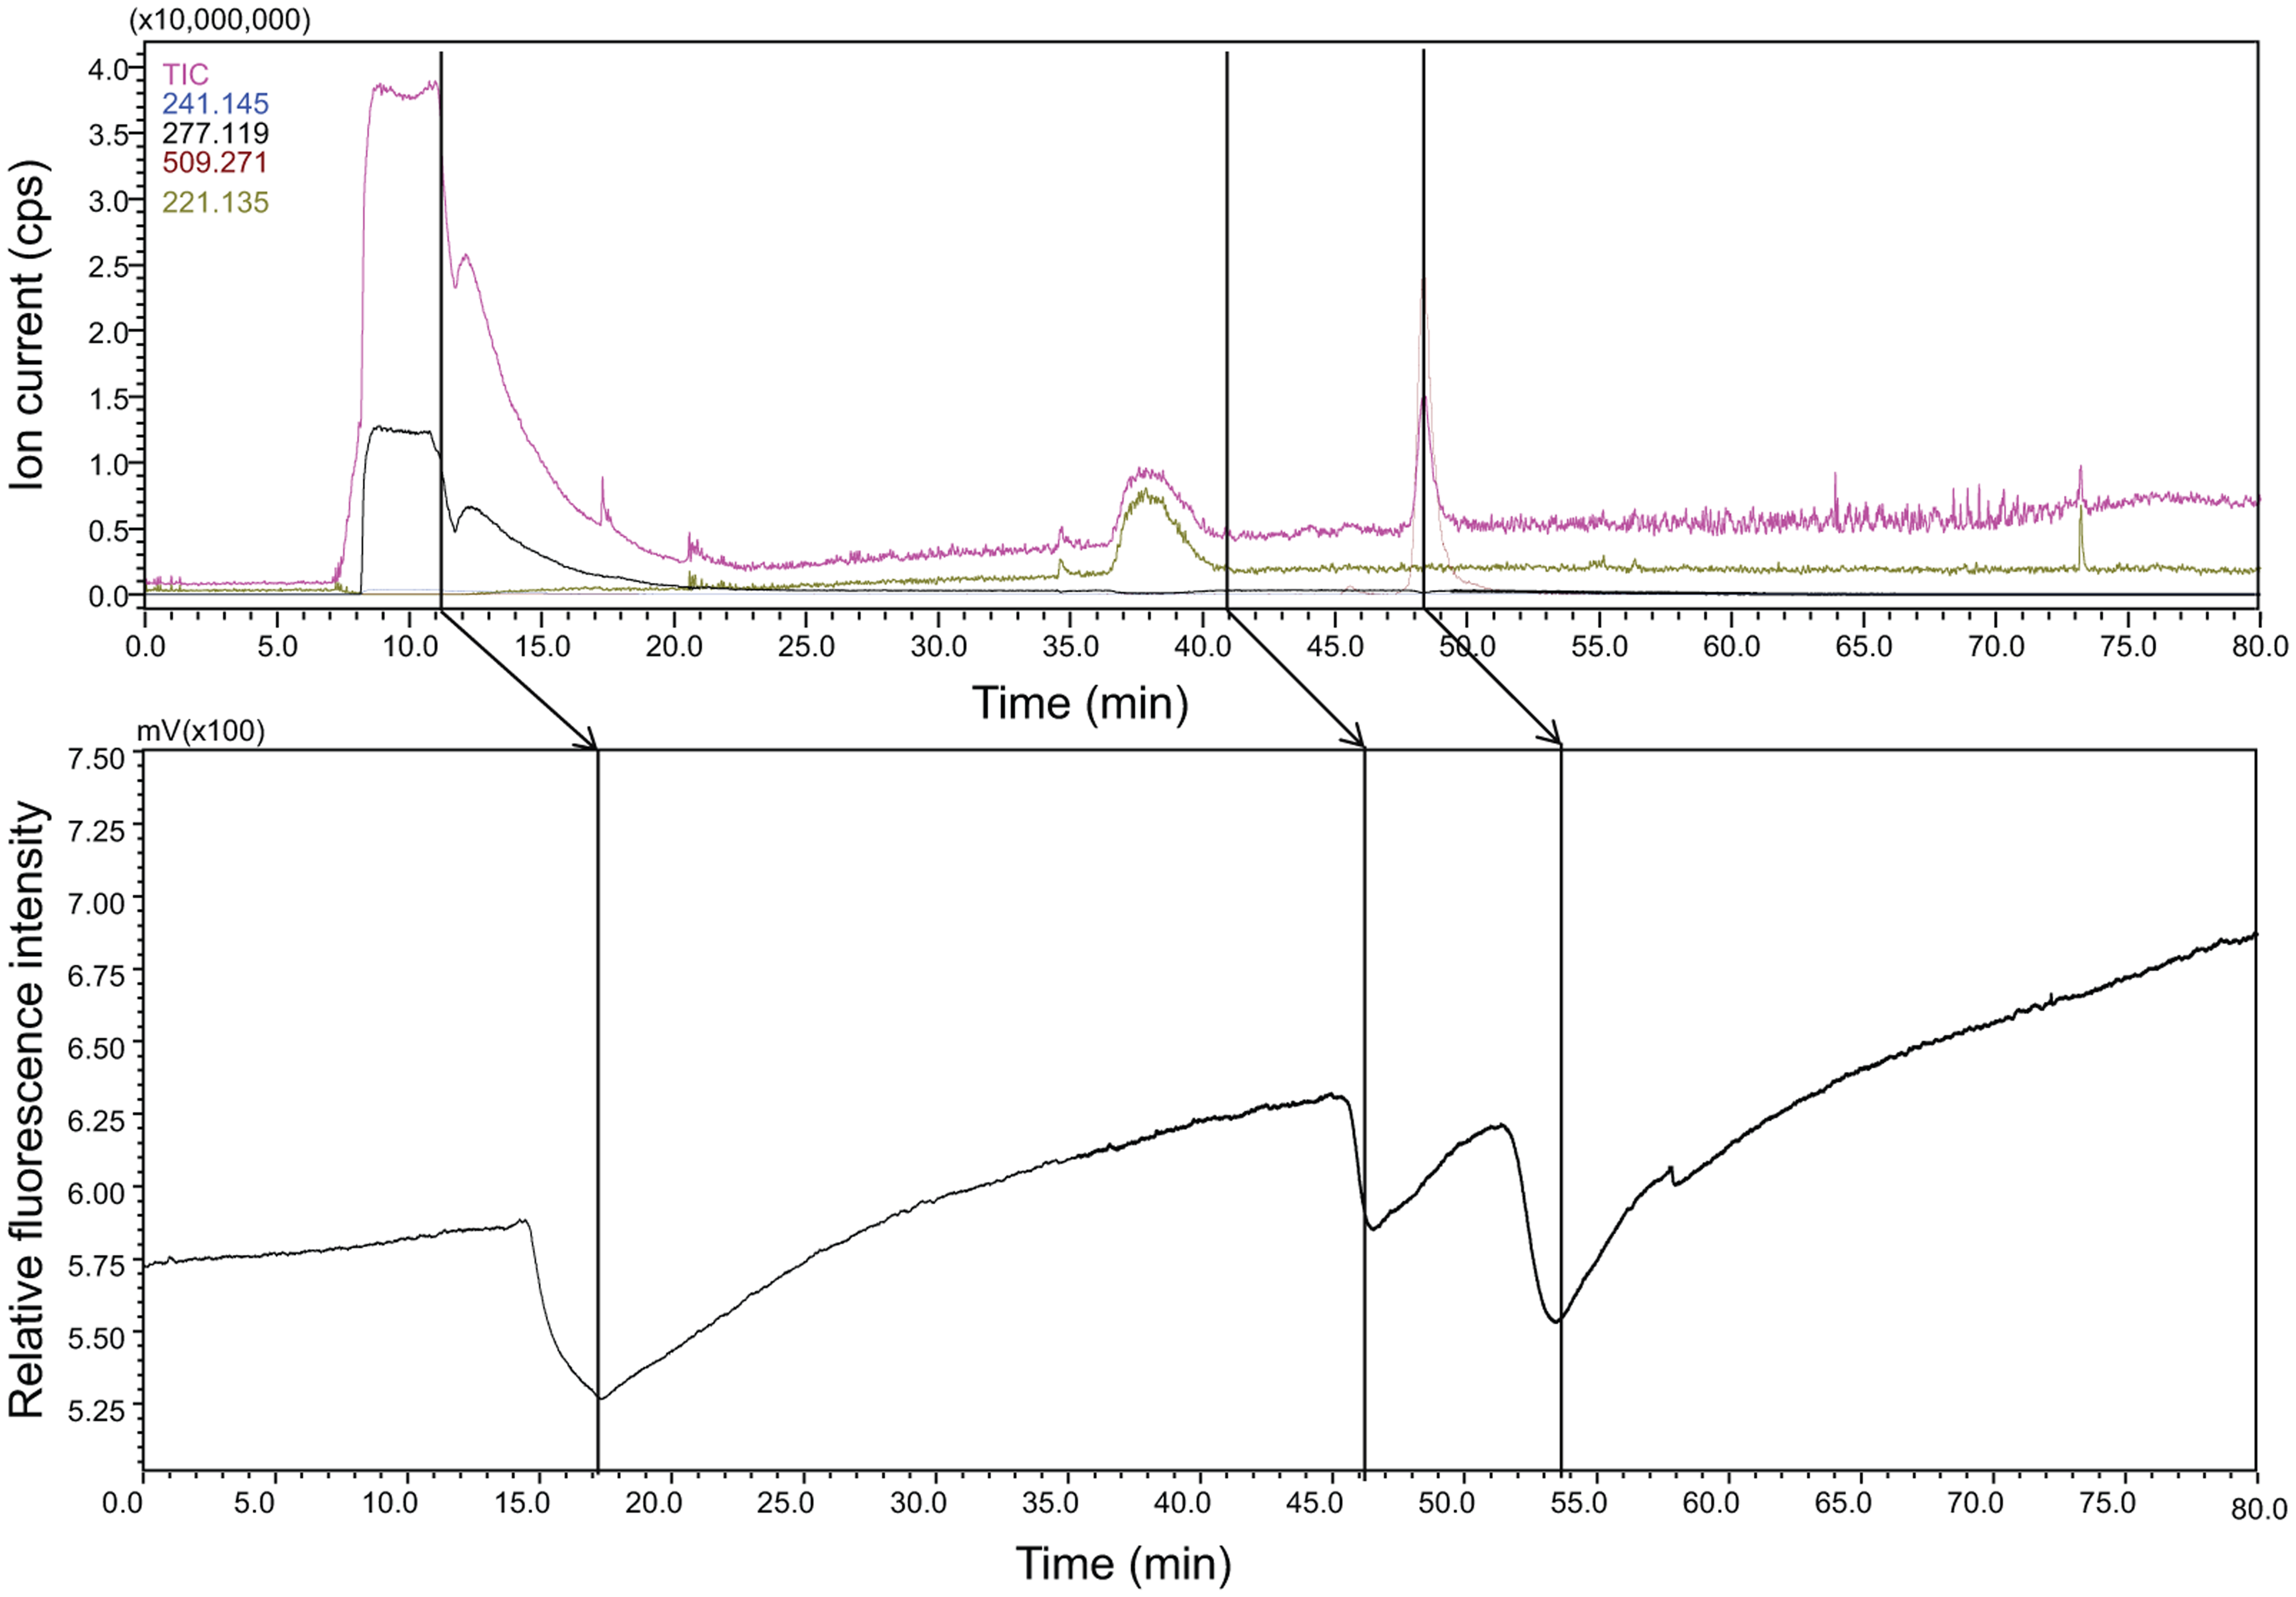
Online thrombin assay with parallel mass spectrometry after nano–liquid chromatography (LC) for analysis of a mixture of benzamidine and argatroban. Benzamidine eluting from the nano-LC was detected by the mass spectrometer (MS) as its dimer masses (277.11 and 241.14 Da) at 10 min in the MS and 17 min in the assay. The scan range used of 200 to 1000 did not allow the observation of benzamidine (121.07 Da). Argatroban 509.27 detected by the MS at 48 min correlated with the bioactive negative at 54 min. The second bioactive negative peak observed at 46 min could be a low-molecular-weight impurity and was not observed in the MS.
Benzamidine is a low-affinity, mechanism-based inhibitor. The efficacy of this type of inhibition, where inactivation of the enzyme active site occurs slowly, has a clear time dependency. Therefore, the online assay format, which has a very short postcolumn incubation time, cannot be used for sensitive measurements of mechanism-based inhibitors. Therefore, for the analysis of this low-affinity inhibitor using the online assay format, a high concentration of benzamidine was injected. With the scan range used (m/z 200–1000), only the early eluting benzamidine dimers (277.11 and 241.14 Da) resulting from ([2M+HCl]+ and [2M+H]+) could be observed at 10 min in the MS. However, additional experiments with a scan range of m/z 100 to 1000 showed that monomer benzamidine eluted at 11 min in the MS as well as in the UV. In these additional experiments, with the same mixture using a scan range of m/z 100 to 1000, only the benzamidine monomer (121.07 Da) could be observed, but benzamidine dimers (277.11 and 241.14 Da) were observed at much lower intensities, and argatroban (509.27 Da) could not be observed anymore. Therefore, severe ion suppression from tailing monomer benzamidine masked the detection of the lower concentration compounds in MS when this scan range of m/z 100 to 1000 was used, and hence scan ranges lower than m/z of 200 were not used. Measurement with a scan range of m/z 200 to 1000, on the contrary, did allow the observation of the early eluting benzamidine dimers (277.11 and 241.14 Da) as well as argatroban. When the two analytical runs were compared, an elution time difference of 1 min between the different forms of benzamidine was seen where the monomer benzamidine (121.07 Da) observed with the m/z 100 to 1000 scan range was eluted 1 min later than the benzamidine dimers (277.11 and 241.14 Da) observed with the m/z 200 to 1000 scan range. Thus, additional UV data can in this case help by providing additional information to be used for correlation purposes.
Online FXa assay coupled with mass spectrometry
Similar to the thrombin assay, the online FXa assay coupled to the mass spectrometer was also demonstrated. The FXa assay was set up in the microfluidic chip with the optimized FXa and R22124 concentrations, and half of the flow from the nano-LC column was fed into the assay and the other half into the mass spectrometer. After the stabilization of the elevated fluorescence baseline, the inhibitors, argatroban (1 µM) or benzamidine (1 mM), were injected into the C18 capillary column and were eluted using an acetonitrile gradient from 5% to 70% in 60 min. Their respective m/z peaks at 10 min and 48 min in the mass spectrometer and bioactive negative peaks at 17 min and 54 min in the assay were observed. Furthermore, a mixture of argatroban (1 µM) and benzamidine (1 mM) was injected into the nano-LC and was eluted using the same acetonitrile gradient, and their corresponding peaks in the mass spectrometer and in the online assay were observed (
Identification of inhibitors in snake venoms with the online assay
Previously, we have screened snake venoms for acetylcholine receptors antagonists using online methods. 16 To evaluate the suitability of this method to identify FXa inhibitors from complex mixtures, we used the venom of the snake D. polylepis spiked with argatroban. In addition to argatroban (50 min; 509.25 Da), three inhibitors from the snake venom were detected at 36, 38, and 42 min with masses of 6798.18 Da (m/z 1134.03; charge +6), 3492.76 Da (m/z 874.19; charge +4), and 7208.58 Da (m/z 1202.43; charge +6), corresponding to inhibitor peaks in the online assay at 42, 44, and 48 min, respectively ( Fig. 5 ). These proteins can be purified based on their masses and further characterized for structure, function, and selectivity.
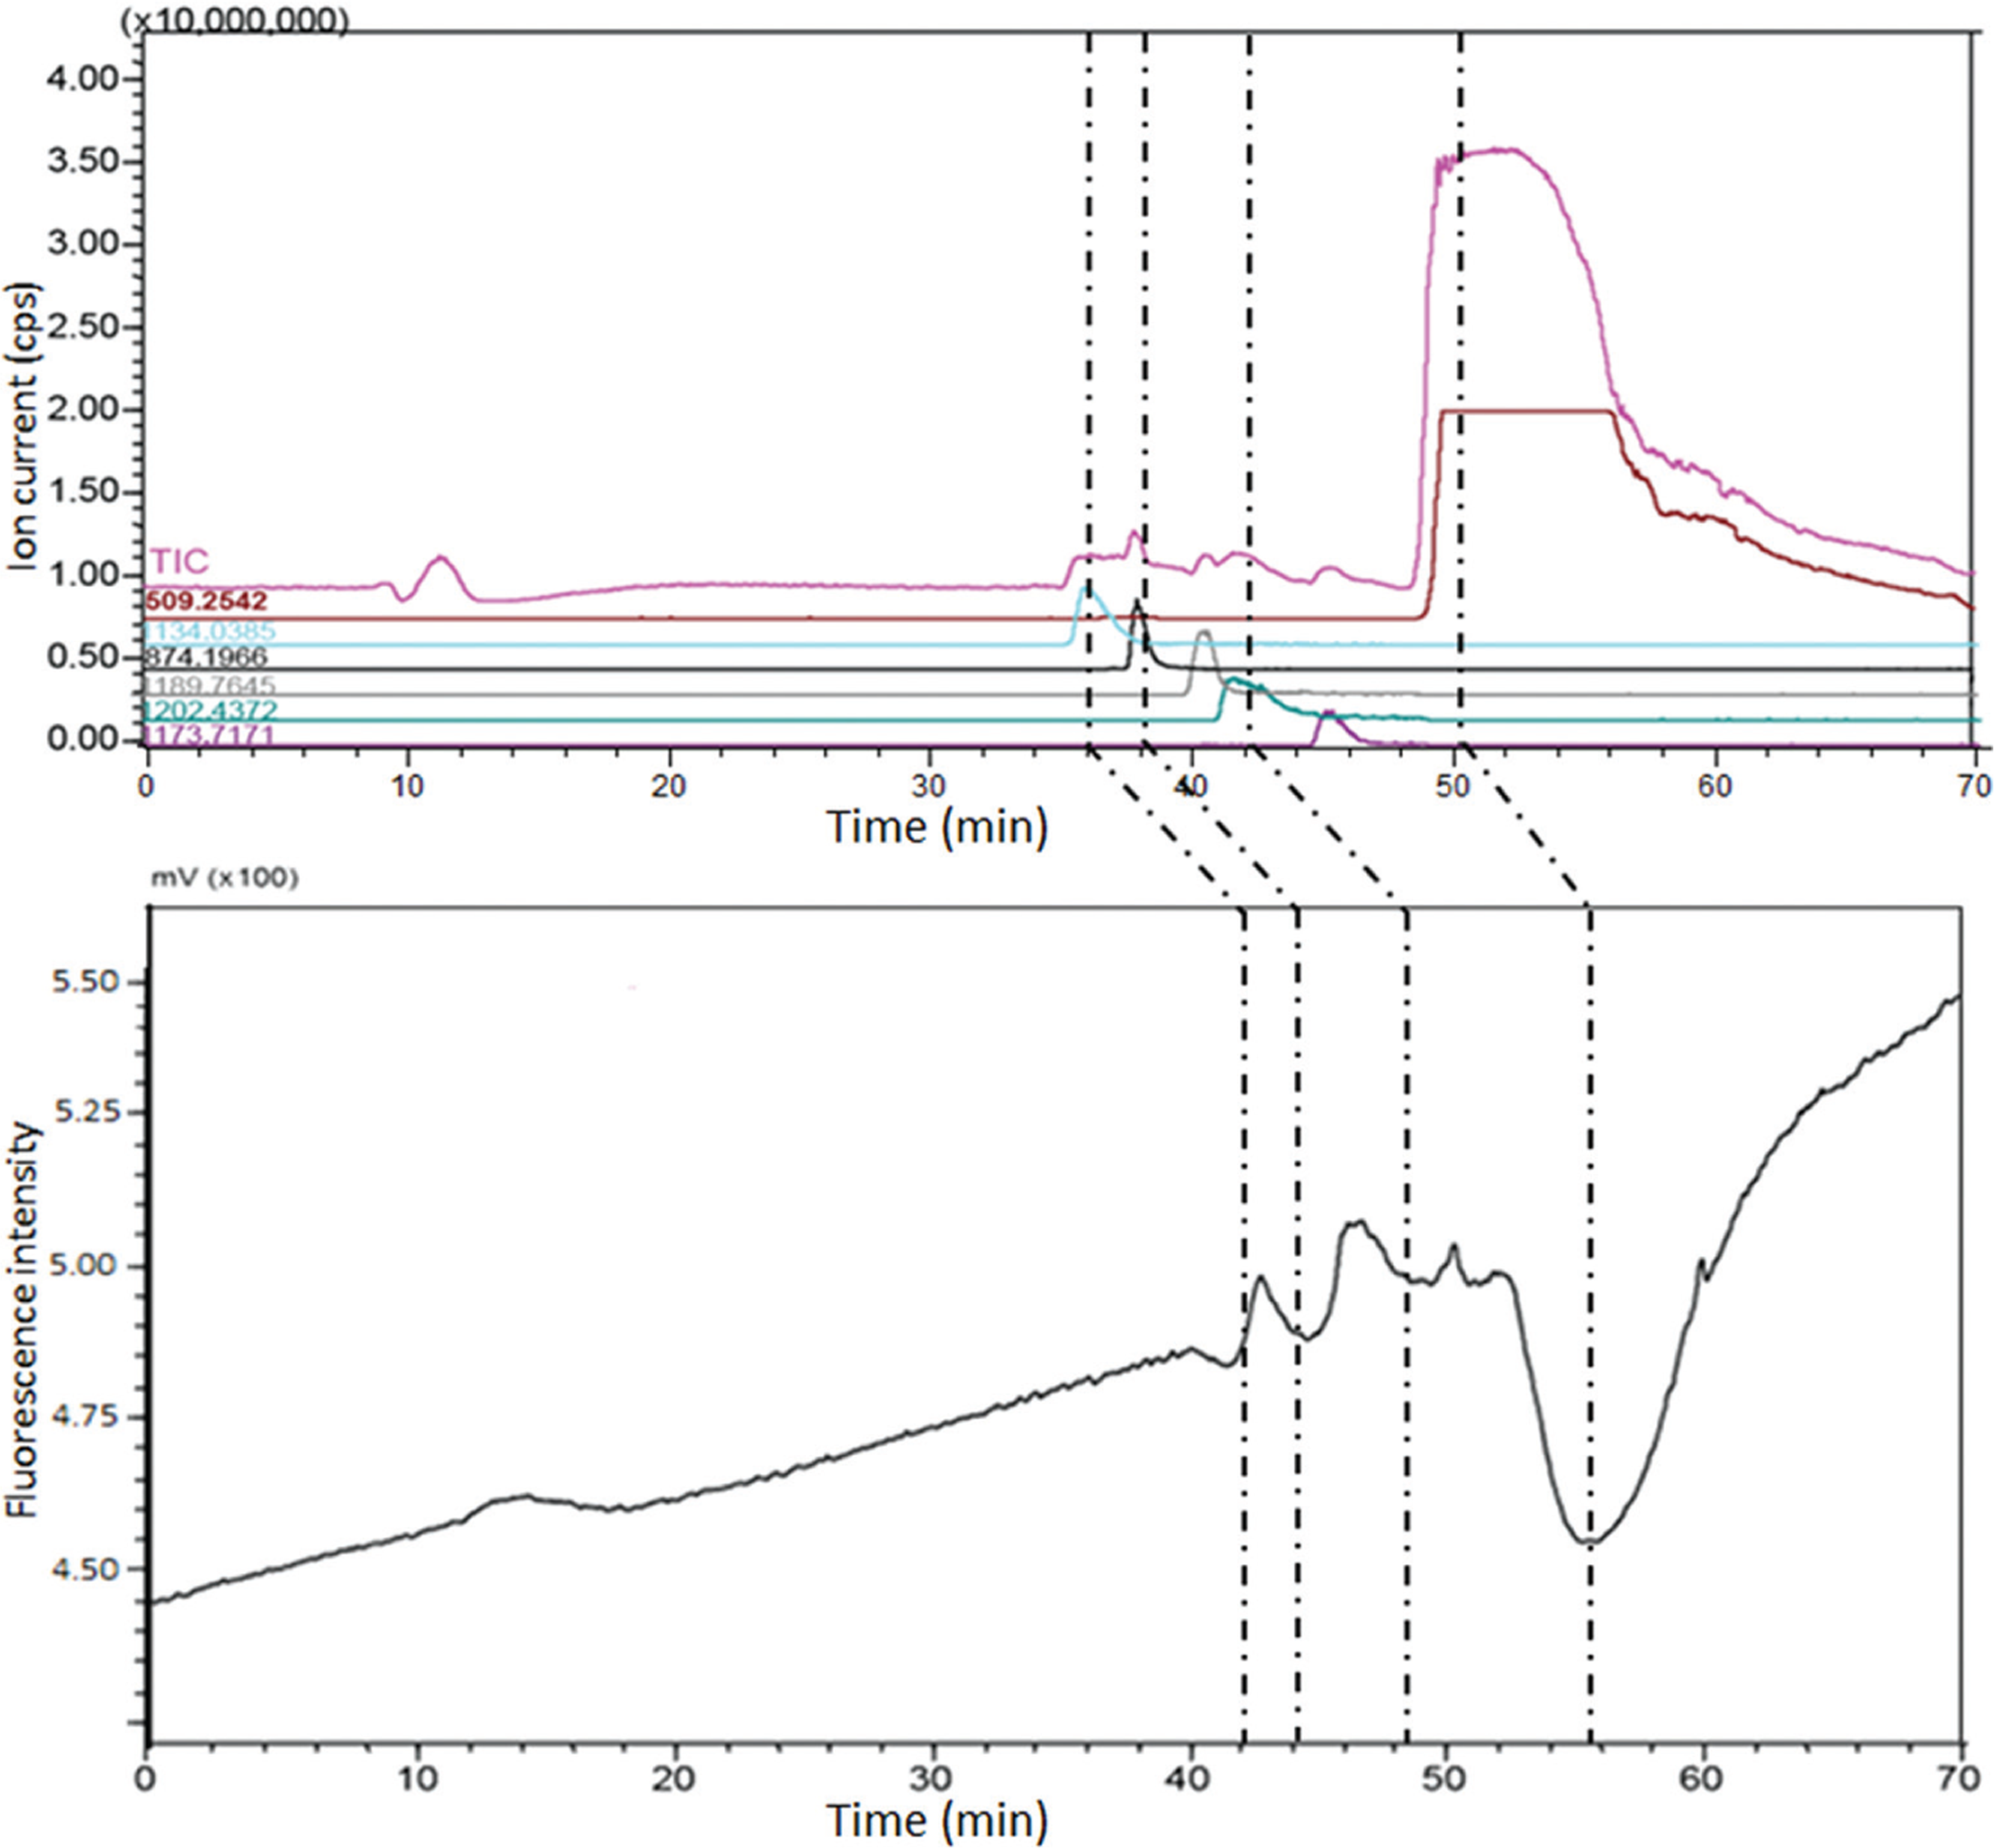
Identification of factor Xa (FXa) inhibitors in Dendroaspis polylepis venom. Crude venom spiked with argatroban was injected in nano–liquid chromatography (LC). Argatroban was detected as a bioactive peak at 56 min with a mass of 509.25 Da at 50 min in the mass spectrometer (MS). In addition, three other FXa inhibitors from the venom were detected at 42, 44, and 48 min in the online assay with masses of 6798.18 Da (m/z 1134.03; charge +6), 3492.76 Da (m/z 874.19; charge +4), and 7208.58 Da (m/z 1202.43; charge +6) at 36, 38, and 42 min, respectively, in the MS.
In conclusion, we have developed a platform for the identification of inhibitors of thrombin and FXa from a mixture of compounds. The robustness of the system was evaluated and optimized to deliver reliable data comparable to the traditional microtiter plate reader assays. This setup was used to identify FXa inhibitors from mixtures such as snake venom.
Footnotes
Acknowledgements
We thank Prof. Wilfried Niessen for his expert opinion on mass spectrometry.
Declaration of Conflicting Interests
The authors declared no potential conflicts of interest with respect to the research, authorship, and/or publication of this article.
Funding
The authors disclosed receipt of the following financial support for the research, authorship, and/or publication of this article: The work of J. K. Iyer was supported by Ministry of Education project “New Factor Xa Inhibitors from Tick Saliva: Structure-Function Relationships” (grant number MOE2010-T2-2-023). The work of R. A. Otvos was supported by the AIMMS Bridging PhD project “Identification of Novel Bioactive Substances on Brain Receptors” (project number 10-001-203).
References
Supplementary Material
Please find the following supplemental material available below.
For Open Access articles published under a Creative Commons License, all supplemental material carries the same license as the article it is associated with.
For non-Open Access articles published, all supplemental material carries a non-exclusive license, and permission requests for re-use of supplemental material or any part of supplemental material shall be sent directly to the copyright owner as specified in the copyright notice associated with the article.