
Abstract
There exist relatively few drug classes on the market to treat dermatophyte infections. This investigation was designed to develop and validate high-throughput methodology for screening and confirmation of chemicals for activity against Trichophyton tonsurans. Growth characteristics were examined on two platforms (96- and 384-well) in three media at eight spore concentrations over a period of up to 120 h. Microspectrophotometry was used to automate plate reads. The 384-well platform was used to screen more than 7000 compounds from six chemical libraries. Z-scores for optical density relative to positive growth controls were used to flag compounds of interest and activity confirmed in separate assays. The final conditions selected for both screening and confirmation with minimum inhibitory concentration (MIC) determination were growth for 48 h at 32 °C in SabDex with 1 × 10⁴ spores per reaction. Sensitivity and specificity averaged 99.2% (range, 95.2%−100%) and 99.8% (range, 99.1%−100%), respectively. MICs for known antifungals were similar to those reported by others using Clinical and Laboratory Standards Institute methods. Several novel compound classes were identified to have activity against T. tonsurans with potency comparable to known antifungals. A robust, reproducible assay is described that permits high-throughput screening in T. tonsurans.
Keywords
Introduction
The dermatophyte Trichophyton tonsurans has integrated into metropolitan communities with striking prevalence. Rates of symptomatic and asymptomatic scalp infection in preschool-aged African American children collectively exceed 30%, trending downward to an average rate of 8% by the time these children reach 10 to 12 y of age.1,2 The large degree of genetic heterogeneity observed among isolates recovered from these communities further supports the endemic nature of these infections in this young, largely underserved population. 3
Unexpectedly, the ability of existing treatment options to eradicate these infections effectively is markedly lower than would be predicted based on clinical trial outcomes. 4 A longitudinal study incorporating molecular fingerprinting of serially collected isolates pre- and posttreatment revealed that less than 25% of children clear the pathogen from their scalp after a single 6 to 8 wk course of treatment with the gold standard drug (griseofulvin) and less than 50% clear the pathogen with 2 or more courses of treatment. 4 These data argue that new treatments, and perhaps new treatment strategies, are required to manage these infections effectively.
The currently accepted approach for examining antifungal activity in dermatophytes involves culture in 96-well plates followed, after 4 to 5 days of growth, by visual inspection of the plates to determine a minimum inhibitory concentration (MIC). 5 Although effective, this approach is not ideally suited for large-scale screening. This article describes a high-throughput method, with automated detection, for screening chemicals against T. tonsurans in a 384-well format after 2 days of incubation. We also describe an auxiliary method for confirmation, MIC determination, and checkerboard testing. Finally, the application of these methods for the screening and identification of new antifungal candidates is detailed.
Materials and Methods
Isolates
A total of 14 T. tonsurans isolates representing five genetically distinct strain types were obtained from a previous investigation. 1 For quality control purposes, additional dermatophytes used in this study included the Clinical and Laboratory Standards Institute (CLSI) reference strains of Trichophyton mentagrophytes (ATCC MYA-4439) and Trichophyton rubrum (ATCC MYA-4438), along with a strain of Trichophyton equinum maintained in our culture collection from an earlier investigation. 3 All isolates were sequence confirmed using the rRNA gene locus and preserved on silica gel stocks as previously described. 5 Isolates were expanded by plating onto either Sabouraud’s dextrose agar (SabDEX; Difco) or potato dextrose agar (PDA; Difco) and cultured at room temperature for 14 d to ensure viability and purity.
Preparation of Spore Suspensions
Isolates were subcultured onto SabDEX or PDA plates and grown at room temperature for a minimum of 14 days, or until sufficient spore density was achieved as verified by scotch tape preparations. Purified spore suspensions were prepared according to previous methods with slight modifications. Briefly, confluent plates were flooded with 10 mL of sterile phosphate-buffered saline (PBS) and the surface gently scraped with a sterile inoculating loop to detach both hyphae and spores. This mixture was transferred to a 15 mL conical tube and briefly vortexed. Filtration through two layers of sterile gauze was sufficient to separate microconidia from hyphal fragments. Spore preparations were centrifuged at 2123g for 10 min (AccuSpin 1R table-top centrifuge with swing-out rotor; Fisher Scientific), washed twice with sterile PBS, and resuspended in a sufficient quantity of PBS to arrive at the desired working concentrations (determined using a hemocytometer).
Determining Optimal Culture Conditions
For quality control purposes, initial culture conditions were established in a 96-well format using CLSI-recommended methods for dermatophytes in order to replicate previously published findings. These included RPMI-1640 medium (Sigma Chemical Company, St. Louis, MO) inoculated with 1 to 3 × 10³ spores per milliliter and incubated at 35 °C for 4 d. 5
To optimize culture conditions for higher-throughput applications in both 96- and 384-well formats, growth characteristics were examined by varying medium, spore concentration, and time in culture. Media included RPMI-1640, SabDEX broth (DIFCO), and keratin-supplemented yeast nitrogen base (YNB) all prepared to a final 2× concentration. RPMI was prepared as described in CLSI reference guidelines M38-A2 for filamentous fungi. 5 SabDEX broth was prepared by dissolving 60 g of Sabouraud dextrose broth powder (Becton Dickinson, Sparks, MD) in 1 L of water and sterilized by autoclaving. YNB was prepared by making a 1:5 dilution from a 10× stock containing 1.7 g YNB, 50 mg chloramphenicol, 500 mg cycloheximide, and 5 g keratin powder.
Spore concentrations ranged from 0.5 × 10³ to 1 × 10⁶ spores per well. Time in culture was examined at 8 to 12 h intervals for up to 120 h depending on the experiment. Flat-bottomed 96-well and 384-well microplates (Fisher Scientific) were used with final culture volumes of 200 µL and 70 µL, respectively. All plates were sealed with EDGE biofilm (EDGE Biosystems), to minimize evaporation, and incubated without agitation at 32 °C. Uninoculated 2X medium containing solvent was diluted 1:1 with sterile PBS and served as a negative growth control to generate background values for optical density calibrations. Growth control wells without drug but with DMSO were inoculated with spore suspension to control for solvent effect and to provide a 100% growth value for inhibition calculations.
Growth was measured using in situ microspectrophotometric methods. Optical density (OD) readings were generated for 96-well plates by scanning each well in a 5 × 5 grid pattern at 600 nM on a Synergy HT plate reader (BioTek). These area scan measurements were used to compensate for variations in fungal density occurring within each well. To avoid edge effects, only the interior 3 × 3 grid was used to generate an average OD for each well. OD values were averaged across replicate wells to generate a mean OD for each isolate at each time point. Area scans were not possible in the reduced-capacity 384-well plates, so growth was measured using a single-point read.
Screening and Confirmation
The compounds screened for activity against T. tonsurans derived from six collections: (1) MicroSource Spectrum collection (n = 2112; MicroSource Discovery Systems, Gaylordsville, CT), (2) Prestwick Chemical Library (n = 1200 compounds; Prestwick Chemical, Illkirch, France), (3) Enzo FDA-approved drug library (n = 640; Enzo Life Sciences, Farmingdale, NY), (4) Selleck Bioactive compound library (n = 31; Selleck Chemicals, Houston, TX), (5) National Institutes of Health clinical collection (n = 462; NIH, Bethesda, MD), and (6) The University of Kansas Center of Excellence in Chemical Methodologies & Library Development (n = 3376; Lawrence, KS). Compounds selected for confirmatory screening were purchased from Sigma-Aldrich (St. Louis, MO), LKT Laboraatories (St. Paul, MN), or Toronto Research Chemicals (Toronto, Canada).
All compounds were delivered in DMSO at volumes intended to result in a final incubation concentration of 0.5% DMSO. Each plate included 16 positive growth controls, eight negative growth controls, four wells spotted with a high-potency antifungal (1.4 µM itraconazole), and four wells containing a moderate-potency antifungal (2.8 µM griseofulvin), the latter of which represents the current gold standard for treatment of children with T. tonsurans infections. Plates were cultured as described above, and all wells were visually inspected for bacterial contamination and other physical changes (e.g., color change) prior to reading.
Spotting of compounds was accomplished using the ECHO Liquid Handler 555 (Labcyte, Sunnyvale, CA). Growth medium and spore suspensions were delivered into the wells using the Multi-Flo automatic dispenser (BioTek). All screening was performed in a 384-well format at a fixed drug concentration of 10 µM. Confirmation with concurrent determination of MIC was performed in a 96-well format at initial concentrations ranging from 0.01 to 10 µM. Lower concentrations were reexamined, as necessary, to accommodate the more potent drugs. Checkerboard testing was also conducted in a 96-well format with concentration ranges that flanked the MIC of the respective drugs.
Data Analyses
OD values in the screening assays were examined unadjusted. The Z′ factor was calculated for each plate to determine how well it performed in the screen by examining the mean (µ) and standard deviation (σ) of both the positive and negative controls according to Z′ factor = 1 – [(3*(σpos – σneg))/|µpos – µneg|]. The z-score for each sample was used to flag compounds of interest for further investigation according to z-score = (ODsample – µODpos)/σODpos, with −5 set as the threshold. Sensitivity and specificity using the z-score approach were examined by spotting known compounds with antifungal activity (itraconazole, fluconazole, griseofulvin, terbinafine, ciclopirox, cicloprioxolamine, ketoconazole, voriconazole) and without antifungal activity (ampicillin, acetaminophen, diclofenac, cycloheximide, amitriptyline, digitonin, chloramphenicol, chlorozoxazone, valproic acid) at two different concentrations on 10 different plates over 3 different days and examining their activity against five different strains of T. tonsurans. Sensitivity was determined by calculating the ratio of the true-positives to the true-positives plus the false-negatives. Specificity was determined by calculating the ratio of the true-negatives to the true-negatives plus the false-positives.
OD values for all other assays were blank subtracted, and the adjusted OD values were used to examine growth patterns in the presence and absence of inhibitors. MIC50 values were determined after fitting the log concentration versus OD data to a four-parameter Gompertz function according to [y = a + (b – a) * exp (–exp (–c * (x – d)))], where a represents the lower asymptote, b represents the upper asymptote, c represents the growth rate, and d represents the inflection point. Microsoft Excel was used to execute the fittings.
Results and Discussion
Growth Characteristics
Initial conditions were examined in a 96-well format. Twenty-four replicates of a single-strain of T. tonsurans were inoculated in RPMI, SabDEX, and YNB media at 1 × 10⁴ spores to examine growth characteristics. Both SabDEX and RPMI demonstrated the shortest lag phase, ranging from 6 to 8 h. In contrast, the lag phase in YNB exceeded 24 h. Importantly, intra-strain variability in growth demonstrated marked differences between media. SabDex demonstrated the smallest coefficients of variation through the first 48 h of growth (<5%) as compared with YNB (8%−11%) and RPMI (4%−18%).
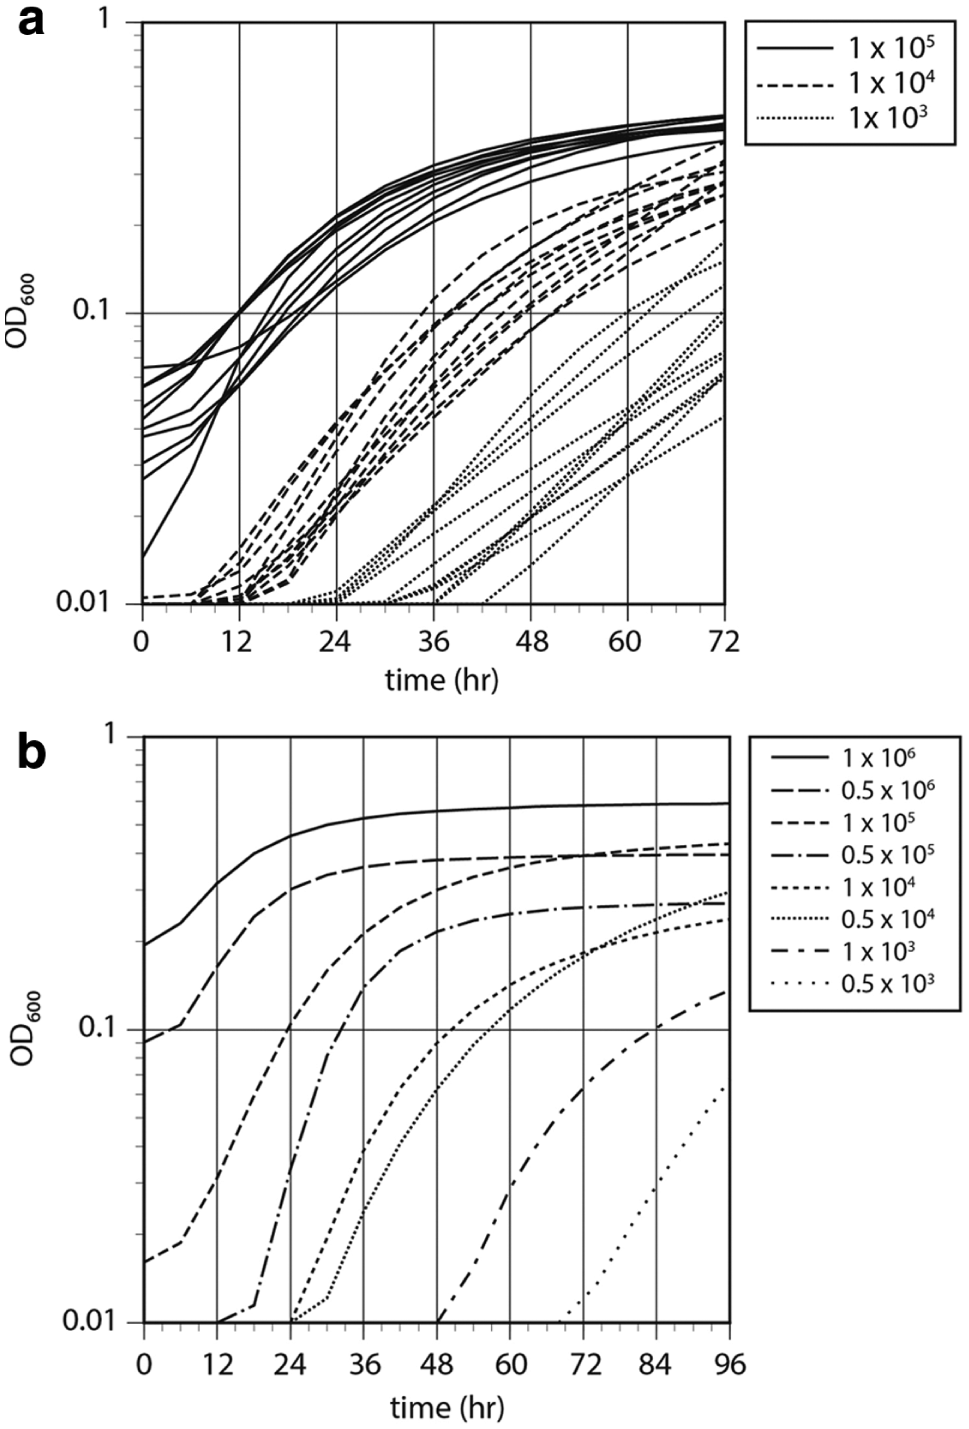
Given the delayed nature of T. tonsurans growth in YNB, SabDEX and RPMI were selected for further optimization. Eleven distinct strains of T. tonsurans were inoculated into both media at concentrations of 1 × 10⁵, 1 × 10⁴, and 1 × 10³ spores per reaction well and cultured for 72 h. In SabDEX, all isolates were in log-phase growth by 18, 24, and 48 h for the 1 × 10⁵, 1 × 10⁴, and 1 × 10³ inoculums, respectively ( Fig. 1a ). In RPMI, the corresponding times for all isolates to transition into log-phase were 33 and 60 h for the 1 × 10⁵ and 1 × 10⁴ concentrations, respectively. At an inoculum of 1 × 10³, the majority of T. tonsurans strains remained undetectable or in lag-phase at the conclusion of the experiment. These medium-specific findings are consistent with previous publications wherein a considerable latency phase (up to 105 h) was observed for dermatophytes when grown in RPMI-1640.6,7 RPMI may be sufficient for standard in vitro susceptibility testing, but it does not appear to support rapid, high-throughput assay development.
(
Given the rapid, abundant, and reproducible nature of T. tonsurans growth in SabDEX, this medium was used for optimization in a higher-throughput format. A single, representative T. tonsurans strain was selected for growth assessment in the 384-well format. The transition from lag- to log-phase growth at various inoculum concentrations is depicted in Figure 1b . We observed no indication of a decrease in robustness or reproducibility in the 384-well format, although baseline OD values were measurable at time zero with the highest concentrations. In addition, we saw no reduction in OD as a result of the inability to use area scans in the reduced-capacity wells. Consequently, the final conditions selected for all assays was growth for 48 h at 32 °C in SabDex with 1 × 10⁴ spores per reaction.
Our investigations revealed that inoculum concentrations at least a full order of magnitude greater than those suggested by CLSI are required to support high-throughput applications. The selected inoculum concentration provided adequate growth in 48 h without a positive OD signal at time 0, which was seen at the highest concentrations we examined. We did demonstrate that antifungal activity could be determined in less than 24 h by further increasing the starting inoculum; however, the number of culture plates required to accommodate the spore quantities needed for these conditions would be prohibitive when screening sizable libraries.
A final distinction between our growth conditions and those recommended by CLSI is the incubation temperature. We noticed no difference in growth at 32 °C and, importantly, experienced substantially less evaporation as compared with the recommended 35 °C, which effectively reduced culture volumes by greater than 50% in our experiments. The use of a plate seal further restricted evaporation, thereby preventing concentration of the medium and its components during the culture period.
We did examine whether use of the fluorometric indicator resazurin (7-hydroxy-3H-phenoxazin-3-one 10-oxide) could be used to streamline our assay but concluded that the minor increase in sensitivity afforded by this dye did not appreciably offset the additional delivery step and incubation time required for this approach. Similarly, we recognize that other investigators have reduced screening times by adopting methods that measure intracellular ATP levels. However, these methods can be cost prohibitive for academic laboratories.
Across all 384-well test plates, sensitivity and specificity under the conditions described above averaged 99.2% (range, 95.2%−100%) and 99.8% (range, 99.1%−100%), respectively. The MIC values generated under these conditions are comparable to those reported by other investigators.8–13
Screening and Confirmation
A total of twenty-six 384-well plates were spotted with test compounds. The average Z′ factor was 0.782 (range, 0.708–0.898). The average z-score for itraconazole was −14.8 (range across all plates, –30.4 to −10.3) and for griseofulvin was −10.1 (range, −23.6 to −5.5). In total, 276 wells demonstrated a z-score for the absolute OD value less than −5 relative to positive growth controls, and 115 of these demonstrated a z-score for the absolute OD value less than −10 ( Fig. 2 ).
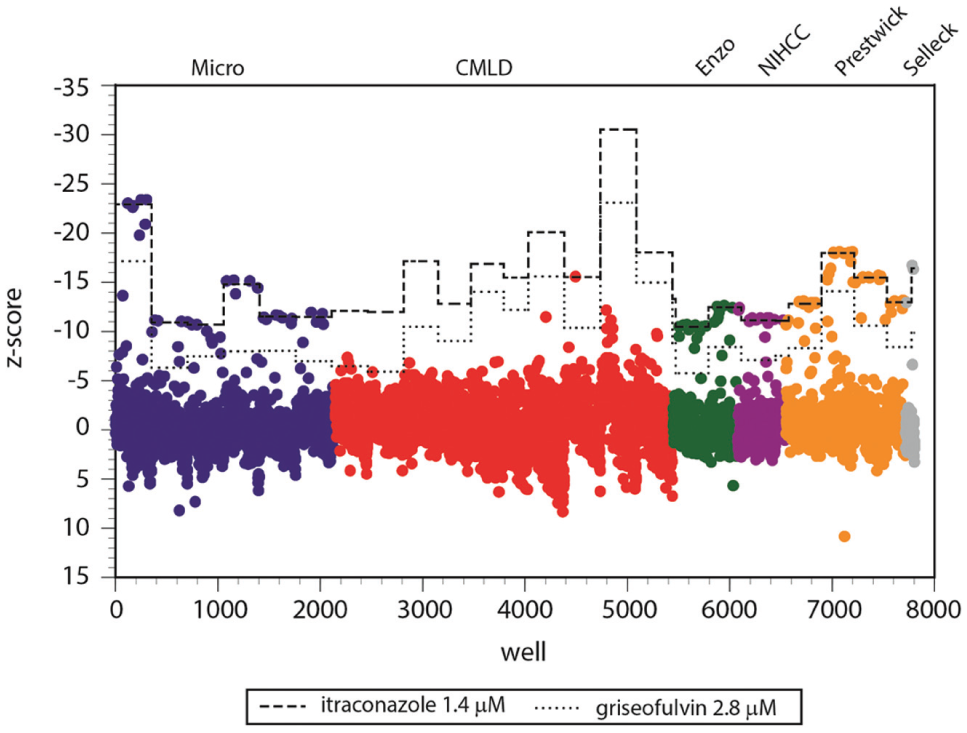
Z-scores for individual wells (relative to positive growth controls on the corresponding plate) in a high-throughput screen for activity against T. tonsurans. Dashed lines represent the average z-score for itraconazole on each plate. Dotted lines represent the average z-score for griseofulvin on each plate. Symbol colors depict the compound library from which the chemical arose.
All known antifungals contained in the compound libraries we examined “hit” in our assay. However, additional compounds not routinely considered for their antifungal activity were also identified. After removing replicate hits and unidentified novel compounds synthesized at the University of Kansas, 105 unique compounds corresponding to 41 broad classes of drugs remained ( Table 1 ). Importantly, we observed 100% agreement between plates such that all replicate compounds spotted onto different plates resulted in the same call. All positive hits were subsequently spotted onto a 96-well plate for confirmation and MIC determination. Seventy compounds demonstrated an MIC <1 µM, which was within onefold dilution of griseofulvin, and these are highlighted in Table 1 .
Compounds in the high-throughput screen with activity against T. tonsurans. a
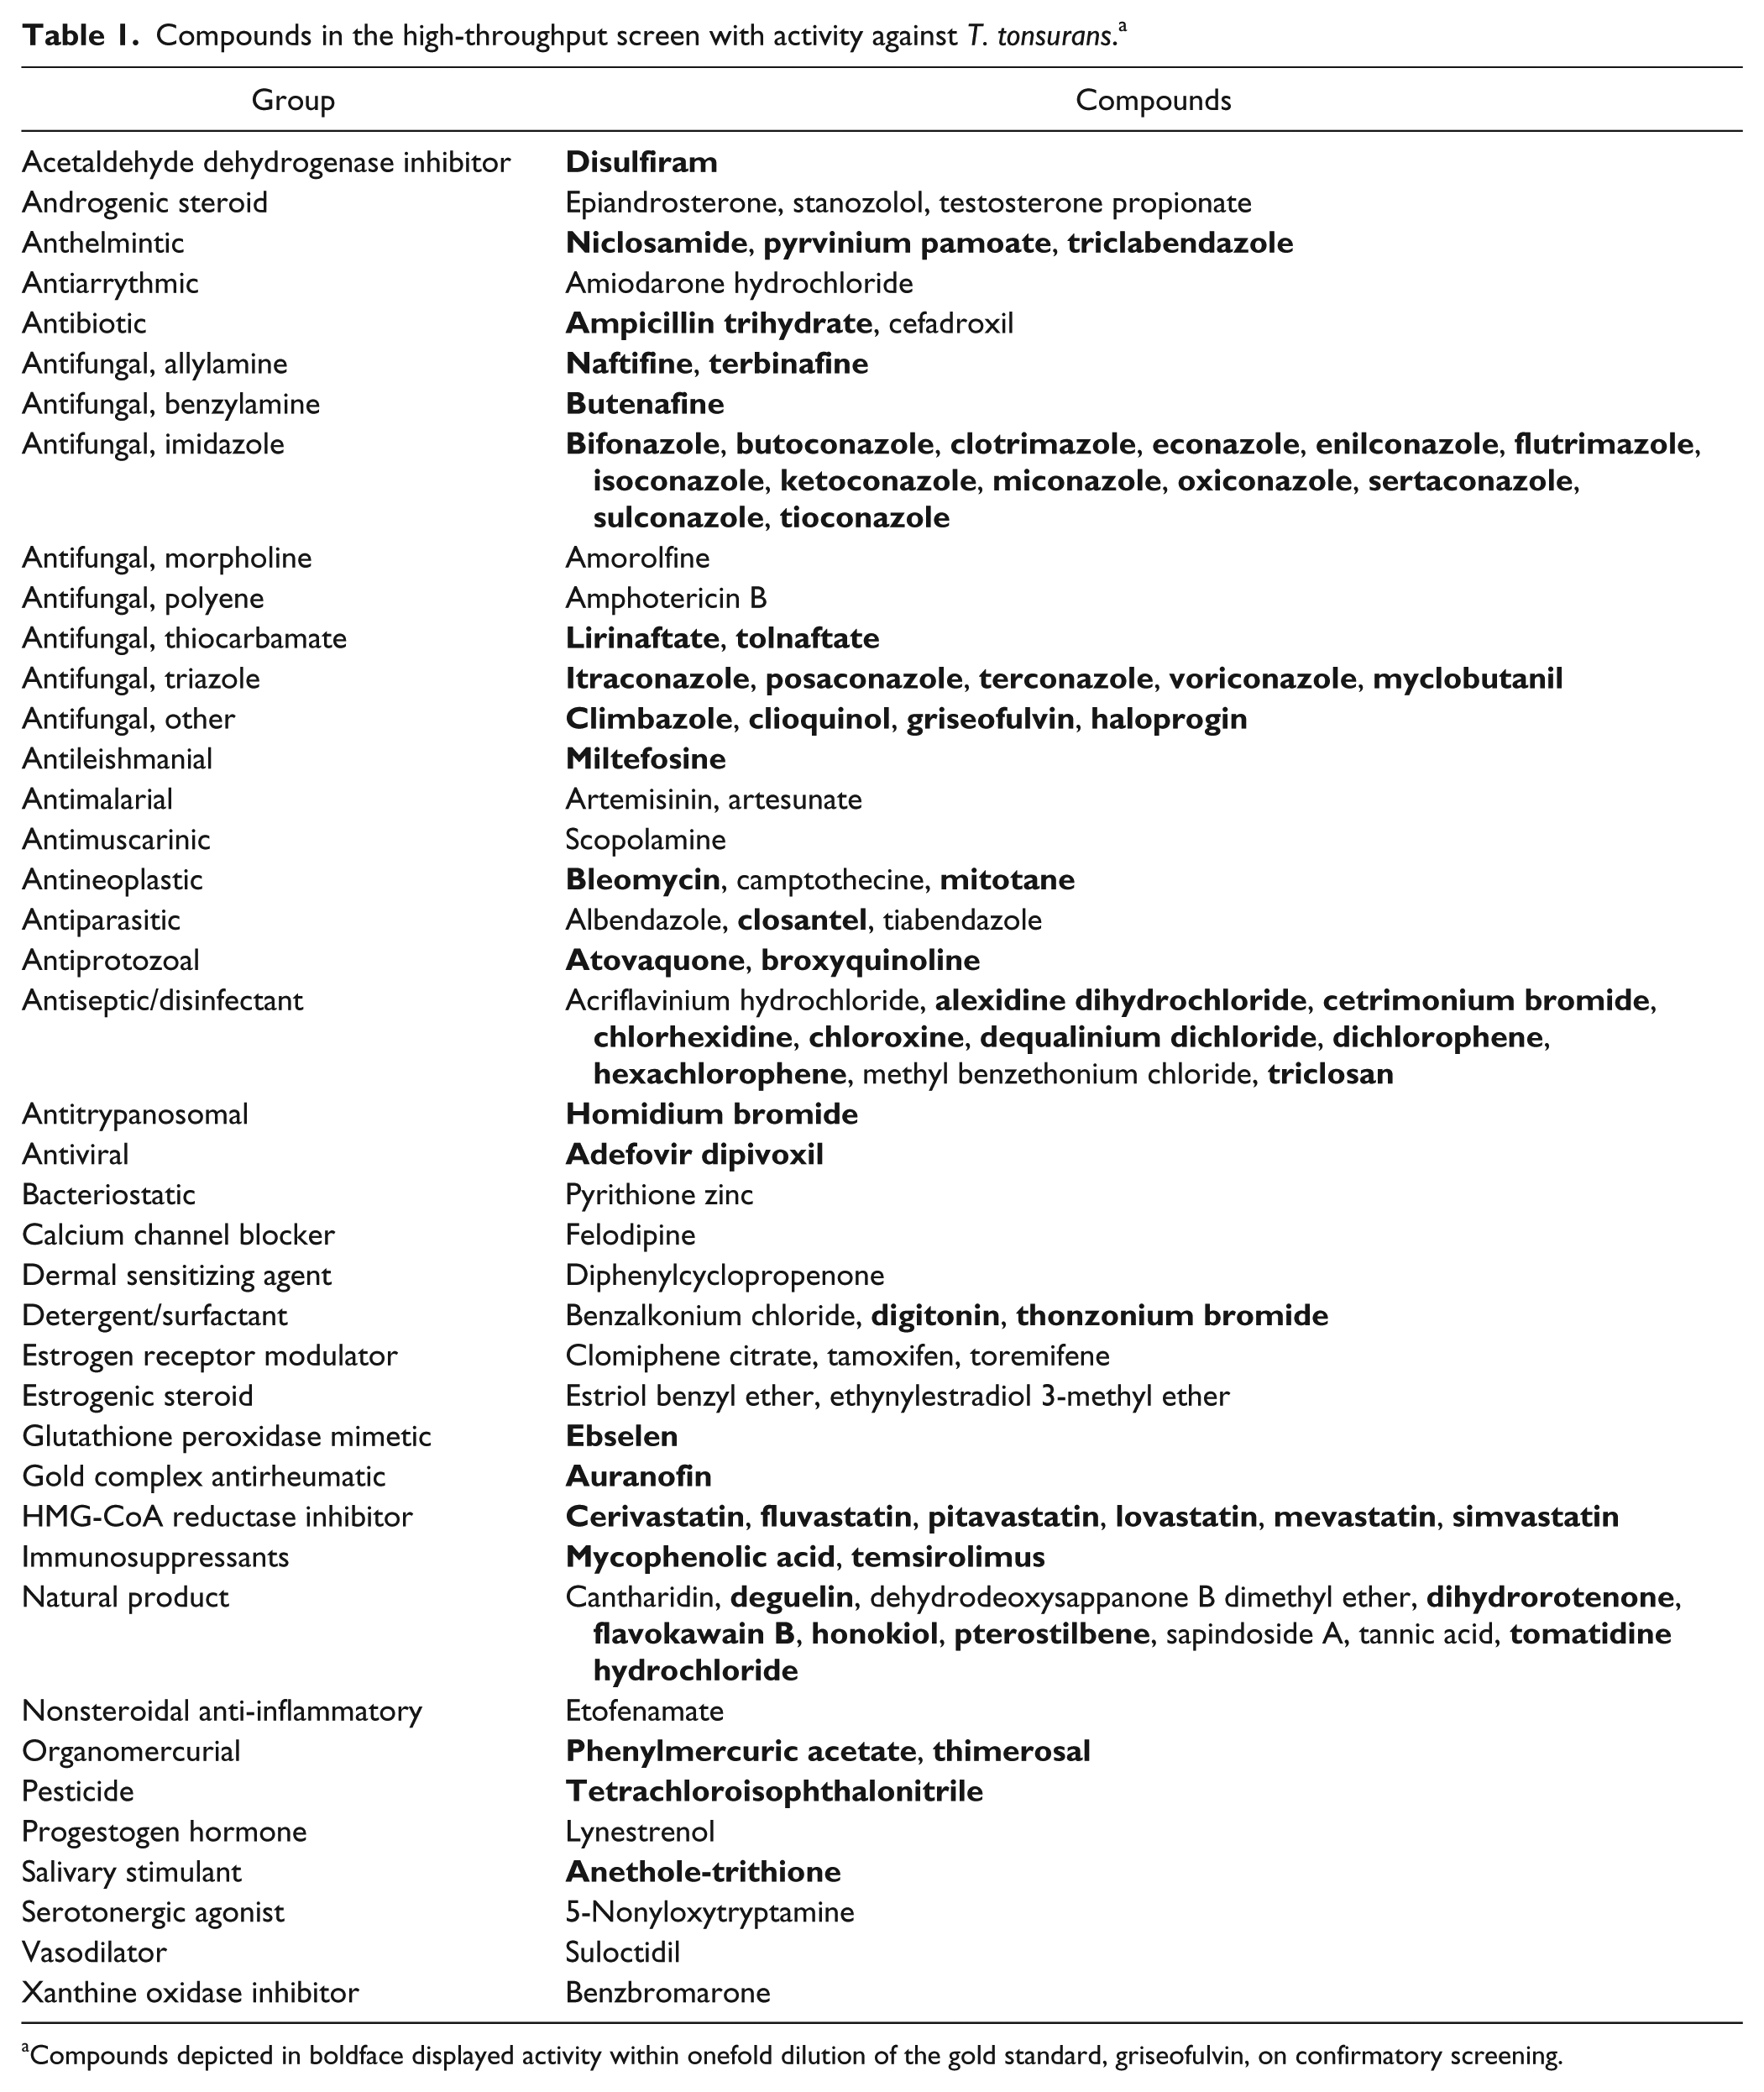
Compounds depicted in boldface displayed activity within onefold dilution of the gold standard, griseofulvin, on confirmatory screening.
Notably, several members of the HMG-CoA reductase class of compounds triggered in the initial screen. Given that these agents have not been previously characterized for their antifungal activity, we elected to evaluate all members of this class including newer synthetic agents and active metabolites that were not included on the initial screen. Of these, cerivastatin, pitavastatin, and simvastatin acid demonstrated the greatest potency with median (range) MIC50 values of 0.01 µM (0.003–0.058 µM), 0.03 µM (0.003–0.032 µM), and 0.03 µM (0.024–0.062 µM), respectively, in five strains of T. tonsurans. The rank order MIC50 for the remaining agents was atorvastatin < rosuvastatin < fluvastatin << mevastatin < lovastatin < simvastatin < 3″-hydroxy simvastatin acid < 6′-hydroxymethyl simvastatin acid << pravastatin. The metabolites, 3″-hydroxy simvastatin, 3′,5′-dihydrodiol simvastatin, and 6′-hydroxymethyl simvastatin showed no activity in our system.
We further examined whether our methods supported checkerboard testing. Cerivastatin (0.01–2.5 µM), pitavastatin (0.02–2.5 µM), and simvastatin acid (0.02–2.5 µM) were each examined with naftifine (0.001–1.25 µM) and miconazole (0.04–10 µM). Isobolograms created with an inflection point set at 80% demonstrated that all combinations were synergistic in their activity against T. tonsurans.
CLSI Reference Strains
To evaluate the broader application of these methods to other dermatophytes, we evaluated the behavior of T. mentagrophytes, T. rubrum, and T. equinum in our system (n = 24 replicates each). As was observed with T. tonsurans, the lag phase was shortest, the intra-strain variability lowest, and the growth more robust in SabDex as compared with YNB and RPMI. However, the MIC values for known antifungals generated under these conditions were within one to two dilutions of the values reported in other investigations that employed the CLSI methods. Notably, per developers of the CLSI guidelines, MIC values generated between laboratories for dermatophytes are generally considered to be in agreement if they fall within three dilutions. 14
The inhibitory activity of the 3 lead HMG-CoA reductase inhibitors were not wholly concordant among the species of Trichophyton that were tested. Both zoophilic species (T. equinum and T. mentagrophytes) displayed MIC50 values within a one-fold dilution of those observed with T. tonsurans; however, T. rubrum was less susceptible to these agents, with MIC50 values of 0.068 µM, 0.147 µM, and 0.303 µM for cerivastatin, pitavastatin, and simvastatin acid, respectively. Further, T. rubrum required an additional 24 h of incubation for adequate growth.
T. tonsurans infection rates in our youngest children are on par with those observed in developing countries. 15 Such striking infection rates would raise fewer concerns if current treatment strategies efficiently eradicated the organism; however, the effectiveness observed with these agents in clinical practice fails to mirror the efficacy reported in clinical trials. Accordingly, pediatricians are left with inadequate drug regimens and little prospect of more effective agents finding their way to market. 15 The high-throughput methods described in this article should facilitate the identification of newer, more effective antifungal agents that can be used to support comprehensive control strategies that integrate prevention, treatment, and environmental remediation.
Footnotes
Acknowledgements
We are grateful to Drs. Rangaraj Selvarangan and Jennifer Goldman for their thoughtful review of this article.
Declaration of Conflicting Interests
The authors declared no potential conflicts of interest with respect to the research, authorship, and/or publication of this article.
Funding
The authors received no financial support for the research, authorship, and/or publication of this article.