
Abstract
Here, we describe an approach to identify novel selective estrogen receptor downregulator (SERD) compounds with improved properties such as oral bioavailability and the potential of increased efficacy compared to currently marketed drug treatments. Previously, methodologies such as Western blotting and transient cell reporter assays have been used to identify and characterize SERD compounds, but such approaches can be limited due to low throughput and sensitivity, respectively. We have used an endogenous cell-imaging strategy that has both the throughput and sensitivity to support a large-scale hit-to-lead program to identify novel compounds. A screening cascade with a suite of assays has been developed to characterize compounds that modulate estrogen receptor α (ERα)-mediated signaling or downregulate ERα levels in cells. Initially, from a focused high-throughput screening, novel ERα binders were identified that could be modified chemically into ERα downregulators. Following this, cellular assays helped determine the mechanism of action of compounds to distinguish between on-target and off-target compounds and differentiate SERDs, selective estrogen receptor modulator (SERM) compounds, and agonist ERα ligands. Data are shown to exemplify the characterization of ERα-mediated signaling inhibitors using a selection of literature compounds and illustrate how this cascade has been used to drive the chemical design of novel SERD compounds.
Introduction
Estrogen receptor α (ERα, or ESR1) is a 17β-estradiol-activated steroid receptor member of the nuclear receptor superfamily of transcription factors.1,2 ERα is expressed in the majority of breast tumors and as such is the primary therapeutic target for drug intervention. 3 Drugs directly antagonizing ERα-mediated signaling such as tamoxifen 4 and fulvestrant5,6 are widely used in breast cancer treatment; however, some ERα-positive breast cancers exhibit intrinsic resistance, and others acquire resistance to these therapies via a variety of mechanisms.7,8 Tamoxifen was subsequently shown to be both an antagonist of ERα signaling in breast tissue and a partial agonist in endometrium, leading to it being classified as a selective estrogen receptor modulator (SERM). 9 In contrast, fulvestrant was first described as a pure anti-estrogen, because it lacked any partial agonist properties, then was identified as a selective estrogen receptor downregulator (SERD), being able to antagonize ERα-driven tumor cell growth but also degrading ERα levels via a proteasomal mechanism.10,11
Fulvestrant has very low oral bioavailability among species 12 and is administered as a monthly intramuscular implant at a dose of up to 500 mg. 13 The clinical efficacy of fulvestrant is believed to be limited because less than a 50% ERα reduction has been detected in patient samples, 14 compared to the complete receptor downregulation seen in in vitro breast cell line experiments. 15 Other SERD molecules have also been identified and described;16–18 however, these also have low predicted oral bioavailability. A potent, orally bioavailable SERD could have potential for significantly increased receptor knockdown compared to fulvestrant due to higher exposure with an expected increase in clinical efficacy. Our aim was to identify such a molecule with novel motifs and drug-like properties through a directed ERα binding screen that could then be optimized for cellular phenotype and potency.
Because multiple mechanisms of cellular ERα downregulation are known, we needed to develop a suite of assays able to discriminate on-target from off-target effects or agonist-induced downregulation, with sufficient throughput to meet the needs of the medicinal chemistry campaign. In addition to ERα downregulation in a manner analogous to that of fulvestrant, ERα agonist-induced downregulation,19,20 effects on ERα levels and stability via inhibition of heat shock protein 90 (HSP90), 21 kinase signaling pathways,22,23 histone deacetylases (HDACs), 24 and bromodomain extra terminal (BET) family proteins 25 have been described.
In this article, we describe in detail the biochemical and cellular cascade that has enabled the discovery and optimization of a novel orally bioavailable SERD series. In future publications, the detailed pharmacology and chemistry lead optimization program will be disclosed.
Materials and Methods
High-Throughput Compound Library Screening
Binding to the ERα protein was assessed using a LanthaScreen ERα TR-FRET (time-resolved fluorescence resonance energy transfer) Competitive Binding Assay from Life Technologies (Carlsbad, CA). Test compounds from the AstraZeneca compound collection were dissolved in DMSO to form 10 mM stock solutions. The compounds were then acoustically dispensed into black 384-well nonbinding plates (#784900; Greiner Bio-One, Stonehouse, UK) using an Echo 555 (Labcyte, Sunnyvale, CA) to prepare assay-ready plates. A final concentration of 1% (v/v) DMSO and 10 µM test compound was achieved after reagent additions. A Velocity 11 Biocel automated system (Agilent Technologies, Santa Clara, CA) with a V-stack, V-prep pipetting station, plate carousel, V-spin plate centrifuge, and BMG PheraSTAR plate reader (BMG Labtech, Ortenberg, Germany) was used to run the assay. To the assay-ready compound plates, 6 µl of the Fluormone ES2 Green reagent (#P2645, Life Technologies) was dispensed into all wells, and the plate was spun briefly at 1500 rpm. The tips were then changed, and 6 µl of glutathione-S-transferase (GST) tagged ERα ligand binding domain (#PV4543, Life Technologies) and Tb-anti-GST antibody (#PV3552, Life Technologies) were dispensed into each well of the assay plates. The plates were spun and then incubated for 1 h at room temperature. Plates were run in batches of 50 with the addition of four control plates per run, positioned throughout the batch. The control plates provided minimum-signal, maximum-signal, and reference compound wells containing 3 µM tamoxifen (a concentration of 60 × IC50), DMSO, and 0.05 µM tamoxifen (the IC50 concentration), respectively. The TR-FRET emission ratios were acquired on a BMG PheraSTAR plate reader with an excitation wavelength of 337 nm and emission wavelengths of 490 nm and 520 nm. Data were analyzed using Hbase proprietary AstraZeneca software analysis using an in-house wavelet-based pattern correction algorithm. This was applied to correct for any potential spatial patterns on plates and temporal patterns during the time of the run. 26 Concentration response screening to follow up the high-throughput screening (HTS) was performed on selected compounds using 8-point, half-log concentration response curves, with a top concentration of 100 µM.
ERα LanthaScreen Assay to Measure ERα Binding
A LanthaScreen ERα binding assay was used as detailed in the “High-Throughput Compound Library Screening” section except that reagent was dispensed using a BioRAPTR liquid handler (Beckman Coulter, High Wycombe, UK). Assay-ready compound plates were prepared to provide a 12-point half-log concentration–response curve (100 µM top concentration) in a final volume of 120 nl and with a consistent DMSO concentration of 1%.
Measurement of Endogenous ERα and PR Levels in a Multiplexed Cell Assay
The MCF-7 human breast ductal carcinoma cell line from the American Type Culture Collection (ATCC; HTB-22) was revived directly from a cryovial in phenol red–free Dulbecco’s modified Eagle’s medium (DMEM) containing 2 mM L-glutamine and 5% (v/v) charcoal/dextran-treated fetal calf serum (FCS). Cells were seeded into black, transparent-bottomed, 384-well plates, at 1500 cells per well in a volume of 40 µl using a Multidrop Combi dispenser (Thermo Scientific, Waltham, MA). Cell plates were incubated for 24 h at 37 °C, 5% CO2. An Echo 555 acoustic dispenser was used to dispense test compounds directly into cell plates producing a 12-point half-log duplicate concentration range (30 µM or 3 µM top concentration). DMSO was dispensed in the maximum-signal control wells to give a final concentration of 0.3% (v/v), and fulvestrant was dispensed in the minimum-signal control wells to give a final concentration of 100 nM. Cells were incubated for 18–24 h at 37 °C, 5% CO2, and then fixed using a 3.7% (v/v) final formaldehyde concentration for 20 min. The cells were washed three times with 250 µl phosphate buffered saline (PBS) solution using a BioTek ELx405 plate washer (BioTek Instruments, Winooski, VT), and 50 µl of PBS was added to all wells. The PBS was aspirated, and the cells were permeabilized with 40 µl PBS containing 0.5% (v/v) Tween 20 for 1 h at room temperature. The cells were then washed three times in 250 µl of PBS/0.05% (v/v) Tween 20 (PBST) using a BioTek EL406 plate washer. Twenty microliters were added per well of a mixture of 1:1000 dilution of ERα [Clone SP1 (epitope contained within a synthetic peptide derived from C-terminal of human estrogen receptor)] monoclonal rabbit antibody (#RM-9101-S, Thermo Scientific) and a 1:1000 dilution of PR [Clone PgR 636 (epitope contained within recombinant full-length PR-A and hence specific for both PR-A and PR-B isoforms)] monoclonal mouse antibody (#M3569; Dako, Carpinteria, CA USA) in PBST/3% (w/v) bovine serum albumin (BSA), and the plates were incubated overnight at 4 °C. The cells were washed three times in 250 µl of PBST and then incubated with 20 µl per well of a 1:500 dilution of goat antirabbit IgG Alexa Fluor 594 (Molecular Probes, Life Technologies, Paisley, UK), a 1:500 dilution of goat antimouse Alexa Fluor 488 antibody (Molecular Probes), and a 1:5000 dilution of Hoechst (Molecular Probes) in PBST/3% (w/v) BSA for 1 h at room temperature. The cells were washed three times in 250 µl of PBST, 40 µl of PBS was then added per well, and the plates were covered with a black plate seal. Cell images were acquired using a Cellomics Arrayscan VTI HCS reader (Thermo Scientific) using a 10 × 0.3 NA objective and applying the filters BGFR_386_23 and BGFR_549_15 to detect Hoechst and Alexa Fluor 594 signals. Using the Compartmental Analysis v4 bio-application, nuclear masks were generated from the Hoechst stained nuclei in channel 1, and a suitable threshold was applied in channel 2 to quantify ERα within the nuclear masks. The mean total intensity was normalized for cell number, giving the total intensity of ERα staining per cell. To determine the PR-associated signal, the plates were measured using an Acumen Explorer eX3 microplate cytometer (TTP LabTech, Melbourn, UK). Following excitation at 405 nm and 488 nm, cell object fluorescence and PR-associated fluorescence were detected at the two emission wavelength ranges of 420–500 and 500–530, respectively. The data were normalized for cell number by calculating a ratio of cell objects to fluorescence intensity.
ERα Functional Antagonism Cell Assay
The assay conditions were carried out as detailed in the multiplexed cell assay using the MCF-7 cell line except that, prior to compound dispensing, the cells in all wells excluding the minimum-signal control wells were pretreated with 0.1 nM estradiol for 30 min. DMSO was dispensed onto the minimum-signal control wells to give a final concentration of 0.3%. In this assay, immunostaining was carried out solely for the detection of PR and was measured using the Acumen Explorer eX3 microplate cytometer. The PR levels were quantified and normalized as detailed for the multiplexed assay.
Measurement of Endogenous Cellular ERα in the Presence of Tamoxifen or Cycloheximide
This mechanism-of-action assay in the MCF-7 cell line comprised three treatments in parallel and was carried out as detailed in the multiplexed cell assay except that, prior to compound dispensing, the cells were pretreated with 250 nM tamoxifen, or 25 µg/ml cycloheximide, or 0.1% (v/v) DMSO for 1 h. After compound dispensing, the plates were incubated for 5 h before fixing with formaldehyde and immunostaining for ERα only as described for the multiplexed assay. Total ERα was measured using a Cellomics Arrayscan VTI HCS reader as described for the multiplexed assay.
Proliferation Assay
The MCF-7 cell line was revived directly from a cryovial in phenol red–free RPMI 1640 medium supplemented with 5% (v/v) charcoal/dextran-treated FCS, 2 mM L-glutamine, and 1% (v/v) 100× MEM nonessential amino acids. Cells were seeded into black, transparent-bottomed 384-well plates at 500 cells per well in a volume of 40 µl using a Multidrop Combi dispenser. Cell plates were incubated overnight at 37 °C, 5% CO2 . One cell plate was designated the Day 0 plate and had 5 µl per well of 2 µM SYTOX green nucleic acid stain (Molecular Probes) added, followed by 10 µl per well of 0.25% (v/v) saponin. This plate was then sealed with a black plate seal and incubated at room temperature for a further 18–24 h. The cell count was detected on the Acumen Explorer eX3 microplate cytometer. Following excitation at 488 nm, cell object fluorescence was detected at the emission wavelength range of 500–530 nm. For the remaining plates, an Echo 555 acoustic dispenser was used for the dispensing of test compounds, producing a 12-point duplicate half-log concentration range (30 µM to 30 pM). In addition, DMSO was dispensed into the reference maximum-signal control wells to give a final concentration of 0.3% (v/v), and fulvestrant was dispensed into the reference minimum-signal control wells to give a final concentration of 100 nM. Cell plates were incubated for a further 7 days at 37 °C, 5% CO2, then stained, and the cell count was measured as described for the Day 0 plate.
Test Compounds
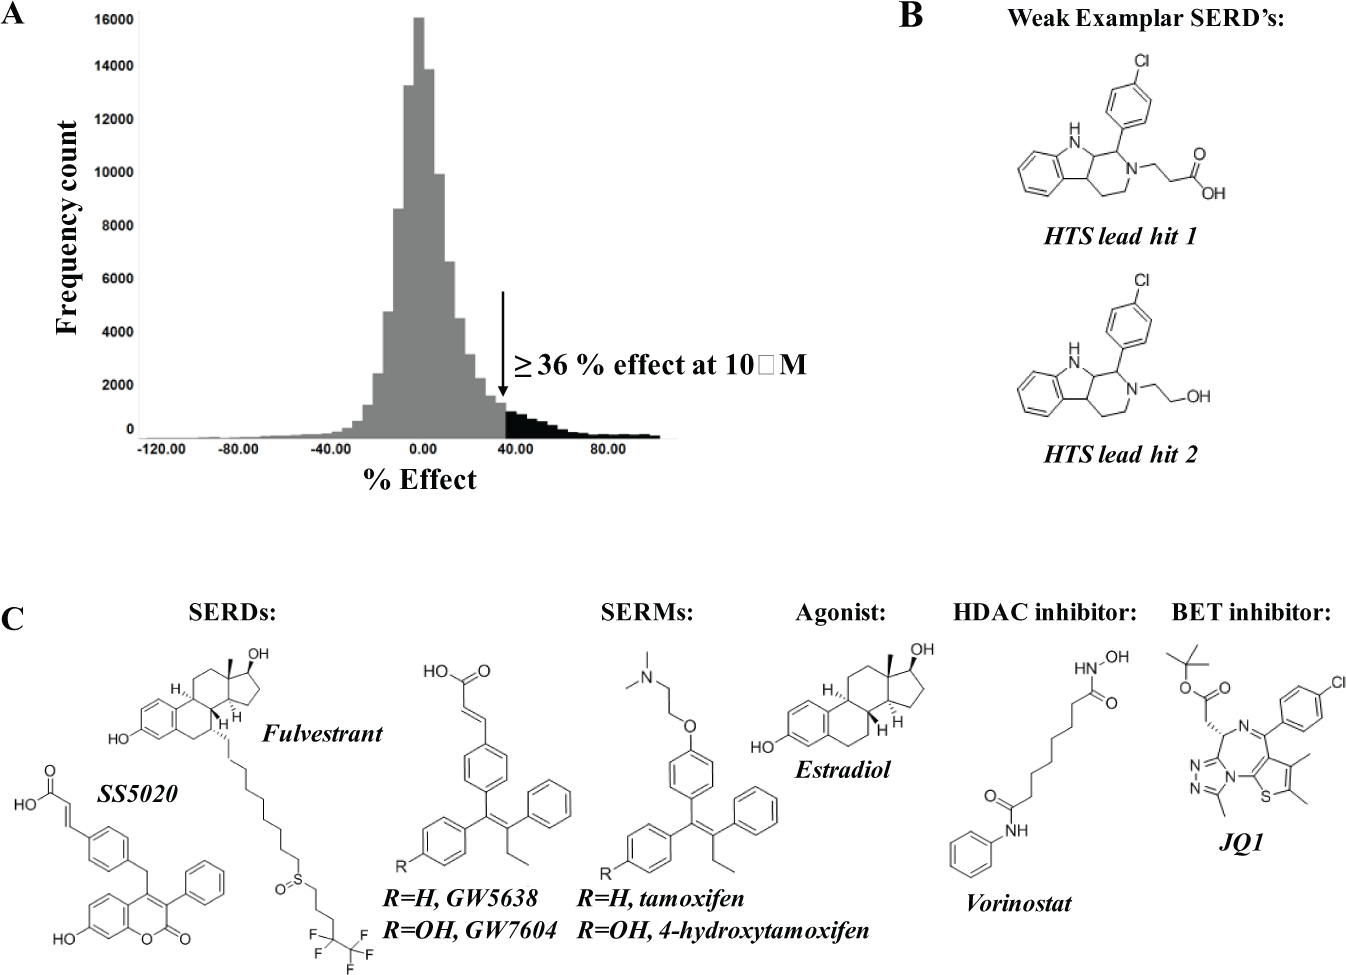
The following literature compounds were used to validate and exemplify the assays; fulvestrant, tamoxifen, 4-hydroxytamoxifen, GW5638, 16 GW7604, SS5020, 17 vorinostat (HDAC inhibitor), and JQ1 (BET inhibitor). 27 The chemical structures are illustrated in Figure 2C . The literature compounds and other test compounds described were all synthesized internally for AstraZeneca, and compounds used in the assay cascade were supplied ready for use by the AstraZeneca Compound Management Group.
Data Analysis
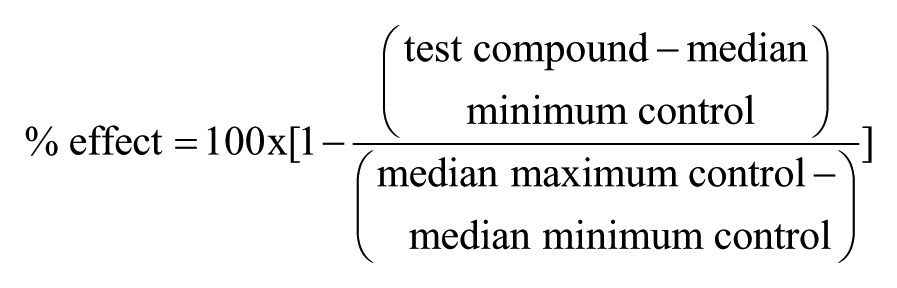
From the HTS data, the percentage effect for each compound was calculated based on the control data for each batch.
During the routine running of the biochemical and cellular cascade, experimental data from each of the assays were exported into Origin 7.5 client graphing software (OriginLab, Northampton, MA) to perform curve-fitting analysis.
For the representative curves exemplified in the figures, the data were plotted using Prism software (GraphPad Prism 6 Software, La Jolla, CA). A nonlinear regression curve fit using four parameters with variable slopes was applied.
IC50 values were determined by calculation of the concentration of test compound that was required to give a 50% reduction of the total measured effect corrected for background (average maximum-control value minus the average minimum-control value). EC50 values were determined by calculation of the concentration of compound that was required to give a 50% increase of the total measured effect corrected for background (average maximum-control value minus the average minimum-control value).
Cell proliferation data were normalized to the average Day 0 control value, and the IC50 values were determined by calculation of the concentration of test compound that was required to give a 50% reduction of the total signal.
The quality of each assay (except the proliferation assay) was determined by analysis of the Z’ factor. 28
Results and Discussion
A schematic summary of the screening cascade is illustrated in Figure 1 , which provides an overview of how compounds have been profiled. The HTS output was worked up by selecting ERα binders with an IC50 < 30 µM, ligand–lipophilicity efficiency (LLE) 29 > 3, plus near neighbors of binders. Approximately 2000 compounds were then profiled in the cascade assays. Fifteen confirmed downregulator series were identified, including agonist and nonagonist examples. Prioritized series were then optimized further using the cascade assays to iteratively feedback on and build an understanding of compound structure–activity relationships (SARs) and to enable new chemical designs. Biochemical and cellular selectivity assays for other nuclear hormone receptors were not part of the routine cascade, but were used periodically to confirm that lead compounds were selective for ERα. This comprehensive cascade continued to be run throughout the lead identification and lead optimization phases of the project, for even when working on a confirmed ERα downregulator series, subtle changes in chemical structure could lead to unpredicted reversion to an agonist or antagonist profile.
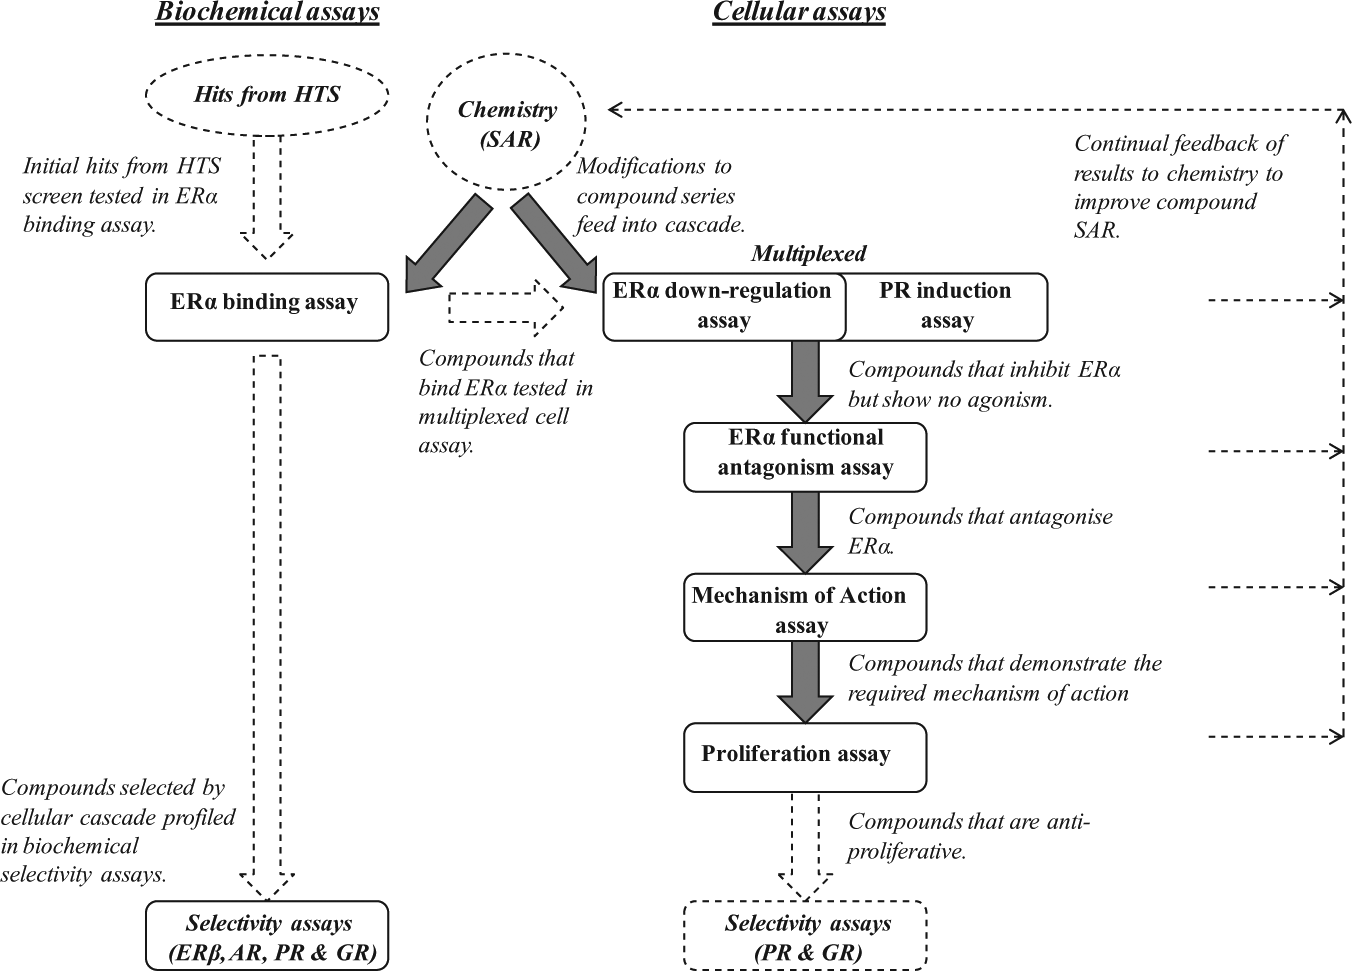
A schematic summary to illustrate the screening cascade. Initial hits from a high-throughput screening (HTS) were confirmed in a biochemical binding assay. Compounds that bind estrogen receptor α (ERα) were initially profiled in the multiplexed cellular assay. Compounds that appeared to have the desired profile were tested in additional cellular assays to determine the mechanism of action. Subsequent analysis of all generated compound data fed back through chemistry structure–activity relationships (SARs) to help new chemical designs. Compounds that progressed through the cascade were subsequently tested in cellular and biochemical selectivity assays to confirm selectivity for ERα over other nuclear hormone receptors [ERβ (estrogen receptor beta), AR (androgen receptor), PR (progesterone receptor), and GR (glucorticoid receptor)].
High-Throughput Compound Library Screening
To identify novel, drug-like ER binding cores, a directed HTS set was generated. A computational approach was used that focused on covering a drug-like productive subspace with lower-complexity compounds. The approach has two main tenets: first, choosing a set of lower-complexity compounds with metrics such as number of heavy atoms and number of rotatable bonds; and, second, using a limited number of compounds to represent each point in chemical space by, for example, chemical clustering.
Application of this approach produced a subset of approximately 100,000 compounds from the AstraZeneca collection. This subset of lower-complexity compounds was chosen to represent four different categories of molecule: 7.5% phenol-containing compounds, 7.5% compounds with phenol isosteres, 46% with generalized ER pharmacophores, and 39% covering chemotypes not represented by the preceding categories. A hit rate of 4.2% was obtained when the resulting set of nonphenol compounds was evaluated at a concentration of 10 µM in a directed HTS that measured affinity for the human ERα ligand-binding domain by TR-FRET. It is notable that a significantly higher hit rate of 19.2% was obtained with the phenol compounds. Despite the high hit rate, for the phenol compounds, the nonphenolic compounds proved to be the more promising start for identifying drug-like compounds that possess low clearance and high oral bioavailability.
Figure 2A shows a histogram of the HTS results, showing a distribution of the data around 0% effect of the maximum control. Using a statistically derived cutoff, compounds that demonstrated ≥36% effect at 10 µM were determined as active in the screen. Five thousand seven hundred compounds were designated as active, which is represented by the tail on the histogram distribution. The average Z’ factor among all HTS batches was >0.6, which highlights the consistent performance of the assay during the HTS campaign. The active compounds were then screened in a concentration response assay to determine IC50 values for each compound. In total, 146 compound plates were run, and 3992 compounds were confirmed as active with an IC50 of less than 100 µM (81% confirmation rate). The control and Z’ data per plate produced consistent data with an average Z’ factor of >0.7.
High-throughput screening (HTS) estrogen receptor α (ERα) binding assay. (
Figure 2B illustrates the structure of two lead HTS hits (tricyclic indoles) from which the novel SERDs described were derived. Figure 2C illustrates the structures of the literature compounds used to exemplify the cascade assays.
ERα Biochemical Binding Assay
After analysis of the HTS campaign output, medicinal chemists began the design of new chemical types that were initially tested in the ERα biochemical binding assay. This is the same LanthaScreen assay as used in the HTS, and it served as the first step in the regular screening cascade. Initially, it was used to confirm ERα binding and gain IC50 data for the new chemical designs; however, as the project chemistry progressed and knowledge of SARs increased, newly synthesized compounds were often tested in parallel in both binding and cellular assays.
Cellular Cascade Assays
For the cellular assay cascade, it was preferable to build a cascade using an endogenous cell line rather than a reporter endpoint. Previous experiments using the ERα PathHunter assay had shown a considerable decrease in sensitivity in the detection of agonist activity when compared to an endogenous cell assay system (data not shown). Furthermore, using an endogenous cell line for in vitro experiments ensured project consistency with in vivo models. The cellular assays in the cascade have all been designed using MCF-7 cells, which are known to express ERα and be estrogen responsive. 30
Multiplexed Cell Assay to Measure ERα Downregulation and PR Induction
This multiplexed assay identified compounds that exhibit downregulation or inhibition of ERα without causing concurrent agonism of ERα signaling as measured by progesterone receptor (PR) induction. The assay has been developed using the SP1 ERα antibody and the PR clone 636 PR antibody, which are well established as specific antibodies for ERα and PR detection, respectively. Furthermore, using species-specific secondary antibodies with a novel fluorophore combination has enabled this multiplexed approach.
Measuring ERα Downregulation
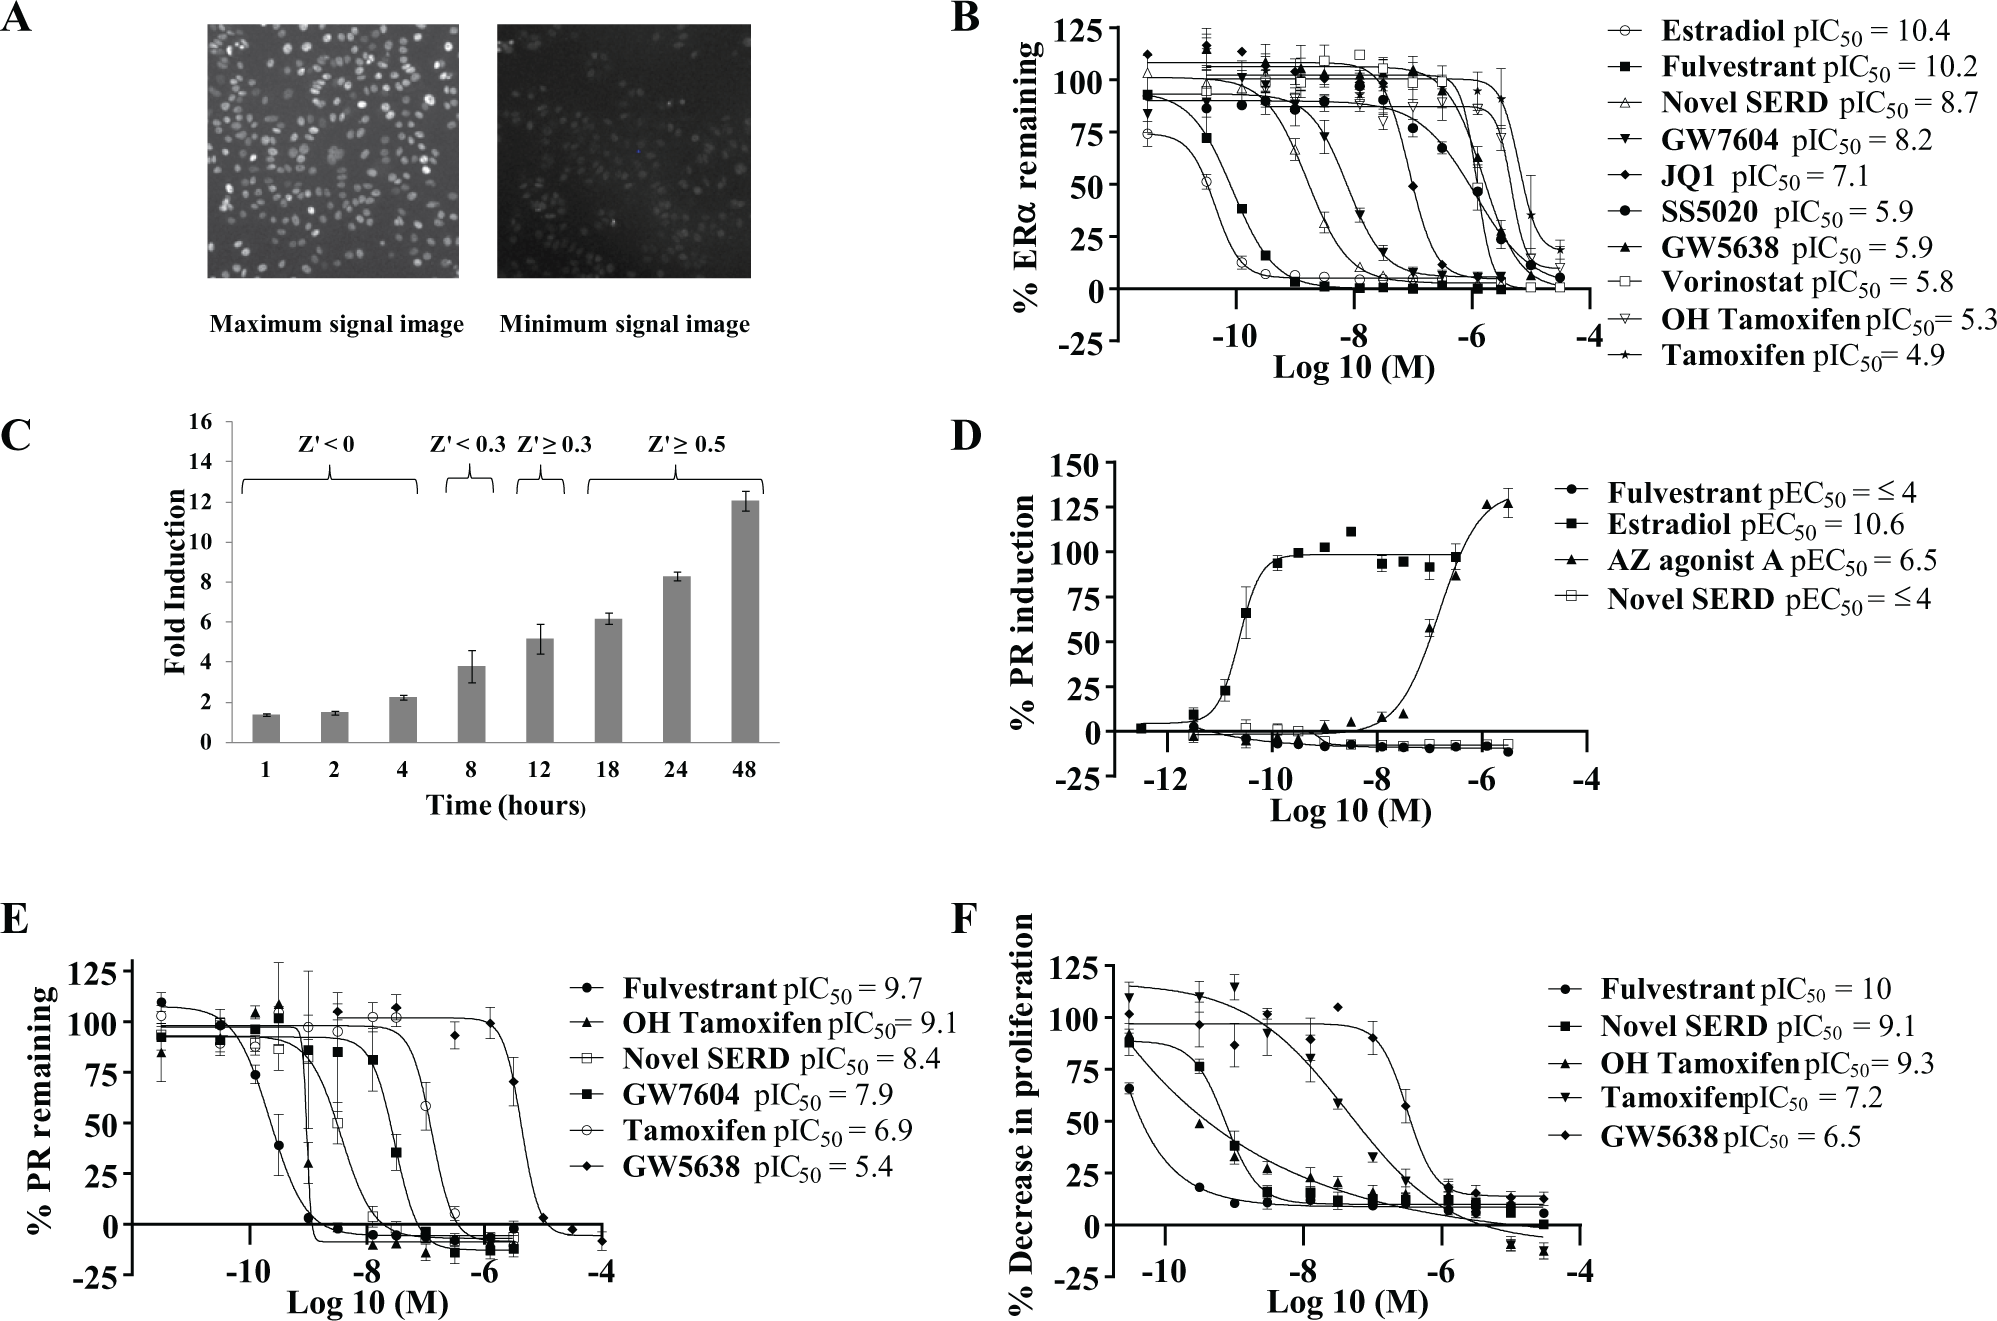
The ERα downregulation component of this multiplexed assay is the principal measurement in the cellular cascade and produces high-quality data, achieving an average assay Z’ of 0.5–0.8 and repeat IC50 testing within twofold. Compounds demonstrating a >50% reduction in ERα in this assay were scrutinized for SARs and investigated further, whereas inactive compounds were disregarded from the assay cascade at this point. Figure 3A illustrates example cell images from maximum- (0.3% DMSO) and minimum-control (100 nM fulvestrant) wells after immunostaining for ERα. Bright nuclear staining is seen in the maximum-control wells, and, in contrast, the minimum-control wells have virtually no visible staining for ERα. Figure 3B compares concentration response plots of different classes of ERα inhibitors in the ERα downregulation assay and illustrates how different compounds can be ranked by potency to assist with SARs. Fulvestrant is a potent ERα downregulator with an average IC50 value of 64 pM and has a similar ERα downregulation profile to the natural ligand estradiol, which has an average IC50 value of 39 pM. An example novel SERD compound discovered during the screening process is also quite potent with an average IC50 value of 2.1 nM. GW7604 and 4-hydroxytamoxifen with average IC50 values of 6.8 nM and 4.9 µM, respectively, illustrate that the addition of the phenolic hydroxyl group increases potency as compared to the GW5638 and tamoxifen parent molecules, which have less potent average IC50 values of 1.3 µM and 13.7 µM, respectively. Tamoxifen is a known pure ER antagonist, and although classified as a SERM, it did appear to reduce ERα levels at high concentrations, whereas GW5638 is known to have a mixed downregulator and antagonist profile and has been found to affect ERα levels by a different mechanism from that of fulvestrant. 31 The HDAC inhibitor vorinostat gave an average IC50 of 1.5 µM; ERα expression and signaling activity are positively and negatively regulated by transcriptional regulators such as HDACs, which are known to be negative ER regulators. 32 HDAC inhibitors interfere with HDAC, which suppresses ligand sensitivity and the transcriptional activation of ERα. 24 Therefore, HDAC inhibitors indirectly inhibit the ERα by promoting ubiquitin proteosomal degradation, which is independent of ligand occupancy of ERα. The BET family antagonist JQ1 gave an average IC50 of 85 nM. Inhibition of the BET family member BRD4 binding to chromatin by JQ1, modifies the regulation of target gene transcription, including ERα. The comparable activity of vorinostat and JQ1 to direct inhibitors of ERα illustrates that such off-target effects exhibited by test compounds cannot be discriminated in this assay. A different approach was required to eliminate compounds with off-target effects, which will be discussed later in this article.
Cellular cascade assays. (
Measuring PR Induction as an Indicator of ERα Agonism
The other component in this multiplexed assay determines ERα agonism by measuring an increase of the PR levels. The PR is one of many genes that can be regulated by ligand-activated ERα and is widely used as a biomarker of activation of a functional ER-signaling pathway.33,34 Figure 3C illustrates a time course of PR induction following stimulation of ERα in MCF-7 cells with 10 nM estradiol at time points from 1 to 48 h. We found that sensitive detection of PR activity in MCF-7 cells requires at least 18 h of treatment with the ERα ligand estradiol. The PR levels are barely detectable for as long as 8 h, so it would not be suitable for a screening assay format. At 18–24 h, there is a greater than fivefold increase in the measured levels of PR higher than the minimum background signal and an average Z’ value of ≥0.5 was achieved, which is acceptable for robust screening. Therefore, a 24 h endpoint was chosen for this multiplexed assay to ensure agonism could be easily detected alongside ERα downregulation. Figure 3D illustrates some example compound responses from the assay, estradiol, and the AZ agonist compound A are potent agonists of ERα. By contrast, fulvestrant and the novel SERD have no agonist activity, indicating that the assay format is sensitive in detecting ERα agonism by using PR as a biomarker of functional ER signaling.
ERα Functional Antagonism Assay
The ERα downregulation assay measures ERα in an artificial cell environment devoid of the natural ligand, estradiol. Furthermore, the growth medium contains considerably reduced levels of steroids and growth factors due to the use of charcoal-stripped serum. We needed to verify that compounds were able to antagonize ERα-mediated signaling in the presence of estradiol. Therefore, an assay was developed using the PR as a downstream biomarker of a functional ERα signaling pathway. MCF-7 cells were prestimulated with 0.1 nM estradiol, a level predetermined by dose response to be the approximate EC80. The EC80 value was chosen as a competing concentration of estradiol that would not oversaturate the ERα and enable antagonist compounds to compete with estradiol to bind the ERα. Figure 3E illustrates five literature compounds of different structures and clinical profiles plus a novel SERD, which are all ERα antagonists. Fulvestrant was the most potent with an average IC50 of 210 pM, followed by 4-hydroxytamoxifen, the novel SERD example, GW7604, tamoxifen, and GW5638, which had average IC50s of 799 pM, 3.7 nM, 12 nM, 130 nM, and 4 µM, respectively. By comparing the antagonist IC50 data with the ERα downregulation assay IC50 data, some insight into the compound mechanism of action can potentially be deduced. For example, a pure antagonist such as tamoxifen does not degrade ERα except at higher concentrations and is more active in the antagonist assay than in the downregulation assay, whereas ERα downregulators that degrade the ERα such as fulvestrant and GW5638 are more potent in the downregulation assay than in the antagonism assay. However, it is important to note that off-target inhibitors such as vorinostat also appear potent in the antagonist assay, although they do not directly antagonize estradiol binding to the receptor.
Determining the Mechanism of Action
Multiple mechanisms of ERα downregulation or inhibition exist by both direct and indirect interactions with the ERα agonists, and indirect effectors of ERα signaling are an undesired profile for our program and need to be identified in the screening process. To enable a thorough scrutiny of the compound mechanism of action, two concepts have been designed into one assay. First is competition for the ERα binding site using tamoxifen (a competitive antagonist for the ERα binding site that stabilizes and does not downregulate the ERα at the concentration chosen). A decrease in ERα downregulation potency in the presence of tamoxifen will indicate that the observed downregulation is directly linked to compound engaging the target in cells. Second is the addition of cycloheximide to inhibit protein synthesis, because SERDs such as fulvestrant will act on preformed ERα and are not affected by inhibition of protein synthesis. It has been reported that protein synthesis is essential for agonist-induced ERα downregulation, and an abrogation in downregulation potency in the presence of cycloheximide may indicate that compounds possess this undesirable property. 22 Finally, a shorter endpoint of 5 h was chosen for this assay to limit any slight reduction of ERα and the toxic effects on cell processes caused by cycloheximide; in addition, any off-target effects mediated via transcriptional mechanisms should become apparent at a shorter endpoint. A SERD such as GW7604 or fulvestrant 31 and the HSP90 inhibitor geldanamycin 21 will induce rapid downregulation of ERα levels in <4 h, whereas our time course studies indicate that indirect downregulation methods via pathway inhibition or transcriptional mechanisms take longer. Hence, we have found the 5 h time point optimal for the mechanism-of-action cell assays and that tamoxifen competition can be determined easily as a shift in potency with SERD compounds at this time point. To determine the mechanism of action, we measured ERα downregulation in MCF-7 cells after three separate pretreatments run in parallel [DMSO (control), tamoxifen, and cycloheximide], followed by test compound addition. The curves from the three treatments were compared for each compound and overlaid to visualize any shifts in potency. The DMSO pretreatment acts as the control in this assay by generating a 5 h time point of ERα inhibition to which the results from the other pretreatments can be directly compared. Figure 4B illustrates that an on-target SERD such as fulvestrant will be as potent at this shorter time point as at the 24 h time point. An off-target inhibitor such as JQ1 and other off-target inhibitors may be completely inactive or considerably less potent at 5 h than at 24 h. An on-target SERD such as fulvestrant and the novel SERD example compound will compete with tamoxifen for ERα binding, causing a shift to reduced potency; shifts over 1 log unit compared to the DMSO control are seen with such potent downregulators. Conversely, no significant shift in test compound potency indicates that a compound is not competing with tamoxifen for the ERα binding site and therefore could be off-target by acting on the ERα via an indirect mechanism. In the presence of cycloheximide, on-target SERD compounds such as fulvestrant and the novel SERD example compound give dose–response curves equivalent to the DMSO control dose–response curves because they are acting directly on preformed ERα and are unaffected by the loss of protein synthesis. Figure 4 illustrates the comparison of compound profiles between the multiplexed assay ( Fig. 4A ) and the mechanism-of-action assay ( Fig. 4B ), and how this assists in determining the mechanism of action of each compound. The four compounds shown all inhibit the ERα at 24 h as determined by the downregulation component of the multiplexed cell assay. However, the assessment of ERα agonism using PR measurement as a biomarker detects that the AZ agonist compound B has induced agonism in ERα, as shown by the increase in PR, whereas no agonism is detected with fulvestrant, the novel SERD compound example, or the JQ1 inhibitor. When the data from the multiplexed assay are compared with the mechanism-of-action assay output, fulvestrant, the novel SERD compound example, and AZ agonist compound B show almost equivalent potency for ERα downregulation at the shorter 5 h time point compared to the 24 h time point, as would be expected for potent SERDs and agonists. For less potent SERDS, a modest 2–3-fold shift in potency is seen at 5 h compared to 24 h. In contrast, the JQ1 inhibitor is not active at the shorter 5 h time point, confirming this compound as off-target. In the presence of 250 nM tamoxifen, fulvestrant and the novel SERD compound example show a log shift to reduced potency. These compounds bind the ERα and so will compete with tamoxifen for the binding site. The AZ agonist compound B shows a slightly reduced shift in potency in the presence of tamoxifen, indicating competition for binding to the same steroid binding site and antagonism of AZ agonist B activity. However, in the presence of cycloheximide, the downregulation potency is also abrogated, indicating a link to protein synthesis as previously reported. 22 We have observed similar curve profiles with other agonist compounds.
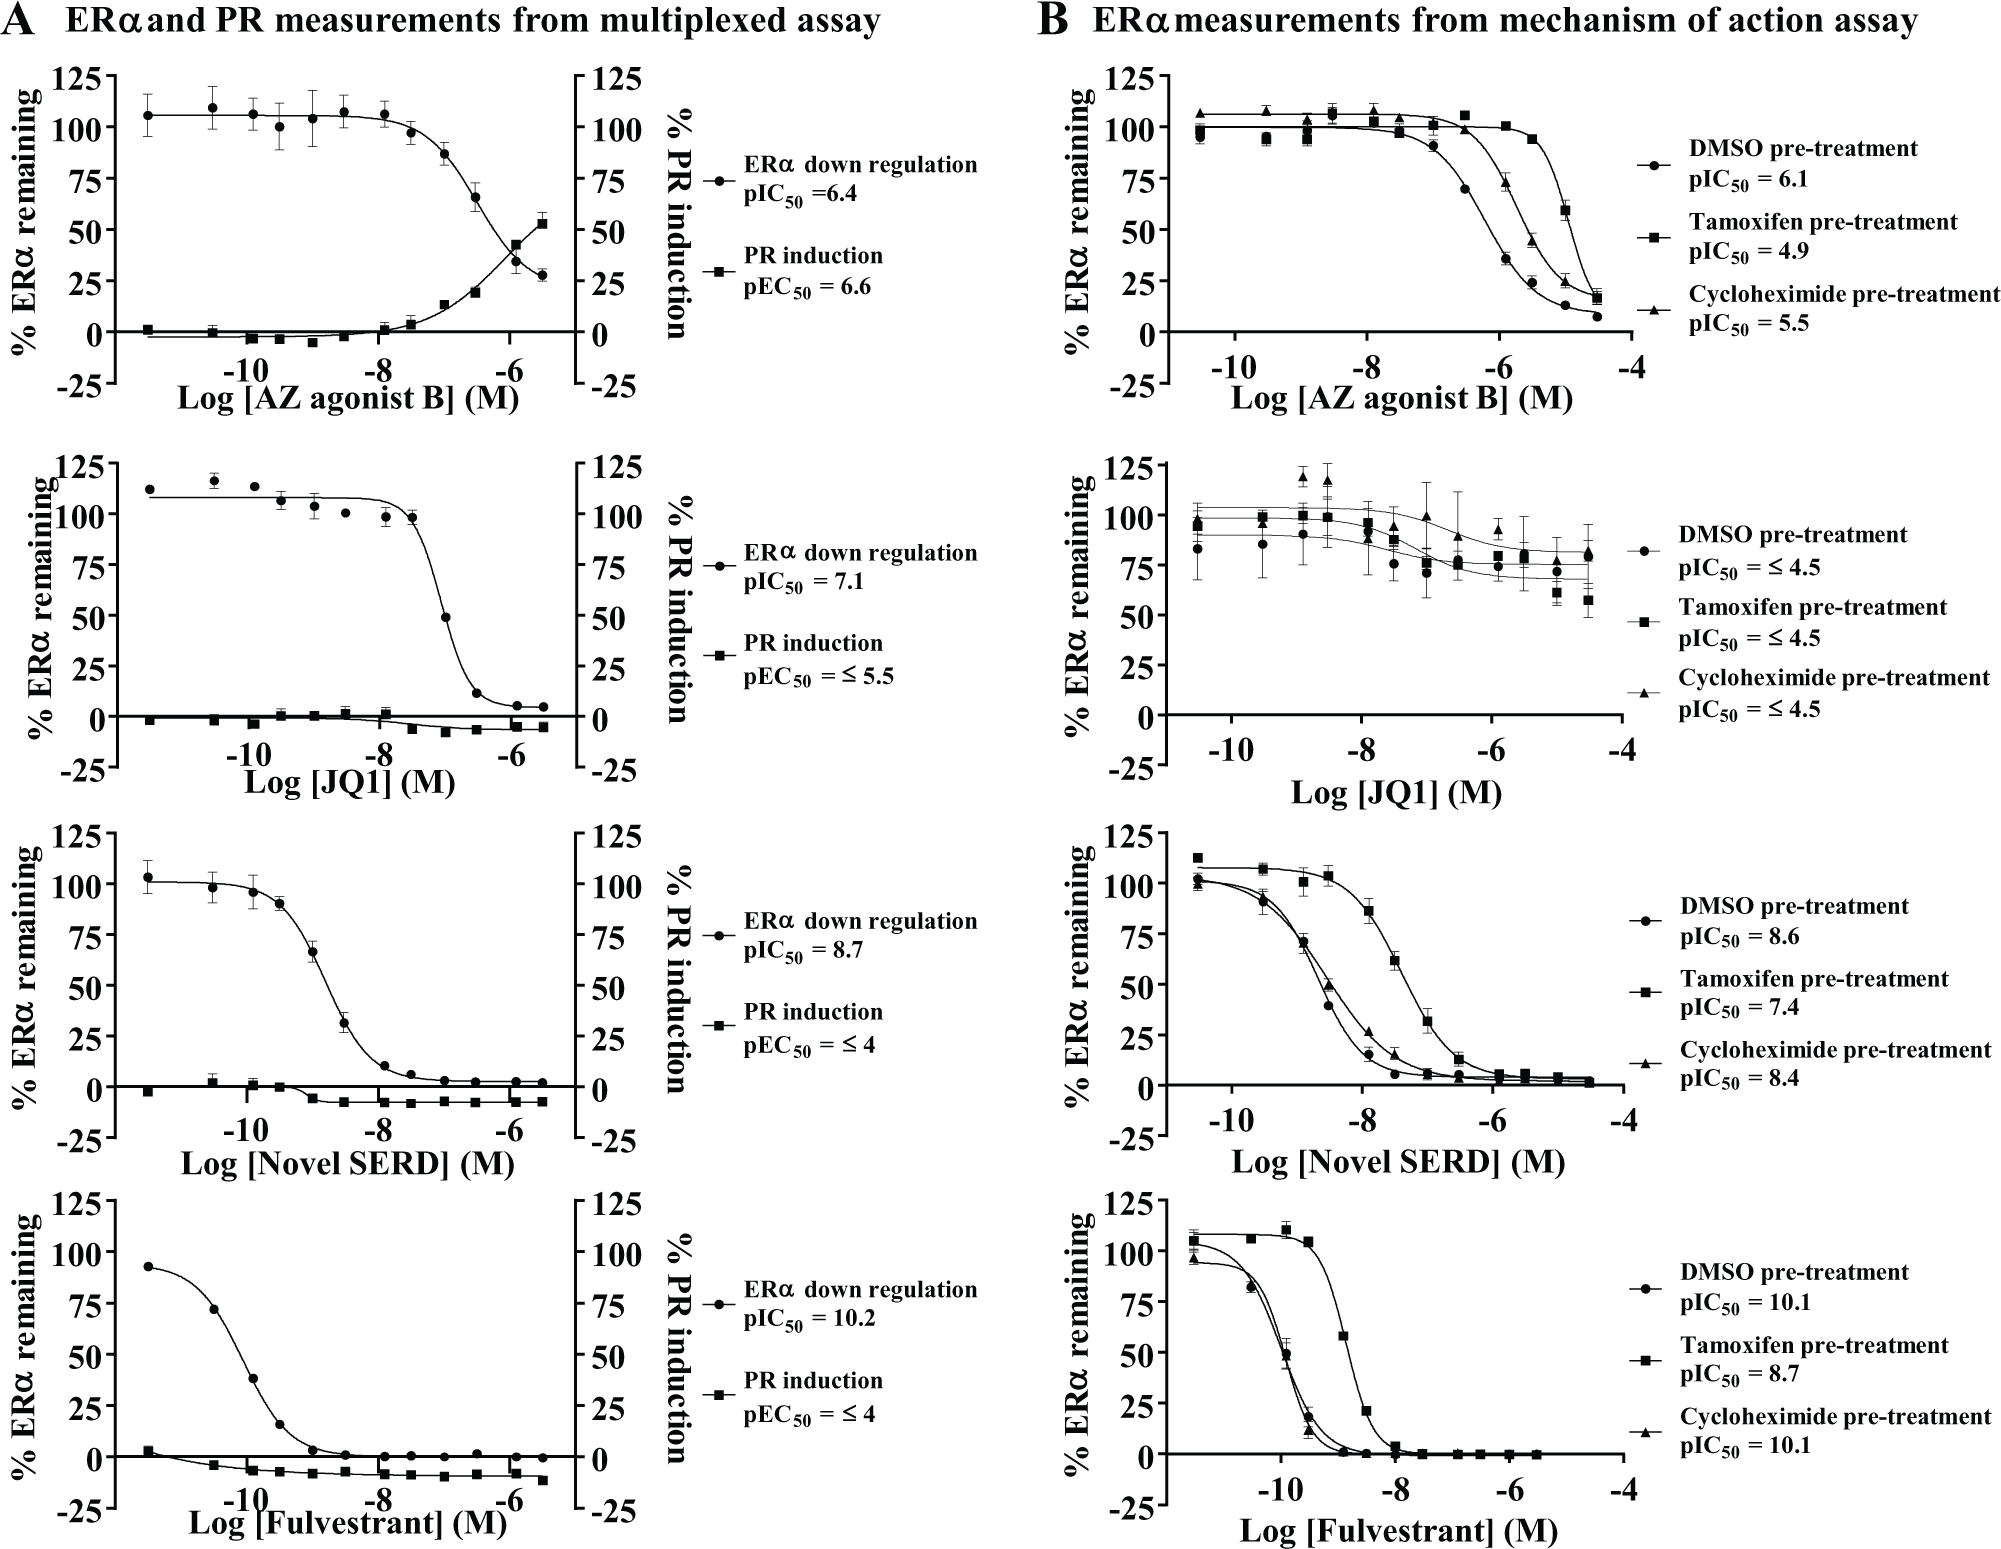
Comparison of compound profiles. (
Effect of Inhibitors on Cell Proliferation
Compounds that appear to have the desired SERD profile or are interesting for SAR purposes were next tested in a cellular proliferation assay to demonstrate whether downregulation of cellular ERα levels will cause inhibition of cell proliferation. The cellular proliferation assay uses MCF-7 cells incubated with test compounds for 7 days. The selected seeding density allows the untreated cells to reach a confluence of approximately 80% prior to the final cell number measurement. An IC50 value was calculated for each test compound to determine antiproliferative effects, and compounds causing a significant reduction in cell growth have the desired profile to ascertain DMPK properties prior to testing in in vivo models. Figure 3F illustrates concentration–response curves for some literature and AZ compounds in the proliferation assay. Fulvestrant, the novel SERD compound example, and 4-hydroxytamoxifen are all potent inhibitors of MCF-7 cell proliferation; GW5638 and tamoxifen also show antiproliferative activity.
Assay Correlations
Figure 5 illustrates a number of correlation plots using selected compounds from the chemical series that have been investigated in the cellular cascade. The mean pIC50 results for the ERα downregulation assay have been correlated with (A) the ERα binding assay, (B) the ERα antagonism assay, and (C) the proliferation assay.
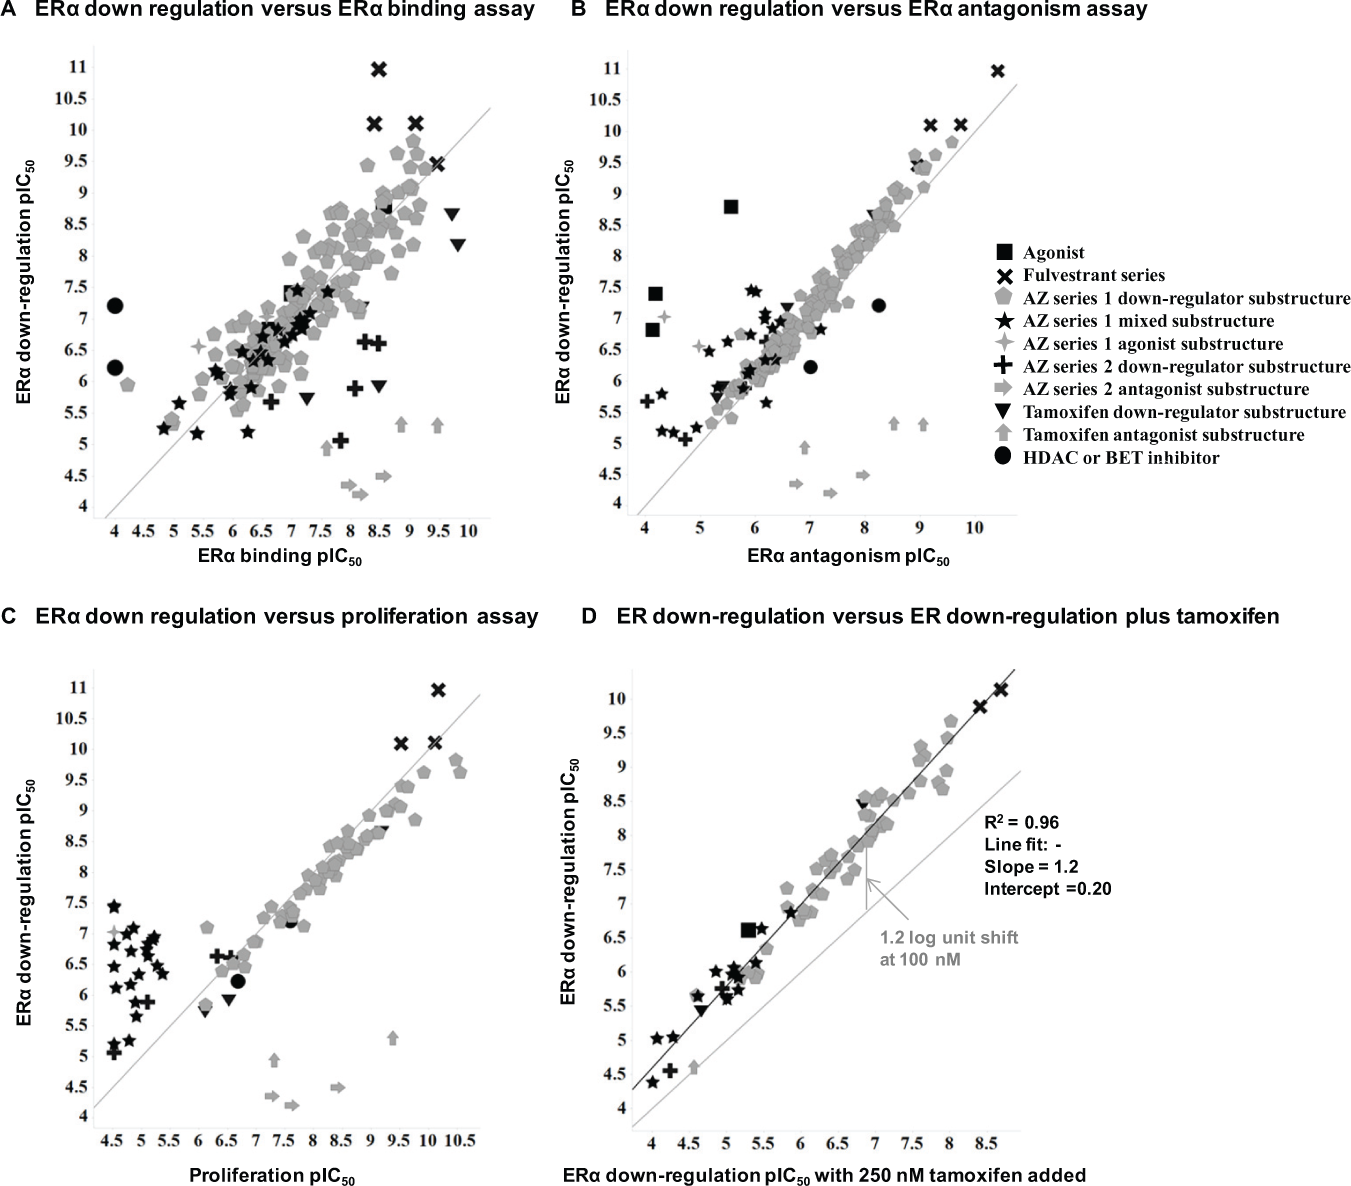
Correlation plots comparing estrogen receptor α (ERα) downregulation pIC50 data with (
The comparison of ERα binding to ERα downregulation in Figure 5A illustrates that compounds that modulate the ERα levels result in different phenotypic behaviors. It is notable that compounds that are true SERDs such as fulvestrant and ERα agonists are on the same binding downregulation line, and, hence, are indistinguishable without further assay inputs such as antagonism or proliferation. This behavior is broadly consistent regardless of the chemical series. There are some subtle indications that some series may be less efficient at downregulation than binding, such as AZ Series 2 and the tamoxifen series. Similar to downregulation, the agonist compounds are broadly consistent whether they are a traditional agonist or are agonist substructural moieties (AZ Series 1 agonists). The antagonist compounds are distinguished by lack of downregulation effect versus their binding affinity, as seen at the bottom right of Figure 5A (tamoxifen series antagonists and AZ Series 2 antagonist substructure). Compounds that do not bind ERα yet reduce the ERα levels, such as transcriptional regulators (BET or HDAC inhibitors), result in the expected behavior and are seen at the extreme left of the Figure 5A plot.
Figure 5B
One striking difference in the proliferation plot is the behavior of the mixed substructure compounds from AZ Series 1. As discussed previously, true SERDs have the ability to reduce basal PR agonist levels in our multiplexed assay. The mixed substructure compounds from AZ Series 1 reduce ERα levels, but show some small residual agonism and do not reduce PR agonist levels below basal levels. Thus, although these compounds reduce ERα levels, they do not show an antiproliferative phenotype, as shown in Figure 5C , and they have scattered antagonism values reflecting the subtle structural differences that favor either agonist or antagonist behavior.
Figure 5D illustrates the range in shift in potency from the tamoxifen competition arm of the mechanism-of-action assays. The results are tight and show the shift in IC50 when 250 nM tamoxifen competes at the ERα binding pocket. This assay provides a cellular assay readout indicating that reduced ERα levels result from the test compound binding at the ERα binding pocket and not via alternate mechanisms such as inhibition of expression.
Table 1 summarizes the results for the compounds we have described in the cascade of assays to enable the comparison of test compound activities and mechanisms. The HTS lead hits 1 and 2 are members of a tricyclic indole series that illustrated moderate potency in the core cascade assays. To our knowledge, this motif has not been described previously as an ERα binding ligand and as such represents a new structural chemotype for this receptor. The novel SERD also contains this tricylic indole motif plus other structural features that were identified through cycles of chemical design and testing to produce a more potent compound with the desired mechanism of action.
Summary of Compound Profiling Results (n ≥ 3 Unless Indicated Otherwise).
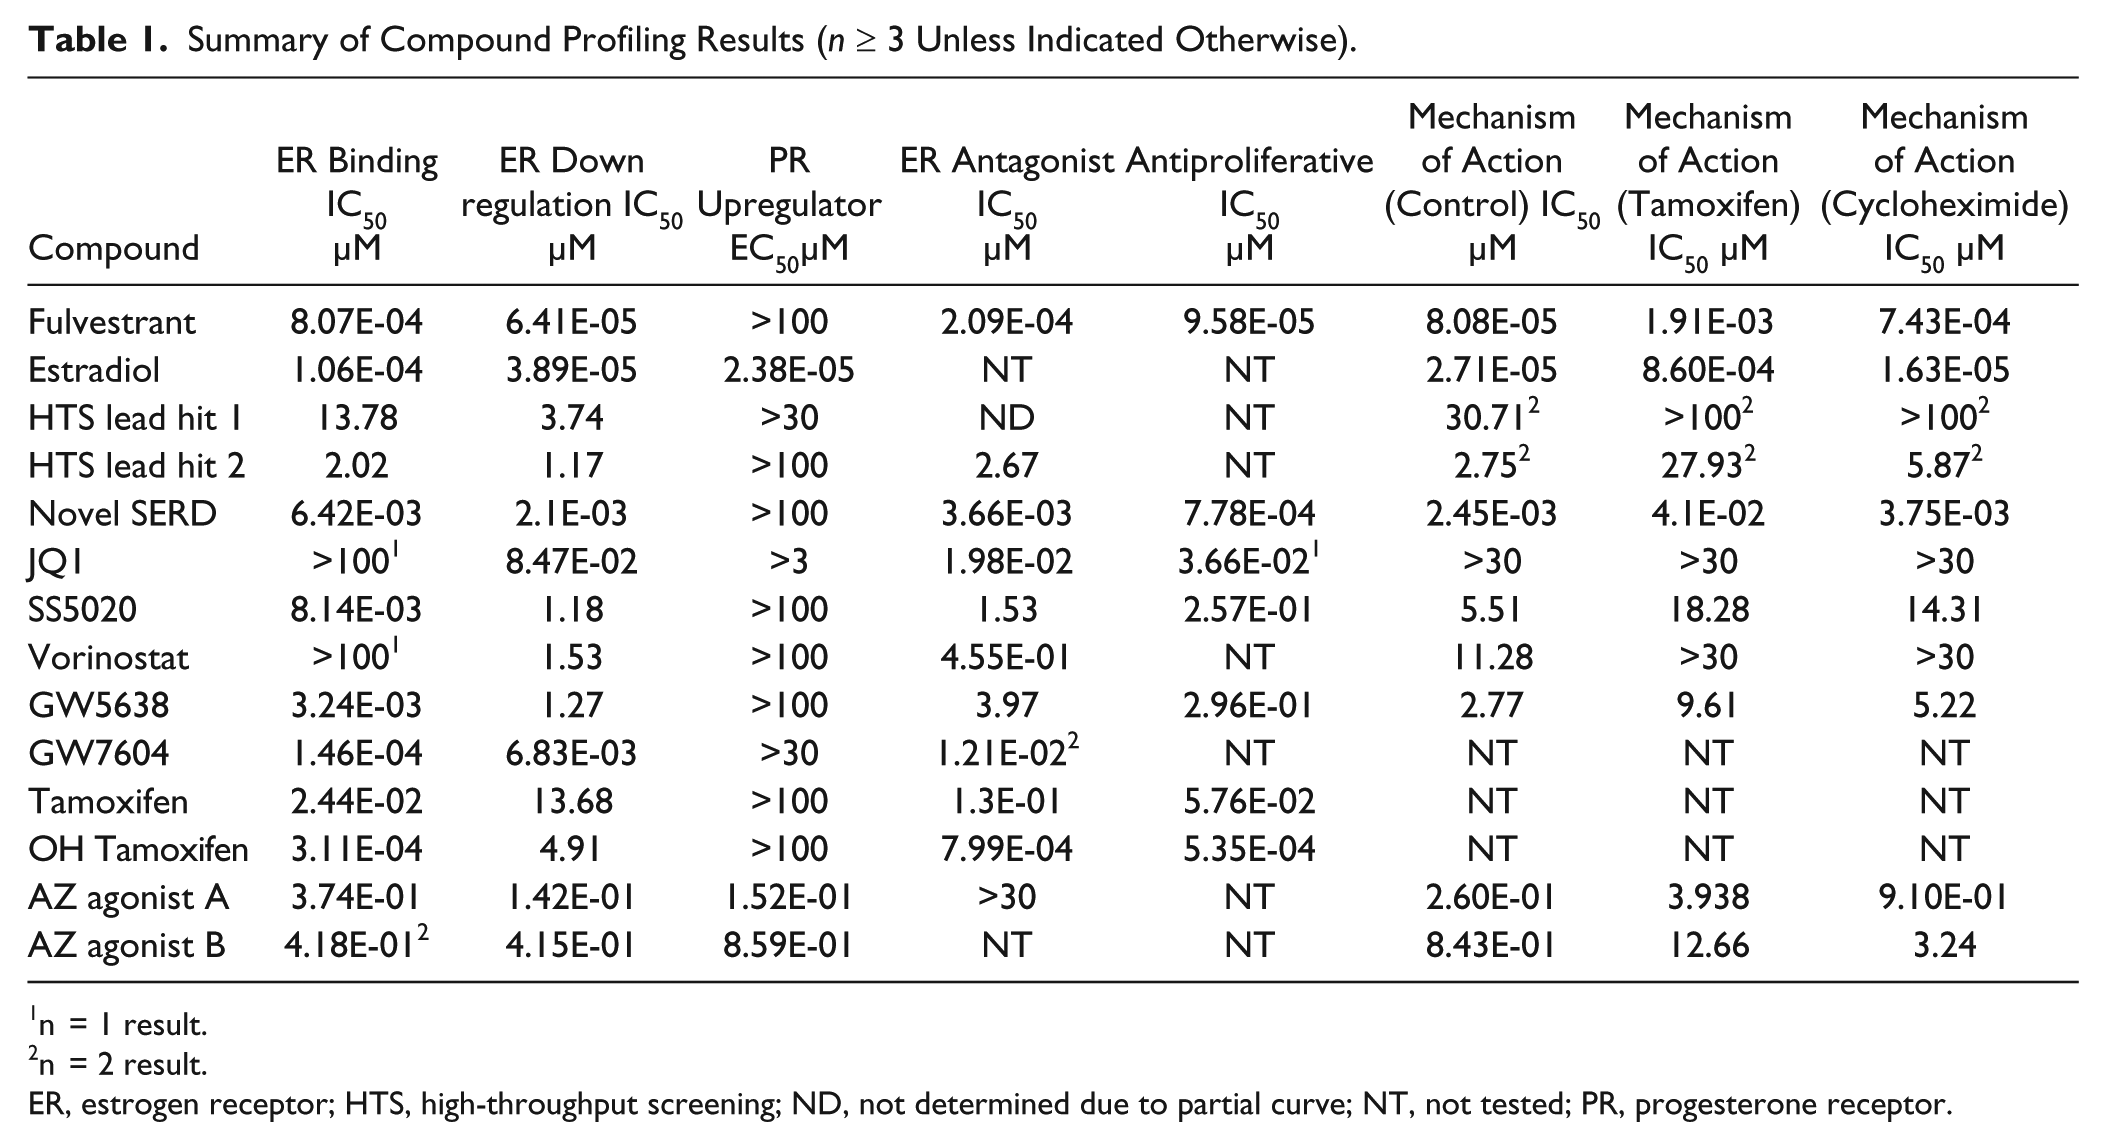
n = 1 result.
n = 2 result.
ER, estrogen receptor; HTS, high-throughput screening; ND, not determined due to partial curve; NT, not tested; PR, progesterone receptor.
In conclusion, we have described a comprehensive screening cascade of biochemical and cellular assays to support the design of a novel SERD with improved drug properties. Novel SERD compounds have been identified using this assay cascade, and an orally bioavailable lead SERD compound has demonstrated in vivo efficacy. This compound is progressing toward clinical evaluation and shows promise as a new oral SERD agent for the treatment of ER-positive breast cancer. The pharmacology and chemical optimization of this compound will be disclosed in forthcoming publications.
Footnotes
Acknowledgements
The authors thank Paula McArdle and Philip Hopcroft for technical assistance with image acquisition, AstraZeneca Compound Management and Global Cell Banking groups for compound and cell supply, Dr. Jamie Scott for assistance with chemical structures, and Dr. Michael J. Morton for support and advice in completing the manuscript.
Declaration of Conflicting Interests
The authors declared no potential conflicts of interest with respect to the research, authorship, and/or publication of this article.
Funding
The authors received no financial support for the research, authorship, and/or publication of this article.